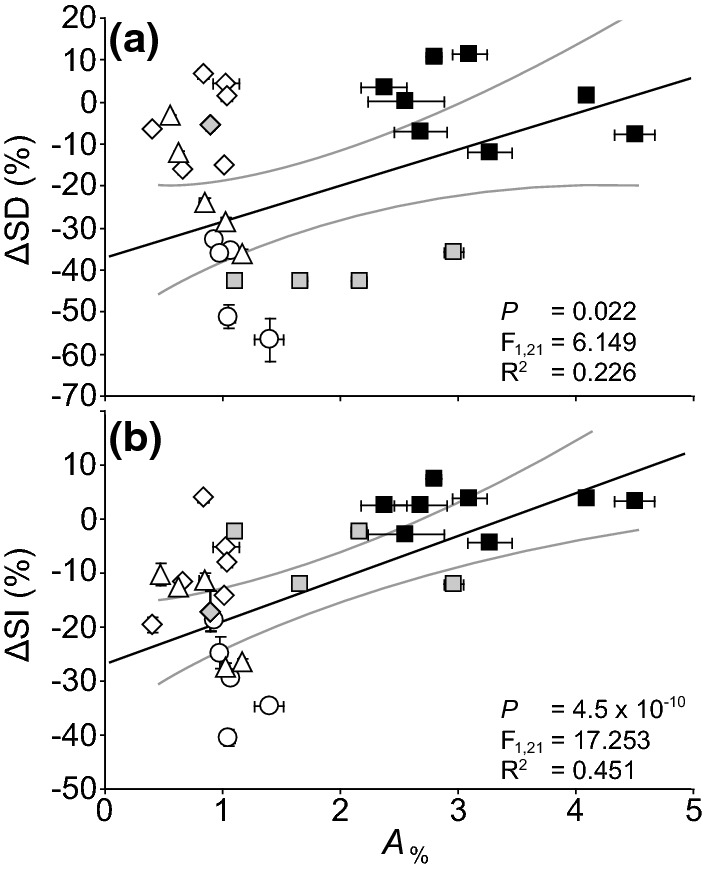
Fig. 8.

The relative change in a SD (∆SD) and b SI (∆SI) of an evolutionary range of plants in leaves developed in ambient (400 μmol mol−1) and extremely elevated (1500 or 2000 μmol mol−1) [CO2] in relation to the A% values of plants grown at ambient [CO2]. The figure shows the response of cycads (diamond symbol white fill); however, cycads were not included in the regression analysis as cycads do not alter stomatal initiation in response to [CO2]. Data indicates the results of linear regression analysis. Presented as in Fig. 2 (data from Haworth et al. 2011a, c, 2013, 2015)
