

Summary
Lipopolysaccharides (LPSs) cause lethal endotoxemia if not rapidly cleared from blood circulation. Liver sinusoidal endothelial cells (LSEC) systemically clear LPS by unknown mechanisms. We discovered that LPS clearance through LSEC involves endocytosis and lysosomal inactivation via Stabilin-1 and 2 (Stab1 and Stab2) but does not involve TLR4. Cytokine production was inversely related to clearance/endocytosis of LPS by LSEC. When exposed to LPS, Stabilin double knockout mice (Stab DK) and Stab1 KO, but not Stab2 KO, showed significantly enhanced systemic inflammatory cytokine production and early death compared with WT mice. Stab1 KO is not significantly different from Stab DK in circulatory LPS clearance, LPS uptake and endocytosis by LSEC, and cytokine production. These data indicate that (1) Stab1 receptor primarily facilitates the proactive clearance of LPS and limits TLR4-mediated inflammation and (2) TLR4 and Stab1 are functionally opposing LPS receptors. These findings suggest that endotoxemia can be controlled by optimizing LPS clearance by Stab1.
Subject areas: Biological sciences, Molecular biology, Immune response
Graphical abstract
Highlights
-
•
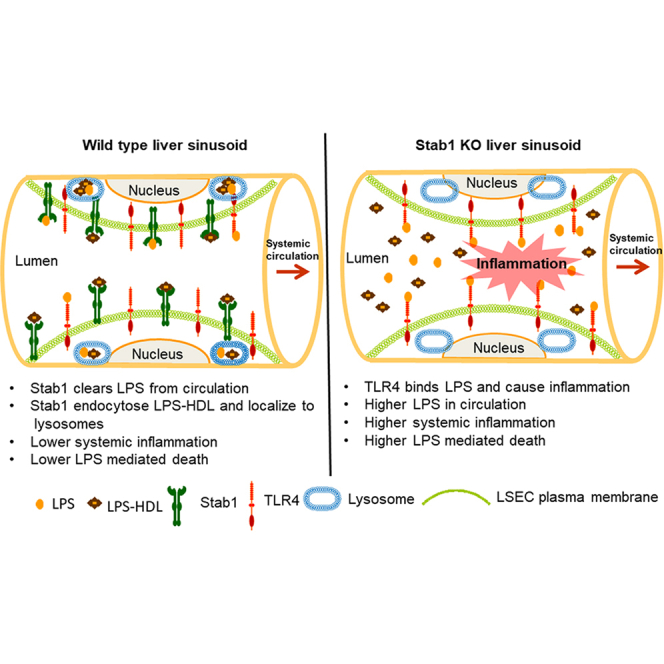
Stabilin receptors in LSEC clear LPS from blood circulation by endocytosis
-
•
Higher the clearance/endocytosis by Stabilin, lower the cytokine production
-
•
Stabilin and TLR4 are functionally opposing receptors for LPS immune response
-
•
Stabilin 1 is the major player compared with Stabilin 2 in clearing LPS
Biological sciences; Molecular biology; Immune response
Introduction
During gram-negative bacterial infections endotoxemia is clinically manifested if and when bacterial cell wall component lipopolysaccharides (LPSs) gain access to the systemic circulation (Munford, 2016). In humans, such toxic effects can be initiated in response to extremely low levels of LPS in the plasma. For example, LPS at concentrations of 1–4 ng/kg body weight has been shown to cause overactive host innate immune responses (Engelhardt et al., 1991). The LPS level in circulation directly correlates with disease severity in a range of endotoxin-associated diseases including sepsis, coronary artery disease, liver cirrhosis, and various autoimmune diseases including Crohn's disease, ulcerative colitis, type 2 diabetes, and pancreatitis (Guzman-Cottrill et al., 2012; Munford, 2016; Silverman and Ostro, 2013).
Once in the circulation, LPS stimulates the host to generate an intense systemic inflammatory reaction, involving a complex of cellular and humoral responses mediated by Toll-like receptor 4 (TLR4) (Aderem and Ulevitch, 2000; Ospelt and Gay, 2010). Although the inflammatory response is needed for bacterial clearance (Beutler, 2000), if circulating LPS is too abundant, the immune response may cause multi-organ dysfunction, frequently leading to death (Feroze et al., 2012; Silverman and Ostro, 2013). To date, various approaches to treat LPS-mediated endotoxemia by blocking the overactive host innate immune responses have failed (Anwar et al., 2018; Warren and Chedid, 1987), thus creating a pressing need to decipher the LPS-mediated immune response.
The major source for circulating LPS molecules is the gut microbiome (Berg, 1996; Erridge et al., 2007). LPS is released from both commensal and pathogenic gut bacteria during bacterial growth (Thieblemont and Wright, 1999), after naturally occurring death of these bacteria or following bactericidal antibiotic treatment (Van et al., 1998). In healthy individuals, the intestinal mucosal barrier protects the host by preventing the entry of LPS into blood circulation (Guerville and Boudry, 2016). When intestinal permeability is altered, for example, in obesity and various metabolic disorders (metabolic endotoxemia) (Bowman et al., 2017; Frazier et al., 2011; Piya et al., 2013), small amounts of LPS cross the mucosal barrier and enter into the portal vein (intestinal endotoxemia) (Munford, 2016), which drains into the liver, where most clearance occurs. Experimentally, it has been shown that the liver can eliminate 80% of the LPS infused into the systemic circulation (Freudenberg and Galanos, 1990; Mathison and Ulevitch, 1979; Yao et al., 2016) within a few minutes. Clearance of LPS by the liver after hours of infusion has been shown to be mediated by KC (Mathison and Ulevitch, 1979; Praaning-van Dalen et al., 1981; Ruiter et al., 1981; Shao et al., 2007) and hepatocytes (Deng et al., 2013; Mimura et al., 1995; Topchiy et al., 2016). Of note, we have presented earlier that the majority, ∼75%, of LPS clearance within few minutes of infusion is mediated by liver sinusoidal endothelial cells (LSEC) using circulating high-density lipoprotein (HDL) as a cargo carrier for LPS (Yao et al., 2016). LPS that is not eliminated by the liver is the major causative agent for systemic inflammation (Stevens et al., 2018; Tulkens et al., 2018; Uhde et al., 2016). The mechanism(s) employed by LSEC to rapidly clear systemic LPS need to be determined as they may offer new tools to control endotoxemia.
Our investigation of potential clearance mechanisms is focused on scavenger receptors because this group of cell surface receptors has been implicated in plasma endotoxin clearance (Hampton et al., 1991). Of the known scavenger receptors, Stabilin-1(Stab1)/common lymphatic endothelial and vascular endothelial receptor-1 (CLEVER-1) and Stabilin-2 (Stab2)/Hyaluronic Acid Receptor for Endocytosis (HARE) are type I transmembrane receptors that are known to have multiple scavenger functions. Stabilin receptors are highly evolutionarily conserved and were the only identified and described members of the Class H family of scavenger receptors (Harris and Cabral, 2019; Kzhyshkowska, 2010). Stab2 has 22 distinct ligands (Weigel, 2020) including acetylated low-density lipoprotein (AcLDL) (Harris et al., 2008; Harris and Weigel, 2008; Kzhyshkowska et al., 2005), pro-collagen pro-peptides (Hansen et al., 2005), advanced glycation end products (Li et al., 2009), and integrins (Jung et al., 2007).
Because the known ligands for Stabilin receptors are lipoproteins, in this study, we have tested and confirmed the hypothesis that Stabilin receptors are involved in clearing LPS from circulation, thereby playing a role in regulating LPS-induced systemic inflammation.
Results
Clearance of LPS by LSEC is via a receptor-mediated mechanism; however, TLR4 is not involved in the rapid clearance of LPS by LSEC
Having demonstrated earlier that LPS is cleared rapidly from the circulation of mice by LSEC and that HDL acts as a cargo carrier (Yao et al., 2016), in the current study, we asked whether the rapid clearance of LPS/LPS-HDL by LSEC is mediated via a receptor.
To answer this question, we used murine LSEC (F4/80−CD45-CD146+) prepared using the immunomagnetic separation method that was recently published by our group (Turman et al., 2021). We measured the amount of LPS that interacts with LSEC after incubating LSEC with increasing concentrations of LPS and HDL. Figure 1A demonstrates that LPS association with cultured LSEC enhances as the concentration of LPS in the LPS-HDL complex increases up to 1.2 mg/mL, after which no further binding occurs. These results indicate that the LSEC have a limited number of binding sites/receptors expressed on their surface that can bind to the LPS-HDL complex, and once they are saturated by LPS-HDL, no further binding occurs, suggesting that LPS-HDL clearance by LSEC is a receptor-mediated phenomenon.
Figure 1.

Clearance of LPS by LSEC is via a receptor-mediated mechanism; however, TLR4 is not involved in the rapid clearance of LPS by LSEC
(A) Plot for 488-LPS bound to LSEC in a dose-dependent manner versus concentration of 488-LPS along with excess of unlabeled LPS, HDL, and LBP incubated at 37°C for 1 h.
(B) The curve plots the remainder of 3H/14C double-labeled LPS in blood circulation versus time in WT C57BL/6 and TLR4-KO mice at various time points after intravenous (IV) infusion. Each data point represents the mean and SD of data from three mice/biological replicates. The figures represent two different experiments.
Since LPS is a well-known ligand for the TLR4 receptor, a plausible explanation for the above observation was that TLR4 in LSEC is the LPS clearance receptor responsible for rapid clearance. To investigate whether LSEC employs TLR4 for LPS clearance from blood circulation, we took advantage of the TLR4 knockout (KO) mice for in vivo studies. For this study, 3H14C-labeled LPS was infused intravenously into C57BL/6 wild-type (WT) and TLR4-KO mice, and the disappearance of LPS from blood was measured over the course of 30 min. The concentration of LPS remaining in blood over time was not significantly different between WT and TLR4-KO mice at any time point (Figure 1B), thus negating this explanation.
TLR4 is weakly expressed in the liver compared with all major internal organs, but LSEC and KC express TLR4 similar to professional macrophages
Our data (Figure 1B) suggest that TLR4 is not involved in the rapid clearance of LPS from blood circulation by LSEC. This raises the question of whether the apparent lack of TLR4 involvement in LSEC clearance from the liver is due to the low level of TLR4 expression in LSEC specifically or liver in general. To answer this question, we evaluated TLR4 in spleen lysates (the organ known to express TLR4) from WT and TLR4 KO mice by immunoblots (Figure 2A). The RAW 264.7 and HEK293 cell lines were used as positive and negative controls, respectively. In the immunoblot (IB) studies, the positive controls show a double band corresponding to the glycosylated and non-glycosylated form of TLR4, whereas both bands were absent in HEK293 and TLR4 KO. The loading control GAPDH shows relatively equal loading in all lanes (Figure 2B).
Figure 2.

TLR4 is weakly expressed in the liver compared with all major internal organs, but LSEC and KC express TLR4 similar to professional macrophages
(A) An ECL-developed immunoblot using rabbit anti-mouse TLR4 Ab showing TLR4 expression in spleen lysates of WT C57BL/6 and TLR4-KO mouse, RAW 264.7 and HEK cell line lysates prepared as described in materials and methods.
(B) Reprobe of A showing ECL-developed immunoblot of mouse anti-GAPDH antibody as a loading control.
(C) An ECL-developed immunoblot using rabbit anti-mouse TLR4 Ab showing TLR4 expression in major organ lysates of BALB/c mice and standard RAW cell lysates.
(D) Bar graph expressing the means and SD of TLR4 expression distributed to each organ, shown in C, after factoring total weight of the organ.
(E) An ECL-developed immunoblot using rabbit anti-mouse TLR4 Ab showing TLR4 expression in major organ lysates of C57BL/6 mice and standard RAW cell lysates.
(F) Bar graph expressing the means and SD of TLR4 expression distributed to each organ, shown in E after factoring total weight of the organ.
(G) An ECL-developed immunoblot using rabbit anti-mouse TLR4 Ab showing TLR4 expression in different liver cell lysates of C57BL/6 mice.
(H) A reprobe of G showing the expression of GAPDH. The numbers depicted represent the MW for each respective band in kDa. Each figure is a representative image from three mice, and the bar graph compiles data from three mice. Values of all significant correlations are given with degree of significance manner versus concentration of 488-LPS along with indicated ∗p < 0.05.
To compare the TLR4 expression levels in various organs, semi-quantitative IB analysis was done as previously described (Ganesan et al., 2012), using lysates from major internal organs along with lysates of RAW 264.7 as standard for standard curve generation and quantification of band intensities. Our data indicate that, in BALB/c mice, lung and spleen have similar levels of TLR4 expression (Figures 2C and 2D). By contrast, in C57BL/6, the spleen accounts for the majority of TLR4 expression (Figures 2E and 2F). Of interest, the liver, as a whole, expresses significantly less TLR4 than the spleen or lung in both BALB/c and C57BL/6 (Figures 2C–2F) mice.
The TLR4 expression in LSEC, KC, and hepatocytes was further studied using cells enriched by immunomagnetic separation. The data show that the level of glycosylated TLR4 expressed in enriched LSEC (F4/80-CD45-CD146+) and KC (F4/80+) was similar to that in splenic macrophages (Figure 2G). By contrast, compared with LSEC and KC, hepatocytes showed negligible expression of TLR4. Note here that immunomagnetically separated LSEC and KC lack GAPDH expression, although an equal amount of protein was loaded in each lane. Therefore, a non-specific band below the TLR4 band served as a loading control (closed arrow).
LSEC functions as an innate immune cell in response to LPS
Having found that LSEC expresses TLR4, we next tested whether LSEC functions as an innate immune cell in response to LPS. The innate immune activity of LSEC was examined by quantifying mRNA expression in LSEC with and without stimulation by LPS, using the NanoString nCounter (Pan-Cancer Immunology panel), a multiplex gene expression analysis with 500+ immunology genes. A comparison of differential gene expression was plotted between untreated LSEC versus LPS-activated LSEC with statistical significance between the two experimental groups at a cutoff of p < 0.005 (Mendeley Data: https://data.mendeley.com/datasets/sm27vwj25v/1). The volcano plot shown in Figure 3A indicates the upregulated and downregulated genes in LSEC upon LPS stimulation. We found LPS stimulation led to a significant change in gene expression of 70 genes in LSEC including 60 that were upregulated and 10 that were downregulated by the LPS stimulation (Table 1). LPS treatment enhanced the expression of many inflammatory cytokines (IL1β, TNF-α, and IL6) and chemokine genes (CCL2, CCL3, CCL5, and CxCL10).
Figure 3.

LSEC produce both pro-inflammatory and anti-inflammatory cytokines in response to TLR4
(A) Volcano plot showing expression of differentially expressed transcript of purified mouse LSEC that were stimulated with LPS or left untreated for 6 h and the cell free culture supernatants were harvested and the cells were lysed in TRizol. Total RNA was extracted, and the mRNA samples were analyzed using NanoString assay on the mouse Pan cancer Immune panel, followed by data analysis in nSolver software.
(B) The amount of TNF-α and IL10 cytokine levels in the supernatant were determined by ELISA.
(C) The graphs shown are the fold change of TNF-α, IL-1β, IL-1α, IL-15, IL-6, and IL10 mRNA of untreated samples. Values of all significant correlations are given with degree of significance indicated.
∗p < 0.005.
Table 1.
Immune profiling gene panel in LSEC treated with LPS
| Gene | Fold change | p value | Gene | Fold change | p value |
|---|---|---|---|---|---|
| Ptgs2 | 45.23 | 6.8E-05 | Tap1 | 2.15 | 3.6E-06 |
| Ccl3 | 10.98 | 7.5E-10 | Irf7 | 2.13 | 2.6E-05 |
| Cd69 | 9.71 | 3.3E-03 | Stat1 | 2.09 | 1.0E-05 |
| Il1b | 9.02 | 8.4E-08 | Traf1 | 1.96 | 1.9E-03 |
| Ccl5 | 7.58 | 5.0E-09 | Cd40 | 1.90 | 3.6E-05 |
| Cxcl10 | 7.02 | 2.3E-10 | Cd83 | 1.90 | 1.1E-05 |
| Ifit2 | 4.92 | 2.4E-08 | Pml | 1.84 | 1.6E-05 |
| Cxcl11 | 4.71 | 2.7E-08 | Cd86 | 1.81 | 2.3E-05 |
| Il15 | 4.36 | 8.9E-06 | Tlr2 | 1.78 | 1.9E-03 |
| Il1a | 4.35 | 1.0E-07 | Ifi35 | 1.74 | 3.6E-05 |
| Ccl4 | 3.98 | 1.2E-07 | Stat2 | 1.72 | 1.9E-03 |
| Il6 | 3.89 | 4.7E-06 | Csf1 | 1.65 | 1.7E-06 |
| Ifih1 | 3.63 | 2.2E-08 | Tnfaip3 | 1.64 | 1.8E-06 |
| Cd274 | 3.58 | 4.0E-07 | Bst2 | 1.64 | 5.5E-06 |
| Ifnb1 | 3.46 | 9.8E-06 | Ccl9 | 1.63 | 5.7E-04 |
| Tnf | 3.41 | 2.0E-05 | Cdkn1a | 1.61 | 8.0E-04 |
| Ccrl2 | 2.97 | 1.4E-07 | Sele | 1.59 | 2.4E-05 |
| Slamf7 | 2.97 | 1.0E-05 | Icam1 | 1.58 | 5.8E-04 |
| Il1rn | 2.81 | 3.5E-08 | Cfb | 1.57 | 4.8E-04 |
| Irgm1 | 2.79 | 1.2E-08 | Mapkapk2 | 1.55 | 3.0E-04 |
| Ccl7 | 2.65 | 2.4E-07 | Tapbp | 1.54 | 3.3E-04 |
| Cybb | 2.59 | 5.6E-07 | Ptpn2 | 1.52 | 5.7E-03 |
| Cxcl3 | 2.58 | 2.6E-04 | Plaur | 1.51 | 2.3E-05 |
| Ifi204 | 2.52 | 2.9E-07 | C1qb | 0.66 | 3.0E-04 |
| Ddx58 | 2.51 | 2.2E-07 | Cfp | 0.64 | 7.3E-04 |
| Cxcl1 | 2.39 | 4.8E-07 | C1qa | 0.59 | 1.7E-04 |
| Socs1 | 2.39 | 2.2E-04 | Tyrobp | 0.59 | 2.4E-04 |
| Clec4e | 2.34 | 5.7E-06 | Ctss | 0.57 | 1.9E-05 |
| Irf1 | 2.32 | 1.9E-06 | Ccl24 | 0.54 | 3.0E-04 |
| Ccl2 | 2.30 | 8.8E-08 | Fcgr1 | 0.49 | 1.1E-04 |
| Tumor nec | 2.21 | 8.1E-05 | Marco | 0.49 | 7.2E-04 |
| Tnfsf15 | 2.19 | 2.1E-03 | Tlr8 | 0.48 | 5.4E-04 |
| Vcam1 | 2.15 | 4.5E-06 | Aicda | 0.34 | 2.2E-03 |
Total RNA purified from LPS-treated or untreated LSEC was used for NanoString analysis by using nCounter Mouse Pan Cancer Immune Profiling Panel. The relative expression of each transcript was normalized against the expression of the top genes with counts >100. Each value is the mean of biological triplicates, and the ratios between means per target genes provide linear fold change. Two-tailed Student's t-test is used to select differentially expressed genes with values <0.005.
Since LPS stimulation is known to enhance the expression of genes involved in the canonical inflammatory pathway in other innate immune cells, next we tested whether the same set of genes are activated in LSEC. Using Ingenuity Pathway Analysis (IPA), we examined the relationship between these differentially expressed and highly significant genes (60 genes) to determine which canonical pathways are involved in LSEC response to LPS. The most prominently enriched categories of canonical pathways (p < 0.05) were associated with communication between innate and adaptive immune cells (17.7%), granulocyte adhesion and diapedesis (10%), agranulocyte adhesion and diapedesis (9.4%), dendritic cell maturation (8.2%), and neuroinflammation and signaling pathways (5.4%) (Table S1).
In addition to canonical pathways, the differentially expressed genes in LPS-stimulated LSEC were also categorized to be involved in the inflammatory process (Table S2). Of note, the IPA upstream functional analysis was used to predict the top upstream transcriptional regulators from differentially expressed genes in LPS-activated LSEC. An overlap p value was added based on the significant overlap between genes in the dataset and known targets regulated by transcriptional regulators. The IPA predicted top transcriptional regulators that were activated on our dataset were TNF-α (consistency score, 4.26), IL1β (4.146), NF-κB (4.146), and E. Coli LPS (4.123) pathways. Our IPA analysis also revealed that the LPS in LSEC-activated gene network pathways associated with hepatotoxicity such as liver damage, liver inflammation, necrosis, proliferation, and hepatocellular carcinoma (Table S3).
To confirm our NanoString data and the ability of LSEC to generate inflammatory cytokines in response to LPS, freshly purified LSEC were incubated with LPS for 6 h and few cytokines and mRNA were analyzed. Our data shows that LSEC produces 2-fold higher TNF-α and IL10 protein (Figure 3B). Also, LSEC produces several-fold higher TNF-α, IL1β, IL1α, IL15, IL6, and IL10 mRNA in response to LPS (Figure 3C). Collectively, these data suggest that LSEC functions as an innate immune cell during LPS stimulation.
LSEC endocytose LPS-HDL complex
Given that LSEC can clear LPS and are also involved in the inflammatory process, we sought to relate inflammation functions to clearance activity of LSEC. We first determined the fate of LPS-HDL in LSEC using an in vitro endocytosis assay involving enriched LSEC (F4/80−CD45−CD146+). Quantification of endocytosis was done using trypan blue as a quenching reagent of membrane-associated fluorescence of Alexa 488-conjugated LPS (488-LPS). Alexa 488-LPS bound increasingly to LSEC in vitro, at 37°C starting 10 min and then plateaued from 20 to 30 min (Figure 4A). The uptake of LPS with and without trypan blue is not significantly different. These data suggest that all of the LPS-HDL associated with LSEC are internalized by endocytosis.
Figure 4.

LSEC endocytose the LPS-HDL complex and localize to lysosomes
(A) Bar graph showing endocytosis of 488 LPS-HDL by LSEC over the course of time with and without trypan blue (TB).
(B) Four-color fluorescence microscopic image of 488-LPS plus 594-HDL complex (top row) or 488 LPS (bottom row) endocytosed by LSEC at 12 h. (a) Green puncta identify 488-LPS particles. (b) Red puncta identify 594-HDL. (c) Blue rings are lysosomes marked with anti-LAMP1 antibody. (d) Merged panels a, b, c and DAPI (blue). (e) Merged image of d plus DIC. (f) Green puncta identify 488-LPS particles. (g) Blue rings are lysosomes marked with anti-LAMP1 antibody. (h) Merged panels f, g and DAPI (blue). (i) Merged image of h plus DIC. The scale bar in panels a and f represents 10 μm. The zoomed-in portion of LSEC is shown in the bottom right-hand portion as inset. Values of all significant correlations are given with degree of significance indicated.
∗∗p < 0.01, ∗∗∗p < 0.001 by Student t test.
LPS and LPS-HDL localize within lysosomes of LSEC
The next steps involved tracking the endocytosed LPS and/or LPS-HDL complex and studying the trafficking of these molecules to lysosomes for degradation. For this, we tracked lysosome-associated membrane protein (LAMP1) using Anti-LAMP1 immunofluorescence staining. LSEC were filled with lysosomes, which appear as small circular vesicles (Figures 4B, c and g). These lysosomes were found to contain LPS-HDL complexes (Figures 4B, d and e) or LPS alone (4B, h and i) suggesting that, once internalized, LPS-HDL is degraded in the lysosomes of LSEC.
HDL facilitates the endocytosis of LPS and limits cytokine production by LSEC
Since our data indicated that the LPS-HDL complex is the predominant mode of LPS endocytosis by LSEC, we asked whether endocytosis of LPS-HDL by LSEC limits the production of inflammatory cytokines by LSEC. For this study, we influenced the levels of LPS endocytosis by altering the concentration of HDL. We then measured LPS endocytosis in vitro, using 488-LPS for 30 min at 37°C and also measured inflammatory cytokine TNF-α production in cell culture supernatant after 6 h. We found that LPS endocytosis was enhanced with increasing concentrations of HDL (Figure 5B), whereas production of the inflammatory cytokines is decreased with increasing concentration of HDL (Figure 5A).
Figure 5.

HDL facilitates the endocytosis of LPS and inhibits the cytokine production by LSEC
(A) Quantification of TNF-α concentration in the supernatant of LSEC that were incubated with different doses of LPS along with same concentration of LPS Binding Protein (LBP) and HDL for 6 h. The LSEC were incubated with two different concentrations of HDL and LBP.
(B) Quantification of 488-LPS endocytosis with different doses of HDL/LBP from live-cell confocal fluorescence images by measuring the total pixel area and the mean fluorescence intensity of green puncta associated with LSEC. Values of all significant correlations are given with degree of significance indicated.
∗p < 0.05, ∗∗∗p < 0.001 by Student t-test.
Lack of Stabilin receptors results in diminished systemic clearance and endocytosis of LPS by LSEC but enhanced systemic inflammatory cytokine production
Our data (Figure 1A) suggest that LPS clearance by LSEC is a receptor-mediated mechanism, leading us to inquire what receptor(s) might be responsible for this activity. Given that LSEC are known to be scavenging cells, they express key endocytosis receptors such as Stab1 and Stab2. Flow cytometry analysis using anti-Stab1 and Stab2 antibodies confirm expression of Stab1 and Stab2 receptors in LSEC (Figure S1), which were known to endocytose toxic factors from circulation including modified lipoproteins and oxidized lipids. Therefore, we hypothesized that the Stabilin receptors are involved in clearing LPS from blood circulation. To test this hypothesis, we compared the clearance of 125I-labeled LPS (125I-LPS) in mice lacking Stab1, Stab2 (Stab1 or Stab2 KO mice), or Stabilin double knockout (Stab DK) with WT mice. The use of 125I-LPS increased the sensitivity of the metabolic assays by several fold, and LPS labeling and retention of biological activity was validated (Figure S2). The amounts of LPS remaining in the circulation of Stab1, Stab2 KO, and Stab DK mice at 5 (Figure 6A) and 20 min (Figure 6B) were significantly higher compared with WT (Figure 6A), suggesting the decreased clearance of LPS in the absence of Stab1 or Stab2. But there was no significant difference in clearance between the Stab1 and Stab DK at both 5 (Figure 6A) and 20 min (Figure 6B). On the contrary, the liver uptake of LPS was significantly lower in Stab1, Stab2, and Stab DK, compared with Stab2 mice, suggesting a protective role for Stabilin in WT (Figure 6C).
Figure 6.

Lack of Stabilin receptors results in diminished systemic LPS clearance, liver uptake of LPS, and endocytosis of LPS-HDL by LSEC.
(A) The bar graph plots the remaining of 125I-labeled LPS in blood circulation in WT, Stab1, Stab2 KO, and Stab DK at 5 min after IV infusion. Each data point represents the mean and SD of data from five to seven mice/biological replicates. The figure represents three different experiments.
(B) The bar graph plots the remaining of 125I-labeled LPS in blood circulation at 20 min after IV infusion. Each data point represents mean and SD of data from six to seven mice/biological replicates. The figure represents three different experiments.
(C) The bar graph plots the amount of 125I-labeled LPS in the liver over blood in WT, Stab1, Stab2 KO, and Stab DK at 20 min. Each data point represents the mean and SD of data from six to seven mice/biological replicates. The figure represents three different experiments.
(D) Quantification of 125I-LPS-HDL endocytosis by LSEC from C57BL/6 and Stab-1 and Stab-2 KO mice after 120 min. Values of all significant correlations are given with degree of significance indicated.
∗p < 0.05, ∗∗p < 0.01, ∗∗∗p < 0.001 by Student t-test. The # indicates p value of 0.06. The ns indicates non significant.
Alike clearance of LPS in vivo (Figures 6A and 6B), the LPS endocytosis by LSEC was studied using 125I-labeled LPS in vitro (Figure 6D), and we found that LPS endocytosis was significantly decreased in LSEC from Stab2 KO and DK mice, and a trend toward significance in Stab1 LSEC compared with WT LSEC (Figure 6D); p-value = 0.06. However, the endocytosis of LPS by Stab1 KO LSEC and Stab DK LSEC was not significantly different.
We further confirmed LPS uptake into cells in a Stab-dependent manner using HEK293 cells that overexpress either Stab1 and Stab2 or the parent empty vector (EV) plasmid. The cell culture supernatants harvested from LPS incubated cell lines stably expressing Stab1 and Stab2 and exposed to RAW264.7 cells. The production of TNF-α was measured by ELISA. Our data showed a significantly low level of TNF-α in RAW 264.7 cells exposed to the culture media harvested from LPS-stimulated Stab1 and Stab2-overexpressing cell line compared with empty vector-transfected cells (Figure S4). Thus, our data strongly indicate that Stabilin receptors are the major receptors for LPS clearance.
Next, we asked whether Stabilin receptor-mediated clearance/endocytosis inhibits the inflammatory cytokine response in LSEC. Interesting, the level of systemic inflammation after 2 h of LPS infusion, as determined by multiplex assays, shows that plasma TNF-α levels were increased up to ∼9-fold in Stab1 KO and ∼5-fold in Stab2 KO mice (Figure S3). Similarly, other cytokines, including IL1β, KC-GRO, IL10, and IL6 showed similar upregulation in Stab1 and Stab2 KO mice (Figure S3). We next included Stab DK mice along with Stab1 and Stab2 KO mice and measured the level of systemic inflammation after 2 h of LPS infusion, by ELISA. Our data strongly indicate that the Stab1 KO mice show a consistent increase in TNF-α and IL1β compared with WT mice. Also, we found that the cytokine response in Stab DK mice is similar to that in Stab1 KO mice. However, in Stab2 KO mice LPS significantly enhances the production of TNF-α compared with WT, but not IL1β. These data suggest that Stab1 is a major receptor of LPS endocytosis and clearance (Figure 7).
Figure 7.

Lack of Stabilin receptors results in enhanced systemic inflammatory cytokine production
The bar graph plots (A) Levels of cytokine TNF-α and (B). Levels of cytokine IL-1β in the serum of mice infused with 2 mg/kg LPS for 2 h and determined by ELISA. Each data point represents mean and SD of data from 6 to 10 mice/biological replicates. The figure represents two different experiments. Values of all significant correlations (p < 0.05) are given with degree of significance indicated.
∗p < 0.05, ∗∗p < 0.01, ∗∗∗p < 0.001, ∗∗∗∗p < 0.0001 and ns denotes non significant by Student t test.
Stabilin receptor deficiency augments the endotoxin-mediated mortality in mice infused with LPS
Since lack of Stabilin receptors promotes pro-inflammatory response to LPS (Figures 7 and S3), we next examined whether Stabilin can confer protection against sub-lethal doses of LPS. In this experiment, age-matched WT and Stabilin KO mice were challenged with LPS (10mg/kg body weight) via the intraperitoneal route. Figure 8 shows that WT mice display a statistically significant survival advantage over Stab1 and Stab2 KO mice. Stab1 KO and Stab DK mice die earlier and in greater numbers, than do Stab2 mice, suggesting a protective role for Stabilin, with greater role for Stab1 compared with Stab2 in endotoxin-mediated damage. Following LPS injections, all mice (WT and Stab-1 and-2 KO) became lethargic, but the Stab2 KO and WT mice started to recover within 24 h, whereas the Stab1 KO and Stab DK mice remained lethargic or perished. Mice that met the early removal criteria were euthanized according to both UNL and OSU IACUC protocols.
Figure 8.

Lack of Stab receptors leads to early mortality in mice infused with LPS
Wild type (C57BL/6), Stab1, Stab2 KO, and Stab DK were challenged with 10 mg/kg LPS. The weight loss and survival of the mice were monitored every 6 h until 48 h. Results are expressed as Kaplan-Meier curves. Differences in survival between the two groups at a time were tested using the log-rank test. These data are representative of three independent experiments, which showed the same trend, and each line represents data from five to eight mice per group. The p value of the overall representative survival curve based on the log rank (Mantel-Cox) test is 0.043. In the representative survival curve, the p value between Stab1 and Stab2 was 0.117, between WT and Stab1 was 0.028, between WT and Stab2 was 0.3173, between WT and DK was 0.009, between Stab1 and DK was 0.601, and between Stab2 and DK was 0.045.
Discussion
The clearance of LPS by the liver has been traditionally thought to be mediated exclusively by Kupffer cells (KC) (Mathison and Ulevitch, 1979; Praaning-van Dalen et al., 1981; Ruiter et al., 1981; Shao et al., 2007). However, previous findings from our laboratory suggest that LSEC are the major cell type responsible for clearing 75% of the LPS from the circulation (Yao et al., 2016).
A likely candidate for mediating the LSEC clearance of LPS is TLR4, a known receptor for LPS. Also, TLR4 in hepatocytes has been demonstrated as a receptor for LPS clearance (Deng et al., 2013) several hours after the onset of exposure. However, our data show that, within a few minutes, a majority of LPS is cleared via LSEC and TLR4 does not have a role (Figure 1B). Multiple previous reports have demonstrated that TLR4 is the signaling receptor for LPS and mice defective of functional TLR4 are hyporesponsive (Bihl et al., 2001; Hoshino et al., 1999; Poltorak et al., 1998) and tolerant to LPS (Qureshi et al., 1999). To avoid being activated by cleared LPS, a healthy liver has been shown to express low levels of TLR4 (De et al., 2005; Zarember and Godowski, 2002), in agreement with our findings (Figure 2). In addition, our data showing that, in mice, the spleen and lung are the major organs that express TLR4 (Figure 2) agree with findings in humans (Zarember and Godowski, 2002). Although the liver whole-organ homogenates express low levels of TLR4, interestingly, TLR4 is expressed in LSEC at levels similar to BMM and KC, and LSEC can sense LPS and cause inflammation. The stimulation of LSEC with LPS enhances the expression of various inflammatory genes including pro-inflammatory cytokines such as TNF-α, IL1β, and IL6 (Figure 3), similar to the gene expression profile in other innate immune cells when stimulated by LPS (Guha and Mackman, 2001; Kong et al., 2007).
As part of uncovering the role of TLR4 in LSEC, we also investigated which molecular pathways in these cells responded to LPS stimulation. Using IPA pathway analysis of gene expression in LPS-treated and untreated cells, consistent with the innate immune cells, we discovered that many canonical signaling pathways such as JAK-Stat, MAPK, and interferon signaling and pathways involved in Th-1 cell differentiation and communication between the innate and adaptive immune cells are activated in LSEC upon LPS stimulation (Table S1). Taken together these data strongly suggest that the LSEC function as innate immune cells and are immunologically activated by LPS. Nevertheless, chronic exposure of LSEC to LPS may lead to an LPS tolerance state as reported in the literature (Shetty et al., 2018; Uhrig et al., 2005; Wu et al., 2010).
In the current study we provided evidence that, although LSEC has substantial levels of TLR4 expression, the clearance of LPS into LSEC appears to occur via Stabilin receptors, not TLR4. Our findings have unveiled novel LPS receptors, namely, Stab1 and Stab2, which provide a very rapid host defense mechanism for clearing LPS thereby reducing the TLR4-mediated systemic inflammation. Our study showed that mice defective for Stab1 or Stab2 were hyper-responsive to LPS, suggesting that TLR4 and Stabilin receptors are functionally opposing receptors for LPS immune response and that TLR4 senses LPS and activates inflammatory signaling pathways that lead to an increased production of cytokines, whereas Stabilin receptors clear LPS and, thereby, indirectly control inflammatory cytokine production. Our data suggest that the lack of Stabilin receptors in LSEC enhances systemic inflammation and LPS-mediated septic shock in mice. These data confirm the previous prediction that excess LPS in circulation not eliminated by the liver is the major causative agent for systemic inflammation and subsequent life-threatening events (Guerville and Boudry, 2016).
Our data agree with the recent publication that Stab1 is required for the removal of LPS from circulation in zebrafish (Arias-Alpizar et al., 2021). The evolutionarily conserved LPS clearance mechanism via Stabilin receptors shown in zebrafish by Arias-Alpizar et al. and in mice in this article suggests Stab1 receptor-mediated LPS clearance pathway operative in all vertebrates including humans, which is yet to be investigated.
Excess LPS in circulation is deadly, and we have demonstrated that Stabilin receptors in LSEC are involved in the rapid elimination of a majority of LPS from blood circulation as early as 30 s. Since TLR4-mediated immune response in innate immune cells is also a very quick process, the identification of receptor(s) that compete with TLR4 for LPS and clear LPS will aid in ways to enhance LPS elimination from the circulation.
Our data also indicate that Stab1 and Stab2 have both unique and overlapping functions during LPS clearance. Despite the similarity (55% homology) between the two Stabilin receptors, overall Stab1 has a more protective role than Stab2 in endotoxin-mediated damage. Stab1 KO mice die faster than the Stab2 KO mice and are not significantly different from Stab DK, which suggests that Stab1 is the major player in LPS clearance long term, i.e., after a few days (Figure 7). By contrast, short-term clearance and endocytosis experiments within a few minutes and hours showed no difference between Stab1 and Stab2 and there was no statistically significant difference between Stab1 and 2 KO mice (Figure 6). The reasoning could be that Stab2 is a bulk clearance receptor, whereas Stab1 differs in that it is more immunologically sensitive. Previous reports indicate that Stab1 is highly expressed on alternatively activated macrophages (M2) rather than the classically activated M1 macrophages stimulated by TNF-α and IFN-γ (Kzhyshkowska et al., 2006). The Stab1 expression is indicative of the clearance of cell debris, anti-inflammation, and immunosuppression (Kzhyshkowska, 2010). The M2 macrophages expressing Stab1 have been implicated in the growth and expansion of a variety of tumors of the breast, colon, lung, ovary, stomach, and oral cavity (Kwon et al., 2019; Larionova et al., 2020; Riabov et al., 2016; Yin et al., 2020). Also, anti-Stab1 antibodies have been used to attenuate tumor progression and growth, but not metastasis, in mice, which suggests that Stab1 is involved with immunosuppression in what would be an inflammatory event (Karikoski et al., 2014). In the case of systemic LPS-mediated inflammation, which can cause systemic shock, the absence of Stab1 may have tilted the balance of the macrophage population into the M1 phenotype and allowed for a severe increase of pro-inflammatory cytokines, which resulted in higher deaths in the Stab1 KO mice. We observed that, upon receiving LPS injections, all mice became lethargic and were ill, but the Stab2 KO and WT mice started to recover within 24 h, whereas the Stab1 KO mice remained lethargic and met early removal criteria (Figure 8).
In addition, our findings show that the lack of Stab1/Stab2 receptors results in diminished endocytosis of LPS-HDL by LSEC and suggest that endocytosis is the host effector mechanism for clearance. The degradative endocytosis pathway terminates in lysosomes, small (100–500 nm diameter) organelles with an acidic interior with 60 different hydrolytic enzymes including proteases and lipases. Our studies show that LSEC is filled with lysosomes (Figure 4C) labeled with LAMP1 and lysosomes, in turn, contain endocytosed LPS-HDL complexes (Figure 4). These data suggest that LPS-HDL undergoes a degradative process once endocytosed by LSEC.
Another key issue raised by our findings concerns the participation of HDL in LPS clearance by LSEC, given that our previous study found that most circulating LPS is complexed with HDL; the well-known receptor for HDL is SR-B1. At this time, it is not clear whether Stabilin receptors can be clearance receptors for HDL or LPS alone or both. It is anticipated that there could be a difference in binding affinity and saturation ability of Stab1 and Stab2 receptors to LPS or HDL, which could contribute to the long-term effect of LPS on the survival of the Stab2 KO than Stab1 KO mice (Figure 8).
In summary, our findings will lead to a better understanding of cellular and molecular events underpinning the elimination of LPS by Stabilin receptors in LSEC and help explain how the body naturally regulates systemic inflammation. Identification of ways to enhance LPS elimination from the circulation by upregulating the Stab1 receptor expression using drugs or increasing HDL levels has the potential to benefit patients with endotoxemia and should offer novel targets to treat the many endotoxin-associated diseases (Aderem and Ulevitch, 2000; Aravindhan et al., 2015; Caradonna et al., 2000; Feroze et al., 2012; Gomes et al., 2017; Guo et al., 2015; Hauser et al., 2011; Lequier et al., 2000; Opal et al., 1999; Ospelt and Gay, 2010; Pasternak et al., 2010; Sharma et al., 2003; Silverman and Ostro, 2013; Wiedermann et al., 1999, 2001). Also, our findings revealed a novel immunological function of LSEC.
Limitations of the study
The following are the major limitations of our study. (1) Our data do not support that the increased lethality in the Stab1 knockout mice is directly due to LPS signaling by TLR4 alone. We cannot exclude the possibility that Stabilins respond to LPS in LSEC and initiate a signaling event that functions as a negative regulator of TLR4 signaling. This can be best studied using triple KO mice that are TLR4 and Stab1/2 Knockout and single knockout mice. (2) The specific role of Stab 1/2 in LSEC and in LPS clearance has not been studied in vivo. Furthermore, the contribution of Stabilin receptors in myeloid cells, specifically Kupffer cells, for LPS clearance is not included in our study. These would require cell-selective Stab1/2 deletion from LSEC and myeloid cells.
STAR★Methods
Key resources table
| REAGENT or RESOURCE | SOURCE | IDENTIFIER |
|---|---|---|
| Antibodies | ||
| The anti-Toll-like Receptor 4 (D8L5W) Rabbit mAb (Mouse Specific) | Cell Signaling USA | Cat # 14358S; RRID: AB_2798460 Ref : 01/2017 Lot #1 |
| mouse anti-GAPDH | Santa Cruz | Cat # SC 47724; RRID: AB_627678 |
| anti-apoA1 antibody | Abcam | Cat # Ab33470; RRID: AB_722839 |
| rabbit anti-LAMP-1 antibody | DSBH, US | Cat # 1D4B; RRID: AB_2134500 |
| 568 goat-anti-rabbit IgG | Invivogen | Cat # A11011; RRID: AB_143157 |
| Bacterial and virus strains | ||
| The 3H/14C labeled LPS from Salmonella enterica sv. Typhimurium PR122 (Rc) | Kind gift from Prof. Robert Munford (NIAID). | |
| E. coli K12 strain LCD25 | List Biologicals | Cat # 314 |
| Biological samples | ||
| Normal plasma samples | pooled from several individuals were from Innovative Research | IPLAK2E10ML |
| Chemicals, peptides, and recombinant proteins | ||
| 0.5% triethylamine | (Sigma) | T-0886 Lot # 062K0179 |
| Recombinant human LBP protein rhLBP | R&D systems | 870-LP Lot # CyJ1518021 |
| reverse transcriptase enzyme | (SuperScript III, Invitrogen) | Cat# 18080093 |
| Label-free Na125I | American Radiolabeled Chemicals | ARI0102-2mCi |
| Critical commercial assays | ||
| Iodination reagent | (Thermo Scientific) | Cat # 28600 |
| Endotoxin test (Endochrome-K) | Charles River | M4303EK1 |
| TNFα and IL1β ELISA kit | R&D | Mouse IL1 Beta CATLOG# DY401; LOT# P180671 Mouse TNF-alpha CATLOG#DY410 LOT# P189768 |
| Alexa fluor 594 carboxylic acid, Succinimidyl ester | Molecular probes by life sciences | REF A20004 Lot # 1777976 |
| Alexa fluor 488 carboxylic acid, Succinimidyl ester | Molecular probes by life sciences | REF A20000 Lot # 1826430 |
| NanoString nCounter assay | (NanoString Technologies, Seattle, WA) | K15048D V-PLEX Proinflammatory Panel 1 Mouse Kit Cat#XT-CSO-MIM1-12 |
| mouse IL1β, or TNFα TaqMan gene expression kit | (Applied Biosystems). | TNFα Cat#4331182 Assay ID- Mm00443258_m1 IL1β Cat#4331182 Assay ID Mm00434228_m1 |
| Experimental models: Cell lines | ||
| RAW 264.7 cells | American Type Culture Collection | Cat # TIB-71 |
| EV, Stab1 and Stab2 stably expressing cell lines were created and described previously | (Harris et al., 2004; Pempe et al., 2012) | |
| Experimental models: Organisms/strains | ||
| Wild-type BALB/c and C57BL/6 male mice 12-16 weeks of age | The Jackson Laboratory. | 000651, 000664 |
| The F4/80-CD45-CD146+ LSEC | Using a modified method (Turman et al., 2021) | |
| The Stab2 KO mice in C57BL/6 | (Hirose et al., 2012) | N/A |
| Stab DK mice in C57BL/6 | (Miller et al., 2018) (Miller et al., 2016) | N/A |
| The TLR4 knockout mice in the C57BL/6 background | (Hoshino et al., 1999) | Gift |
| The 3H/14C labeled LPS from Salmonella enterica sv. Typhimurium PR122 (Rc) | Kind gift from Prof. Robert Munford (NIAID). | |
| Recombinant DNA | ||
| Recombinant Stab1/2 stable cells | (Harris et al., 2007) | N/A |
| Software and algorithms | ||
| ImageJ | (Schneider et al., 2012) National Institutes of Health |
https://imagej.nih.gov/ij/ |
| GraphPad Prism 6 version | GraphPad | https://www.graphpad.com/ |
Resource availability
Lead contact
Further information and requests for resources and reagents should be direct to the lead contact, Latha Ganesan at Latha.Ganesan@osumc.edu.
Materials availability
Mouse lines used in this study are available upon request from Dr. Edward Harris, eharris5@unl.edu
Experimental model and subject details
Experimental animals C57BL/6, BALB/c and Stab KO mice
Wild-type BALB/c and C57BL/6 male mice 12-16 weeks of age were obtained from The Jackson Laboratory. The Stab1 KO mice in C57BL/6 were created by Jackson laboratories, in which they created a deletion in exon 1 of the gene detailed in (Miller et al., 2018). The Stab-2 KO mice in C57BL/6 were generated by the laboratory of Prof. Atsushi Miyajima at the University of Tokyo and provided to the Harris laboratory through a MTA agreement (Hirose et al., 2012). Since both stab1 and 2 genes are located on different chromosomes, the Stab DKO mice were developed by breeding together the Stab1 and Stab2 KO mice and screened using PCR to detect presence of native Stab1 and Stab2 genes. The following primers were used to detect the deleted portion in the Stab1 KO: P1, 5’-GCTGTCCCCATTGCCTGTTATC-3’, P2, 5’ACTTAAGGATATCGCGGCGC-3’. The following primers were used to detect the neomycin insertion that disrupts the Stab2 gene in the Stab2 KO: P1, 5’-CAGTGATGGGCACTCCTACAGATTCTCCC-3’, P2, 5’-CTAGAGTACATTGTGAAAGTTAACAAG-3’. The TLR4 knockout mice in the C57BL/6 background were a gift from Dr. Osamu Takeuchi, Department of Medical Chemistry, Kyoto University, Japan via Dr. Hollingsworth (Hollingsworth et al., 2004; Hoshino et al., 1999).
Animal husbandry
All mice were kept in individually vented cage (IVC) racks on a 12-hour light/dark cycle and fed standard diet chow (#2016, Envigo) before and during experimental procedures. All mice were kept with sibling littermates and individual mice were housed singly only if it was an aggressive male or only male in the litter upon weaning. All studies were approved by Institutional Animal Care and Use Committees of The Ohio State University and the University of Nebraska - Lincoln and all procedures were done in accordance with their guidelines. In vivo mouse studies were performed with the use of isoflurane anesthesia, and all efforts were made to minimize suffering.
Method details
Antibodies
The anti-mouse TLR4 antibody (Cell Signaling USA) and mouse anti-GAPDH (Santa Cruz) were used at a working concentration of 10μg/ml.
Reagents
Highly purified rough LPS from E. coli K12 strain LCD25 was from List Biological Labs (#314). The 3H/14C labeled LPS from Salmonella enterica sv. Typhimurium PR122 (Rc) was a kind gift from Prof. Robert Munford (NIAID). The normal plasma samples pooled from several individuals were from Innovative Research. The Alexa 488 hydrazide and Alexa 594 NHS were from Molecular Probes. The TNFα ELISA kit was from R&D. Recombinant human LBP protein was from R&D.
Cells
RAW 264.7 cells were obtained from American Type Culture Collection and were maintained in Dulbecco's modified Eagle's medium supplemented with 5% fetal bovine serum. Stab1 and Stab2 stably expressing cell lines were created and described previously (Harris et al., 2004; Pempe et al., 2012) and are available upon request to Dr. Edward Harris, eharris5@unl.edu. They were created using the following procedure. Human cDNAs encoding the Stab2/315-HARE and Stab1 were inserted in the multicloning site of pcDNA5/FRT/V5/6xHis (Life Technologies). The smaller isoform of Stab2 (190-HARE) was inserted into the BamH1 site of pSecTag/FRT/V5/6xHis (Life Technologies). One microgram of these plasmids were mixed individually with nine micrograms of pOG44 which encodes for the FRT recombinase and 20 microliters of Lipofectamine 2000 (Life Technologies) in a total volume of 0.75 mL of DMEM. The DNA/Lipofectamine mixture was incubated for 20 min at room temperature and then overlaid on a monolayer of 3 x.106 Flp-In HEK293 cells (Life Technologies) in a 100 mm dish. After 24 hrs, the medium was supplemented with 100 μg/mL Hygromycin B for the selection of stable cell colonies. Colonies were picked, grown up in a 24-well plate and tested for recombinant protein expression by Western Blot with an anti-V5 antibody (Bethyl Labs) and a negative β-gal test to ensure correct integration of the plasmid into the genome by the recombinase.
Preparation of mouse LSEC
The F4/80-CD45-CD146+ LSEC were prepared using a modified method (Turman et al., 2021). Briefly, livers were excised and subjected to mechanical dissociation using GentleMACS (Miltenyi Biotec). After filtering, the single-cell preparation was centrifuged at 65g three times, to remove hepatocytes. The non-parenchymal cells (NPC) were pelleted from the supernatant. LSEC was prepared from NPC using a triple immune-magnetic selection method. Briefly, NPC was first selected by purifying F4/80-ve cells and the F4/80-ve NPC were subjected to a second negative selection using anti-CD45 conjugated immunomagnetic bead and a positive selection using CD146 conjugated beads. During each selection procedure, the cells were suspended in MACS buffer and incubated with appropriate Ab-conjugated beads from Miltenyi Biotec and passed through MiniMacs magnetic columns. The purity of the LSEC were further confirmed by flow cytometry using markers for various cells in the liver as described previously and SEM image of purified LSEC showing gold standard fenestrae (Cover image- March 15th 2021, Journal of Immunology) confirms the reliability of our preparation (Turman et al., 2021).
Saturation analysis of LPS binding to LSEC
The LPS-HDL complex was prepared by incubating 488-LPS and unlabeled-LPS at a ratio of 1:10, along with HDL and LBP in PBS buffer for 1h in 37oC, then buffer exchanged with 15% FBS in DMEM/F12 media. The mouse primary LSEC were seeded for 2h in culture dishes pre-coated with 0.1% gelatin (Sigma) and incubated with LPS-HDL complex at increasing concentrations at 37oC for 30min. The cells were washed twice with PBS and lysed with tissue lysis buffer composed of 25 mM HEPES, 20 mM Na4H2O7⋅10H2O, 100 mM NaF, 4 mM EDTA, 2 mM Na3VO4, 1% Triton X-100, 0.34 mg/ml PMSF, 0.01 mg/ml aprotinin, and 0.01 mg/ml leupeptin (Ganesan et al., 2012). The lysate was used to determine the 488-LPS concentration via fluorimeter (Spectra Max3, US).
Labeling of LPS with 125I
Labeling of LPS with 125I was performed by following the method of R. Ulevitch (Ulevitch and Johnston, 1978) with some modifications. Briefly, 1.0 mg of LPS was resuspended in 1.0 mL of 50 mM 4-hydroxy-N-methylbenzamide (HNMBZ, Enamine) in 50 mM borate buffer, pH 8.0 for 18 hrs at 37°C to create a benzamide derivative of LPS. Unreacted HNMBZ was removed from the LPS by dialysis against 3x1 liter PBS at 4°C for 6 hrs. The modified LPS was then placed in a glass tube that was pre-coated with 0.0375 mg iodination reagent (Thermo Scientific) and incubated for 20 min at room temperature with 0.3 mCi of Na125I. Unreacted Na125I was removed by dialysis against 1 L of PBS at room temperature with 3 changes over 3 hrs.
To verify that the LPS was labeled with 125I, the iodinated mixture was separated by a pre-packed PD-10 column (GE) and 0.5 mL fractions were collected with the use of saline as the mobile phase. Each fraction was placed in a gamma counter and the labeled material was in fractions 7-11 (Figure S2A). Unreacted 125I typically migrates slower through the column and does not elute until fraction 22-25. To verify that that fractions 7-11 were LPS, all fractions (1-15) were subjected to an endotoxin test (Endochrome-K, Charles River).
Biological activity of 125I-LPS
To verify that iodinated LPS had the same biological activity as unlabeled LPS, we stimulated RAW264.7 cells with 125I-LPS to detect secretion of TNFα. Briefly, RAW264.7 cells were stimulated with 0.5 mL RPMI containing 10% FBS containing 200 ng/well of 125I-LPS or unmodified LPS. After 6 hrs at 37°C, the supernatant was spun down to get rid of any floating cells and debris and stored at -20°C for the subsequent ELISA assay. The detection of TNFα in the thawed RAW264.7 cell supernatants was performed with the TNFα ELISA assay (R&D Systems) in accordance with the manufacturer’s instructions (Figure S2C).
Clearance kinetics of LPS
The 4 μg of 3H/14C-LPS from Salmonella enterica in HNEB buffer was injected via retro-orbital delivery into TLR4 KO and WT C57BL/6 mice respectively. The mice were bled via the retro-orbital plexus of ∼10 μl of blood at post-infusion times of 30 sec, 1, 2.5, 5, 15, and 30 min. The mice were sacrificed at the end of 30 min. To adjust for different body weights of individual mice, the blood concentrations of 3H/14C were normalized to body weight. Briefly, the zero time and 100% was calculated based on the mouse weight and estimated blood volume of 2.58 ml/25 gm (zero time point, particles/ml = dose/2.58 ml) (Vacha, 1975)
The 6.2 μg of 125I-LPS from E. coli K12 were injected via the right retro-orbital capillary bed of mice that were anesthetized with ketamine and xylazine. At specific time points, blood was withdrawn from the left eye orbital capillary bed using a heparinized capillary tube, and volume was measured using a ruler and calculated to pre-determined standards. The capillary tube was placed in a gamma counter and assessed for CPM and the amount of LPS was calculated as CPM per μL of blood. The total blood volume of mice is calculated as 7% of the mass of the animal in grams.
Quantitative immunoblot
Small pieces from each organ (∼100mg) were dissected, weighed and homogenized in tissue lysis buffer using a tissue homogenizer. The lysates were subjected to 8–16% gradient SDS-polyacrylamide gels, and the fractionated proteins were transferred to nitrocellulose membranes (0.45 μm). The membranes were blocked with 5% milk for 30 min and then incubated overnight with primary rabbit anti-TLR4 Ab (Cell Signaling) at 4˚C. The bands were developed using HRP-conjugated goat anti-rabbit IgG Ab (Cell Signaling) and detected for quantification using a chemiluminescence scanner (FluorChem E imager; ProteinSimple). The RAW 264.7 cell line was used as a standard to quantify TLR4 expression.
NanoString nCounter assay
To investigate the gene expression in LSEC stimulated with LPS, we performed the NanoString nCounter assay (NanoString Technologies, Seattle, WA) using the mouse pan-cancer immunology panel. All procedures were performed according to the manufacturer’s protocol (NanoString Technologies). Briefly, LSEC were lysed with trizol, total RNA was extracted and treated with DNAse-I, and 200 ng of high-quality RNA (4 mice per group) were hybridized to NanoString probes by incubation at 65 °C for 18 hr. The hybridized RNA-probe complexes were immobilized on a streptavidin-coated cartridge using the nCounter Prep Station. The nCounter Digital Analyzer was used to count individual fluorescent barcodes and quantify target mRNA molecules.
NanoString data analysis
Data normalization and analysis were performed by The Ohio State University Comprehensive Cancer Center- Shared Genomic Facility and Bioinformatics Core Facility, according to the manufacturer’s guidelines. Specific background correction factors were applied to certain mRNAs according to the manufacturer’s directions to account for nonhybridization-dependent interactions of some bridge oligomers or capture and reporter probes. Technical normalization of the code counts was performed using spiked mRNA+ controls according to the manufacturer’s instructions, and background was determined using the included negative controls. Each sample was then normalized to the geometric mean of the top 50 most highly expressed genes. mRNAs with normalized counts <100 (average background count) in all groups were removed, and the fold changes were calculated using the average of each group. For each experiment, the fold changes were calculated by comparing the experimental group to their appropriate controls. Based on the normalized gene expression levels of NanoString-based chips, a two-tailed Student’s t-test assuming equal variance was applied to each gene to compare the difference between the control and LPS stimulated group. Fold change cutoffs of > 1.5 were used to evaluate gene expression changes with a number. Calculations were performed using the R statistical computing environment. Bioinformatic analysis was performed to analyze differentially expressed genes in LPS stimulated and unstimulated LSEC. Briefly, outcomes from NanoString data analysis were first uploaded into Qiagens’ IPA system for core analysis and then with the global molecular network in the Ingenuity Pathway Knowledge Base (IPKB). IPA was performed to identify canonical pathways, diseases and functions, and gene networks that are related to cardiovascular diseases.
NanoString data validation
100 ng of RNA from LSEC was converted to cDNA by reverse transcriptase enzyme, (SuperScript III, Invitrogen) and qRT-PCR was performed using mouse IL1β, or TNFα TaqMan gene expression kit (Applied Biosystems). IL1β and TNF amplification were normalized to β actin as a housekeeping gene for relative gene expression. Triplicate samples were analyzed in duplicate wells in each experiment. (n=3)
Preparation of Alexa 488 LPS
The Alexa 488-LPS (2mg/ml) was prepared as elaborated earlier. Briefly, LPS monomerized using 0.5% triethylamine (Sigma) was oxidized with galactose oxidase (Triantafilou et al., 2000) followed by NaIO4 (Kubiak et al., 2011). The oxidized LPS was incubated with Alexa-488 hydrazide for 1h at 37°C and overnight incubated at 4°C. The Alexa 488-LPS was dialyzed against PBS at 4°C.
Isolation of HDL from human plasma
The HDL isolation was performed using the modified method of Maiseyeu et al. (Maiseyeu et al., 2014). Briefly, the density of the human plasma was adjusted to 1.22 gms/ml using potassium bromide (KBr) and centrifuged at a speed of 450,000 x g for 3 hrs at 4°C and a top layer containing all lipoproteins was collected. The HDL was separated from the total lipoproteins by overlaying 0.15 M NaCl and centrifuging at 625,000 x g for one hour at 4°C. The 3rd layer from the top was collected and determined to contain HDL.
Preparation of 594-HDL
The HDL (10 mg/ml) was dialyzed against borate buffer (pH 8.3) using 20 kDa cut-off dialysis cassette for 1 hr. The HDL was labeled by incubation with 25 μg of Alexa 594 NHS (10 mg/ml) overnight at room temperature with constant mixing. The free Alexa-594 dye was removed by dialysis using 20 kDa cut-off dialysis cassette against 50 mM HEPES buffer for 2 hrs at 4°C. The protein content of the HDL was calculated using the absorbance at 280 nm. The purity of HDL fractions was confirmed by SDS-PAGE electrophoresis (Yao et al., 2016) and immunoblot using an anti-apoA1 antibody (Abcam) and then stored at −80°C until use.
Preparation of 594-HDL-488-LPS conjugates
The 594-HDL and 488-LPS complex was prepared by incubating 1.5 mg and 200 μg, respectively, along with 6μg lipopolysaccharide-binding protein (LBP) in HEPES buffer (pH 7.2) overnight at room temperature. To separate the unbound LPS from the complex, the density of the reaction mixture was adjusted to 1.22 mg/ml with KBr and centrifuged at 500,000 g for 75 min. The top layer, containing 488-LPS and 594-HDL complex, was collected and dialyzed using 20 kDa cut-off Slide-A-Lyzer Dialysis cassettes against HEPES buffer.
488-LPS and 488-LPS plus 594-HDL localizes within lysosomes of LSEC
LSEC was seeded onto collagen-coated coverslips for 2 hrs in RMPI media containing 10% FBS and then washed twice. 488-LPS plus 594-HDL was incubated with LSEC for 1h then washed and chased for an extra 12 hrs. Lysosomes of LSEC were marked by rabbit anti-LAMP-1 antibody (DSBH, US) followed with 594 anti-rabbit IgG. Coverslips were then mounted with prolong gold and viewed by confocal microscopy.
Endocytosis of 125I-LPS by LSEC and recombinant Stab1/2 stable cells
To make the 125I-LPS-HDL complex, a mixture of 1.5 μg of human-derived HDL, 200 μg of I125 radiolabeled lipopolysaccharide, and 6μg of LBP in 100 mM HEPES buffer (pH 7.2) and incubated at room temperature overnight with mixing. LSEC (Cabral et al., 2018) at 2 x 10⁵ cells/well were plated on collagen-coated 24-well plates and allowed to adhere for 2 hrs. DMEM containing 0.05 mg/mL BSA was mixed with an equivalent of 1 μg/mL 125I-LPS-HDL and called “Endocytosis Medium”. Cells incubated in serum were washed with plain DMEM and then incubated with 0.3 mL Endocytosis Medium for various times. At the end of the incubation time, the cells were washed 3x with cold Hank's Balanced Salt Solution (HBSS), then lysed with 0.3 M NaOH and the amount of total protein in the lysate was determined by Bradford assay. Endocytosis in stable recombinant cells lines was similar in that 1.0 x 10⁵ cells were plated on uncoated tissue culture 24-well plates the day prior to the experiment. All other procedures are same as above.
Endocytosis assay using live-cell confocal microscopy
LSEC isolated from C57BL/6 mice liver was seeded to collagen-coated dishes for 2h in RMPI media containing 10% FBS and then washed twice. The LPS or LPS with different concentrations of HDL plus LBP was then incubated with LSEC cells for different time points and washed twice with 4°C RPMI media without FBS. Cells were analyzed using Nikon A1R Live Cell Confocal for imaging with plan Apo optics of 60x in oil, laser wavelength at 487.8nm, laser power 1.0, pinhole radius at 28.1μm, calibration of 0.21μm/px. The membrane-associated LPS was then quenched with 4mg/ml Trypan blue (Sigma) in PBS. Fluorescent images after quenching of Trypan blue were obtained at the same spot. The images were quantified by ImageJ.
Secreted TNFα measurement in the culture supernatant
LSEC isolated from C57BL/6 mouse livers were seeded to collagen-coated dishes for 2h in RMPI media containing 10% FBS and then washed twice. The LPS or LPS with different concentrations of HDL plus LBP was then incubated with LSEC cells for 6 hrs. Sample supernatants were then collected and TNFα concentration for each sample was determined using an ELISA kit.
Systemic cytokine measurements
Stabilin WT and KO mice were injected with a sub-lethal dose of LPS (10 mg/kg) intraperitoneally and blood was collected after 48 hrs and serum was obtained. In vivo serum cytokine levels were quantified with a pro-inflammatory multiplex panel (Mouse Proinflammatory Panel 1; Meso Scale Diagnostics).
Survival assays
Age- and sex-matched C57BL/6 Stab1 and Stab2 mice were injected intra-peritoneally with 10 mg/kg LPS in saline or treated sham (saline alone) and returned to their cages. Mice were monitored at 18, 24, and 44 hrs for weight loss and morbidity, and sacrificed if weight loss exceeded 20% of starting body mass. All procedures were approved by the OSU/UNL IACUC. Survival curves were plotted using Sigma Plot software.
Quantification and statistical analysis
The “survival” package in C57BL/6 and Stab KO mice were used to generate Kaplan-Meier survival curves and to test for group differences using a log-rank test. For statistical analysis, a two-tailed Student's t-test was used for each statistical comparison, and a p value (∗p < 0.05, ∗∗p < 0.001, ∗∗∗p < 0.0001) was considered significant. All analyses were run using GraphPad Prism 6 version.
Acknowledgments
This work is supported by NIH, United States grants AR066330 (to LPG), HL130864 (to ENH), AI146690, AI146252 (to MVSR), and HL150536 to XS. The authors are grateful to Dr. Clark L. Anderson and Dr. Mark D. Wewers for all the intellectual contributions and critical reading of the manuscript; Dr. Beth Schachter for editorial support in the preparation of the manuscript; Dr. Robert Munford and Dr. Mingfang Lu, Laboratory of Clinical Infectious Diseases, NIAID, NIH for radiolabeled (3H/14C) LPS and FITC LPS; Dr. Zhili Yao for the help with live cell microscopy and preparation of labeled LPS and HDL; James M. Turman for the help with ELISA during revision; Dr. Cyrill Géraud for the anti-Stab1 and Stab2 antibodies; and Dr. Sara Cole, Richard Montione, Brian Kemmenoe, and the staff at the OSU Campus Microscopy and Imaging Facility for training and advice.
Author contributions
F.C., M.A.-R., J.S., T.A.T., N.K., Q.W., E.P., X.S., and E.N.H. performed the experiments. P.F. and L.Y. performed the NanoString analysis and statistical analysis of NanoString data, respectively. J.M.R. (late), W.N.J., M.V.S.R., and E.N.H. made critical contributions to the design of the project. J.K. performed the kinetic analysis. M.V.S.R., E.N.H., and L.P.G. supervised the experiments and wrote the manuscript. All authors discussed, analyzed the results, and commented on the manuscript. L.P.G. conceptualized the project.
Declaration of interests
The authors declare no competing interests.
Published: November 19, 2021
Footnotes
Supplemental information can be found online at https://doi.org/10.1016/j.isci.2021.103337.
Supplemental information
Data and code availability
Data: All data reported in this paper will be shared by the lead contact upon request.
Code: This paper does not report original code. Any additional information required to reanalyze the data in this paper is available upon request from the lead contact.
References
- Aderem A., Ulevitch R.J. Toll-like receptors in the induction of the innate immune response. Nature. 2000;406:782–787. doi: 10.1038/35021228. [DOI] [PubMed] [Google Scholar]
- Anwar M.A., Shah M., Kim J., Choi S. Recent clinical trends in toll-like receptor targeting therapeutics. Med. Res. Rev. 2018;39:1053–1090. doi: 10.1002/med.21553. [DOI] [PMC free article] [PubMed] [Google Scholar]
- Aravindhan V., Mohan V., Arunkumar N., Sandhya S., Babu S. Chronic endotoxemia in subjects with type-1 diabetes is seen much before the onset of microvascular complications. PLoS One. 2015;10:e0137618. doi: 10.1371/journal.pone.0137618. [DOI] [PMC free article] [PubMed] [Google Scholar]
- Arias-Alpizar G., Koch B., Hamelmann N.M., Neustrup M.A., Paulusse J.M.J., Jiskoot W., Kros A., Bussmann J. Stabilin-1 is required for the endothelial clearance of small anionic nanoparticles. Nanomedicine. 2021;34:102395. doi: 10.1016/j.nano.2021.102395. [DOI] [PubMed] [Google Scholar]
- Berg R.D. The indigenous gastrointestinal microflora. Trends Microbiol. 1996;4:430–435. doi: 10.1016/0966-842x(96)10057-3. [DOI] [PubMed] [Google Scholar]
- Beutler B. Endotoxin, toll-like receptor 4, and the afferent limb of innate immunity. Curr. Opin. Microbiol. 2000;3:23–28. doi: 10.1016/s1369-5274(99)00046-6. [DOI] [PubMed] [Google Scholar]
- Bihl F., Larivière L., Qureshi S.T., Flaherty L., Malo D. LPS-hyporesponsiveness of mnd mice is associated with a mutation in Toll-like receptor 4. Genes Immun. 2001;2:56–59. doi: 10.1038/sj.gene.6363732. [DOI] [PubMed] [Google Scholar]
- Bowman J.D., Surani S., Horseman M.A. Endotoxin, toll-like receptor-4, and atherosclerotic heart disease. Curr. Cardiol. Rev. 2017;13:86–93. doi: 10.2174/1573403X12666160901145313. [DOI] [PMC free article] [PubMed] [Google Scholar]
- Cabral F., Miller C.M., Kudrna K.M., Hass B.E., Daubendiek J.G., Kellar B.M., Harris E.N. Purification of hepatocytes and sinusoidal endothelial cells from mouse liver perfusion. J. Vis. Exp. 2018;32:541. doi: 10.3791/56993. [DOI] [PMC free article] [PubMed] [Google Scholar]
- Caradonna L., Amati L., Magrone T., Pellegrino N.M., Jirillo E., Caccavo D. Enteric bacteria, lipopolysaccharides and related cytokines in inflammatory bowel disease: biological and clinical significance. J. Endotoxin Res. 2000;6:205–214. [PubMed] [Google Scholar]
- De C.A., Abe M., Lau A.H., Hackstein H., Raimondi G., Thomson A.W. Low TLR4 expression by liver dendritic cells correlates with reduced capacity to activate allogeneic T cells in response to endotoxin. J. Immunol. 2005;174:2037–2045. doi: 10.4049/jimmunol.174.4.2037. [DOI] [PubMed] [Google Scholar]
- Deng M., Scott M.J., Loughran P., Gibson G., Sodhi C., Watkins S., Hackam D., Billiar T.R. Lipopolysaccharide clearance, bacterial clearance, and systemic inflammatory responses are regulated by cell type-specific functions of TLR4 during sepsis. J. Immunol. 2013;190:5152–5160. doi: 10.4049/jimmunol.1300496. [DOI] [PMC free article] [PubMed] [Google Scholar]
- Engelhardt R., Mackensen A., Galanos C. Phase I trial of intravenously administered endotoxin (Salmonella abortus equi) in cancer patients. Cancer Res. 1991;51:2524–2530. [PubMed] [Google Scholar]
- Erridge C., Attina T., Spickett C.M., Webb D.J. A high-fat meal induces low-grade endotoxemia: evidence of a novel mechanism of postprandial inflammation. Am. J. Clin. Nutr. 2007;86:1286–1292. doi: 10.1093/ajcn/86.5.1286. [DOI] [PubMed] [Google Scholar]
- Feroze U., Kalantar-Zadeh K., Sterling K.A., Molnar M.Z., Noori N., Benner D., Shah V., Dwivedi R., Becker K., Kovesdy C.P., et al. Examining associations of circulating endotoxin with nutritional status, inflammation, and mortality in hemodialysis patients. J. Ren. Nutr. 2012;22:317–326. doi: 10.1053/j.jrn.2011.05.004. [DOI] [PMC free article] [PubMed] [Google Scholar]
- Frazier T.H., DiBaise J.K., McClain C.J. Gut microbiota, intestinal permeability, obesity-induced inflammation, and liver injury. JPEN J. Parenter. Enteral Nutr. 2011;35:14s–20s. doi: 10.1177/0148607111413772. [DOI] [PubMed] [Google Scholar]
- Freudenberg M.A., Galanos C. Bacterial lipopolysaccharides: structure, metabolism and mechanisms of action. Intern. Rev. Immunol. 1990;6:207–221. doi: 10.3109/08830189009056632. [DOI] [PubMed] [Google Scholar]
- Ganesan L.P., Kim J., Wu Y., Mohanty S., Phillips G.S., Birmingham D.J., Robinson J.M., Anderson C.L. FcgammaRIIb on liver sinusoidal endothelium clears small immune complexes. J. Immunol. 2012;189:4981–4988. doi: 10.4049/jimmunol.1202017. [DOI] [PMC free article] [PubMed] [Google Scholar]
- Gomes J.M.G., Costa J.A., Alfenas R.C.G. Metabolic endotoxemia and diabetes mellitus: a systematic review. Metabolism. 2017;68:133–144. doi: 10.1016/j.metabol.2016.12.009. [DOI] [PubMed] [Google Scholar]
- Guerville M., Boudry G. Gastrointestinal and hepatic mechanisms limiting entry and dissemination of lipopolysaccharide into the systemic circulation. Am. J. Physiol. Gastrointest. Liver Physiol. 2016;311:G1–G15. doi: 10.1152/ajpgi.00098.2016. [DOI] [PubMed] [Google Scholar]
- Guha M., Mackman N. LPS induction of gene expression in human monocytes. Cell. Signal. 2001;13:85–94. doi: 10.1016/s0898-6568(00)00149-2. [DOI] [PubMed] [Google Scholar]
- Guo Y., Zhou G., He C., Yang W., He Z., Liu Z. Serum levels of lipopolysaccharide and 1,3-beta-D-glucan refer to the severity in patients with Crohn's disease. Mediators Inflamm. 2015;2015:843089. doi: 10.1155/2015/843089. [DOI] [PMC free article] [PubMed] [Google Scholar]
- Guzman-Cottrill J.A., Cheesebrough B., Nadel S., Goldstein B. In: Principles and Practice of Pediatric Infectious Diseases. Fourth Edition. Long S.S., editor. Elsevier; 2012. 11 - the systemic inflammatory response syndrome (SIRS), sepsis, and septic shock; pp. 97–103.e104. [Google Scholar]
- Hampton R.Y., Golenbock D.T., Penman M., Krieger M., Raetz C.R. Recognition and plasma clearance of endotoxin by scavenger receptors. Nature. 1991;352:342–344. doi: 10.1038/352342a0. [DOI] [PubMed] [Google Scholar]
- Hansen B., Longati P., Elvevold K., Nedredal G.I., Schledzewski K., Olsen R., Falkowski M., Kzhyshkowska J., Carlsson F., Johansson S., et al. Stabilin-1 and stabilin-2 are both directed into the early endocytic pathway in hepatic sinusoidal endothelium via interactions with clathrin/AP-2, independent of ligand binding. Exp. Cell Res. 2005;303:160–173. doi: 10.1016/j.yexcr.2004.09.017. [DOI] [PubMed] [Google Scholar]
- Harris E.N., Cabral F. Ligand binding and signaling of HARE/stabilin-2. Biomolecules. 2019;9:273. doi: 10.3390/biom9070273. [DOI] [PMC free article] [PubMed] [Google Scholar]
- Harris E.N., Kyosseva S.V., Weigel J.A., Weigel P.H. Expression, processing, and glycosaminoglycan binding activity of the recombinant human 315-kDa hyaluronic acid receptor for endocytosis (HARE) J. Biol. Chem. 2007;282:2785–2797. doi: 10.1074/jbc.M607787200. [DOI] [PubMed] [Google Scholar]
- Harris E.N., Weigel J.A., Weigel P.H. Endocytic function, glycosaminoglycan specificity, and antibody sensitivity of the recombinant human 190-kDa hyaluronan receptor for endocytosis (HARE) J. Biol. Chem. 2004;279:36201–36209. doi: 10.1074/jbc.M405322200. [DOI] [PubMed] [Google Scholar]
- Harris E.N., Weigel J.A., Weigel P.H. The human hyaluronan receptor for endocytosis (HARE/Stabilin-2) is a systemic clearance receptor for heparin. J. Biol. Chem. 2008;283:17341–17350. doi: 10.1074/jbc.M710360200. [DOI] [PMC free article] [PubMed] [Google Scholar]
- Harris E.N., Weigel P.H. The ligand-binding profile of HARE: hyaluronan and chondroitin sulfates A, C, and D bind to overlapping sites distinct from the sites for heparin, acetylated low-density lipoprotein, dermatan sulfate, and CS-E. Glycobiology. 2008;18:638–648. doi: 10.1093/glycob/cwn045. [DOI] [PMC free article] [PubMed] [Google Scholar]
- Hauser A.B., Stinghen A.E., Goncalves S.M., Bucharles S., Pecoits-Filho R. A gut feeling on endotoxemia: causes and consequences in chronic kidney disease. Nephron Clin. Pract. 2011;118:c165–c172. doi: 10.1159/000321438. [DOI] [PubMed] [Google Scholar]
- Hirose Y., Saijou E., Sugano Y., Takeshita F., Nishimura S., Nonaka H., Chen Y.R., Sekine K., Kido T., Nakamura T., et al. Inhibition of Stabilin-2 elevates circulating hyaluronic acid levels and prevents tumor metastasis. Proc. Natl. Acad. Sci. U S A. 2012;109:4263–4268. doi: 10.1073/pnas.1117560109. [DOI] [PMC free article] [PubMed] [Google Scholar]
- Hollingsworth J.W., 2nd, Cook D.N., Brass D.M., Walker J.K., Morgan D.L., Foster W.M., Schwartz D.A. The role of Toll-like receptor 4 in environmental airway injury in mice. Am. J. Respir. Crit. Care Med. 2004;170:126–132. doi: 10.1164/rccm.200311-1499OC. [DOI] [PubMed] [Google Scholar]
- Hoshino K., Takeuchi O., Kawai T., Sanjo H., Ogawa T., Takeda Y., Takeda K., Akira S. Cutting edge: toll-like receptor 4 (TLR4)-deficient mice are hyporesponsive to lipopolysaccharide: evidence for TLR4 as the Lps gene product. J. Immunol. 1999;162:3749–3752. [PubMed] [Google Scholar]
- Jung M.Y., Park S.Y., Kim I.S. Stabilin-2 is involved in lymphocyte adhesion to the hepatic sinusoidal endothelium via the interaction with alphaMbeta2 integrin. J. Leukoc. Biol. 2007;82:1156–1165. doi: 10.1189/jlb.0107052. [DOI] [PubMed] [Google Scholar]
- Karikoski M., Marttila-Ichihara F., Elima K., Rantakari P., Hollmen M., Kelkka T., Gerke H., Huovinen V., Irjala H., Holmdahl R., et al. Clever-1/stabilin-1 controls cancer growth and metastasis. Clin. Cancer Res. 2014;20:6452–6464. doi: 10.1158/1078-0432.CCR-14-1236. [DOI] [PubMed] [Google Scholar]
- Kong X.N., Yan H.X., Chen L., Dong L.W., Yang W., Liu Q., Yu L.X., Huang D.D., Liu S.Q., Liu H., et al. LPS-induced down-regulation of signal regulatory protein {alpha} contributes to innate immune activation in macrophages. J. Exp. Med. 2007;204:2719–2731. doi: 10.1084/jem.20062611. [DOI] [PMC free article] [PubMed] [Google Scholar]
- Kubiak J., Brewer J., Hansen S., Bagatolli L. Lipid lateral organization on giant unilamellar vesicles containing lipopolysaccharides. Biophys. J. 2011;100:978–986. doi: 10.1016/j.bpj.2011.01.012. [DOI] [PMC free article] [PubMed] [Google Scholar]
- Kwon M., Yeo S.C., Lee J.S., Park J.J. Not CD68 but stabilin-1 expression is associated with the risk of recurrence in patients with oral cavity squamous cell carcinoma. Head Neck. 2019;41:2058–2064. doi: 10.1002/hed.25654. [DOI] [PubMed] [Google Scholar]
- Kzhyshkowska J. Multifunctional receptor stabilin-1 in homeostasis and disease. Sci. World J. 2010;10:2039–2053. doi: 10.1100/tsw.2010.189. [DOI] [PMC free article] [PubMed] [Google Scholar]
- Kzhyshkowska J., Gratchev A., Brundiers H., Mamidi S., Krusell L., Goerdt S. Phosphatidylinositide 3-kinase activity is required for stabilin-1-mediated endosomal transport of acLDL. Immunobiology. 2005;210:161–173. doi: 10.1016/j.imbio.2005.05.022. [DOI] [PubMed] [Google Scholar]
- Kzhyshkowska J., Mamidi S., Gratchev A., Kremmer E., Schmuttermaier C., Krusell L., Haus G., Utikal J., Schledzewski K., Scholtze J., et al. Novel stabilin-1 interacting chitinase-like protein (SI-CLP) is up-regulated in alternatively activated macrophages and secreted via lysosomal pathway. Blood. 2006;107:3221–3228. doi: 10.1182/blood-2005-07-2843. [DOI] [PubMed] [Google Scholar]
- Larionova I., Tuguzbaeva G., Ponomaryova A., Stakheyeva M., Cherdyntseva N., Pavlov V., Choinzonov E., Kzhyshkowska J. Tumor-associated macrophages in human breast, colorectal, lung, ovarian and prostate cancers. Front. Oncol. 2020;10:566511. doi: 10.3389/fonc.2020.566511. [DOI] [PMC free article] [PubMed] [Google Scholar]
- Lequier L.L., Nikaidoh H., Leonard S.R., Bokovoy J.L., White M.L., Scannon P.J., Giroir B.P. Preoperative and postoperative endotoxemia in children with congenital heart disease. Chest. 2000;117:1706–1712. doi: 10.1378/chest.117.6.1706. [DOI] [PubMed] [Google Scholar]
- Li R., McCourt P., Schledzewski K., Goerdt S., Moldenhauer G., Liu X., Smedsrød B., Sørensen K.K. Endocytosis of advanced glycation end-products in bovine choriocapillaris endothelial cells. Microcirculation. 2009;16:640–655. doi: 10.1080/10739680903133185. [DOI] [PubMed] [Google Scholar]
- Maiseyeu A., Yang H.Y., Ramanathan G., Yin F., Bard R.L., Morishita M., Dvonch J.T., Wang L., Spino C., Mukherjee B., et al. No effect of acute exposure to coarse particulate matter air pollution in a rural location on high-density lipoprotein function. Inhal. Toxicol. 2014;26:23–29. doi: 10.3109/08958378.2013.850761. [DOI] [PMC free article] [PubMed] [Google Scholar]
- Mathison J.C., Ulevitch R.J. The clearance, tissue distribution, and cellular localization of intravenously injected lipopolysaccharide in rabbits. J. Immunol. 1979;123:2133–2143. [PubMed] [Google Scholar]
- Miller C.M., Donner A.J., Blank E.E., Egger A.W., Kellar B.M., Østergaard M.E., Seth P.P., Harris E.N. Stabilin-1 and Stabilin-2 are specific receptors for the cellular internalization of phosphorothioate-modified antisense oligonucleotides (ASOs) in the liver. Nucleic Acids Res. 2016;44:2782–2794. doi: 10.1093/nar/gkw112. [DOI] [PMC free article] [PubMed] [Google Scholar]
- Miller C.M., Xu Y., Kudrna K.M., Hass B.E., Kellar B.M., Egger A.W., Liu J., Harris E.N. 3-O sulfation of heparin leads to hepatotropism and longer circulatory half-life. Thromb. Res. 2018;167:80–87. doi: 10.1016/j.thromres.2018.05.018. [DOI] [PMC free article] [PubMed] [Google Scholar]
- Mimura Y., Sakisaka S., Harada M., Sata M., Tanikawa K. Role of hepatocytes in direct clearance of lipopolysaccharide in rats. Gastroenterology. 1995;109:1969–1976. doi: 10.1016/0016-5085(95)90765-3. [DOI] [PubMed] [Google Scholar]
- Munford R.S. Endotoxemia-menace, marker, or mistake? J. Leukoc. Biol. 2016;100:687–698. doi: 10.1189/jlb.3RU0316-151R. [DOI] [PMC free article] [PubMed] [Google Scholar]
- Opal S.M., Scannon P.J., Vincent J.L., White M., Carroll S.F., Palardy J.E., Parejo N.A., Pribble J.P., Lemke J.H. Relationship between plasma levels of lipopolysaccharide (LPS) and LPS-binding protein in patients with severe sepsis and septic shock. J. Infect Dis. 1999;180:1584–1589. doi: 10.1086/315093. [DOI] [PubMed] [Google Scholar]
- Ospelt C., Gay S. TLRs and chronic inflammation. Int. J. Biochem. Cell. Biol. 2010;42:495–505. doi: 10.1016/j.biocel.2009.10.010. [DOI] [PubMed] [Google Scholar]
- Pasternak B.A., D'Mello S., Jurickova I.I., Han X., Willson T., Flick L., Petiniot L., Uozumi N., Divanovic S., Traurnicht A., et al. Lipopolysaccharide exposure is linked to activation of the acute phase response and growth failure in pediatric Crohn's disease and murine colitis. Inflamm. Bowel Dis. 2010;16:856–869. doi: 10.1002/ibd.21132. [DOI] [PMC free article] [PubMed] [Google Scholar]
- Pempe E.H., Xu Y., Gopalakrishnan S., Liu J., Harris E.N. Probing structural selectivity of synthetic heparin binding to Stabilin protein receptors. J. Biol. Chem. 2012;287:20774–20783. doi: 10.1074/jbc.M111.320069. [DOI] [PMC free article] [PubMed] [Google Scholar]
- Piya M.K., Harte A.L., McTernan P.G. Metabolic endotoxaemia: is it more than just a gut feeling? Curr. Opin. Lipidol. 2013;24:78–85. doi: 10.1097/MOL.0b013e32835b4431. [DOI] [PubMed] [Google Scholar]
- Poltorak A., He X., Smirnova I., Liu M., Van Huffel C., Du X., Birdwell D., Alejos E., Silva M., Galanos C., et al. Defective LPS signaling in C3H/HeJ and C57BL/10ScCr mice: mutations in Tlr4 gene. Science. 1998;282:2085–2088. doi: 10.1126/science.282.5396.2085. [DOI] [PubMed] [Google Scholar]
- Praaning-van Dalen D.P., Brouwer A., Knook D.L. Clearance capacity of rat liver Kupffer, endothelial, and parenchymal cells. Gastroenterology. 1981;81:1036–1044. [PubMed] [Google Scholar]
- Qureshi S.T., Larivière L., Leveque G., Clermont S., Moore K.J., Gros P., Malo D. Endotoxin-tolerant mice have mutations in Toll-like receptor 4 (Tlr4) J. Exp. Med. 1999;189:615–625. doi: 10.1084/jem.189.4.615. [DOI] [PMC free article] [PubMed] [Google Scholar]
- Riabov V., Yin S., Song B., Avdic A., Schledzewski K., Ovsiy I., Gratchev A., Llopis Verdiell M., Sticht C., Schmuttermaier C., et al. Stabilin-1 is expressed in human breast cancer and supports tumor growth in mammary adenocarcinoma mouse model. Oncotarget. 2016;7:31097–31110. doi: 10.18632/oncotarget.8857. [DOI] [PMC free article] [PubMed] [Google Scholar]
- Ruiter D.J., van der Meulen J., Brouwer A., Hummel M.J.R., Bauw B.J., van der Ploeg J.C.M., Wisse E. Uptake by liver cells of endotoxin following its intravenous injection. Lab. Invest. 1981;45:38–45. [PubMed] [Google Scholar]
- Schneider C.A., Rasband W.S., Eliceiri K.W. NIH Image to ImageJ: 25 years of image analysis. Nat. Methods. 2012;9:671–675. doi: 10.1038/nmeth.2089. [DOI] [PMC free article] [PubMed] [Google Scholar]
- Shao B., Lu M., Katz S.C., Varley A.W., Hardwick J., Rogers T.E., Ojogun N., Rockey D.C., Dematteo R.P., Munford R.S. A host lipase detoxifies bacterial lipopolysaccharides in the liver and spleen. J. Biol. Chem. 2007;282:13726–13735. doi: 10.1074/jbc.M609462200. [DOI] [PubMed] [Google Scholar]
- Sharma R., Bolger A.P., Li W., Davlouros P.A., Volk H.D., Poole-Wilson P.A., Coats A.J., Gatzoulis M.A., Anker S.D. Elevated circulating levels of inflammatory cytokines and bacterial endotoxin in adults with congenital heart disease. Am. J. Cardiol. 2003;92:188–193. doi: 10.1016/s0002-9149(03)00536-8. [DOI] [PubMed] [Google Scholar]
- Shetty S., Lalor P.F., Adams D.H. Liver sinusoidal endothelial cells - gatekeepers of hepatic immunity. Nat. Rev. Gastroenterol. Hepatol. 2018;15:555–567. doi: 10.1038/s41575-018-0020-y. [DOI] [PMC free article] [PubMed] [Google Scholar]
- Silverman M.H., Ostro M.J. Bacterial Endotoxin in Human Disease, e-Book. BioStrategics Consulting 2013; NJ, USA: 2013. Bacterial endotoxin in human disease; pp. 1–35. [Google Scholar]
- Stevens B.R., Goel R., Seungbum K., Richards E.M., Holbert R.C., Pepine C.J., Raizada M.K. Increased human intestinal barrier permeability plasma biomarkers zonulin and FABP2 correlated with plasma LPS and altered gut microbiome in anxiety or depression. Gut. 2018;67:1555–1557. doi: 10.1136/gutjnl-2017-314759. [DOI] [PMC free article] [PubMed] [Google Scholar]
- Thieblemont N., Wright S.D. Transport of bacterial lipopolysaccharide to the golgi apparatus. J. Exp. Med. 1999;190:523–534. doi: 10.1084/jem.190.4.523. [DOI] [PMC free article] [PubMed] [Google Scholar]
- Topchiy E., Cirstea M., Kong H.J., Boyd J.H., Wang Y., Russell J.A., Walley K.R. Lipopolysaccharide is cleared from the circulation by hepatocytes via the low density lipoprotein receptor. PLoS One. 2016;11:e0155030. doi: 10.1371/journal.pone.0155030. [DOI] [PMC free article] [PubMed] [Google Scholar]
- Triantafilou K., Triantafilou M., Fernandez N. Lipopolysaccharide (LPS) labeled with Alexa 488 hydrazide as a novel probe for LPS binding studies. Cytometry. 2000;41:316–320. [PubMed] [Google Scholar]
- Tulkens J., Vergauwen G., Van D.J., Geeurickx E., Dhondt B., Lippens L., De Scheerder M.A., Miinalainen I., Rappu P., De Geest B.G., et al. Increased levels of systemic LPS-positive bacterial extracellular vesicles in patients with intestinal barrier dysfunction. Gut. 2018;69:191–193. doi: 10.1136/gutjnl-2018-317726. [DOI] [PMC free article] [PubMed] [Google Scholar]
- Turman J.M., Cheplowitz A.M., Tiwari C., Thomas T., Joshi D., Bhat M., Wu Q., Pong E., Chu S.Y., Szymkowski D.E., et al. Accelerated clearance and degradation of cell-free hiv by neutralizing antibodies occurs via fcgammariib on liver sinusoidal endothelial cells by endocytosis. J. Immunol. 2021;206:1284–1296. doi: 10.4049/jimmunol.2000772. [DOI] [PMC free article] [PubMed] [Google Scholar]
- Uhde M., Ajamian M., Caio G., De G.R., Indart A., Green P.H., Verna E.C., Volta U., Alaedini A. Intestinal cell damage and systemic immune activation in individuals reporting sensitivity to wheat in the absence of coeliac disease. Gut. 2016;65:1930–1937. doi: 10.1136/gutjnl-2016-311964. [DOI] [PMC free article] [PubMed] [Google Scholar]
- Uhrig A., Banafsche R., Kremer M., Hegenbarth S., Hamann A., Neurath M., Gerken G., Limmer A., Knolle P.A. Development and functional consequences of LPS tolerance in sinusoidal endothelial cells of the liver. J. Leukoc. Biol. 2005;77:626–633. doi: 10.1189/jlb.0604332. [DOI] [PubMed] [Google Scholar]
- Ulevitch R.J., Johnston A.R. The modification of biophysical and endotoxic properties of bacterial lipopolysaccharides by serum. J. Clin. Invest. 1978;62:1313–1324. doi: 10.1172/JCI109252. [DOI] [PMC free article] [PubMed] [Google Scholar]
- Vacha J. Blood volume in inbred strain BALB/c, CBA/J and C57BL/10 mice determined by means of 59Fe-labelled red cells and 59Fe bound to transferrin. Physiol. Bohemoslov. 1975;24:113–119. [PubMed] [Google Scholar]
- Van L.P., Kwappenberg K.M., Groeneveld P.H., Mattie H., van Dissel J.T. Antibiotic-induced lipopolysaccharide (LPS) release from Salmonella typhi: delay between killing by ceftazidime and imipenem and release of LPS. Antimicrob. Agents Chemother. 1998;42:739–743. doi: 10.1128/aac.42.4.739. [DOI] [PMC free article] [PubMed] [Google Scholar]
- Warren H.S., Chedid L.A. Strategies for the treatment of endotoxemia: significance of the acute-phase response. Rev. Infect Dis. 1987;9:S630–S638. doi: 10.1093/clinids/9.supplement_5.s630. [DOI] [PubMed] [Google Scholar]
- Weigel P.H. Systemic glycosaminoglycan clearance by HARE/stabilin-2 activates intracellular signaling. Cells. 2020;9:2366. doi: 10.3390/cells9112366. [DOI] [PMC free article] [PubMed] [Google Scholar]
- Wiedermann C.J., Kiechl S., Dunzendorfer S., Schratzberger P., Egger G., Oberhollenzer F., Willeit J. Association of endotoxemia with carotid atherosclerosis and cardiovascular disease: prospective results from the Bruneck Study. J. Am. Coll. Cardiol. 1999;34:1975–1981. doi: 10.1016/s0735-1097(99)00448-9. [DOI] [PubMed] [Google Scholar]
- Wiedermann C.J., Kiechl S., Schratzberger P., Dunzendorfer S., Weiss G., Willeit J. The role of immune activation in endotoxin-induced atherogenesis. J. Endotoxin Res. 2001;7:322–326. [PubMed] [Google Scholar]
- Wu J., Meng Z., Jiang M., Zhang E., Trippler M., Broering R., Bucchi A., Krux F., Dittmer U., Yang D., et al. Toll-like receptor-induced innate immune responses in non-parenchymal liver cells are cell type-specific. Immunology. 2010;129:363–374. doi: 10.1111/j.1365-2567.2009.03179.x. [DOI] [PMC free article] [PubMed] [Google Scholar]
- Yao Z., Mates J.M., Cheplowitz A.M., Hammer L.P., Maiseyeu A., Phillips G.S., Wewers M.D., Rajaram M.V., Robinson J.M., Anderson C.L., et al. Blood-borne lipopolysaccharide is rapidly eliminated by liver sinusoidal endothelial cells via high-density lipoprotein. J. Immunol. 2016;197:2390–2399. doi: 10.4049/jimmunol.1600702. [DOI] [PMC free article] [PubMed] [Google Scholar]
- Yin S.P., Gao Y., Xie X.S., Xu D.D., Riabov V., Du W.D. Accumulation of stabilin-1 positive macrophages in the early stage of gastric cancer is associated with short cumulative survival. Oncol. Lett. 2020;19:2404–2412. doi: 10.3892/ol.2020.11310. [DOI] [PMC free article] [PubMed] [Google Scholar]
- Zarember K.A., Godowski P.J. Tissue expression of human Toll-like receptors and differential regulation of Toll-like receptor mRNAs in leukocytes in response to microbes, their products, and cytokines. J. Immunol. 2002;168:554–561. doi: 10.4049/jimmunol.168.2.554. [DOI] [PubMed] [Google Scholar]
Associated Data
This section collects any data citations, data availability statements, or supplementary materials included in this article.
Supplementary Materials
Data Availability Statement
Data: All data reported in this paper will be shared by the lead contact upon request.
Code: This paper does not report original code. Any additional information required to reanalyze the data in this paper is available upon request from the lead contact.