

Abstract
The pyruvate kinase M2 isoform (PKM2) is preferentially expressed in cancer cells to regulate anabolic metabolism. Although PKM2 was recently reported to regulate lipid homeostasis, the molecular mechanism remains unclear. Herein, we discovered an ER transmembrane protein 33 (TMEM33) as a downstream effector of PKM2 that regulates activation of SREBPs and lipid metabolism. Loss of PKM2 leads to up‐regulation of TMEM33, which recruits RNF5, an E3 ligase, to promote SREBP‐cleavage activating protein (SCAP) degradation. TMEM33 is transcriptionally regulated by nuclear factor erythroid 2‐like 1 (NRF1), whose cleavage and activation are controlled by PKM2 levels. Total plasma cholesterol levels are elevated by either treatment with PKM2 tetramer‐promoting agent TEPP‐46 or by global PKM2 knockout in mice, highlighting the essential function of PKM2 in lipid metabolism. Although depletion of PKM2 decreases cancer cell growth, global PKM2 knockout accelerates allografted tumor growth. Together, our findings reveal the cell‐autonomous and systemic effects of PKM2 in lipid homeostasis and carcinogenesis, as well as TMEM33 as a bona fide regulator of lipid metabolism.
Keywords: PKM2, SCAP degradation, TMEM33, total cholesterol levels, tumor growth
Subject Categories: Cancer, Metabolism, Signal Transduction
Transmembrane protein TMEM33 is a novel target of ER‐localised PKM2 and regulator of cholesterol metabolism.

Introduction
Dysregulation of glucose and lipid homeostasis causes metabolic syndromes as well as increases the risk of developing cancer. While normal cells absorb lipids from the circulatory system, cancer cells boost lipid biosynthesis to meet increasing demand for biomass production to support rapid growth (Medes et al, 1953). Many cancers increase lipid uptake, storage, and lipogenesis (Beloribi‐Djefaflia et al, 2016). Both clinical and experimental studies have supported that hypercholesterolemia and a high‐fat diet (HFD) accelerate cancer development (Llaverias et al, 2011; Pelton et al, 2014; Ding et al, 2019). However, how lipid and glucose metabolism are precisely regulated in cancer cells remains incompletely understood.
Sterol regulatory element binding proteins (SREBPs) are key transcriptional factors that control lipogenesis and lipid uptake. SREBPs regulate essentially all genes involved in the synthesis and uptake of cholesterol, fatty acids, triglycerides, and phospholipids, representing a critical link between oncogenic signaling and tumor metabolism (Guo et al, 2014). There are two SREBP genes in mammalian cells, encoding three SREBP proteins, designated as SREBP1a, SREBP1c, and SREBP2. While SREBP1a is a potent activator of all SREBP‐responsive genes, SREBP1c and SREBP2 preferentially activate fatty acid synthesis and cholesterol synthesis, respectively (Horton et al, 2002). Newly synthesized SREBPs are held inactive on the endoplasmic reticulum (ER) membrane by associating with SREBP‐cleavage activating protein (SCAP). When cellular sterol levels are sufficient, SCAP restrains SREBP on ER by interacting with insulin‐induced genes (INSIGs). When sterol levels drop, SCAP escorts SREBPs from the ER to the Golgi for proteolytic cleavage to release the active SREBPs, which then translocate to the nucleus to activate gene expression. Although the availability of cellular cholesterol and its derived oxysterols are crucial for the cleavage of SREBPs, which act as a negative feedback mechanism (Spann & Glass, 2013), cellular pathways regulating INSIGs and SCAP protein stability have been shown to affect the activation of SREBPs. Posttranslational modifications, including phosphorylation of INSIGs (Xu et al, 2020), and N‐glycosylation (Cheng et al, 2015) and ubiquitination (Zhang et al, 2017) of SCAP, were shown to regulate activation of SREBPs. For example, degradation of SCAP could lead to retention of inactivated SREBP precursors on the ER, thus inhibiting lipid synthesis (Zhang et al, 2017).
Glucose and lipid metabolism are often rewired in cancers to promote tumor growth and metastasis (Dang, 2012; Brault & Schulze, 2016; Cheng et al, 2018). However, the molecular mechanism coupling these processes remains unclear. Pyruvate kinase (PK) is the enzyme that catalyzes the last step of glycolysis by converting phosphoenolpyruvate (PEP) to pyruvate. PK has four different subtypes: M1, M2, L, and R. The PKL isoform is expressed primarily in the liver, and the PKR isoform is mainly expressed in red blood cells. The PKM gene encodes PKM1 and PKM2 through alternative splicing of mutually exclusive exons (Noguchi et al, 1986). Whereas PKM1 is expressed in differentiated cell types, PKM2 is highly expressed in tissues including the lung, intestines, and brain and is the predominant form in proliferative cells, including cancers (Dayton et al, 2016a). PKM2 regulates anabolic metabolism of cancer cells (Wong et al, 2015). Switching from PKM2 to PKM1, or inhibiting PKM2 methylation, results in switching from aerobic glycolysis to oxidative phosphorylation, and reduces tumor formation in nude mice (Christofk et al, 2008; Liu et al, 2017). A recent study showed that PKM2 could activate target genes of SREBPs through interacting with nuclear SREBP1a in HepG2 cells (Zhao et al, 2018). These results collectively support that PKM2 metabolic regulation provides a growth advantage to cancer cells, thus rendering PKM2 a potential therapeutic cancer target. However, loss of PKM2 was also shown to accelerate mammary tumor formation in the Brca1fl/fl MMTV‐Cre Trp53+/− mouse model (Israelsen et al, 2013). Moreover, PKM2 −/− mice developed hepatic steatosis and late‐onset spontaneous hepatocellular carcinoma (HCC) and were more sensitive to HFD treatment (Dayton et al, 2016a). These contradictory phenotypes of PKM2 in tumorigenesis prompted us to investigate the roles of PKM2 in regulating systemic metabolism in breast cancer cell lines and animal models using comprehensive metabolomics, genomics, and proteomics approaches.
In this study, we discovered TMEM33, an ER transmembrane protein, as a downstream effector of PKM2 that regulates SREBP activation and lipid metabolism. Depletion of PKM2 resulted in increased level of TMEM33, which interacts with ubiquitin ligase RNF5 to promote SCAP degradation. We further revealed that TMEM33 is transcriptionally regulated by nuclear factor erythroid 2‐like 1 (NRF1, also known as NFE2L1), and NRF1 cleavage and activation are potentiated by PKM2 depletion. The lipid regulatory function of PKM2 is important for tumor growth in vivo because systemic knockout of PKM2 resulted in elevated plasma cholesterol levels and promoted allografted tumor growth. The increased plasma cholesterol levels provide an explanation of the phenotype of the systemic PKM2 KO mice, which is characterized by liver steatosis and HCC. Our findings not only enhance the understanding of the mechanism underlying PKM2 in SREBP activation, but also reveal the cell‐autonomous and systemic effects of PKM2 in lipid homeostasis and carcinogenesis, highlighting the complexity of targeting PKM2 in pathological conditions.
Results
Loss of PKM2 affects cellular lipid metabolism
To assess the global effects of PKM2 in cell metabolism, we performed metabolomic analyses in PKM2‐deficient MCF7, MDA‐MB‐231, and mouse embryonic fibroblast (MEF) cells relative to their counterparts (Table EV1). Sub‐pathway analyses showed that PKM2 knockout (KO) dysregulated several intracellular metabolism pathways. Fatty acid metabolism (β‐oxidation), in particular, was the most significantly and consistently altered pathway across the three PKM2 KO cell lines (Fig 1A and B, Appendix Fig S1A and B). We previously reported that specific PKM2 KO enhanced mitochondrial membrane potential and the TCA cycle in breast cancer cell lines (Liu et al, 2017). However, levels of metabolites involved in fatty acid β‐oxidation, such as carnitine, acetyl carnitine, and acyl carnitine, were drastically decreased in PKM2‐deficient MCF7, MDA‐MB‐231, and MEF cells (Fig 1C and Appendix Fig S1C). Moreover, the levels of long‐chain fatty acids were significantly decreased, whereas the levels of acetyl‐CoA were slightly increased in breast cancer PKM2 KO cell lines (Fig 1D and E). Reduced fatty acid β‐oxidation (FAO) and long‐chain fatty acid might be attributed to lipid synthesis deficiency. Indeed, both total cellular cholesterol levels and lipid droplet accumulation were reduced in PKM2 KO breast cancer cell lines (Fig 1F and G). These data suggest that loss of PKM2 profoundly affects lipid metabolism.
Figure 1. Lipid metabolism pathways are impaired in PKM2 deficient cells.
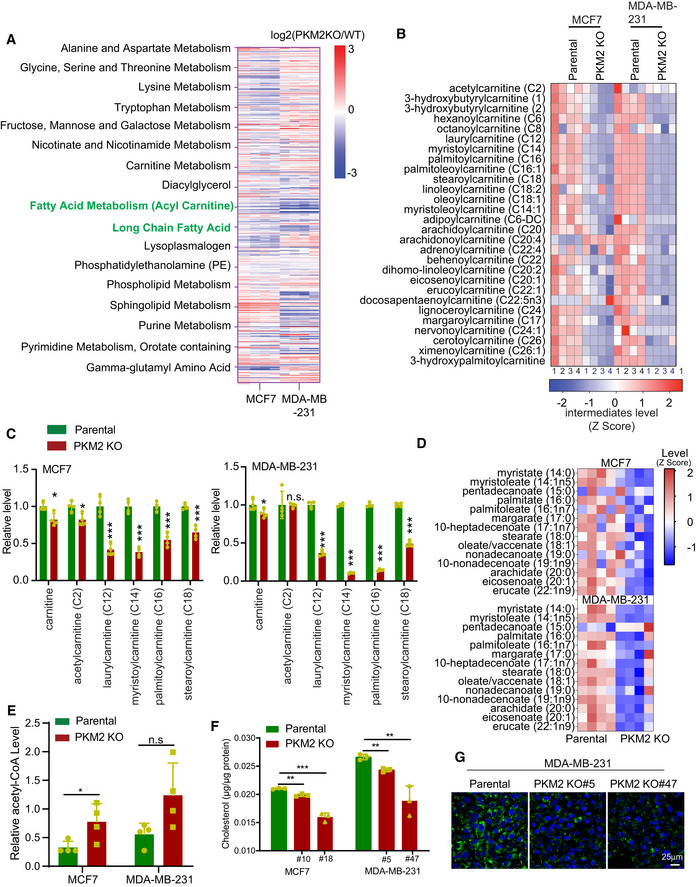
- Heatmap showing the altered metabolic pathways in PKM2 KO MCF7 and MDA‐MB‐231 cells relative to the parental cells (n = 4). Fatty acid metabolism (Acyl Carnitine) and long‐chain fatty acid pathways were significantly changed in both cell lines.
- Heatmap showing the differential fatty acid β‐oxidation pathway metabolite levels between PKM2 KO MCF7 and MDA‐MB‐ 231 cells, and their respective parental counterparts (n = 4).
- Decreased levels of free carnitine and modified carnitine species in PKM2 KO cell lines as compared with their parental counterparts (n = 4).
- Heatmap showing the decreased levels of long‐chain fatty acids in PKM2 KO cell lines relative to their parental counterparts (n = 4).
- Increased acetyl‐CoA in PKM2 KO MCF7 and MDA‐MB 231 cells as compared with their parental counterparts (n = 4).
- Decreased total cholesterol in PKM2 KO MCF7 and MDA‐MB 231 cells as compared with their parental counterparts (n = 3).
- Confocal imaging of neutral lipid droplets stained with BODIPY493/503 or Nile red dye in PKM2 KO cells relative to the parental cells. Data represent one of three independent experiments with similar results. Scale bar, 25 μm.
Data information: Data are displayed (C, E and F) as means ± SD. Statistical significance was assessed using two‐tailed Student’s t‐test, *P < 0.05, **P < 0.01 and ***P < 0.001. n.s means no significance.
Source data are available online for this figure.
SREBPs activation is impaired in PKM2 KO breast cancer cells
Decreased fatty acid β‐oxidation and intracellular lipid abundance in PKM2 KO cells (Fig 1) imply that the lipid synthesis pathway is impaired in PKM2 KO cells. To test this hypothesis, we compared the gene expression profiles of PKM2‐deficient MDA‐MB‐231 and MCF7 cells to their parental counterparts using RNA‐seq. Differential gene expression analyses identified 269 and 504 significantly up‐regulated and 204 and 289 significantly down‐regulated genes in MDA‐MB‐231 and MCF7 PKM2 KO cells compared with their parental cells (≥ 2‐fold, adjusted P < 0.05, Figs 2A and EV1A, Table EV2), respectively. Cholesterol homeostasis, activation of gene expression by SREBP, and fatty acid metabolism were among the top down‐regulated pathways in PKM2 KO breast cancer cell lines as compared to parental cells (Figs 2B and C, and EV1B and C). Importantly, HMG‐CoA reductase (HMGCR), cytochrome P450 family 51 subfamily A member 1 (CYP51A1), farnesyl‐diphosphate farnesyltransferase 1 (FDFT1), fatty acid synthase (FASN) and acetyl‐CoA carboxylase alpha (ACACA), essential enzymes in the cholesterol, and fatty acid synthesis pathways, were decreased in PKM2 KO cells (Fig 2D), and these results were validated by qRT‐PCR in PKM2 KO MCF7 and MDA‐MB‐231 cell lines (Fig EV1D and E). Since most of these genes are regulated by SREBPs, these results indicate that PKM2 affects lipid synthesis via regulating SREBP activation. This is supported by proteomics data where 190 and 237 significantly up‐ and down‐regulated proteins were identified in MDA‐MB‐231 PKM2 KO cells as compared to the WT counterparts, respectively (≥ 1.5‐fold, adjusted P ≤ 0.05, Fig 2E and Table EV3). Ingenuity pathway analysis (IPA) revealed that cholesterol synthesis was the top pathway affected by knocking out PKM2 (Fig EV1F). Similar results were observed comparing the PKM2‐deficient MCF7 cells with parental cells (Liu et al, 2017). Surprisingly, although only about 10% of the total proteins affected by knocking out PKM2 between MCF7 and MDA‐MB‐231 cells overlapped, the shared down‐regulated proteins were linked to cholesterol synthesis and are targets of SREBPs (Fig 2F). The decreased expression of SREBP target genes, including HMGCR, FASN, low‐density lipoprotein receptor (LDLR), FDFT1, and isopentenyl‐diphosphate delta isomerase 1 (IDI1) in PKM2 KO breast cancer cell lines, was verified by Western blotting (Fig 2G). These results collectively suggest that knocking out PKM2 in breast cancer cell lines results in the decreased expression of genes involved in lipid synthesis by impairing SREBP activation, the canonical pathway controlling lipid synthesis, and uptake.
Figure 2. SREBP activation is impaired in PKM2 KO breast cancer cells.

- Heatmap showing the differential gene expression patterns between MDA‐MB‐231 PKM2 KO and parental cells (n = 3).
- Gene set enrichment analysis of the top enriched gene signatures associated with PKM2 knockout in (A). Hallmark 50 gene sets and KEGG 186 gene sets were used for this analysis.
- Decreased cholesterol homeostasis signature in MDA‐MB‐231 PKM2 KO cells. Cholesterol homeostasis signature was generated by GSEA (v4.1.0) with adjusted P‐value and normalized enrichment score (NES).
- Heatmap showing the differentially expressed genes related to cholesterol homeostasis in PKM2 KO versus parental MDA‐MB‐231 cells (n = 3).
- Volcano plot showing proteomic changes in PKM2 KO versus parental MDA‐MB‐231 cells. Blue triangle symbol indicated PKM2 level; TMEM33, PKM1, and RNF5 were labeled in red dots. Horizontal dashed line indicated P‐value 0.05 and vertical dashed lines indicated 2‐fold cutoff (n = 3).
- Correlation of PKM2 deficiency‐induced protein changes between MCF7 and MDA‐MB‐231 cells. Green highlights down‐regulated lipid‐related proteins. PKM1, TMEM33, OCIAD2, and TIMM8A were up‐regulated and highlighted in red dots.
- Western blot analysis of TMEM33, ABCA1, SREBP1, HMGCR, SCAP, FASN, LDLR, FDFT1, I DI1, RNF5, INSIG 1 and 2, and calnexin in PKM2 KO MCF7 and MDA‐MB‐231 cells, and their respective parental cells. Arrow indicates nuclear SREBP1. P: precursor, N: nuclear.
Source data are available online for this figure.
Figure EV1. PKM2 deficiency results in decreased lipid synthesis in breast cancer cells.

- Heatmap showing differential gene expression profiling in PKM2 KO versus wild‐type MCF7 cells (n = 3).
- Gene set enrichment analysis of the top enriched signatures affected by PKM2 KO in MCF7. Hallmark 50 gene sets and KEGG 186 gene sets were used for this analysis.
- The cholesterol homeostasis signature was decreased by knocking out PKM2 in MCF7 cells. Adjusted P‐value and normalized enrichment score (NES) were generated by GSEA.
- Decreased expression of lipid synthetic genes in PKM2 KO MCF7 cells analyzed by qRT‐PCR (n = 3).
- Decreased expression of lipid synthetic genes in PKM2 KO MDA‐MB‐231 cells analyzed by qRT‐PCR (n = 3).
- Ingenuity pathway analysis (IPA) of proteins affected by PKM2 KO in MDA‐MB‐231 cells in Fig 2F. Cholesterol synthesis pathways were highlighted in red.
Data information: Data are displayed (D and E) as means ± SD. Statistical significance was assessed using two‐tailed Student’s t‐test, *P < 0.05, **P < 0.01 and ***P < 0.001.Source data are available online for this figure.
TMEM33 is the downstream effector of PKM2 controlling lipid metabolism gene expression
We next examined the activation of SREBP1 in PKM2 KO breast cancer cell lines. Indeed, SREBP1 nuclear accumulation decreased in PKM2 KO cells (Fig 3A), as measured by immunofluorescence staining (Fig 3B) and Western blot (Figs 2G and 3C). Moreover, we observed decreased SCAP levels in PKM2 KO cells (Fig 2G), suggesting that the reduction of nuclear SREBP1 and decreased expression of SREBP1 target genes may be attributed to the loss of SCAP in PKM2 KO breast cancer cell lines. Under sterol‐replete conditions, SREBP precursors are held in the ER through interacting with SCAP. A recent report has shown that PKM2 could interact with ER ribosomes and translate ER destined mRNA (Simsek et al, 2017). Indeed, we could detect PKM2 in the immunoprecipitates of sec61β, a known ER marker protein (Fig EV2A), suggesting that ER‐localized PKM2 may regulate SCAP stability. To test this possibility, we sought ER membrane proteins regulated by PKM2 and identified TMEM33, an ER membrane protein, was among the up‐regulated proteins in PKM2 KO MCF7 and MDA‐MB‐231 cell lines (Fig 2F and G). TMEM33 has been reported as a stress‐inducible ER transmembrane protein which modulates the unfolded protein response (UPR) (Sakabe et al, 2015). A recent study showed that TMEM33 was positively correlated with serum triglyceride levels (Parker et al, 2019). Similar to PKM2, TMEM33 co‐immunoprecipitated with sec61β (Fig EV2B). To exclude the possibility that the elevated levels of TMEM33 are caused by complementary expression of PKM1, we knocked down (KD) PKM and restored the expression of either PKM1 or PKM2. Restoration of PKM2, but not PKM1, could reduce the elevated TMEM33 expression in PKM KD MCF7 cells (Fig EV2C). To directly test whether TMEM33 mediated the effects of PKM2 on lipid metabolism, we knocked down TMEM33 expression in PKM2 KO breast cancer cell lines. The results showed that TMEM33 KD in PKM2 KO cell lines restored nuclear SREBP1, SCAP, and IDI1 levels (Fig 3D). Consequently, the levels of total cholesterol and lipid droplets (LDs) (Fig EV2D and E), cell proliferation, and migration were partially rescued (Fig 3E and F), indicating that TMEM33 is an essential effector of PKM2, although we cannot exclude other effectors in mediating PKM2’s functions in lipid metabolism. In addition, exogenous expression of TMEM33 in MCF7 cells significantly inhibited cell proliferation (Fig EV2F and G). These results suggest that the decreased lipogenic gene expression and associated growth‐inhibiting effects in PKM2 KO cancer cells are at least partially attributed to the increased levels of TMEM33. To examine whether TMEM33 overexpression (OE) resembles the effects of knocking out PKM2 on lipogenic gene expression, we generated a stable TMEM33 OE MDA‐MB‐231 cell line (pooled), as well as selected two clones expressing high levels of TMEM33. Decreased SREBP1 cleavage and decreased levels of SCAP, HMGCR, LDLR, FDFT1, and IDI1 were observed in the TMEM33 OE pooled cells as well as the two individual clones (Fig 3G). To substantiate the functional roles of TMEM33 in lipid homeostasis, we compared the gene expression profile of a TMEM33 OE clone to that of control cells using RNA‐seq. Gene set enrichment analysis (GSEA) showed that cholesterol homeostasis and fatty acid metabolism were among the top down‐regulated pathways in MDA‐MB‐231 TMEM33 OE cells (Fig 3H and I, Table EV4). Moreover, the differential gene expression profiles between PKM2 KO and TMEM33 OE cell lines were positively correlated (Fig 3J). Notably, the mRNAs of genes related to cholesterol homeostasis were decreased in both PKM2 KO and TMEM33 OE cells (Fig 3J). We next examined the proteomic changes induced by TMEM33 OE via mass spectrometry. MDA‐MB‐231 TMEM33 OE cells elicited 217 significantly up‐regulated proteins and 429 significantly down‐regulated proteins as compared to the control cells (≥ 1.5‐fold, adjusted P < 0.05, Fig EV2H and Table EV5). Many proteins related to cholesterol and fatty acid synthesis were decreased in TMEM33 OE cells (Fig EV2H and I). Furthermore, concordant changes at the protein levels were observed between PKM2 KO and TMEM33 OE cells. For example, lipid‐related proteins down‐regulated in TMEM33 OE cells were also reduced in PKM2 KO cells (Fig 3K). Taken together, our results strongly suggest that TMEM33 is a downstream effector of PKM2 to restrain PKM2 from activating SREBPs.
Figure 3. TMEM33 is the downstream effector of PKM2 controlling lipid metabolism gene expression.

-
AImmunofluorescence of SREBP1 in MCF7 parental and PKM2 KO cells by confocal imaging. Scale bar, 5 μm.
-
BQuantitation of nuclear SREBP1 intensity in A. n ≥ 25 cells as in (A) from three different fields.
-
CWestern blot analyses of nuclear and cytoplasmic SREBP1 levels in parental and two PKM2 KO clones. PCNA serves as a nuclear protein loading control.
-
DWestern blot analyses of TMEM33, RNF5, SCAP, SREBP1, and IDI1 in PKM2 KO MCF7 and MDA‐MB‐231 cells stably transfected with shControl (shCtrl) or shTMEM33 constructs. Arrow indicates nuclear SREBP1, N: nucleus and P: precursor.
-
ECell proliferation assays of the PKM2 KO MCF7 cells stably transfected with shCtrl or shTMEM33 constructs (n = 3). shCtrl: shControl.
-
FCell migration assays of PKM2 KO MDA‐MB‐231 cells stably transfected with shCtrl or shTMEM33 constructs (n = 3). Scale bars, 50 µm.
-
GWestern blot analysis of TMEM33, RNF5, SCAP, SREBP1, HMGCR, LDLR, FDFT1, IDI1, and PKM2 in wild type, PKM2 KO, TMEM33 OE (pool), and two TMEM33OE clones (clones #1 and #8) MDA‐MB‐231 cells. Arrow indicates nuclear SREBP1. N: nucleus and P: precursor.
-
H, IGene set enrichment analysis of the top enriched gene signatures (H), including (I) Cholesterol homeostasis signature in MDA‐MB‐231 TMEM33 OE (#1) cells using KEGG and hallmark gene sets in GSEA databases. Adjusted P‐value and normalized enrichment score (NES) were generated by GSEA.
-
JVolcano plot showing the altered transcripts induced by TMEM33 OE (clone #1) (P < 0.05) and PKM2 KO (P < 0.05) in MDA‐MB‐231 cells. Green depicts shared down‐regulated genes by both TMEM33 OE and PKM2 KO; red depicts shared up‐regulated genes by both TMEM33 OE and PKM2 KO. Variance analysis (ANOVA) was used to calculate the P‐value.
-
KVolcano plot showing protein changes induced by TMEM33 OE (P < 0.05) and PKM2 KO (P < 0.05) in MDA‐MB‐231 cells. TMEM33 labeled in red dot was up‐regulated in both TMEM33 OE and PKM2 KO cells and PKM2 labeled in purple had no change in TMEM33 OE cells. ANOVA was used to calculate the P‐value.
Data information: Data are displayed (B and E) as means ± SD. Statistical significance was assessed using two‐tailed Student’s t‐test, *P < 0.05 and ***P < 0.001.
Source data are available online for this figure.
Figure EV2. The PKM2‐TMEM33 axis regulates cholesterol and fatty acid synthesis‐related gene expression.

- Co‐immunoprecipitation of endogenous PKM2 and sec61β in MCF7 cells treated with DMSO or 20 µM TEPP‐46.
- Reciprocal co‐immunoprecipitation of TMEM33 and sec61β in MCF7 cells. TMEM33 and sec61β were detected by western blotting.
- TMEM33 expression is regulated by PKM2, not PKM1, in MCF7 cells. MCF7 cells were stably transfected with a shRNA targeting PKM 3′ untranslated region (UTR) to eliminate endogenous PKM. Either PKM1 or PKM2 was restored using a retroviral expression system. A scramble shRNA vector was used as a control (shCtrl).
- Knocking down TMEM33 led to increased total cholesterol in PKM2 KO MDA‐MB 231 cells (n = 3).
- Knocking down TMEM33 led to increased lipid droplets in PKM2 KO MDA‐MB 231 cells. A representative confocal imaging data from three independent experiments is shown. Scale bar, 25 µm.
- Western blotting of TMEM33 in MCF7 cells stably expressing control (Ctrl) or FLAG‐TMEM33 vectors. Exo. denotes exogenous and endo. denotes endogenous.
- Cell growth curves of MCF7 cells stably transfected with Ctrl or FLAG‐TMEM33 vectors (n = 4).
- Volcano plot showing the proteome changes induced by TMEM33 OE (#1) relative to control in MDA‐MB‐231 cells (n = 3). Two‐tailed Student’s t‐test was used to calculate the P‐value. TMEM33 level was up‐regulated and marked in red.
- Down‐regulation of cholesterol homeostasis (upper panel) and fatty acid metabolism (lower panel) signatures in TMEM33 OE (#1) MDA‐MB‐231 cells relative to the control cells. Proteomics data in panel (I) were used to extract gene signature. Adjusted P‐value and normalized enrichment score (NES) were generated by GSEA.
Data information: Data are displayed (D and G) as means ± SD. Statistical significance was assessed using two‐tailed Student’s t‐test, *P < 0.05 and **P < 0.01.Source data are available online for this figure.
TMEM33‐RNF5 axis negatively regulates SCAP protein stability
To decipher how the increased levels of TMEM33 lead to SREBP1 inactivation, we focused on SCAP, a chaperone of SREBPs whose levels were reduced in MDA‐MB‐231 PKM2 KO and TMEM33 OE cells (Figs 2G and 3G). Because SCAP stability is known to be regulated by the ubiquitin‐proteasome pathway (Zhang et al, 2017), we postulated that TMEM33 may regulate SCAP degradation. Indeed, overexpression of TMEM33 triggered polyubiquitination of SCAP (Fig 4A), consistent with the decreased SCAP protein levels in the TMEM33 OE clones (Fig 3G). The inverse relationship between TMEM33 and SCAP protein levels is not cancer cell specific, as increased TMEM33 and decreased SCAP levels were also observed in immortalized 4‐hydroxytamoxifen (4‐OHT)‐inducible PKM2‐KO (PKM2fl/fl, Cre‐ERT2) MEF cells upon depletion of PKM2 by 4‐OHT treatment (Fig 4B). We found a high concordant expression pattern between TMEM33 and ring finger protein 5 (RNF5), a membrane‐anchored E3 ubiquitin‐protein ligase that has been implicated in ER‐associated protein degradation (ERAD) (Tcherpakov et al, 2009). RNF5 levels positively correlated with TMEM33 expression levels in both TMEM33 OE and KD cell lines (Figs 3D and G, and 4B), implying that TMEM33 might engage RNF5 to promote SCAP ubiquitination. There is multiple evidence supporting that TMEM33 could form a triple complex with RNF5 and SCAP. First, both SCAP and RNF5 were co‐immunoprecipitated with FLAG‐tagged TMEM33 in MCF7 and HEK 293T cells (Fig 4C and Appendix Fig S2A). Second, endogenous TMEM33, RNF5, and SCAP co‐immunoprecipitated in MDA‐MB‐231 cells (Fig 4D). Third, direct interaction between TMEM33 and RNF5 was detected by proximity ligation assay in MDA‐MB‐231 cells (Fig 4E). Fourth, in vitro translated FLAG‐tagged TMEM33 and HA‐tagged RNF5 directly interacted (Fig 4F). Fifth, both the long form and the more stable Δ29–400 aa short isoform (SF) of SCAP could interact with TMEM33 and RNF5 in vitro (Appendix Fig S2B), suggesting that amino acids 29–400 of SCAP are not required for TMEM33/RNF5 interaction. However, neither INSIG1 nor SREBP1/2 proteins immunoprecipitated with RNF5 in cell lysates (Appendix Fig S2C). Importantly, overexpression of RNF5 increased polyubiquitination of SCAP (Fig 4G), suggesting that RNF5 is the ubiquitin E3 ligase for SCAP. Collectively, our results support the model that TMEM33 forms a triple complex with RNF5 and SCAP, and RNF5 facilitates polyubiquitination of SCAP on the ER membrane.
Figure 4. TMEM33 recruits RNF5 to promote SCAP polyubiquitination.

- Increased SCAP polyubiquitination in TMEM33‐transfected HEK293T cells. 293T cells were transiently transfected with Halo‐tagged TMEM33 for 18 h followed by treatment with MG‐132 for 3 h.
- Western blot analysis of PKM2, PKM1, NRF1, TMEM33, RNF5, and SCAP levels in MEF (PKM2fl/fl, Cre‐ERT2) cells treated with 4‐OHT in a time course experiment.
- Co‐immunoprecipitation of endogenous SCAP and RNF5 in Flag‐tagged TMEM33 stably expressed MCF7 cells. SEC61β is an ER protein, which is found to interact with TMEM33.
- Reciprocal co‐immunoprecipitation of TMEM33 and RNF5 in MDA‐MB‐231 cells. TMEM33, RNF5, and SCAP were detected by Western blotting.
- Proximity ligation assays of TMEM33 and RNF5 in MDA‐MB‐231 cells using confocal imaging. NC means negative control. Scale bar, 10 μm.
- Interaction between in vitro translated TMEM33 and RNF5. FLAG‐tagged vector or TMEM33 and HA‐tagged RNF5 were expressed using an in vitro transcriptional and translational kit, followed by FLAG antibody pull‐down.
- Increased polyubiquitination of SCAP in RNF5‐transfected HEK293 cells. 293T cells were transiently transfected HA‐tagged RNF5 for 18 h followed by MG‐132 treatment for 3 h. Arrow indicates HA‐tagged RNF5.
- RNF5 is involved in TMEM33‐mediated SCAP polyubiquitination in 293T cells. 293T cells were stably transfected with shCtrl or shRNF5 constructs; then, the indicated plasmids were co‐transfected into shCtrl or shRNF5 expressing 293T cells for 18 h followed by MG‐132 treatment for 8 h. FLAG M2 beads were used for pull‐down.
- The relative binding affinity of FLAG‐tagged full‐length and truncated SCAP proteins with endogenous TMEM33 and RNF5. The band intensity of TMEM33 and RNF5 in Appendix Fig S2D was quantified and normalized with the FLAG control. SCAP protein encompasses eight transmembrane (TM) helices in N terminus (TM 2‐6: sterol‐sensing domain) and a WD40 domain in C terminus with total of 1,279 aa.
- The relative binding affinity of HA‐tagged full‐length and truncated TMEM33 with endogenous SCAP and RNF5. The band intensity of SCAP and RNF5 in Appendix Fig S2E was quantified and normalized to the HA control. TMEM33 protein encompasses three transmembrane (TM) helices in N terminus and a C‐terminal cytosolic domain with a total of 247 aa.
Source data are available online for this figure.
To test whether RNF5 is required for increased SCAP degradation in TMEM33 overexpressed cells, we knocked down RNF5 and measured SCAP degradation in TMEM33 overexpressed cells. Our results showed that TMEM33 overexpression promoted polyubiquitination of SCAP, and this effect was abrogated when RNF5 was knocked down (Fig 4H). We went on to map the respective interacting domains of SCAP, TMEM33, and RNF5 using the truncated proteins. First, we constructed truncation constructs of Flag‐tagged SCAP and Halo‐tagged TMEM33‐HA. The immunoprecipitation experiments narrowed aa 280–445 of the sterol‐sensing domain (SSD) of SCAP as the main region that interacted with TMEM33 (Fig 4I and Appendix Fig S2D). Since the short SCAP isoform (Δ29–400 aa) was able to bind to TMEM33 (Appendix Fig S2B), we deduced that aa 401–445 of SSD in SCAP is likely responsible for TMEM33 interaction. Not surprisingly, RNF5 also bound to aa 401–445 of SCAP (Fig 4I and Appendix Fig S2D). Second, we employed truncated TMEM33 proteins to map the domain that interact with SCAP and RNF5. Although both SCAP and RNF5 interact with full‐length TMEM33, we were unable to identify a single domain that was sufficient for RNF5 binding, implying that RNF5 may interact with multiple domains of TMEM33. On the contrary, amino acids 177–247 in the cytoplasmic domain of TMEM33 were found to interact with SCAP (Fig 4J and Appendix Fig S2E). These biochemical studies further support that TMEM33 recruits RNF5 to promote SCAP polyubiquitination.
Consistent with the reduced level of SCAP in PKM2 KO cells, the lysine 48‐linked SCAP polyubiquitination was increased in PKM2 KO (Fig 5A). Using cycloheximide to inhibit new protein synthesis, decreased SCAP half‐life was observed in PKM2 KO cells as compared to parental cells (Fig 5B). These results implicate that PKM2 KO induced SCAP degradation through ubiquitin‐proteasome pathway. To investigate whether SCAP degradation is promoted by RNF5, we measured the lysine 48‐linked SCAP polyubiquitination level upon RNF5 overexpression in HEK 293T cells. Indeed, RNF5 elevated K48 linked SCAP polyubiquitination (Fig EV3A). As shown in Fig 2G, RNF5 is expressed at higher level in MDA‐MB‐231 than MCF7 cells. We knocked down (KD) RNF5 in MDA‐MB‐231 cells followed by measuring lipogenesis gene expression by qRT‐PCR. The results showed that RNF5 KD dramatically increased expression of several lipid synthesis genes (Fig EV3B). To investigate whether depletion of RNF5 in PKM2 KO cells could rescue SCAP level and lipid synthesis gene expression, RNF5 was knocked down in PKM2 KO MDA‐MB‐231 cells. The results showed that RNF5 KD increased SCAP level (Figs EV3C and 5C). As the result, SREBP1 activity was partially rescued (Fig 5D). To further confirm that RNF5 negatively regulates SCAP, we overexpressed RNF5 in MCF7 cells, which have low level of endogenous RNF5. RNF5 OE decreased SCAP level (Figs EV3D and 5E). As expected, lipid synthesis genes and cell proliferation were decreased in RNF5 OE MCF7 cells (Fig 5F and G). Collectively, both gain‐ and loss‐of‐function approaches support that TMEM33‐RNF5 axis leads to sequestration of SREBP1 on the ER membrane, and inhibition of SREBP activation and lipid‐related gene expression.
Figure 5. RNF5 promotes SCAP degradation in breast cancer cells.

- Lysine 48 linked polyubiquitinated SCAP levels in parental and PKM2 KO MDA‐MB‐231 cells.
- SCAP‐GFP stability in parental and PKM2 KO MDA‐MB‐231 cells (n = 5). Cells stably expressing SCAP‐GFP were treated with cycloheximide (CHX). GFP signal was measured at the indicated time.
- Western blot analyses of RNF5 and SCAP in shCtrl and shRNF5 PKM2 KO MDA‐MB‐231 cells.
- qRT‐PCR analyses of selected SREBPs downstream genes in shCtrl and shRNF5 PKM2 KO MDA‐MB‐231 cells (n = 3).
- Western blot analyses of RNF5, SCAP, and IDI1 in Ctrl and HA‐RNF5 OE MCF7 cells.
- qRT‐PCR analyses of SREBPs downstream genes in Ctrl and HA‐RNF5 OE MCF7 cells (n = 3).
- Cell proliferation of Ctrl and HA‐RNF5 OE MCF7 cells measured by MTT assays (n = 8).
Data information: Data are displayed (B, D, F, and G) as means ± SD. Statistical significance was assessed using two‐tailed Student’s t‐test, *P < 0.05, **P < 0.01, and ***P < 0.001.
Source data are available online for this figure.
Figure EV3. RNF5 promotes K48 linked SCAP ubiquitination and reduces SCAP stability.

- Increased K48 linked polyubiquitination of SCAP in RNF5‐transfected HEK293 cells. 293T cells were transiently transfected FLAG‐SCAP, V5‐tagged RNF5, and HA‐tagged ubiquitin (WT or K48) for 18 h followed by incubation with MG‐132 for 8 h. UbK48 depicts a mutant Ub with all the Ks mutated to R, except for K48.
- qRT‐PCR analyses of several SREBPs downstream genes in MDA‐MB‐231 cells expressing shCtrl or shRNF5 (n = 3). Data are displayed as means ± SD. Statistical significance was assessed using two‐tailed Student’s t‐test, **P < 0.01 and ***P < 0.001.
- SCAP stability measured by Western blotting in PKM2 KO MDA‐MB‐231 cells expressing shCtrl and shRNF5 treated with cycloheximide for the indicated time.
- SCAP stability measured by Western blotting in MCF7 cells expressing Ctrl and HA‐RNF5 vectors treated with cycloheximide for the indicated time.
TMEM33 is transcriptionally regulated by NRF1, whose cleavage and activation depend on the PKM2/VCP axis on ER membrane
The robust increase of TMEM33 levels in PKM2 KO breast cancer cells and MEFs (Figs 3F and 4B) prompts us to investigate the underlying mechanism. A recent study has reported an NRF1 binding peak in the promoter region of TMEM33 (Baird et al, 2017). NRF1 is a transcription factor which needs to be cleavage‐activated by valosin‐containing protein (VCP) (Radhakrishnan et al, 2014; Widenmaier et al, 2017). Notably, the cleaved NRF1 was increased in PKM2‐deficient breast cancer cell lines (Fig 6A). NRF1 is known to either activate and repress gene expression (Biswas & Chan, 2010). Although few NRF1 target genes have been identified thus far, several confirmed (Baird et al, 2017) and putative NRF1 target genes based on eGFP‐NRF1 ChIP‐seq data in ENCODE (GSE91934) were up‐ or down‐regulated in MCF7 PKM2 KO cells relative to parental cells (Fig EV4A). Notably, two NRF1‐specific target genes, MT1 and MT2 (Ohtsuji et al, 2008), were up‐regulated in MDA‐MB‐231 PKM2 KO cells (Fig 6B), indicating the activated status of NRF1 in PKM2 KO MDA‐MB‐231 cells. Similar result was obtained for MT2 in MCF7 PKM2 KO cells, although MT1 was not detectable in MCF7 cells (Fig EV4B). To directly examine the transcriptional regulation of TMEM33 by NRF1, we cloned the TMEM33 promoter region encompassing the putative antioxidant response element (ARE) motif in a luciferase reporter construct. The results showed that NRF1 potentiated the activity of TMEM33 promoter, and the reporter activity was significantly decreased by deletion of the ARE motif (Fig 6C). In accordance with this finding, significant amount of NRF1 was detected near TMEM33 promoter by ChIP‐qPCR assays in MCF7 cells and increased NRF1 enrichment on TMEM33 promoter was observed in PKM2 KO cells (Fig 6D). Moreover, overexpression of NRF1 resulted in increased TMEM33 (Fig 6E) and NRF1 KD resulted in decreased TMEM33 expression (Fig 6F). These data suggest that PKM2 KO triggers the activation of the NRF1 pathway, which promotes TMEM33 expression in breast cancer cell lines.
Figure 6. PKM2/VCP/RNF1 axis regulated TMEM33 expression.

- Western blot analyses of NRF1, TMEM33, and PKM2. The two bands of NRF1 denote precursor and cleaved NRF1.
- The relative mRNA expression levels of TMEM33, RNF5, MT1A, and MT2A in parental and PKM2 KO MDA‐MB‐231 cells (n = 3).
- Regulation of TMEM33 promoter with or without an ARE motif by NRF1 in luciferase assays in 293T cells (n = 3).
- Recruitment of NRF1 to TMEM33 promoter analyzed by ChIP‐qPCR in parental and PKM2 KO MCF7 cells. IgG was used as a negative control. NRF1 enrichment on the TMEM33 promoter region was normalized to IgG control (n = 3).
- Western blot analyses of TMEM33 and RNF5 in NRF1 overexpressed MCF7 clones.
- Western blot analyses of TMEM33 and RNF5 in shCtrl and shNRF1 PKM2 KO MCF7 cells.
- Co‐immunoprecipitation of VCP with FLAG‐tagged PKM1/2 in PKM2 KO 293T cells. FLAG‐tagged PKM1 or PKM2 construct was transiently transfected into PKM2 KO or parental 293T cells for 24 h, followed by pull‐down using FLAG‐M2 beads. PKM1, PKM2, and VCP antibodies were used for immunoblotting.
- Decreased VCP and PKM2 in vitro interaction by treatment with TEPP‐46.
- TEPP‐46 treatment attenuates accumulation of polyubiquitinated proteins by NMS‐873 detected with anti‐Ub Western blot. MCF7 cells were treated with DMSO, NMS873 (5 μM), TEPP‐46 (10 μM), or NMS873 (5 μM) plus TEPP‐46 (10 μM) for 7 h followed by co‐treatment with cycloheximide (CHX, 50 μg/ ml) for 1 h.
- Western blotting of VCP, NRF1, TMEM33, and PKM2 in MCF7 treated with TEPP‐46 for 24 h.
- A schematic diagram depicting the regulation of lipogenesis by PKM2. ER located PKM2 inhibits VCP activity, which is essential for NRF1 precursor cleavage. Cleaved NRF1 acts as a transcriptional factor for TMEM33. ER‐localized TMEM33 inhibits SREBPs activity through promoting SCAP degradation in RNF5‐dependent manner. Knocking out PKM2 leads to increased NRF1 cleavage and TMEM33 expression. Consequentially, SCAP is destabilized by RNF5‐mediated ubiquitination and expression levels of lipid synthetic genes are decreased.
Data information: Data are displayed (B‐D) as means ± SD. Statistical significance was assessed using two‐tailed Student’s t‐test, **P < 0.01 and ***P < 0.001.
Source data are available online for this figure.
Figure EV4. TMEM33 is transcriptionally regulated by NRF1, whose cleavage and activation were mediated by VCP on ER membrane in breast cancer cell lines.

-
ANRF1 target genes were up‐ or down‐regulated in PKM2 KO MCF7 cells. Data were from MCF7 PKM2 KO RNA‐seq dataset (n = 1).
-
BThe relative mRNA levels of TMEM33 and MT2 in parental and PKM2 KO MCF7 cells (n = 3).
-
CMapping the interaction domains in VCP that binds to PKM2. Halo‐tagged full‐length or truncated VCP‐HA were transiently transfected into 293T cells for 24 h. Halo linkTM resins were used to pull down full‐length or truncated VCP along with associated proteins. TEV enzyme was used to release the VCP‐HA and its truncations from the resin. Then, full‐length or truncated VCP and PKM2 were analyzed by Western blotting using HA and PKM2 antibodies, respectively.
-
D, EWestern blotting of VCP and PKM2 in parental or PKM2 KO breast cancer cell lines after NMS‐873 treatment for 3 h.
-
FWestern blotting of NRF1 and TMEM33 after 3‐h NMS‐873 treatment in parental or PKM2 KO MCF7 cells.
-
GProximity ligation assays detecting interaction between PKM2 and VCP in MDA‐MB‐231 cells. Cells were treated with TEPP‐46 (10 µM) for 24 h, and representative confocal imaging data from one of the three independent experiments are shown. Scale bar 10 µm.
-
HMeasurement of the VCP activity by Ub‐GFP reporter assays. GFP intensities in MCF7 cells stably expressing UbG76V‐GFP fusion protein were measured after treatment with DMSO, NMS873 (5 μM), TEPP‐46 (10 μM), or NMS873 (5 μM) plus TEPP‐46 (10 μM) for 8 h (n = 8).
-
IWestern blotting of NRF1 in MCF7 cells treated with TEPP‐46 or TEPP‐46 plus NMS‐873.
Data information: Data are displayed (B and H) as means ± SD. Statistical significance was assessed using two‐tailed Student’s t‐test, *P < 0.05 and ***P < 0.001.Source data are available online for this figure.
Because NRF1 activation depends on cleavage by VCP, also known as transitional endoplasmic reticulum ATPase or p97, we next investigated whether PKM2 level affected VCP level or activity. We found that PKM2, but not PKM1, could bind to VCP (Fig 6G). The PKM2 interacting domain on VCP was mapped to the ATPase D2 domain (Fig EV4C), which is essential for VCP‐mediated ubiquitin‐fusion degradation substrate (UbG76V‐GFP) degradation (Blythe et al, 2017). Depletion of PKM2 had little effect on VCP expression (Fig EV4D and E), implying that the increased NRF1 cleavage in PKM2 KO cells is likely due to the increased VCP activity. Conversely, a selective VCP inhibitor NMS‐873 treatment had no effect on PKM2 level (Fig EV4D and E), although NRF1 cleavage was found decreased (Fig EV4F). In addition to knocking out PKM2, we modulated PKM2 activity by employing TEPP‐46, a PKM2 activator that promotes PKM2 tetramer formation, followed by measuring PKM2‐VCP interaction and VCP activity. TEPP‐46 treatment dramatically inhibited the interaction between PKM2 and VCP (Figs 6H and EV4G), and partially rescue VCP activity inhibited by NMS‐873 as indicated by polyubiquitinated protein accumulation (Fig 6I) or in UbG76V‐GFP reporter assay (Fig EV4H). These results suggest that only the dimer form of PKM2 inhibits VCP activity. Either knockdown of PKM2 or promoting PKM2 tetramer formation could result in release of repression and enhanced VCP activity. The TEPP‐46 induced VCP activation prompts us to further investigate if TEPP‐46 also elicits an effect on NRF1 cleavage, thus altering TMEM33 expression. Figure 6J shows that TEPP‐46 treatment increased NRF1 cleavage and TMEM33 expression, in agreement with the elevated VCP activity. As expected, NMS‐873 abrogated the TEPP‐46‐promoted NRF1 cleavage (Fig EV4I). Collectively, our results demonstrate that PKM2 interacts with VCP and restrains VCP activity, and PKM2‐VCP interaction can be attenuated by TEPP‐46 treatment. Depletion of PKM2 or inducing PKM2 tetramer formation results in sequential VCP activation, NRF1 cleavage, and increased TMEM33 transcription (Fig 6K).
TMEM33 positively regulates total plasma cholesterol in vivo
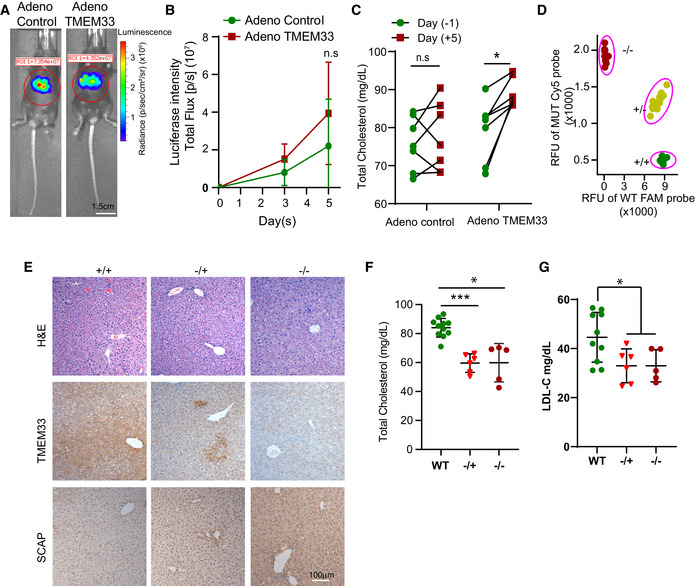
To delineate the function of TMEM33 in regulating plasma cholesterol levels, we took gain‐of‐function and loss‐of‐function approaches. First, we transduced TMEM33 adenovirus in mice (Appendix Fig S7A), which has been used to elevate expression of genes in the liver (Parker et al, 2019). As shown in Fig 7A and B, the compatible amounts of luciferase‐expressing viruses with and without TMEM33 expression were successfully delivered to mice. Transient induction of TMEM33 in liver resulted in a significant increase of total plasma cholesterol levels (Fig 7C), but did not cause liver damage (Appendix Fig S7B and C). To further explore the role of TMEM33 in vivo, we obtained a CRISPR/Cas9‐based heterozygote TMEM33+/− mouse model from the Knockout Mouse Phenotyping Program (KOMP2) at The Jackson Laboratory. The TMEM33 gene harbors a 453‐bp deletion in exon 3 and a single‐bp (A) insertion at the deletion site, which is predicted to generate a TMEM33 truncated protein after residue 15. Genotyping confirmed that one and two TMEM33 alleles were modified (Fig 7D) and IHC staining confirmed the reduction of TMEM33 in livers of homo‐ and heterozygous KO mice (Fig 7E), while no liver damage was detected by histology (Fig 7E). Notably, TMEM33 homo‐ and heterozygous KO mice displayed significantly reduced total plasma cholesterol and low‐density lipoprotein cholesterol levels (LDL‐C) (Fig 7F and G). Collectively, these results suggest that TMEM33 is a bona fide regulator of plasma cholesterol levels.
Figure 7. TMEM33 expression is positively correlated with plasma cholesterol levels in mice.
-
ARepresentative images from the Adeno vector control and TMEM33‐expressing groups. Scale bar, 1.5 cm.
-
BTime course of bioluminescent intensity of the mice injected with a control adenovirus and TMEM33‐expressing adenovirus (n = 7).
-
CThe total serum cholesterol levels in mice before and after control adenovirus and TMEM33‐expressing adenovirus injection on days −1 and 5 (n = 7).
-
DGenotyping of CRISPR/Cas9 generated TMEM33 knockout mice using fluorescent probes for PCR. FAM+, Cy5− indicates the TMEM33 +/+ genotype; FAM+, Cy5+ indicates the TMEM33 +/− genotype; and FAM−, Cy5+ indicates the TMEM33−/− genotype (n ≥ 5).
-
ERepresentative H&E and IHC staining images of TMEM33 and SCAP in WT and TMEM33 KO mouse livers. Scale bars, 100 µm.
-
F, GSignificant decrease of total plasma cholesterol (F) and LDL‐C (G) levels in TMEM33 −/− and +/− mice relative to WT counterparts (n ≥ 5).
Data information: Data are displayed (B, C, F, and G) as means ± SD. Statistical significance was assessed using two‐tailed Student’s t‐test, *P < 0.05 and ***P < 0.001. n.s denotes no significance.
Source data are available online for this figure.
Systemic PKM2 KO increases total cholesterol levels and promotes allograft tumor growth in vivo
Increased lipid uptake, storage, and lipogenesis in cancers contribute to rapid tumor growth (Mullen et al, 2016). Germline loss of PKM2 in mice causes HCC (Dayton et al, 2016a). To investigate the role of PKM2 in lipid metabolism in vivo, we employed an inducible systemic PKM2 KO mouse model (Israelsen et al, 2013) (Fig EV5A). Total cholesterol and LDL‐C levels in plasma were elevated in systemic PKM2 knockout mice relative to the WT mice (Fig 8A). The elevation of plasma lipid levels in systemic PKM2 knockout mice provides an explanation of the liver steatosis and HCC phenotypes observed in systemic PKM2 knockout mice.
Figure EV5. PKM2 regulates cholesterol homeostasis in vitro and in vivo .

- Genotyping detects the deletion of PKM2 in PKM2fl/fl; Cre‐ERT2 mice by treatment of tamoxifen on days 1, 3, 5, 7, and 9.
- qRT‐PCR analyses of several lipid synthetic genes in parental py8119 cells and two PKM2 KO clones (n = 3).
- Western blotting of PKM2, TMEM33, HMGCR, and FASN in two different PKM2 KO clones relative to parental py8119 cells.
- Decreased total cholesterol in two PKM2 KO clones relative to parental py8119 cells (n = 3).
- Tumor growth curves of py8119 allografts in systemic PKM2 KO or WT mice treated with DMSO or pitavastatin (n ≥ 5).
- Quantification of the averaged tumor weights in (E) (n ≥ 5).
- Decreased LDL‐C levels in PKM2 KO or WT mice by treating with pitavastatin (n = 5).
- Western blotting of SCAP and TMEM33 in allografted tumors from vehicle or TEPP‐46 treated mice groups.
Data information: Data are displayed (B, D, and E‐G) as means ± SD. Statistical significance was assessed using two‐tailed Student’s t‐test, *P < 0.05, **P < 0.01 and ***P < 0.001.Source data are available online for this figure.
Figure 8. Systemic inhibition of PKM2 in vivo increases serum cholesterol levels and promotes allografted tumor growth.

- Systemic PKM2KO results in increased total plasma cholesterol and LDL‐C levels in mice (n = 8).
- Tumor growth curves of PKM2 WT or KO py8119 cell line allografts in systemic PKM2 KO or WT mice (n = 5).
- Quantification of the averaged tumor weights in (B) (n = 5).
- TEPP‐46 treatment increased total plasma cholesterol and LDL‐C levels in mice (n = 8).
- The growth curves of py8119 allografts treated with vehicle and TEPP‐46 (50 mg/kg) for 17 days in mice (n = 7).
- Tumor weights of PKM2 WT py8119 allografts treated with vehicle or TEPP‐46 (n = 7).
Data information: Data are displayed (A‐F) as means ± SD. Statistical significance was assessed using a two‐tailed Student’s t‐test, *P < 0.05, **P < 0.01 and ***P < 0.001.
Source data are available online for this figure.
Circulating cholesterol has been shown to accelerate tumor formation, lung metastasis, and tumor angiogenesis in a MMTV‐PyMT transgenic mouse model (Llaverias et al, 2011). Therefore, we used MMTV‐PyMT‐derived Py8119 breast cancer cells for tumor allografts in C57BL/6 WT or systemic PKM2 knockout mice. To discern the cell‐autonomous and systemic effects of PKM2 in tumor growth, we implanted PKM2 KO or WT Py8119 cells in WT or systemic PKM2 knockout mice, respectively. Like human breast cancer cells, PKM2 KO in Py8119 resulted in decreased expression of lipogenic genes and total cholesterol (Fig EV5B–D). Comparison of allografted tumor growth in the four groups of mice can distinguish between the cell‐autonomous and systemic effects of PKM2 in tumor growth. PKM2 KO Py8119 cells grew very slowly in vivo, regardless of the host PKM2 status, suggesting that expression of PKM2 in cancer cells is essential for tumor growth. Interestingly, the tumor growth of parental py8119 cells was much faster in systemic PKM2 knockout mice as compared with that in WT mice, suggesting that systemic PKM2 KO promoted tumor growth. Nonetheless, systemic PKM2 KO failed to promote tumor growth in PKM2 KO Py8119 cells (Fig 8B and C), suggesting that although systemic PKM2 KO promotes tumor growth, the cell‐autonomous function of PKM2 takes presentence over PKM2’s systemic effects in vivo. To further confirm the effect of circulating cholesterol and systemic PKM2 knockout on tumor growth, we employed pitavastatin, a HMGCR inhibitor known to decrease total cholesterol and LDL‐C, in in vivo experiments. The results showed that although allografted tumors grew faster in systemic PKM2 KO as compared to WT mice background, no statistical difference was observed in allografted tumors between WT and systemic PKM2 knockout group after pitavastatin treatment, and tumor growth was significantly inhibited in both groups (Fig EV5E and F). As expected, LDL‐C level was decreased in pitavastatin treatment group (Fig EV5G).
The cell‐autonomous and systemic effects of PKM2 in tumorigenesis posit complexity in designing PKM2 targeted therapy. TEPP‐46, an allosteric activator of PKM2, has been shown to inhibit xenograft tumor growth (Anastasiou et al, 2012). TEPP‐46 induces tetramerization of PKM2 to resemble PKM1 with high pyruvate kinase activity. Thus, the high pyruvate kinase activity is thought to be tumor growth inhibitory. To assess the impact of PKM2 function by TEPP‐46 at systemic levels, we examined the effect of TEPP‐46 on plasma cholesterol levels in vivo. TEPP‐46 significantly induced total plasma cholesterol and LDL‐C levels in mice (Fig 8D). These data suggest that PKM2 tetramerization elicits a similar systemic effect on lipid homeostasis as the systemic PKM2 knockout. To evaluate whether allograft tumor growth is more affected by cell‐autonomous or systemic PKM2 functions, we treated Py8119 allografted mice with TEPP‐46. Consistent with a previous report (Anastasiou et al, 2012), TEPP‐46 inhibited allograft tumor growth (Fig 8E and F). Similar to the effect of TEPP‐46 on human breast cancer cells, TEPP‐46 treatment decreased SCAP but increased TMEM33 in tumors (Fig EV5H). This result also agrees with the slow growth phenotype of PKM2 KO py8119 cells in either WT or systemic PKM2 knockout mice (Fig 8C), reinforcing that despite the tumor growth‐promoting effects of systemic PKM2 knockout in vivo, depleting PKM2 in cancer cells is sufficient to block tumor growth.
Discussion
Glucose and lipid metabolism are intimately linked (Dang, 2012; Parhofer, 2015; Brault & Schulze, 2016; Cheng et al, 2018). We and others previously reported that PKM2 plays a critical role in aerobic glycolysis and tumor growth (Anastasiou et al, 2012; Yang et al, 2014; Lee et al, 2015; Liu et al, 2017). Herein, we demonstrate the unappreciated role of PKM2 in the regulation of lipid homeostasis in breast cancer cell lines. TMEM33 was identified as a downstream effector of PKM2. The levels of TMEM33 are negatively correlated with cellular lipogenic gene expression in breast cancer cells, but positively correlated with cholesterol levels in mice. Systemic loss of PKM2 resulted in elevated plasma cholesterol levels and promoted allograft tumor growth. Our findings provide mechanistic insights into lipid metabolism regulated by the PKM2‐TMEM33 axis and illustrate the complexity of targeting PKM2 therapeutically.
Using metabolomics, genomics, and proteomics approaches, we discovered both FAO and lipid synthesis pathways were profoundly disrupted in PKM2 KO breast cancer cells and MEFs (Figs 1 and 2). To date, PKM2 is known to have canonical glycolytic function and non‐canonical transcriptional regulatory role during tumor initiation and progression. PKM2 was reported to translocate to the nucleus and act as a coactivator of some transcriptional factors (Luo et al, 2011; Yang et al, 2011), a so‐called non‐canonical function. Herein, we discovered that cytoplasmic/ER located PKM2 could regulate lipid metabolism through promoting SREBP1 activity, representing a novel mechanism to potentiate tumor growth. Whether nuclear localized PKM2 could directly regulate expression of lipid synthetic genes remains to be determined. Although inhibition of SREBPs by silencing PKM2 has been reported in a few in vitro studies (Zhao et al, 2018; Tao et al, 2019), the molecular mechanism by which PKM2 regulates lipid metabolism remains unclear. We found that PKM2 inhibited expression of TMEM33 and RNF5. Knocking out PKM2 in breast cancer cells resulted in SCAP degradation, decreased nuclear SREBP1, and decreased lipogenic gene expression. These effects can be partially rescued by knocking down TMEM33 or RNF5. Moreover, overexpression of TMEM33 or RNF5 significantly reduced expression of genes involved in cholesterol synthesis and uptake, resembling the effects of knocking out PKM2 in breast cancer cells (Figs 3 and 5). This evidence suggests that PKM2 intervenes with activation of SREBPs via TMEM33 and RNF5. The increases of TMEM33 and RNF5 in PKM2 KO cells can be explained by NRF1 pathway activation in PKM2 KO cells, which promoted TMEM33 and RNF5 expression (Fig 6). However, whether RNF5 is up‐regulated by NRF1 at transcriptional level or through post‐translational events require further investigation. Though both NRF1 and NRF2 can bind to the antioxidant response element (ARE), hepatocyte‐specific deletion of NRF1, but not NRF2, caused liver damage, indicating that they may play distinct roles in gene regulation (Ohtsuji et al, 2008). Whether NRF2 is also involved in TMEM33 and RNF5 expression in PKM2 KO cell lines remains to be studied.
SCAP stability is essential for activation of SREBPs, which requires SCAP‐mediated ER‐to‐Golgi transport (Brown et al, 2018). Glucose‐mediated N‐glycosylation of SCAP enhanced its stability and consequently activated SREBP pathways (Cheng et al, 2015). Ubiquitination of SCAP by RNF145 inhibited cholesterol biosynthesis by accelerating its degradation (Zhang et al, 2017). In this study, we presented compelling data demonstrating that TMEM33 negatively regulates activation of SREBP1 through recruiting RNF5 to promote SCAP ubiquitination and degradation (Figs 4 and 5). Although a recent study (Kuan et al, 2020) showed the opposing functional regulation of SCAP by RNF5 from our results, the discrepancy in observation is likely due to tissue and cell line differences. Mapping of TMEM33 and SCAP interaction domains identified the sterol‐sensing domain (SSD) of SCAP associated with TMEM33. INSIG also interacts with SCAP through the SSD domain (Luo et al, 2020). Whether TMEM33 competes with INSIG for SCAP interaction, and whether TMEM33 has a broad impact on proteins containing an SSD domain remains to be determined. For instance, INSIG1 binds to the SSD domain of HMG‐CoA reductase (HMGCR), another sterol‐sensing protein that regulates the biosynthesis of cholesterol, and triggers ubiquitination and degradation of HMGCR (Sever et al, 2003). HMGCR was reduced by more than twofold in PKM2 KO or TMEM33 OE cells as compared to their respective counterparts (Tables EV2 and EV4, Figs 2G and 3G). Whether TMEM33/RNF5 axis is involved in regulating the stability of additional SSD‐containing proteins warrants further investigation.
Although TMEM33 was identified as a cholesterol interacting protein (Hulce et al, 2013), and its levels positively correlated with plasma triglyceride levels in mice (Parker et al, 2019), the functional role of TMEM33 in lipid metabolism and how TMEM33 expression is regulated are completely unknown. Using gain‐of‐function and loss‐of‐function cell line and genetic models, we showed that overexpression of TMEM33 significantly down‐regulated genes involved in fatty acid and cholesterol synthesis. Conversely, knocking down TMEM33 increased expression of lipid synthesis genes (Fig 3). Furthermore, TMEM33 has a profound impact on plasma cholesterol levels. TMEM33 homo‐ and heterozygous mice displayed significantly lower plasma total cholesterol levels, while transduction of TMEM33 in the liver increased total plasma cholesterol levels in mice (Fig 7). This evidence implicates TMEM33 as a key regulator of lipid metabolism.
Exploration of the functions of PKM2 in tumorigenesis has led to seemingly paradoxical effects. On the one hand, an array of studies have demonstrated that PKM2 fuels tumor cell proliferation through promoting aerobic glycolysis (Vander Heiden et al, 2009; Filipp, 2013; Dayton et al, 2016b) and lipid synthesis (Zhao et al, 2018). Switching from the PKM2 to PKM1 isoform in cancer cells, or inducing PKM2 tetramer formation using TEPP‐46 inhibited xenograft tumor growth (Anastasiou et al, 2012), which is consistent with PKM2 being the cancer‐specific isoform of PKM that provides growth advantages. On the other hand, PKM2‐/‐ mice developed hepatic steatosis and late‐onset spontaneous HCC (Dayton et al, 2016a), even though PKM2 expression in the liver is low. In this study, we uncovered that the systemic loss of PKM2 dramatically increased plasma cholesterol levels and promoted allografted tumor growth (Fig 8A). This result provides the explanation of the hepatic steatosis phenotype in systemic PKM2 KO mice.
Increasing attention has been paid to targeting cholesterol metabolism as a novel cancer therapeutic (Kuzu et al, 2016). Although PKM2 global knockout promotes allografted tumor growth, likely due to elevated circulating lipid, the cancer cell‐autonomous function of PKM2 is dominant in vivo. Our results show that allograft tumors derived from the PKM2 KO Py8119 mammary cancer cell line grew much slower as compared to PKM2 WT Py8119 tumors, regardless of the systemic PKM2 status. Moreover, TEPP‐46, a PKM2 tetramer‐inducing compound, inhibited allografted tumor growth, although it simultaneously increased plasma lipid levels (Fig 8D). Recently, the PKM2 TEPP‐46 has been exploited for treatment of cancer, autoimmunity, and inflammation (Anastasiou et al, 2012; Angiari et al, 2020; van de Wetering et al, 2020). The cancer cell‐autonomous and physiological functions of PKM2 identified in this study underscore the complexity of targeting metabolic enzymes and call for caution when targeting PKM2 for therapeutic applications.
In conclusion, this study identifies the PKM2‐TMEM33 axis as the molecular mechanism for regulating activation of cellular SREBPs and significantly enhances our understanding of the pathological and physiological roles of PKM2 in regulating lipid metabolism.
Materials and Methods
Cell culture and generation of PKM2 knockout cells
MCF7, MDA‐MB‐231, and HEK293T cell lines were purchased from ATCC, and immortalized MEF (PKM2fl/fl, Cre‐ERT2) was kindly provided by Dr. Matthew Heiden. All were maintained in DMEM supplemented with 10% fetal bovine serum (FBS) purchased from Gibco (Gaithersburg, MD). Mouse‐derived breast cancer cell line Py8119 was purchased from ATCC and cultured in F‐12K medium plus 10% FBS. Cell lines were authenticated by short tandem repeat profiling and were routinely tested for mycoplasma contamination. To generate the Py8119 PKM2 KO cell line, the guide RNA (sequence: CCCACAGAAGCTGCCGCCGT) specifically targeting mouse PKM exon 10 was designed and inserted into a CRISPR/Cas9/eGFP plasmid (PX458, Addgene, #48138). Transfection and selection of PKM2 KO clones were performed following the procedure used for the generation of PKM2 KO MCF7, MDA‐MB‐231, and HEK293T cell lines (Liu et al, 2017).
Antibodies and reagents
The information of antibodies, plasmids, and shRNAs is listed in Appendix Table S1.
Lentivirus packaging and stable cell line generation
3 × 10⁶ HEK293T cells were cultured in a 10‐cm dish overnight before transfecting with 10 μg of plasmid (2 μg VSVG, 4 μg PAX2, and 4 μg pLKO‐shRNA or lentiviral expressing plasmids) using polyethylenimine (Polysciences, Cat. # 23966). Supernatant containing the virus was harvested for cell line infection after 48 h. To generate stable TMEM33, RNF5, and NRF1 knockdown (KD) cell lines, 2 × 10⁵ PKM2 KO cells (MCF7 and/or MDA‐MB‐231) were seeded into a 6‐well plate overnight and then infected with 1 ml of lentivirus mixed with 1 ml fresh cell culture medium containing a final concentration of 5 μg/ml of polybrene. Cell culture medium was changed after a 24‐h infection. Cells were selected with 2 μg/ml puromycin for at least 2 weeks to obtain stable TMEM33 KD cell lines. To generate stable TMEM33 overexpressing cell lines, lentivirus‐infected cells were seeded into 96‐well plate with one cell per well. After 2–3 weeks, colonies were harvested, propagated into a 6‐well plate for 2–3 days, and lysed to collect cell lysates for Western blot to select TMEM33 OE colonies.
Recombinant TMEM33 adenovirus packaging and purification
The luciferase ORF was cloned and inserted into the pShuttle vector (Addgene #62621) using KpnI and NotI sites. This vector is named pShuttle‐luciferase‐F2A‐T2A‐Venus. Then, the TMEM33 ORF was cloned into pShuttle‐luciferase‐F2A‐T2A‐Venus using the MluI site, resulting in pShuttle‐luciferase‐F2A‐TMEM33‐T2A‐Venus. The control shuttle plasmid (pShuttle‐luciferase‐F2A‐T2A‐Venus) and TMEM33 expression plasmid (pShuttle‐luciferase‐F2A‐ TMEM33‐T2A‐Venus) were linearized by Pme I enzyme and then transfected into AdEasier‐1 cells (Ampicillin and Streptomycin) (Addgene, Bacterial strain #16399), respectively. Kanamycin was used to select positive clones. The next day, small colonies were picked and cultured in 5 ml LB media containing kanamycin overnight. Plasmids were then extracted for sequencing.
Virus packaging: Adenoviral plasmid was linearized by PacI digestion and transfected into HEK293A cells. After 2 weeks, all the cells detached from the culture dish and were collected. Cells were lysed with three freeze (−80°C)‐thaw(37°C) cycles, followed by centrifugation at 800 g/min for 15 min. The supernatant was collected for viral amplification. Proper number of HEK293A cells was seeded in six 15‐cm dishes overnight before being infected with 1 ml of adenovirus. The cells were incubated at 37°C and 5% CO2 until the cytopathic effect (CPE) was complete, approximately 3–5 days. Adeno‐X Maxi Purification Kit (# 631032, TaKaRa) was used to purify the adenovirus. The adenoviral titer was determined using the Adeno‐X Rapid Titer Kit (Cat. No. 632250). The adenovirus was stored at −80°C for in vivo experiments.
Immunofluorescence by confocal imaging
Quantification of lipid droplets using BODIPY 505/515
BODIPY505/515 (Thermo Fisher scientific #D3922) was diluted in DMSO at 1 mg/ml (1,000×). MDA‐MB‐231 cells were seeded in 35‐mm glass‐bottom cell culture plates at 40% confluency to grow overnight. The Bodipy dye was diluted into phenol red free DMEM and added into the MDA‐MB‐231 culturing dish to stain for 5–10 min. The excess dyes were removed by brief rinsing in PBS, followed by confocal imaging.
SREBP1 staining
MDA‐MB‐231 cells were fixed with 4% paraformaldehyde in culture media for 15 min at 37°C and permeabilized with 0.2% Triton X‐100 for 10 min at room temperature. Nonspecific binding was blocked by incubating with 4% BSA in PBS for 60 min, and cells were subsequently stained with primary SREBP1 antibody overnight at 4°C. The slides were washed in PBS three times (5 min/each time) and were incubated for 1 h with the Dylight®594 conjugated goat anti‐rabbit secondary IgG. After being washed three times in PBS and air‐dried, coverslips were mounted using ProLong Gold anti‐fade reagent with DAPI (Invitrogen).
Metabolomics and data analysis
MCF7, MDA‐MB‐231, MEF cells, and their PKM2 KO counterparts were cultured in quadruplicate. The cells were harvested using trypsin and washed three times with cold PBS. The cell pellets were stored at −80°C and shipped to Metabolon, Inc. (Durham, NC), for metabolomics and data analysis.
Protein extraction and trypsin digestion for mass spectrometry
Cells with three biological and three technical replicates were lysed in 8 M urea buffer containing protease and phosphatase inhibitors (Thermo Fisher), followed by 1 min of sonication (3‐s on and 3‐s off, amplitude 25%). The lysate was reduced with 10 mM dithiothreitol (DTT) at 56°C for 30 min and alkylated with 20mM iodoacetamide at room temperature in the dark for additional 15 min. About 100 μg of protein was then digested with trypsin at a trypsin/protein ratio of 1:100 overnight at 37°C. Peptides were extracted and dried (SpeedVac, Eppendorf), and concentrations of peptide mixture were measured by peptide assay (Thermo). Samples were lyophilized and stored at −80°C.
Protein extraction and trypsin digestion
Cells with three biological and three technical replicates were lysed in 8 M urea buffer containing protease and phosphatase inhibitors (Thermo Fisher), followed by 1 min of sonication (3‐s on and 3‐s off, amplitude 25%). The lysate was reduced with 10 mM dithiothreitol (DTT) at 56°C for 30 min and alkylated with 20 mM iodoacetamide at room temperature in the dark for additional 15 min. About 100 μg of protein was then digested using trypsin at an enzyme to protein mass ratio of 1:100 overnight at 37°C. Peptides were extracted and dried (SpeedVac, Eppendorf), and concentrations of peptide mixture were measured by peptide assay (Thermo). Samples were lyophilized and stored in −80°C.
LC‐MS/MS analysis
The liquid chromatography tandem mass spectrometry (LC‐MS/MS) detection system used consists of a nanoflow high‐performance liquid chromatograph (HPLC) instrument (Dionex UltiMate 3000 UPLC system, Thermo Fisher) coupled to an Q Exactive HF mass spectrometer (Thermo Fisher) with a nanoelectrospray ion source (Thermo Fisher). In brief, 0.5 μg of peptide mixture resolved in buffer A (0.1% formic acid (FA)) was loaded onto a 75 μm × 15 cm fabricated column which was filled with 1.7‐μm Ethylene Bridged Hybrid packing materials (130 Å, Waters), over a 126‐min linear gradient of 3–45% Mobile Phase B (buffer A, 0.1% FA in water; buffer B, 0.1% FA in ACN) at a flow rate of 300 nl/min. The MS analysis was performed in a data‐dependent manner using an Orbitrap mass analyzer. For a full mass spectrometry survey scan, the target value was 1 × 10⁵, and the scan ranged from 300 to 1,500 m/z at a resolution of 60,000, with a maximum injection time of 100 ms. For the MS2 scan, up to 15 of the most intense precursor ions from a survey scan were selected for MS/MS and detected by the Orbitrap at a mass resolution of 15,000 at m/z 400. Only spectra with a charge state of 2–6 were selected for fragmentation by higher‐energy collision dissociation (HCD) with a normalized collision energy of 30%. The automatic gain control for MS/MS was set to 8e3, with maximum ion injection times of 100 ms. Dynamic exclusion time was 45 s, and the window for isolating the precursors was 1.4 m/z.
Label‐free based MS quantification for proteins
Protein identification and quantification by MaxQuant (version 1.5.3.8) based database searching, using the integrated Andromeda search engine with FDR < 1% at peptide and protein level. The tandem mass spectra were searched against the human UniProt database (version 20200219, 20,193 sequences). A reverse database for the decoy search was generated automatically in MaxQuant. Enzyme specificity was set to “Trypsin”, and a minimum number of seven amino acids were required for peptide identification. For label‐free protein quantification (LFQ), the MaxQuant LFQ algorithm was used to quantitate the MS signals, and the proteins’ intensities were represented in LFQ intensity (Cox et al, 2014). Cysteine carbamidomethylation was set as the fixed modification. The oxidation of M and acetylation of the protein N‐terminal were set as the variable modifications. The first search mass tolerance was 20 ppm, and the main search peptide tolerance was 4.5 ppm. The false discovery rates of the peptide‐spectrum matches (PSMs) and proteins were set to < 1%.
RNA‐seq analysis
Fresh PKM2 KO MCF7, PKM2 KO MDA‐MB‐231, and TMEM33 OE MDA‐MB‐231 cell pellets, and their respective parental cells, were used for RNA extraction. RNA sequencing libraries were prepared using the Illumina TruSeq RNA Library Prep Kit v2 following the manufacturer’s instructions. Each library was sequenced in single read mode, 1 × 50 bp, using the HiSeq4000 platform. Sequencing reads were aligned to human genome (hg38) by STAR (version 2.5.2b). Expression levels of genes annotated in GENCODE (version 24 for PKM2 KO and their parental cells; version 27 for TMEM33 OE and their control cells) were quantified by RSEM (version 1.3.0). Parameters of STAR and RSEM were set following ENCODE’s long RNA‐seq processing pipeline (https://github.com/ENCODE‐DCC/long‐rna‐seq‐pipeline). Differentially expressed genes were identified by DESeq2 (version 1.24.0) under the requirement of at least twofold changes and an adjusted P < 0.05. Gene Set Enrichment Analysis (GSEA) was performed as previously described (Subramanian et al, 2005). Briefly, the total detected genes with P < 0.05 in PKM2 KO cells versus parental cells or TMEM33 overexpressing cells versus control cells were analyzed by GSEA (version 4.03) using hallmark gene sets (version 7.1) and of KEGG subset of canonical pathways (CP) (version 7.0) in GSEA databases with total 236 gene sets. Z score was calculated using z = (x‐μ)/σ, where x is the raw RNA‐seq FPKM value, μ is the mean of the sample, and σ is standard deviation (SD) of the sample.
Measurement of cellular total cholesterol levels
About 3 × 10⁶ MCF7 and MDA‐MB‐231 cells, as well as their PKM2 KO counterparts, were homogenized in 500–1,000 μl hexane‐isopropanol (v/v 3:2). The homogeneous mixtures were centrifuged at 15,000 g for 5–10 min. The organic phase was collected in a clean tube for vacuum drying. The dried lipid was redissolved into the assay buffer supplied by the AmplexTM Red Cholesterol Assay Kit (A12216, Thermo Fisher Scientific), and the total cholesterol levels were measured according to the manufacturer’s instructions. The residual solvent remaining in the pellets was vacuum‐dried and dissolved in 1.5 ml of 0.2 N NaOH at 37°C for 3 h. Protein concentration was measured by Bradford assay at 595 nm in triplicate.
Proximity ligation analysis
Proximity ligation assays were performed using the Duolink® Proximity Ligation Assay kit (DUO92101, Sigma) according to the manufacturer’s instructions. A mouse‐derived RNF5 antibody and a rabbit‐derived TMEM33 antibody were used for the assays. Briefly, 5 × 10⁵ MDA‐MB‐231 cells were seeded into 6‐well plate containing a cover glass and incubated overnight. The cells were fixed, permeabilized, and blocked, and primary antibody staining was performed as described above in the confocal imaging section. Secondary antibodies coupled with oligonucleotides (PLA probes) were incubated with the cells to bind to the primary antibodies. Connector oligos were added to hybridize to the PLA probes. T4 ligase was used to ligate the gap, and the resulting closed, circular DNA template was amplified by DNA polymerase. Complementary detection oligos coupled to fluorochromes were hybridized to repeating sequences in the amplicons. The PLA signals were detected by confocal imaging.
Protein–protein interaction assays
For the in vitro protein‐protein interaction assay, Flag‐tagged full‐length TMEM33 and HA‐tagged RNF5 were in vitro translated using the T7 Quick Coupled Translation/Transcription system (Promega). The Flag‐tagged proteins were incubated with HA‐RNF5 fusion protein in binding buffer (1X PBS, 0.1% NP‐40, 0.5 mM DTT, 10% glycerol, 1mM PMSF). For mapping the SCAP domain that interacts with TMEM33, Flag‐tagged SCAP plasmid, and its truncations, were transiently transfected into HEK293T cells for 24 h. The cells were lysed using TNI lysis buffer (0.5% Igepal CA‐630, 50 mM Tris (pH 7.5), 250 mM NaCl, 1 mM EDTA, 1× Complete ULTRA EDTA‐free Protease Inhibitor cocktail, and 1× PhosStop) (Pankow, Bamberger et al, 2016). Flag M2 beads were added into these lysates and incubated overnight at 4°C. The Flag M2 beads were washed four times with wash buffer, and the bound proteins were eluted with 500 μg/ml 3X Flag peptides. For mapping the TMEM33 domain that interacts with SCAP, Halo‐tagged TMEM33‐HA and its truncations were used for expression of TMEM33 and its truncations in HEK293T cells. Halo Tag beads were used for enrichment of TMEM33 and its truncations, and TEV cleavage enzyme was used for releasing TMEM33 and its truncation from the beads. Samples were analyzed by SDS‐PAGE and Western blotting.
Chromatin immunoprecipitation‐qPCR (ChIP‐qRT‐PCR)
2x10⁸ parental and PKM2 KO MCF7 cells were directly cross‐linked with 1% formaldehyde in DMEM medium for 15 min and quenched with 125 mM glycine for 5 min. Cell monolayers were washed twice with ice‐cold PBS and then scraped into PBS and collected by centrifugation (1,500 rpm, 4 min). Cells were lysed with 10 ml Buffer I (10 mM HEPES pH 7.0, 10 mM EDTA, 0.5 mM EGTA, 0.25% Triton X‐100, and 0.5 mM PMSF) with rotation for 10 min at 4°C. The crude nuclei were pelleted by centrifugation (200 g/min, 4 min). Crude nuclei were washed with 10 ml Buffer II (10 mM HEPES pH 7.0, 200 mM NaCl, 1 mM EDTA, 0.5 mM EGTA, and 0.5 mM PMSF) while rotating for 10 min at 4°C and pelleted by centrifugation at 1,500 rpm for 4 min. Nuclei were resuspended in 1 ml nuclear lysis buffer (50 mM Tris–HCl pH 8.1, 10 mM EDTA, 1% SDS, 1 mM PMSF, and 1x protease inhibitor cocktail) and incubated on ice for 10 min. Chromatin was sheared by sonication in an ice‐water bath at 4°C using a Branson Sonifier 450 with a microtip (40% amplitude, 3 s on, 10 s off, 3 min of total pulse time). The supernatant was collected by centrifugation (15,000 rpm, 10°C, 15 min). The NRF1 antibody and normal rabbit IgG were used for ChIP assays according to the previously described method (Zeng & Xu, 2015). A pair of primers (F: GAAAGTGTTACTGGTGTAGGGTG; R: ACTGATTGCGGGCCACCACTTC) that target the end of the putative ARE motif was used for qPCR assays.
Animal experiments and mouse models
All animal work was performed in accordance with protocols approved by the Research Animal Resource Center of UW‐Madison, and the study was compliant with ethical regulations regarding animal research. The heterozygote TMEM33+/‐ mouse (051185‐JAX) was generated by the Knockout Mouse Phenotyping Program (KOMP3) at the Jackson Laboratory and ordered from the Mutant Mouse Resource and Research Center (MMRRC). The TMEM33+/‐ mouse was generated by CRISPR/Cas9‐based technology, harboring a 453‐bp deletion beginning at Chromosome 5 position 67,263,561 bp, and ending after 67,264,013 bp (GRCm38/mm10) followed by a single‐bp (A) insertion at the deletion site.
The PKM2 conditional knockout mouse model was originally developed by Dr. Matthew Heiden. Rosa26‐ creERT2 (No.008463) and PKMfl/fl (No. 024048) mice were purchased from the Jackson Laboratory and crossed to generate PKMfl/fl ; Rosa26‐creERT2 /+ mice. To induce systemic PKM2 KO, 100 μl of tamoxifen (10 mg/ml, suspended in corn oil) was injected intraperitoneally every 2 days for a total of five injections. As a control group, mice were injected with corn oil only. Genotyping was performed with tail genomic DNA to validate the knockout efficacy 7 days after the last tamoxifen injection.
Allografted tumor experiments
Approximately 6‐week‐old female mice (PKMfl/fl ; Rosa26‐creERT2/+) were randomly put into cages with five mice each and treated with tamoxifen (PKM2 KO group) or corn oil (Control group) by intraperitoneal injection. Briefly, 100 μl tamoxifen (10 mg/ml) or corn oil was injected into mice every other day for total five injections. The mice were genotyped to confirm the exon 10 deletion efficiency. 5 × 10⁵ luciferase‐labeled parental Py8119 cells were orthotopic injected into the fat pad of each group containing 6 mice. Similarly, 5 × 10⁵ luciferase‐labeled PKM2 KO Py8119 cells were orthotopically injected into the fat pad of each group containing 6 mice. To assess the effect of TEPP‐46 on tumor growth, 8‐week‐old female C57BL/6J mice randomly put into cages with five mice each and were injected with 5 × 10⁵ luciferase‐labeled parental Py8119 cells. The mice were treated with TEPP‐46 (50 mg/kg) or vehicle twice/day by oral gavage. To assess the effect of pitavastatin on tumor growth, 8‐week‐old female C57BL/6J wild‐type and systemic PKM2KO mice were injected with 5 × 10⁵ luciferase‐labeled parental Py8119 cells. The mice were treated with pitavastatin (50 mg/kg) or vehicle twice/day by oral gavage. After cell injection, the luciferase signal intensity was immediately measured using IVIS, and mice that were not properly injected were excluded. The bioluminescence signal was taken at the indicated time. The mice were euthanized, and tumors were taken out for weight measurements.
Total cholesterol and LDL measurement in vivo
Blood was drawn from PKMfl/fl ; Rosa26‐creERT 2/+ mice treated with tamoxifen or corn oil for 4 weeks. The plasma was centrifuged at 1,500 rpm for 15 min followed by careful collection of the supernatant. The total cholesterol and LDL levels were measured the EnzyChromTM AF HDL and LDL/VLDL Assay Kit (E2HL‐100, BioAssay Systems), and Mouse LDL‐Cholesterol Assay Kit (79980, Crystal Chem) following the manufacturer’s instructions.
Overexpression of TMEM33 in vivo
Eight‐week‐old female C57BL/6J mice were used for this experiment. Before adenovirus injection, plasma was drawn and marked as day −1. Then, the mice (n = 7) were injected with 109 active control or TMEM33‐expressing adenoviruses via retro‐orbital injection. The bioluminescent signal intensity was immediately measured and marked as day 0. The livers and plasma were collected on day 5.
Immunohistochemistry (IHC) staining
Small intestines, livers, and tumors were fixed in 10% (vol/vol) neutral‐buffered formalin, paraffin‐embedded, and sectioned (5 μm thickness). The slides were heated at 56°C for half‐hour, followed by incubation with the primary antibodies at 4°C overnight, and secondary streptavidin‐conjugated HRP antibody for 1 h at room temperature. The DAB detection kit was used to visualize expression signal intensity. The slides were counterstained with hematoxylin and then covered with a coverslip using CytosealTM XYL (xylene‐based mounting medium).
Statistics and reproducibility
Statistical testing was performed using the unpaired two‐tailed Student’s t‐test and/or ANOVA. All experiments were repeated at least three times, unless otherwise indicated. N numbers are indicated in the figure legends. P < 0.05 (*) was considered as statistically significant.
Author contributions
WX and FL conceived the project, designed the experiments, analyzed the data, and wrote the manuscript. FL performed the experiments with assistance from MM, AG, YW, FM, GM, CJ, KD and SZ; MM, FM, and CJ performed the mass spectrometry experiments; YW partially contributed to drawing blood, mouse breeding, and genotyping. FL, PL, IMO, and SK performed bioinformatics analyses; LL directed and supervised mass spectrometry‐based proteomics studies, WX directed and supervised all aspects of the study; all authors discussed the results and commented on the manuscript.
Conflict of interest
The authors declare that they have no conflict of interest.
Supporting information
Appendix
Expanded View Figures PDF
Table EV1
Table EV2
Table EV3
Table EV4
Table EV5
Source Data for Expanded View and Appendix
Source Data for Figure 1
Source Data for Figure 2
Source Data for Figure 3
Source Data for Figure 4
Source Data for Figure 5
Source Data for Figure 6
Source Data for Figure 7
Source Data for Figure 8
Acknowledgements
We thank Dr. M. G. Vander Heiden for kindly providing the immortalized MEF (PKM2fl/fl, Cre‐ERT2) cells, Dr. Deliang Guo for kindly supplying the hamster full‐length PC3.0‐GFP SCAP QQQ plasmid, which was given with permission by Dr. Joe Goldstein. This project is supported by National Institutes of Health (NIH) R01 CA236356, R01 CA213293 to W.X., and supported in part by the NCI P30CA014520 – UW Carbone Cancer Center Grant. L.L. would like to acknowledge financial support from NIH R01DK071801, RF1AG052324, S10RR029531, and P41GM108538.
The EMBO Journal (2021) 40: e108065.
See also: A Khateb & ZA Ronai (November 2021)
Data availability
Global metabolomic nucleotide data have been deposited in MetaboLights with the primary accession code MTBLS533 (https://www.ebi.ac.uk/metabolights/). Mass spectrometry data have been deposited in ProteomeXchange with the dataset identifier PXD026434 (http://www.proteomexchange.org). The RNA‐seq data have been deposited in Gene Expression Omnibus (GEO) with accession code GSE175956 (https://www.ncbi.nlm.nih.gov/geo/).
References
- Anastasiou D, Yu Y, Israelsen WJ, Jiang J‐K, Boxer MB, Hong BS, Tempel W, Dimov S, Shen M, Jha A et al (2012) Pyruvate kinase M2 activators promote tetramer formation and suppress tumorigenesis. Nat Chem Biol 8: 839–847 [DOI] [PMC free article] [PubMed] [Google Scholar]
- Angiari S, Runtsch MC, Sutton CE, Palsson‐McDermott EM, Kelly B, Rana N, Kane H, Papadopoulou G, Pearce EL, Mills KHG et al (2020) Pharmacological activation of pyruvate kinase M2 Inhibits CD4(+) T cell pathogenicity and suppresses autoimmunity. Cell Metab 31: 391–405.e8 [DOI] [PMC free article] [PubMed] [Google Scholar]
- Baird L, Tsujita T, Kobayashi EH, Funayama R, Nagashima T, Nakayama K, Yamamoto M (2017) A homeostatic shift facilitates endoplasmic reticulum proteostasis through transcriptional integration of proteostatic stress response pathways. Mol Cell Biol 37: E00651–E1199 [DOI] [PMC free article] [PubMed] [Google Scholar]
- Beloribi‐Djefaflia S, Vasseur S, Guillaumond F (2016) Lipid metabolic reprogramming in cancer cells. Oncogenesis 5: e189 [DOI] [PMC free article] [PubMed] [Google Scholar]
- Biswas M, Chan JY (2010) Role of Nrf1 in antioxidant response element‐mediated gene expression and beyond. Toxicol Appl Pharmacol 244: 16–20 [DOI] [PMC free article] [PubMed] [Google Scholar]
- Blythe EE, Olson KC, Chau V, Deshaies RJ (2017) Ubiquitin‐ and ATP‐dependent unfoldase activity of P97/VCP center dot NPLOC4 center dot UFD1L is enhanced by a mutation that causes multisystem proteinopathy. Proc Natl Acad Sci USA 114: E4380–E4388 [DOI] [PMC free article] [PubMed] [Google Scholar]
- Brault C, Schulze A (2016) The role of glucose and lipid metabolism in growth and survival of cancer cells. Recent Results Cancer Res 207: 1–22 [DOI] [PubMed] [Google Scholar]
- Brown MS, Radhakrishnan A, Goldstein JL (2018) Retrospective on cholesterol homeostasis: the central role of scap. Annu Rev Biochem 87: 783–807 [DOI] [PMC free article] [PubMed] [Google Scholar]
- Cheng C, Geng F, Cheng X, Guo D (2018) Lipid metabolism reprogramming and its potential targets in cancer. Cancer Commun 38: 27 [DOI] [PMC free article] [PubMed] [Google Scholar]
- Cheng C, Ru P, Geng F, Liu J, Yoo J, Wu X, Cheng X, Euthine V, Hu P, Guo J et al (2015) Glucose‐mediated N‐glycosylation of SCAP is essential for SREBP‐1 activation and tumor growth. Cancer Cell 28: 569–581 [DOI] [PMC free article] [PubMed] [Google Scholar]
- Christofk HR, Vander Heiden MG, Harris MH, Ramanathan A, Gerszten RE, Wei R, Fleming MD, Schreiber SL, Cantley LC (2008) The M2 splice isoform of pyruvate kinase is important for cancer metabolism and tumour growth. Nature 452: 230–233 [DOI] [PubMed] [Google Scholar]
- Cox J, Hein MY, Luber CA, Paron I, Nagaraj N, Mann M (2014) Accurate proteome‐wide label‐free quantification by delayed normalization and maximal peptide ratio extraction, termed MaxLFQ. Mol Cell Proteomics 13: 2513–2526 [DOI] [PMC free article] [PubMed] [Google Scholar]
- Dang CV (2012) Links between metabolism and cancer. Gene Dev 26: 877–890 [DOI] [PMC free article] [PubMed] [Google Scholar]
- Dayton TL, Gocheva V, Miller KM, Israelsen WJ, Bhutkar A, Clish CB, Davidson SM, Luengo A, Bronson RT, Jacks T et al (2016a) Germline loss of PKM2 promotes metabolic distress and hepatocellular carcinoma. Genes Dev 30: 1020–1033 [DOI] [PMC free article] [PubMed] [Google Scholar]
- Dayton TL, Jacks T, Vander Heiden MG (2016b) PKM2, cancer metabolism, and the road ahead. EMBO Rep 17: 1721–1730 [DOI] [PMC free article] [PubMed] [Google Scholar]
- Ding X, Zhang W, Li S, Yang H (2019) The role of cholesterol metabolism in cancer. Am J Cancer Res 9: 219–227 [PMC free article] [PubMed] [Google Scholar]
- Filipp FV (2013) Cancer metabolism meets systems biology: Pyruvate kinase isoform PKM2 is a metabolic master regulator. J Carcinog 12: 14 [DOI] [PMC free article] [PubMed] [Google Scholar]
- Guo DL, Bell EH, Mischel P, Chakravarti A (2014) Targeting SREBP‐1‐driven lipid metabolism to treat cancer. Curr Pharm Design 20: 2619–2626 [DOI] [PMC free article] [PubMed] [Google Scholar]
- Horton JD, Goldstein JL, Brown MS (2002) SREBPs: activators of the complete program of cholesterol and fatty acid synthesis in the liver. J Clin Invest 109: 1125–1131 [DOI] [PMC free article] [PubMed] [Google Scholar]
- Hulce JJ, Cognetta AB, Niphakis MJ, Tully SE, Cravatt BF (2013) Proteome‐wide mapping of cholesterol‐interacting proteins in mammalian cells. Nat Methods 10: 259–264 [DOI] [PMC free article] [PubMed] [Google Scholar]
- Israelsen W, Dayton T, Davidson S, Fiske B, Hosios A, Bellinger G, Li J, Yu Y, Sasaki M, Horner J et al (2013) PKM2 isoform‐specific deletion reveals a differential requirement for pyruvate kinase in tumor cells. Cell 155: 397–409 [DOI] [PMC free article] [PubMed] [Google Scholar]
- Kuan YC, Takahashi Y, Maruyama T, Shimizu M, Yamauchi Y, Sato R (2020) Ring finger protein 5 activates sterol regulatory element‐binding protein 2 (SREBP2) to promote cholesterol biosynthesis via inducing polyubiquitination of SREBP chaperone SCAP. J Biol Chem 295: 3918–3928 [DOI] [PMC free article] [PubMed] [Google Scholar]
- Kuzu OF, Noory MA, Robertson GP (2016) The role of cholesterol in cancer. Cancer Res 76: 2063–2070 [DOI] [PMC free article] [PubMed] [Google Scholar]
- Lee KM, Nam K, Oh S, Lim J, Lee T, Shin I (2015) ECM1 promotes the Warburg effect through EGF‐mediated activation of PKM2. Cell Signal 27: 228–235 [DOI] [PubMed] [Google Scholar]
- Liu F, Ma F, Wang Y, Hao L, Zeng H, Jia C, Wang Y, Liu P, Ong I, Li B et al (2017) PKM2 methylation by CARM1 activates aerobic glycolysis to promote tumorigenesis. Nat Cell Biol 19: 1358–1370 [DOI] [PMC free article] [PubMed] [Google Scholar]
- Llaverias G, Danilo C, Mercier I, Daumer K, Capozza F, Williams TM, Sotgia F, Lisanti MP, Frank PG (2011) Role of cholesterol in the development and progression of breast cancer. Am J Pathol 178: 402–412 [DOI] [PMC free article] [PubMed] [Google Scholar]
- Luo J, Yang H, Song BL (2020) Mechanisms and regulation of cholesterol homeostasis. Nat Rev Mol Cell Biol 21: 225–245 [DOI] [PubMed] [Google Scholar]
- Luo W, Hu H, Chang R, Zhong J, Knabel M, O'Meally R, Cole RN, Pandey A, Semenza GL (2011) Pyruvate kinase M2 is a PHD3‐stimulated coactivator for hypoxia‐inducible factor 1. Cell 145: 732–744 [DOI] [PMC free article] [PubMed] [Google Scholar]
- Medes G, Thomas A, Weinhouse S (1953) Metabolism of neoplastic tissue. IV. A study of lipid synthesis in neoplastic tissue slices in vitro . Cancer Res 13: 27–29 [PubMed] [Google Scholar]
- Mullen PJ, Yu R, Longo J, Archer MC, Penn LZ (2016) The interplay between cell signalling and the mevalonate pathway in cancer. Nat Rev Cancer 16: 718–731 [DOI] [PubMed] [Google Scholar]
- Noguchi T, Inoue H, Tanaka T (1986) The M1‐ and M2‐type isozymes of rat pyruvate kinase are produced from the same gene by alternative RNA splicing. J Biol Chem 261: 13807–13812 [PubMed] [Google Scholar]
- Ohtsuji M, Katsuoka F, Kobayashi A, Aburatani H, Hayes JD, Yamamoto M (2008) Nrf1 and Nrf2 play distinct roles in activation of antioxidant response element‐dependent genes. J Biol Chem 283: 33554–33562 [DOI] [PMC free article] [PubMed] [Google Scholar]
- Pankow S, Bamberger C, Calzolari D, Bamberger A, Yates JR 3rd (2016) Deep interactome profiling of membrane proteins by co‐interacting protein identification technology. Nat Protoc 11: 2515–2528 [DOI] [PMC free article] [PubMed] [Google Scholar]
- Parhofer KG (2015) Interaction between glucose and lipid metabolism: more than diabetic dyslipidemia. Diabetes Metab J 39: 353–362 [DOI] [PMC free article] [PubMed] [Google Scholar]
- Parker BL, Calkin AC, Seldin MM, Keating MF, Tarling EJ, Yang PY, Moody SC, Liu YY, Zerenturk EJ, Needham EJ et al (2019) An integrative systems genetic analysis of mammalian lipid metabolism. Nature 567: 187‐+ [DOI] [PMC free article] [PubMed] [Google Scholar]
- Pelton K, Coticchia CM, Curatolo AS, Schaffner CP, Zurakowski D, Solomon KR, Moses MA (2014) Hypercholesterolemia induces angiogenesis and accelerates growth of breast tumors in vivo. Am J Pathol 184: 2099–2110 [DOI] [PMC free article] [PubMed] [Google Scholar]
- Radhakrishnan SK, den Besten W, Deshaies RJ (2014) p97‐dependent retrotranslocation and proteolytic processing govern formation of active Nrf1 upon proteasome inhibition. Elife 3: e1856 [DOI] [PMC free article] [PubMed] [Google Scholar]
- Sakabe I, Hu R, Jin L, Clarke R, Kasid UN (2015) TMEM33: a new stress‐inducible endoplasmic reticulum transmembrane protein and modulator of the unfolded protein response signaling. Breast Cancer Res Treat 153: 285–297 [DOI] [PMC free article] [PubMed] [Google Scholar]
- Sever N, Song BL, Yabe D, Goldstein JL, Brown MS, DeBose‐Boyd RA (2003) Insig‐dependent ubiquitination and degradation of mammalian 3‐hydroxy‐3‐methylglutaryl‐CoA reductase stimulated by sterols and geranylgeraniol. J Biol Chem 278: 52479–52490 [DOI] [PubMed] [Google Scholar]
- Simsek D, Tiu GC, Flynn RA, Byeon GW, Leppek K, Xu AF, Chang HY, Barna M (2017) The mammalian ribo‐interactome reveals ribosome functional diversity and heterogeneity. Cell 169: 1051–1065.e18 [DOI] [PMC free article] [PubMed] [Google Scholar]
- Spann NJ, Glass CK (2013) Sterols and oxysterols in immune cell function. Nat Immunol 14: 893–900 [DOI] [PubMed] [Google Scholar]
- Subramanian A, Tamayo P, Mootha VK, Mukherjee S, Ebert BL, Gillette MA, Paulovich A, Pomeroy SL, Golub TR, Lander ES et al (2005) Gene set enrichment analysis: a knowledge‐based approach for interpreting genome‐wide expression profiles. Proc Natl Acad Sci USA 102: 15545–15550 [DOI] [PMC free article] [PubMed] [Google Scholar]
- Tao T, Su Q, Xu S, Deng J, Zhou S, Zhuang YU, Huang Y, He C, He S, Peng M et al (2019) Down‐regulation of PKM2 decreases FASN expression in bladder cancer cells through AKT/mTOR/SREBP‐1c axis. J Cell Physiol 234: 3088–3104 [DOI] [PubMed] [Google Scholar]
- Tcherpakov M, Delaunay A, Toth J, Kadoya T, Petroski MD, Ronai ZA (2009) Regulation of endoplasmic reticulum‐associated degradation by RNF5‐dependent ubiquitination of JNK‐associated membrane protein (JAMP). J Biol Chem 284: 12099–12109 [DOI] [PMC free article] [PubMed] [Google Scholar]
- van de Wetering C, Aboushousha R, Manuel AM, Chia SB, Erickson C, MacPherson MB, van der Velden JL, Anathy V, Dixon AE, Irvin CG et al (2020) Pyruvate kinase M2 promotes expression of proinflammatory mediators in house dust mite‐induced allergic airways disease. J Immunol 204: 763–774 [DOI] [PMC free article] [PubMed] [Google Scholar]
- Vander Heiden MG, Cantley LC, Thompson CB (2009) Understanding the Warburg effect: the metabolic requirements of cell proliferation. Science 324: 1029–1033 [DOI] [PMC free article] [PubMed] [Google Scholar]
- Widenmaier SB, Snyder NA, Nguyen TB, Arduini A, Lee GY, Arruda AP, Saksi J, Bartelt A, Hotamisligil GS (2017) NRF1 is an ER membrane sensor that is central to cholesterol homeostasis. Cell 171: 1094–1109.e15 [DOI] [PubMed] [Google Scholar]
- Wong N, Ojo D, Yan J, Tang D (2015) PKM2 contributes to cancer metabolism. Cancer Lett 356: 184–191 [DOI] [PubMed] [Google Scholar]
- Xu D, Wang Z, Xia Y, Shao F, Xia W, Wei Y, Li X, Qian XU, Lee J‐H, Du L et al (2020) The gluconeogenic enzyme PCK1 phosphorylates INSIG1/2 for lipogenesis. Nature 580: 530–535 [DOI] [PubMed] [Google Scholar]
- Yang L, Xie M, Yang M, Yu Y, Zhu S, Hou W, Kang R, Lotze MT, Billiar TR, Wang H et al (2014) PKM2 regulates the Warburg effect and promotes HMGB1 release in sepsis. Nat Commun 5: 4436 [DOI] [PMC free article] [PubMed] [Google Scholar]
- Yang W, Xia Y, Ji H, Zheng Y, Liang J, Huang W, Gao X, Aldape K, Lu Z (2011) Nuclear PKM2 regulates beta‐catenin transactivation upon EGFR activation. Nature 480: 118–122 [DOI] [PMC free article] [PubMed] [Google Scholar]
- Zeng H, Xu W (2015) Ctr9, a key subunit of PAFc, affects global estrogen signaling and drives ERalpha‐positive breast tumorigenesis. Genes Dev 29: 2153–2167 [DOI] [PMC free article] [PubMed] [Google Scholar]
- Zhang L, Rajbhandari P, Priest C, Sandhu J, Wu XH, Temel R, Castrillo A, Vallim TQD, Sallam T, Tontonoz P (2017) Inhibition of cholesterol biosynthesis through RNF145‐dependent ubiquitination of SCAP. Elife 6: e28766 [DOI] [PMC free article] [PubMed] [Google Scholar]
- Zhao XP, Zhao L, Yang H, Li JJ, Min XJ, Yang FJ, Liu JJ, Huang G (2018) Pyruvate kinase M2 interacts with nuclear sterol regulatory element‐binding protein 1a and thereby activates lipogenesis and cell proliferation in hepatocellular carcinoma. J Biol Chem 293: 6623–6634 [DOI] [PMC free article] [PubMed] [Google Scholar]