Abstract
Myenteric interstitial cells of Cajal (ICC-MY) generate and actively propagate electrical slow waves in the stomach. Slow wave generation and propagation are altered in gastric motor disorders, such as gastroparesis, and the mechanism for the gradient in slow wave frequency that facilitates proximal to distal propagation of slow waves and normal gastric peristalsis is poorly understood. Slow waves depend upon Ca2+-activated Cl− channels (encoded by Ano1). We characterized Ca2+ signaling in ICC-MY in situ using mice engineered to have cell-specific expression of GCaMP6f in ICC. Ca2+ signaling differed in ICC-MY in corpus and antrum. Localized Ca2+ transients were generated from multiple firing sites and were organized into Ca2+ transient clusters (CTCs). Ca2+ transient refractory periods occurred upon cessation of CTCs, but a relatively higher frequency of Ca2+ transients persisted during the inter-CTC interval in corpus than in antrum ICC-MY. The onset of Ca2+ transients after the refractory period was associated with initiation of the next CTC. Thus, CTCs were initiated at higher frequencies in corpus than in antrum ICC-MY. Initiation and propagation of CTCs (and electrical slow waves) depends upon T-type Ca2+ channels, and durations of CTCs relied upon L-type Ca2+ channels. The durations of CTCs mirrored the durations of slow waves. CTCs and Ca2+ transients between CTCs resulted from release of Ca2+ from intracellular stores and were maintained, in part, by store-operated Ca2+ entry. Our data suggest that Ca2+ release and activation of Ano1 channels both initiate and contribute to the plateau phase of slow waves.
Keywords: Slow waves, Pacemaker activity, Gastric motility, Interstitial cells
1. Introduction
Gastric motility is characterized by different patterns of contractile activity in the proximal and distal stomach. Contractile tone decreases in the proximal stomach during ingestion of food to accommodate the increase in volume without extreme increases in luminal pressure, and gradual restoration of tone moves contents on to the distal stomach [1, 2]. The distal stomach (i.e. corpus and antrum) generates peristaltic contractions that originate in the proximal corpus [3, 4]. Peristaltic contractions result from rhythmic depolarizations of smooth muscle cells (SMCs), known as slow waves, and excitation-contraction coupling due to activation of voltage-dependent Ca2+ channels expressed by SMCs [4–7]. The dominant pacemaker area in the stomach resides typically in the corpus along the greater curvature of the stomach, and slow waves generated by this pacemaker propagate distally to the pyloric sphincter [3].
Gastric slow waves originate from and propagate actively within networks of interstitial cells of Cajal that lie between the circular (CM) and longitudinal muscle (LM) layers in the plane of the myenteric plexus (i.e. ICC-MY) [8, 9]. ICC-MY are multi-polar cells with processes that form gap junctions with other ICC and less frequently with SMCs [10, 11]. Thus, SMCs and ICC-MY are electrically coupled, forming along with another type of interstitial cell, known as PDGFRα+ cells [12], the SIP syncytium [13]. The inward currents that cause slow wave depolarization conduct passively to SMCs, as these cells lack the mechanism required for slow wave regeneration [14].
Much about the molecular and functional characteristics of ICC has been revealed during the past 3 decades, but the pacemaker mechanism is not fully understood. Loss of ICC or the functions of ICC are a major factor in functional motility disorders in the proximal GI tract [15–17], so better understanding of the pacemaker mechanism may provide insights into new therapeutic approaches for treating gastroparesis, functional dyspepsia and other motility disorders. ICC express the receptor tyrosine kinase, c-Kit, and depriving ICC precursors of signaling via c-Kit causes defects in ICC [18, 19] or lesions in ICC networks in adult animals [8]. ICC express Ano1, that encodes a Ca2+-activated Cl− channel (CaCC), that is involved in the initiation of slow waves and also contributes to the plateau phase of slow waves [20–23]. The majority of prior studies were performed on ICC of the small intestine, an often-used model for pacemaker activity and function of ICC-MY. However, gastric slow waves are fundamentally different from the events in the small intestine in that gastric slow waves are longer in duration and generate peristaltic rather than segmental motility patterns. A proximal-to-distal frequency gradient exists in gastric slow wave activity in animal models, and active propagation of slow waves occurs over many centimeters in larger animals [24–26]. Reasons for the long durations of gastric slow wave depolarizations and why ICC-MY in the corpus generate the dominant slow wave frequency in gastric muscles are unknown, but these questions are important because gastric arrhythmias, aberrant slow wave activity and disrupted peristalsis are associated with gastric emptying disorders in diabetic and idiopathic forms of gastroparesis [15, 27–31].
Ubiquitous high expression of Ano1 (aka Tmem16a) in ICC [20, 32, 33] suggests that regulation of intracellular Ca2+ ([Ca2+]i) is a fundamental process in these cells. Indeed, changes in [Ca2+]i have been observed in studies of ICC and different patterns of Ca2+ dynamics have been noted in ICC with pacemaker functions and ICC thought to be involved in transduction of inputs from motor neurons [21–23, 34–37]. Release of Ca2+ activates Ano1 channels in the plasma membranes of ICC, generating spontaneous transient inward currents (STICs) [38]. STICs cause spontaneous transient depolarizations (STDs) that can bring membrane potential to the threshold for generation of a slow wave. We hypothesized that dynamic transitions in [Ca2+]i are fundamental for pacemaker activity in gastric ICC-MY: Ca2+ transients initiate slow waves and persistent Ca2+ release events maintain the long duration of depolarization that constitutes the plateau phase of gastric slow waves. We also hypothesized that differences in Ca2+ dynamics are responsible for the dominance of corpus ICC as gastric pacemakers. Using a novel mouse engineered with constitutive expression of the Ca2+ sensor GCaMP6f has allowed cell-specific, high resolution video imaging of Ca2+ transients in ICC in situ.
2. Materials and methods
2.1. Animals
Kit+/copGFP mice (B6.129S7-Kittm1Rosay/J; 5–8 wk old) were bred in house (Ro et al. 2010).
Kit-KI-GCaMP6f mice, a new transgenic mouse that expresses GCaMP6f driven by the endogenous Kit promotor, were generated and maintained in our animal facility [39]. GCaMP6f-floxed mice (Ai95 (RCL-GCaMP6f)-D) were purchased from Jackson Laboratories (Bar Harbor, MN, USA). Kit-iCre mice (c-Kit+/Cre-ERT2) were gifted from Dr. Dieter Saur (Technical University Munich, Munich, Germany). Indicible Cre mice were injected with tamoxifen (TAM; Intraperitoneal injection; IP) at 7–8 weeks of age (2 mg of TAM for three consecutive days), as described previously [40], to induce activation of the Cre recombinase and expression of the GCaMP6f sensor. Both strains of mice expressing the Ca2+ sensor, TAM injected Kit-iCre-GCaMP6f and the Kit-KI-GCaMP6f, rely on GCaMP6f to report Ca2+ dynamics. Both strains had similar Ca2+ signal kinetics in ICC.
Mice were anaesthetized by inhalation of isoflurane (Baxter, Deer-field, IL, USA) and killed by cervical dislocation before removal of gastric tissues. All animals and procedures performed in this study were approved by the Institutional Animal Use and Care Committee at the University of Nevada, Reno and in accordance with the National Institutes of Health Guide for the Care and Use of Laboratory Animals.
2.2. Tissue preparation
The abdomen was opened and the entire stomach was removed from mice and placed in oxygenated Krebs-Ringer bicarbonate solution (KRB). The stomachs were cut along the lesser curvature and intraluminal contents were washed away with KRB. The corpus and antrum regions of the stomach were isolated from the fundus and pyloric regions by surgical incisions.
The corpus and antrum were distinguished and separated from each other by an incision across the incisura angularis and the mucosal layers were carefully removed by sharp dissection. Corpus and antrum segments were isolated from the greater curvature of the stomach.
2.3. Cell sorting and quantitative PCR
Kit+/copGFP mice (B6.129S7-Kittm1Rosay/J; 6–8 wks old) were used for evaluations of gene expression in antrum and corpus ICC. After enzymatic dispersion of muscles, ICC were sorted by fluorescence-activated cell sorting (FACS) and assessed for purity as previously described [34]. Total RNA was isolated using an Illustra RNAspin Mini RNA Isolation Kit (GE Healthcare). qScript cDNA SuperMix (Quanta Biosciences) was used according to the manufacturer’s instructions to synthesize first-strand cDNA. Quantitative PCR (qPCR) was performed using Fast Sybr Green chemistry on the 7900HT Fast Real-Time PCR System (Applied Biosystems) and gene-specific primers (Supplemental Table 1). Regression analysis was performed to generate standard curves from the mean values of technical triplicate qPCRs of log10 diluted cDNA samples. Evaluation of gene expression in ICC was compared with expression in the unsorted cells from antrum and corpus muscles of Kit+/copGFP mice.
2.4. Electrophysiological experiments
Corpus and antrum tissues (2 × 6 mm), cut parallel to the circular layer from the greater curvature, were placed in a Sylgard coated (Dow Corning, Midland, MI) recording chamber with the serosal aspect of the muscle facing upward. One end of the muscle strip, corresponding to the greater curvature was pinned to the floor of the chamber with tungsten pins (50 μm; Goodfellow, Huntingdon, England); the other end of the muscle strip, corresponding to the lesser curvature, was attached to a Gould isometric strain gage (Gould UC3; Gould Instruments, OH, USA) with suture thread. A resting force of 5 mN was applied, which was previously shown to set the muscles at optimum length [41]. The muscles were allowed to equilibrate for 1 hour while being perfused with oxygenated 37 °C KRB. Intracellular microelectrode recordings were performed, as previously described [41]. Briefly, circular muscle cells near the greater curvature were impaled with glass microelectrodes having resistances of 80–120 MΩ. Transmembrane potentials were recorded with a high impedance electrometer (Axon Instruments, Axon Instruments, Union City, CA, USA). Data were recorded on a computer running AxoScope 10 data acquisition software (Axon Instruments) and figures were made using Clampfit analysis software (Axon Instruments).
2.5. Ca2+ imaging of ICC-MY in situ
Isolated muscles from the corpus and antrum regions were pinned in imaging chambers and equilibrated for 60 min while perfusing the chamber with 37 °C KRB. A spinning-disk confocal system (CSU-W1; spinning disk, Yokogawa Electric, Tokyo, Japan) attached to an upright Nikon Eclipse FN1 microscope was used for Ca2+ imaging. The system was equipped with two solid-state laser lines of 488 nm and 561 nm. The laser lines are combined with a borealis system (ANDOR Technology, Belfast, UK). Two high-speed electron multiplying charged coupled devices (EMCCD) cameras (Andor iXon-Ultra 897 EMCCD Cameras; ANDOR Technology, Belfast, UK) are mounted to the system to maintain fast speed acquisition at full frame of 512 × 512 active pixels, as previously described [42]. Images sequences were acquired using water immersion Nikon CFI Fluor lenses (10 × 0.3 NA, 20 × 0.5 NA, 40 × 0.8 NA, 60 × 0.8 NA and 100 × 1.1 NA) (Nikon Instruments, New York, USA) at 33 – 50 fps and MetaMorph software (MetaMorph Inc., TN, USA). In experiments with pharmacological agents, control images were collected (30 s) and then after responses to drugs (20 min). It has been previously demonstrated that slow waves in the gastric antrum are not inhibited by nifedipine [43, 44]. Therefore, experiments were performed in the presence of nicardipine (1 μm) to reduce movements and facilitate high-resolution imaging of cells in situ.
2.6. Analysis of Ca2+ imaging experiments
Image sequences of Ca2+ transients in ICC-MY (stacks of TIFF images) were exported and transferred to an analysis workstation computer for preprocessing and analysis, as previously described [45]. Briefly, Fiji/Image J (National Institutes of Health, MD, USA, http://rsbweb.nih.gov/ij), Automated Spatio Temporal Map analysis plugin (STMapAuto), https://github.com/gdelvalle99/STMapAuto [46] and custom build software (Volumetry G8d) were used. Movies of Ca2+ transients were motion stabilized, background subtracted and smoothed (Gaussian filter: 1.5 × 1.5 μm, StdDev 1.0). A particle analysis was employed using a flood-fill algorithm to enhance Ca2+ firing site activity detection. The areas of Ca2+transients in cells were saved as Ca2+ particles (PTCLs), and the combined areas and total number of PTCLs were calculated. To show the overall regions in fields of view (FOV) where Ca2+ transients occurred, PTCLs were summed throughout the video to map their occurrence. The spatial information in the Ca2+ occurrence maps data is an indication of each firing site that gives information on their temporal activation.
2.7. Drugs and solutions
KRB solution containing (mmol/L): NaCl, 5.9; NaHCO3, 120.35; KCl, 1.2; MgCl2, 15.5; NaH2PO4,1.2; CaCl2, 2.5; and glucose, 11.5 was used to maintain tissues physiological conditions. The KRB solution was warmed to a physiological temperature of 37 ± 0.3 °C and bubbled with a mixture of 97% O2 – 3% CO2. For experiments utilizing external solutions with 0 [Ca2+]o, CaCl2 was omitted and 0.5 mM ethylene glycolbis (b-aminoethyl ether)-N, N, N’, N’–tetraacetic acid (EGTA) was added to the solution. Nicardipine, pinacidil was purchased from Millipore-Sigma (St. Louis, Missouri, USA). NNC 55–0396 were purchased from Alomone Labs (Jerusalem, Israel). Thapsigargin, isradipine and CPA were purchased from Tocris Bioscience (Ellisville, Missouri, USA). GSK 7975A was purchased from Aobious (Aobious INC, MA, USA).
2.8. Statistical analysis
Statistical analyses were performed using either a Students t-test or one-way ANOVA with a Tukey post hoc test where appropriate. Data is presented as the mean ± standard error unless otherwise stated. In all tests, P < 0.05 was considered significant. When describing data, n refers to the number of animals used in a dataset. Probabilities < 0.05 are represented by a single asterisk (*), probabilities < 0.01 are represented by two asterisks (**), probabilities < 0.001 are represented by three asterisks (***) and probabilities < 0.0001 are represented by four asterisks (****). Statistical tests were performed on original datasets. All statistical tests were performed using GraphPad Prism 8.0.1 (San Diego, CA).
3. Results
3.1. Electrical and mechanical behaviors in corpus and antrum muscles
ICC generate electrical slow waves that are conducted to SMCs in GI muscles to produce motility behaviors. In the stomach slow waves occur at higher intrinsic frequencies in the corpus than in the antrum, and we sought to characterize these differences in the mouse stomach.
Circular muscle cells in strips of gastric corpus were impaled and displayed inter-slow wave membrane potentials (e.g. RMP at the most negative level) averaging −58 ± 1 mV. Slow waves occurred spontaneously at 7.1 ± 0.4 cycles min−1 and averaged 15.1 ± 1.7 mV in amplitude and ½ maximal duration of 3.6 ± 0.3 s occurred (Fig. 1A; n = 11). Corpus slow waves consisted of an initial slow depolarization, often with spontaneous transient depolarizations (STDs) superimposed, followed by a sinusoidal wave with superimposed STDs (Fig. 1A&E). Each slow wave was associated with a phasic contraction of the muscle (i.e. 7.1 ± 0.4 cycles min−1) averaging 0.34 ± 0.05 mN in amplitude (Fig. 1B).
Fig. 1. Electrical and mechanical activities of gastric corpus and antrum.
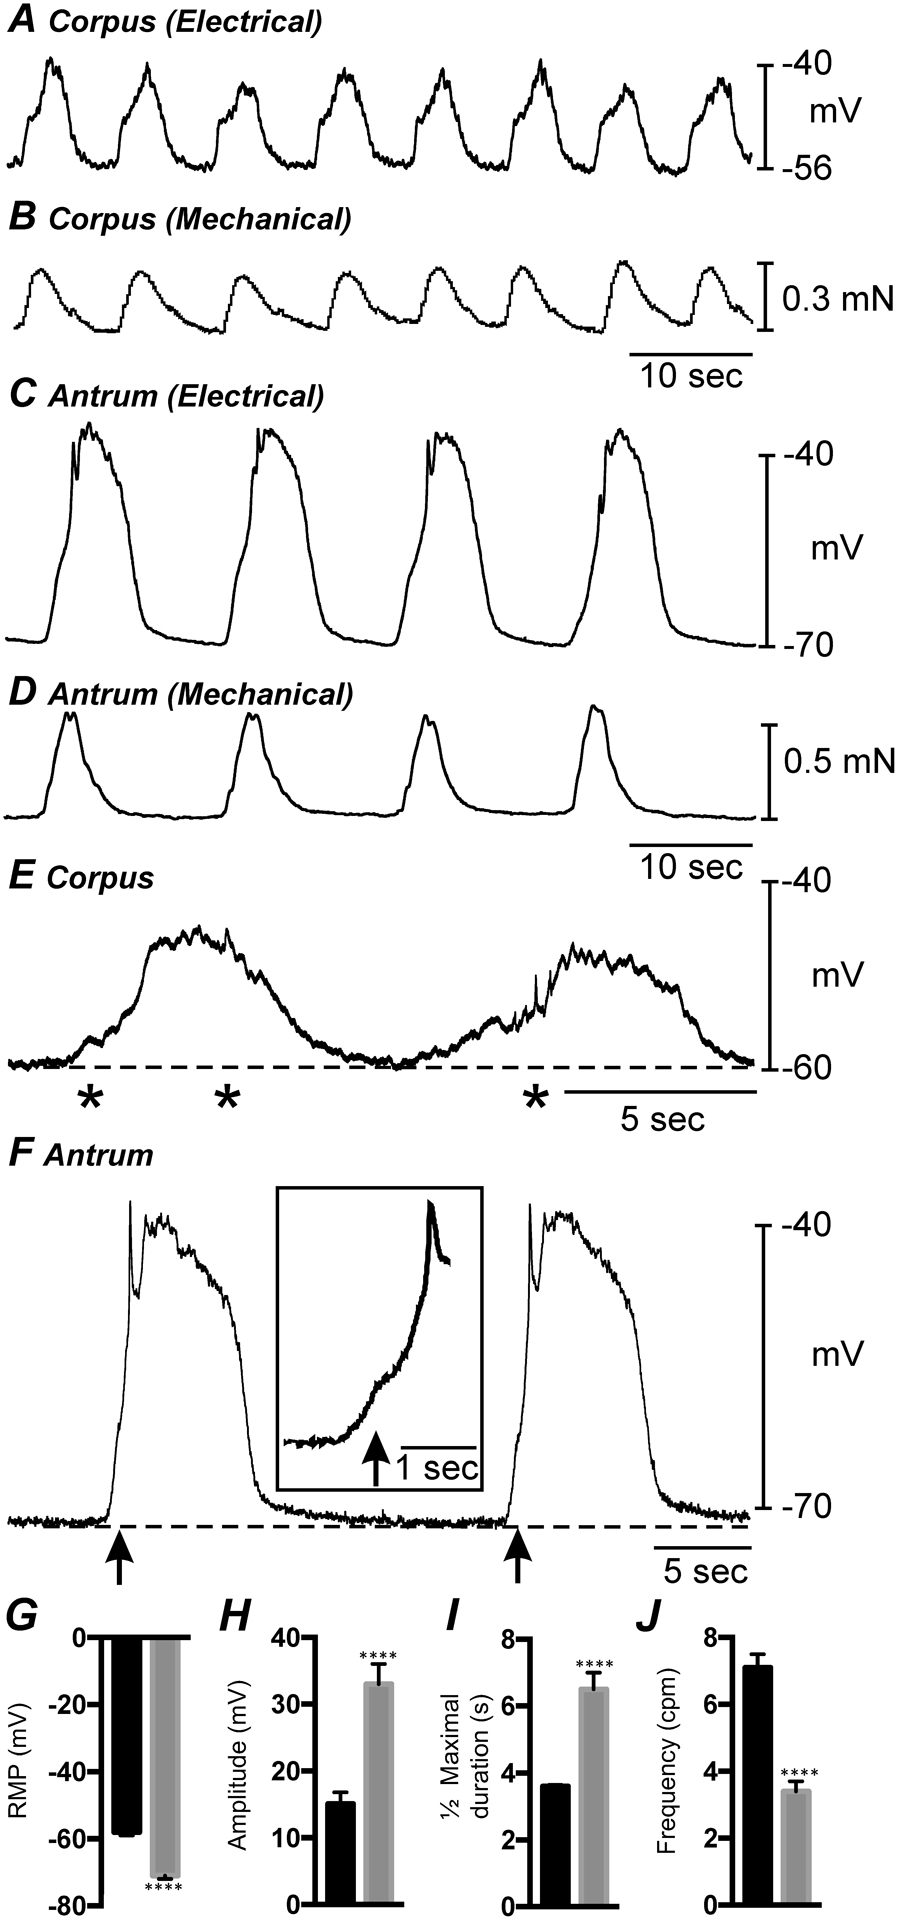
A&B show simultaneous intracellular electrical and isometric force recordings from the gastric corpus. C&D show similar recordings of electrical and mechanical activity from the gastric antrum. The gastric corpus is more depolarized and slow waves are at a greater frequency than antrum. Corpus slow waves are also smaller in amplitude and do not produce as forceful contraction as antrum. E shows gastric corpus slow waves at a faster sweep speed. Corpus slow waves consisted of an initial slow depolarization with spontaneous transient depolarizations (STDs; *) followed by a sinusoidal wave that also had superimposed STDs. F shows gastric antrum slow waves at a faster sweep speed. Antrum slow waves consisted of an upstroke depolarization, partial repolarization, and a plateau phase that was sustained for several seconds before repolarization to a diastolic RMP. An inflection (arrows and inset) often separated the upstroke phase into two discrete components. G–J Summarized bar graphs illustrating the differences in RMP and electrical slow wave parameters between corpus and antrum. **** P < 0.0001. All data graphed as mean ± SEM. n = 11.
Circular muscle cells in the gastric antrum, investigated in the same manner, displayed more polarized RMPs compared to the corpus, averaging −71 ± 1 mV (Fig. 1G; n = 11). Slow waves recorded from antrum cells were more robust and amplitude compared to the corpus that averaged 33 ± 3 mV (Fig. 1H; n = 11) and ½ maximal duration of 6.5 ± 0.5 secs (Fig. 1I; n = 11). However, the frequency of antrum slow waves was less (3.4 ± 0.3 cycles min−1; Fig. 1J; n = 11) than the frequency of these events in the corpus. Antrum slow waves typically consisted of an upstroke depolarization, partial repolarization, and a plateau phase that was sustained for several seconds before repolarization to the RMP. In recordings from some cells the upstroke depolarization displayed an inflection that tended to separate this phase into two discrete components (see Fig. 1F and inset in Fig. 1F). As with corpus muscles, each antrum slow wave was associated with a phasic contraction (i.e. 3.4 ± 0.3 min−1; Fig. 1D; n = 6) that averaged 0.46 ± 0.07 mN in force. A summary of the differences in RMP and electrical slow wave parameters between gastric corpus and antrum is summarized in (Fig. 1G–J).
Gastric muscles undergo spontaneous phasic contractions which make post-acquisition analysis of imaging data difficult due to movement artifacts. Therefore, in imaging experiments discussed below we suppressed the contractile activities if the muscles by addition of nicardipine or nifedipine in all experiments. We first tested the effects of the dihydropyridine, nifedipine, on electrical activity to confirm that this class of drugs did not disrupt or block slow waves (Fig. 2; n = 10). In these expeirments the RMP of antrum muscles averaged −72 ± 1.6 mV (Fig. 2 Ca; n = 10), and slow waves were observed with an average amplitude of 38 ± 2.7 mV (Fig. 2 Cb; n = 10), a ½ maximal duration of 6.2 ± 0.4 secs (Fig. 2 Cc; n = 10) and frequency of 3.3 ± 0.2 cycles min−1 (Fig. 2 Cd; n = 10). Nifedipine (1μM) caused a small depolarization in RMP to −69 ± 1.5 mV and reduced the ½ maximal duration of slow waves to 4.1 ± 0.5, other electrical parameters were not changed from control (Fig. 2 Cb&Cd; n = 10). The effects of nifedipine on electrical activity are summarized in (Fig. 2 Ca–Cd).
Fig. 2. Effect of l-type Ca2+ channel inhibition on antrum slow waves.
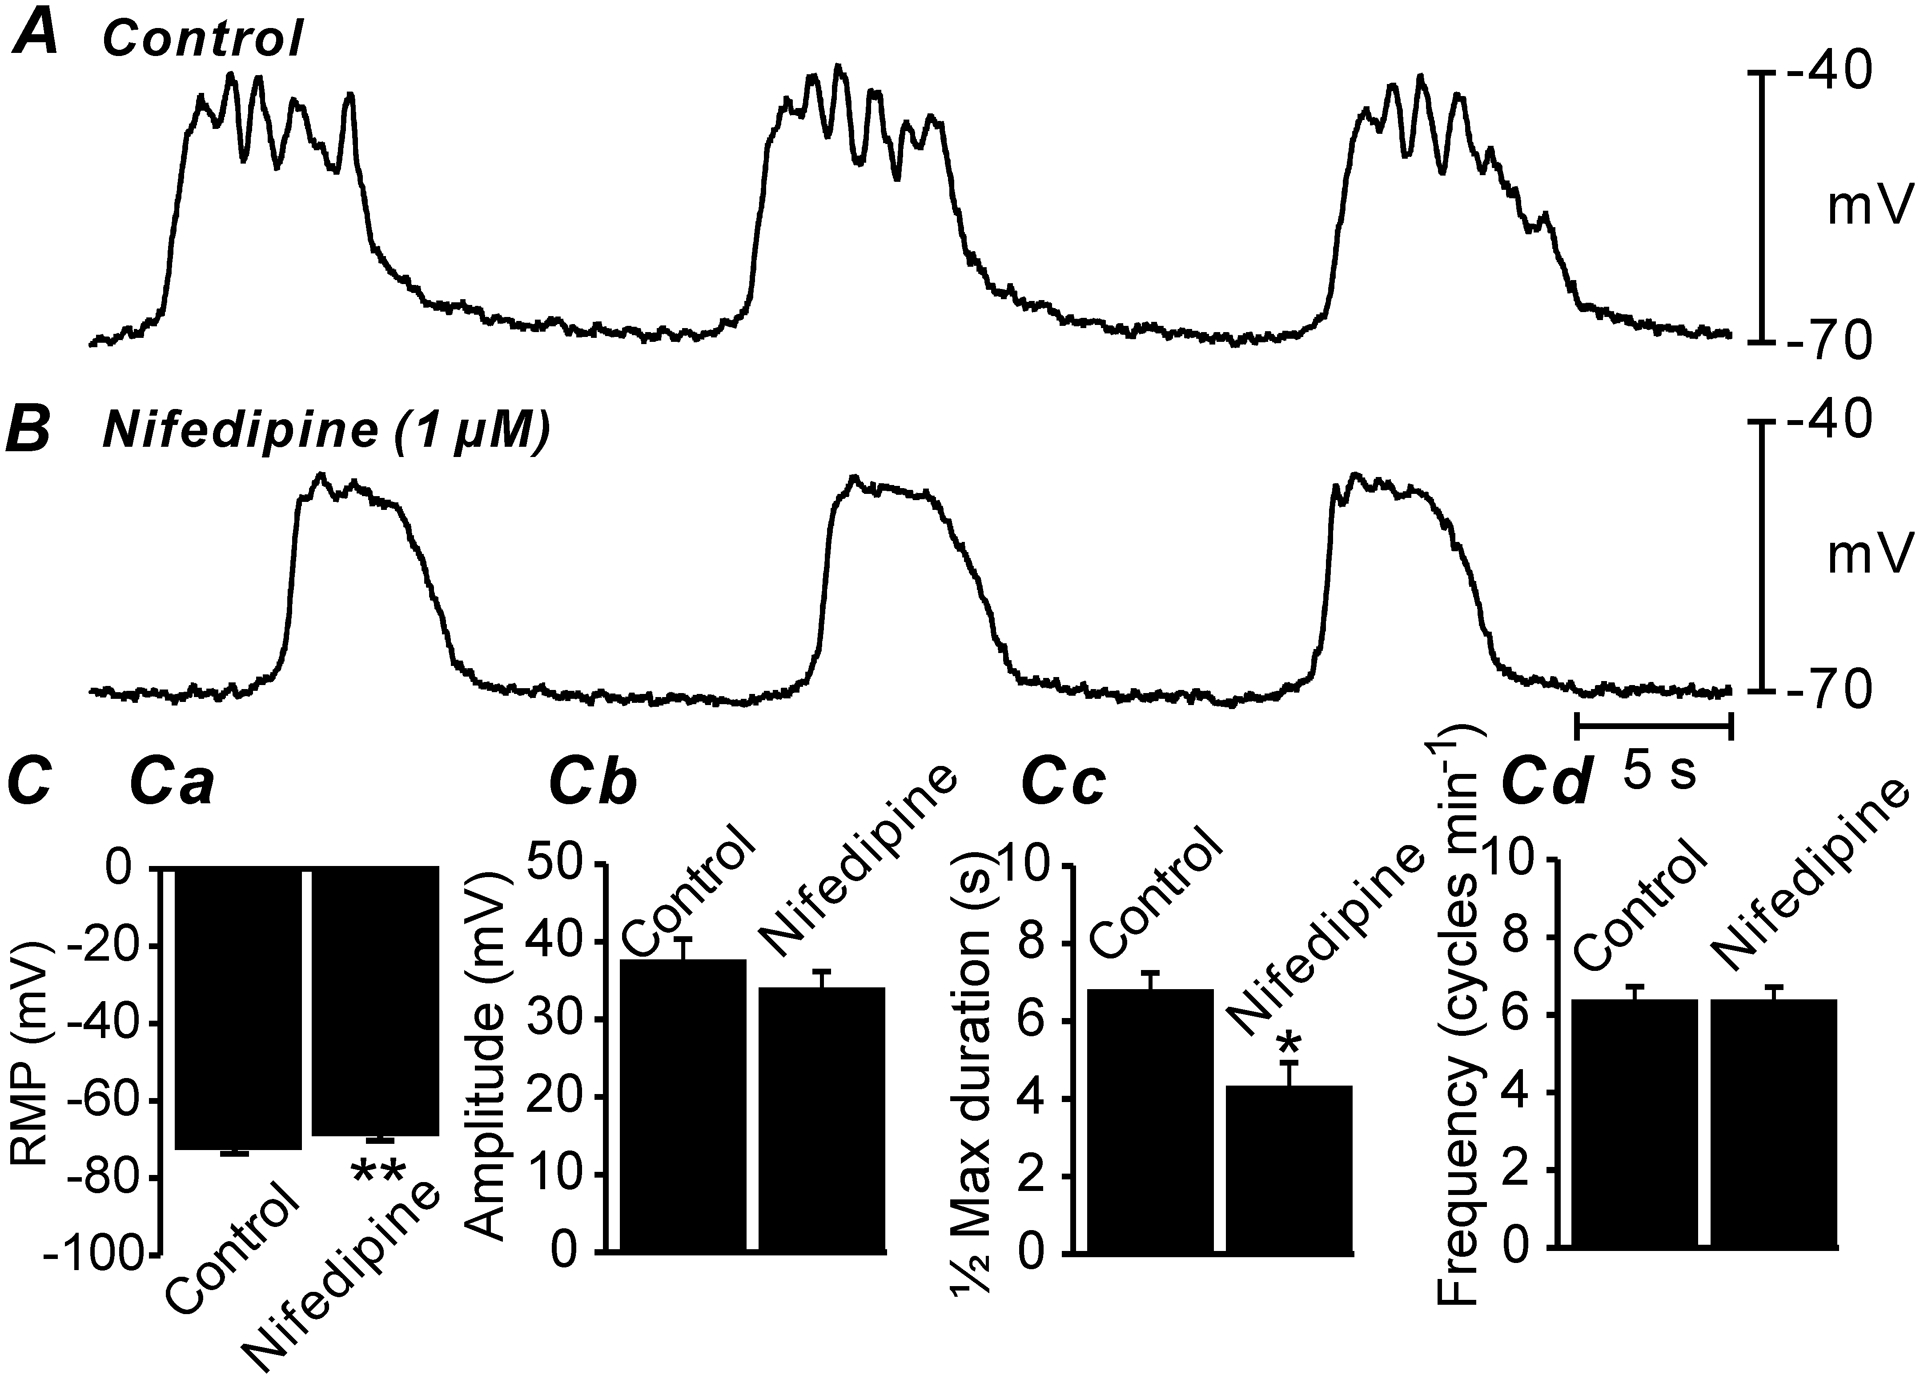
A&B Electrical slow waves of the gastric antrum under control conditions (i.e. no drugs; A) and after the addition of nifedipine (1μM; B). Note the slight membrane depolarization and reduced ½ maximal duration. C Summarized data of changes in RMP Ca, slow wave amplitude Cb, ½ maximal duration of slow waves Cc and slow wave frequency Cd. Only RMP and ½ maximal duration of slow waves was significantly affected by nifedipine. All data graphed as mean ± SEM. n = 10, * P < 0.05; ** P < 0.01.
3.2. Ca2+ dynamics in ICC-MY of the corpus and antrum
ICC-MY have been reported to be the pacemaker cells responsible for generating slow waves in gastric muscles [8, 9], and Ca2+-activated Cl− channels encoded by Ano1 are required for slow wave activity [20, 47]. Therefore, we imaged Ca2+ dynamics as displayed by GCaMP6f expressed in ICC-MY in isolated corpus and antrum muscles at 60–100x. This approach allowed visualization of Ca2+ transients with high spatial resolution. Subcellular Ca2+ transients originated from a multitude of distinct firing sites in ICC-MY networks (Fig. 3A–H; n = 10). Activity plots of Ca2+ transients during 30 s of recording from gastric corpus (Fig. 3C) and antrum (Fig. 3G and supplemental movie 1) showed that firing of Ca2+ transients is organized into temporal clusters (Ca2+ transient clusters or CTCs). The avarge frequency of CTCs in the corpus were 6.9 ± 0.3 cpm, and in the antrum 4.2 ± 0.4 cpm (n = 10) which is consistant with gradient in electrical slow waves in corpus and antrum muscles. Each distinct firing site was color-coded in corpus and antrum ICC-MY (Fig. 3B&F) and plotted as a function of time as occurrence maps (Fig. 3D&H) to visualize and quantify the origin and activity of Ca2+ transients. Occurrence maps constructed from the Ca2+ transients in corpus ICC-MY (Fig. 3D) and antrum ICC-MY (Fig. 3H) showed that firing sites could fire once or multiple times during CTCs. The number of firing sites in a single ICC-MY in the corpus ranged from 2 to 6 sites, and in the antrum ranged from 3 to 8 sites (Fig. 3I). Ca2+ firing sites were most active during the first 600 ms after initiation of a CTC, and then activity waned with time in corpus and antrum ICC-MY (Fig. 3I; n = 10). The average number of firing sites discharging at various times during CTCs is illustrated in the distribution histogram in Fig. 3I. The initial high rate of Ca2+ transients and decay as a function of time would suggest that Ca2+ influx could be an important factor for initiation of Ca2+ transients and organizing the Ca2+ transients into CTCs.
Fig. 3. Differences in Ca2+ transients firing in ICC-MY between the corpus and antrum.
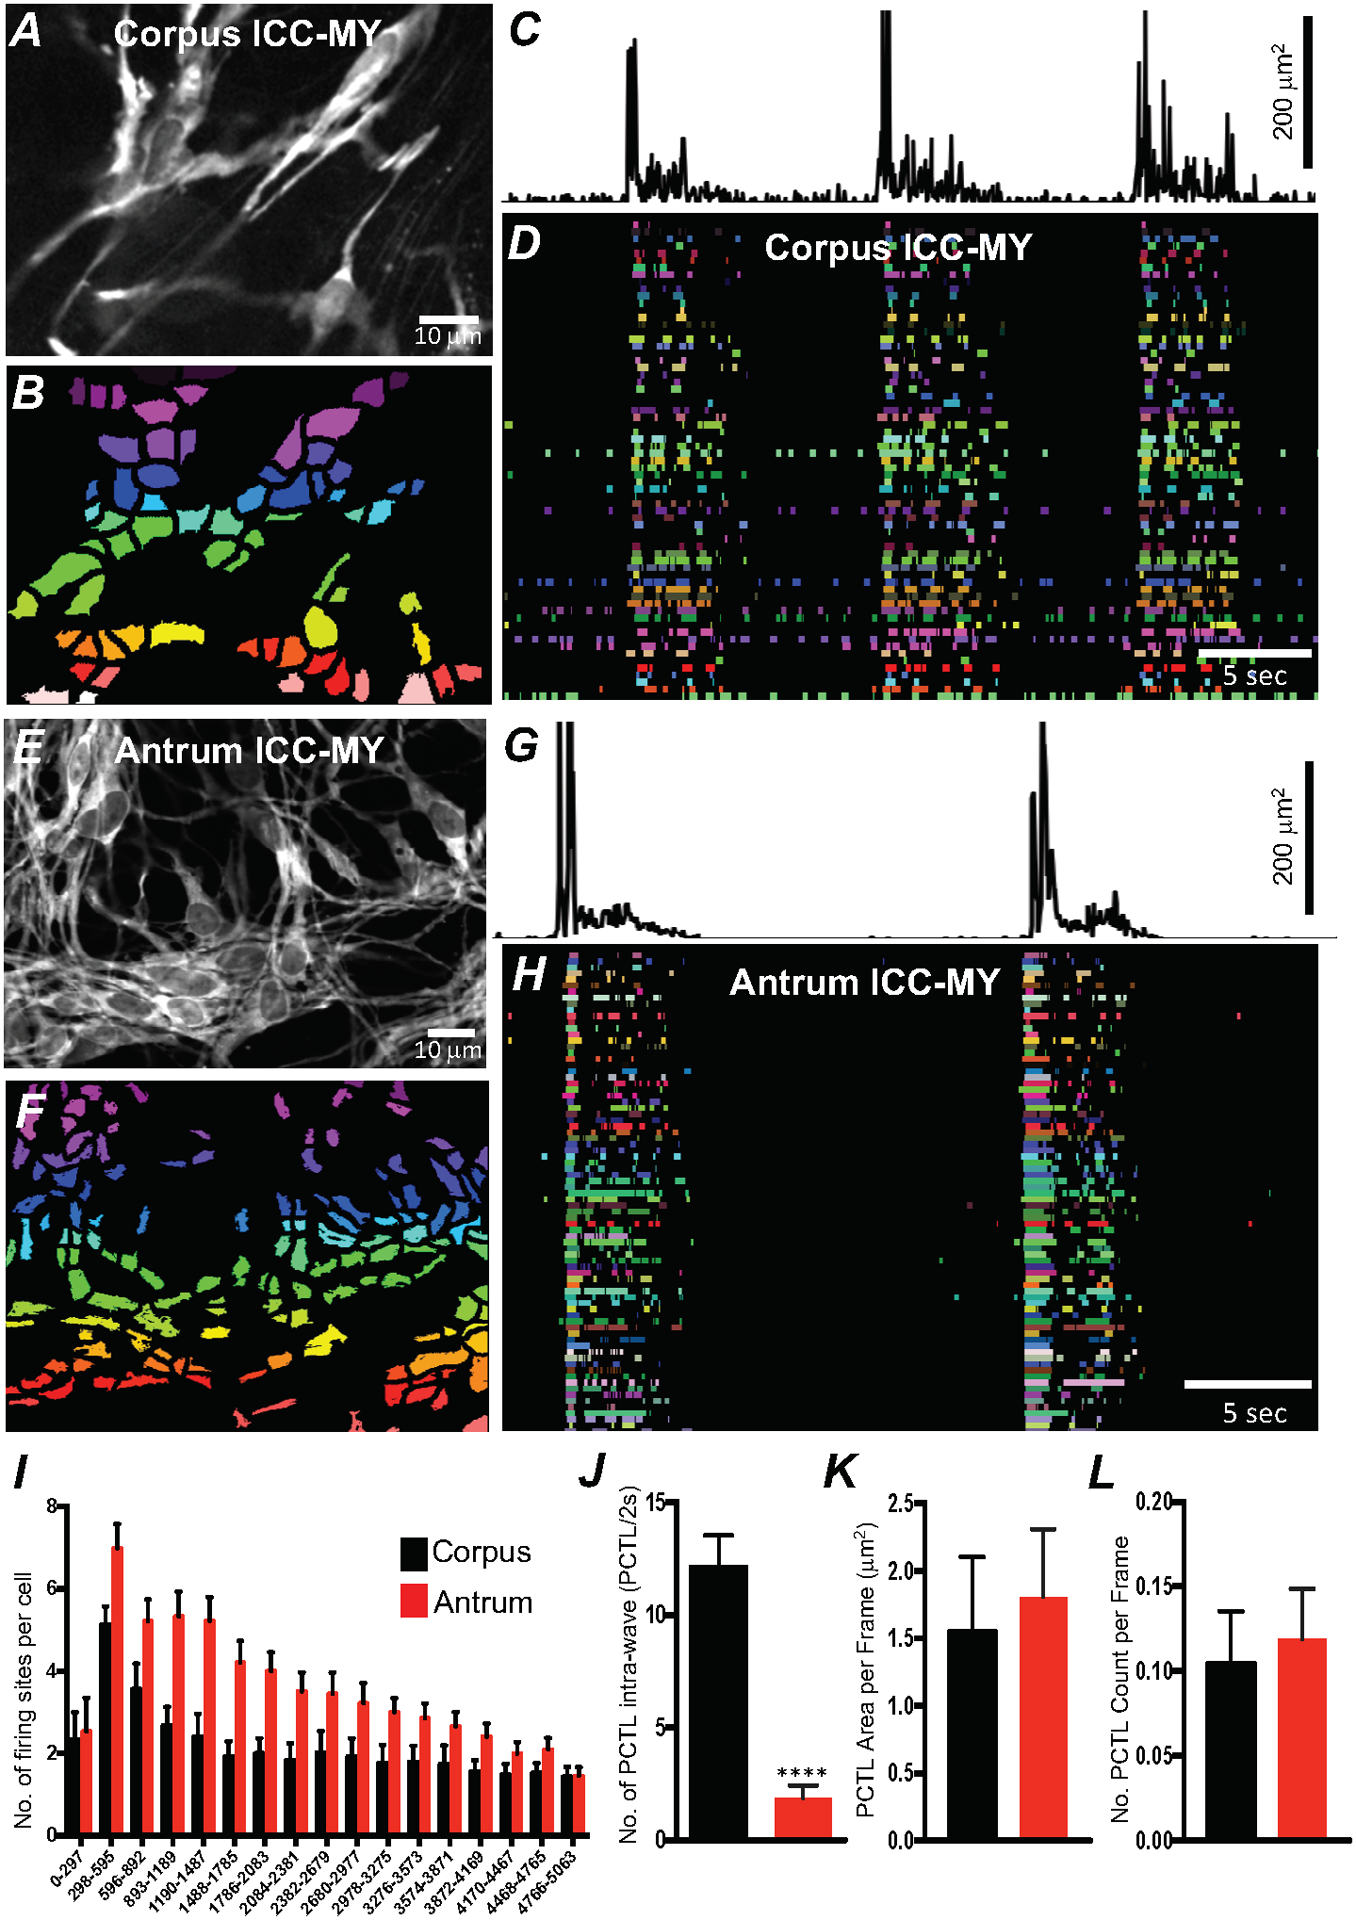
A Image of an ICC-MY network from gastric corpus of a Kit-GCaMP6 mouse at 60 × magnification. B Image showing individually color-coded Ca2+ firing sites in the FOV shown in A. C Plot of total Ca2+ transients PTCLs activity from all ICC-MY Ca2+ firing sites within the FOV in the corpus. D The temporal characteristics of each individual, color-coded firing site is displayed as an occurrence map, with each “lane” representing the occurrence of firing PTCLs within each firing site. Note that multiple corpus ICC-MY Ca2+ sites fires during the intra-wave period. E Representative image of an ICC-MY network from gastric Antrum at 60 × magnification. F Image showing individually color-coded Ca2+ firing sites in the FOV shown in E (see Supplemental Movie 1). G Total Ca2+ transients activity plot from all ICC-MY Ca2+ firing sites within the FOV in the antrum. H an occurrence map, with each “lane” representing the occurrence of firing PTCLs within each firing site. Note that limited number of Ca2+ sites firing during the intra-wave period in antrum ICC-MY. I Distribution plot showing averages of firing sites number during a Ca2+ wave in ICC-MY corpus and antrum. Values are calculated for 5 s and plotted in 297 ms bins (n = 10). J Summary graph show average number of PTCL Ca2+ firing sites in ICC-MY during the intra-wave period. K & L Summary graphs show average PTCL areas and counts for Ca2+ firing sites in ICC-MY. ** = P < 0.01, n = 6. All data graphed as mean ± SEM.
A major difference noted between the patterns of Ca2+ transients in corpus and antrum ICC-MY was firing of Ca2+ transients between CTCs. In the antrum CTCs were followed by a nearly quiescent refractory period upon completion of a CTC. Several seconds passed before low levels of activity were observed (Fig. 3H). This low level activity preceeded the firing of the next CTC. In contrast, the period between CTCs in corpus ICC-MY clearly displayed lower levels of Ca2+ transient firing than during CTCs, but multiple events occurred with repetitive Ca2+ transients firing from single firing sites. Thus, Ca2+ signaling was more dynamic during the intervals between CTCs in corpus than in antrum ICC-MY, as tabulated in Fig. 3J (n = 10). An average of 12.2 ± 1.4 sites were active between CTCs in corpus vs. 1.9 ± 0.5 sites in antrum calculated for 2 s before the onset of CTC). This observation suggests that the mechanism responsible for Ca2+ transients is more excitable in corpus than in antum ICC-MY. Although the number of firing sites per cell during CTCs was higher in antrum than in corpus, the area and total number of Ca2+ PTCLs within the FOV was not significantly different in ICC-MY of the two regions (Fig. 3K&L; n = 10).
3.3. Initiation of clustered Ca2+ transients requires a Ca2+ influx mechanism
The effects of reducing extracellular Ca2+ ([Ca2+]o) on Ca2+ transients in antrum ICC-MY were examined. Removal of [Ca2+]o (Ca2+-free KRB solution containing 0.5 mM EGTA) abolished Ca2+ transients within 15 min (Fig. 4; n = 6). Reduction in [Ca2+]o from 2.5 mM to 0 mM decreased firing of Ca2+ transients in a concentration-dependent manner (Fig. 4A–K; n = 6). ICC-MY Ca2+ PTCL area, number of firing sites and CTC frequency were reduced in response to reducing [Ca2+] o (Fig. 4F–H; n = 6). When [Ca2+]o was reduced from 2.5 mM (control conditions) to 1 mM, the average of Ca2+ PTCL area was reduced to 55.8 ± 4.8% of control (Fig. 4I; n = 6), PTCL count to 44.9 ± 7% (Fig. 4J; n = 6). The durations of CTCs were also reduced to 69.8 ± 3.2% in 1 mM [Ca2+]o, but CTC frequency increased slightly, but not significantly, to 108.6 ± 5.4% (Fig. 4K; n = 6). Further reduction in [Ca2+] o to 0.5 mM reduced Ca2+ transient parameters to 22.9 ± 4.6% PTCL area (Fig. 4I; n = 6), 23.8 ± 5.1% PTCL count (Fig. 4J; n = 6). The duration of CTCs were reduced to 24.2 ± 4.8%, and CTC frequency was reduced to 27.3 ± 6.2% (Fig. 4K; n = 6). Removal of Ca2+ from the extracellular solution reduced Ca2+ transient PTCL area to 0.8 ± 0.5% (Fig. 4I; n = 6) and PTCL count was reduced to 1.3 ± 0.8% (Fig. 4J; n = 6). CTCs were abolished in 0 [Ca2+]o (Fig. 4K; n = 6). These experiments highlight the importance of the transmembrane Ca2+ gradient for maintenance of intracellular Ca2+ signaling in ICC-MY.
Fig. 4. Effects of extracellular Ca2+ on ICC-MY Ca2+ transients.
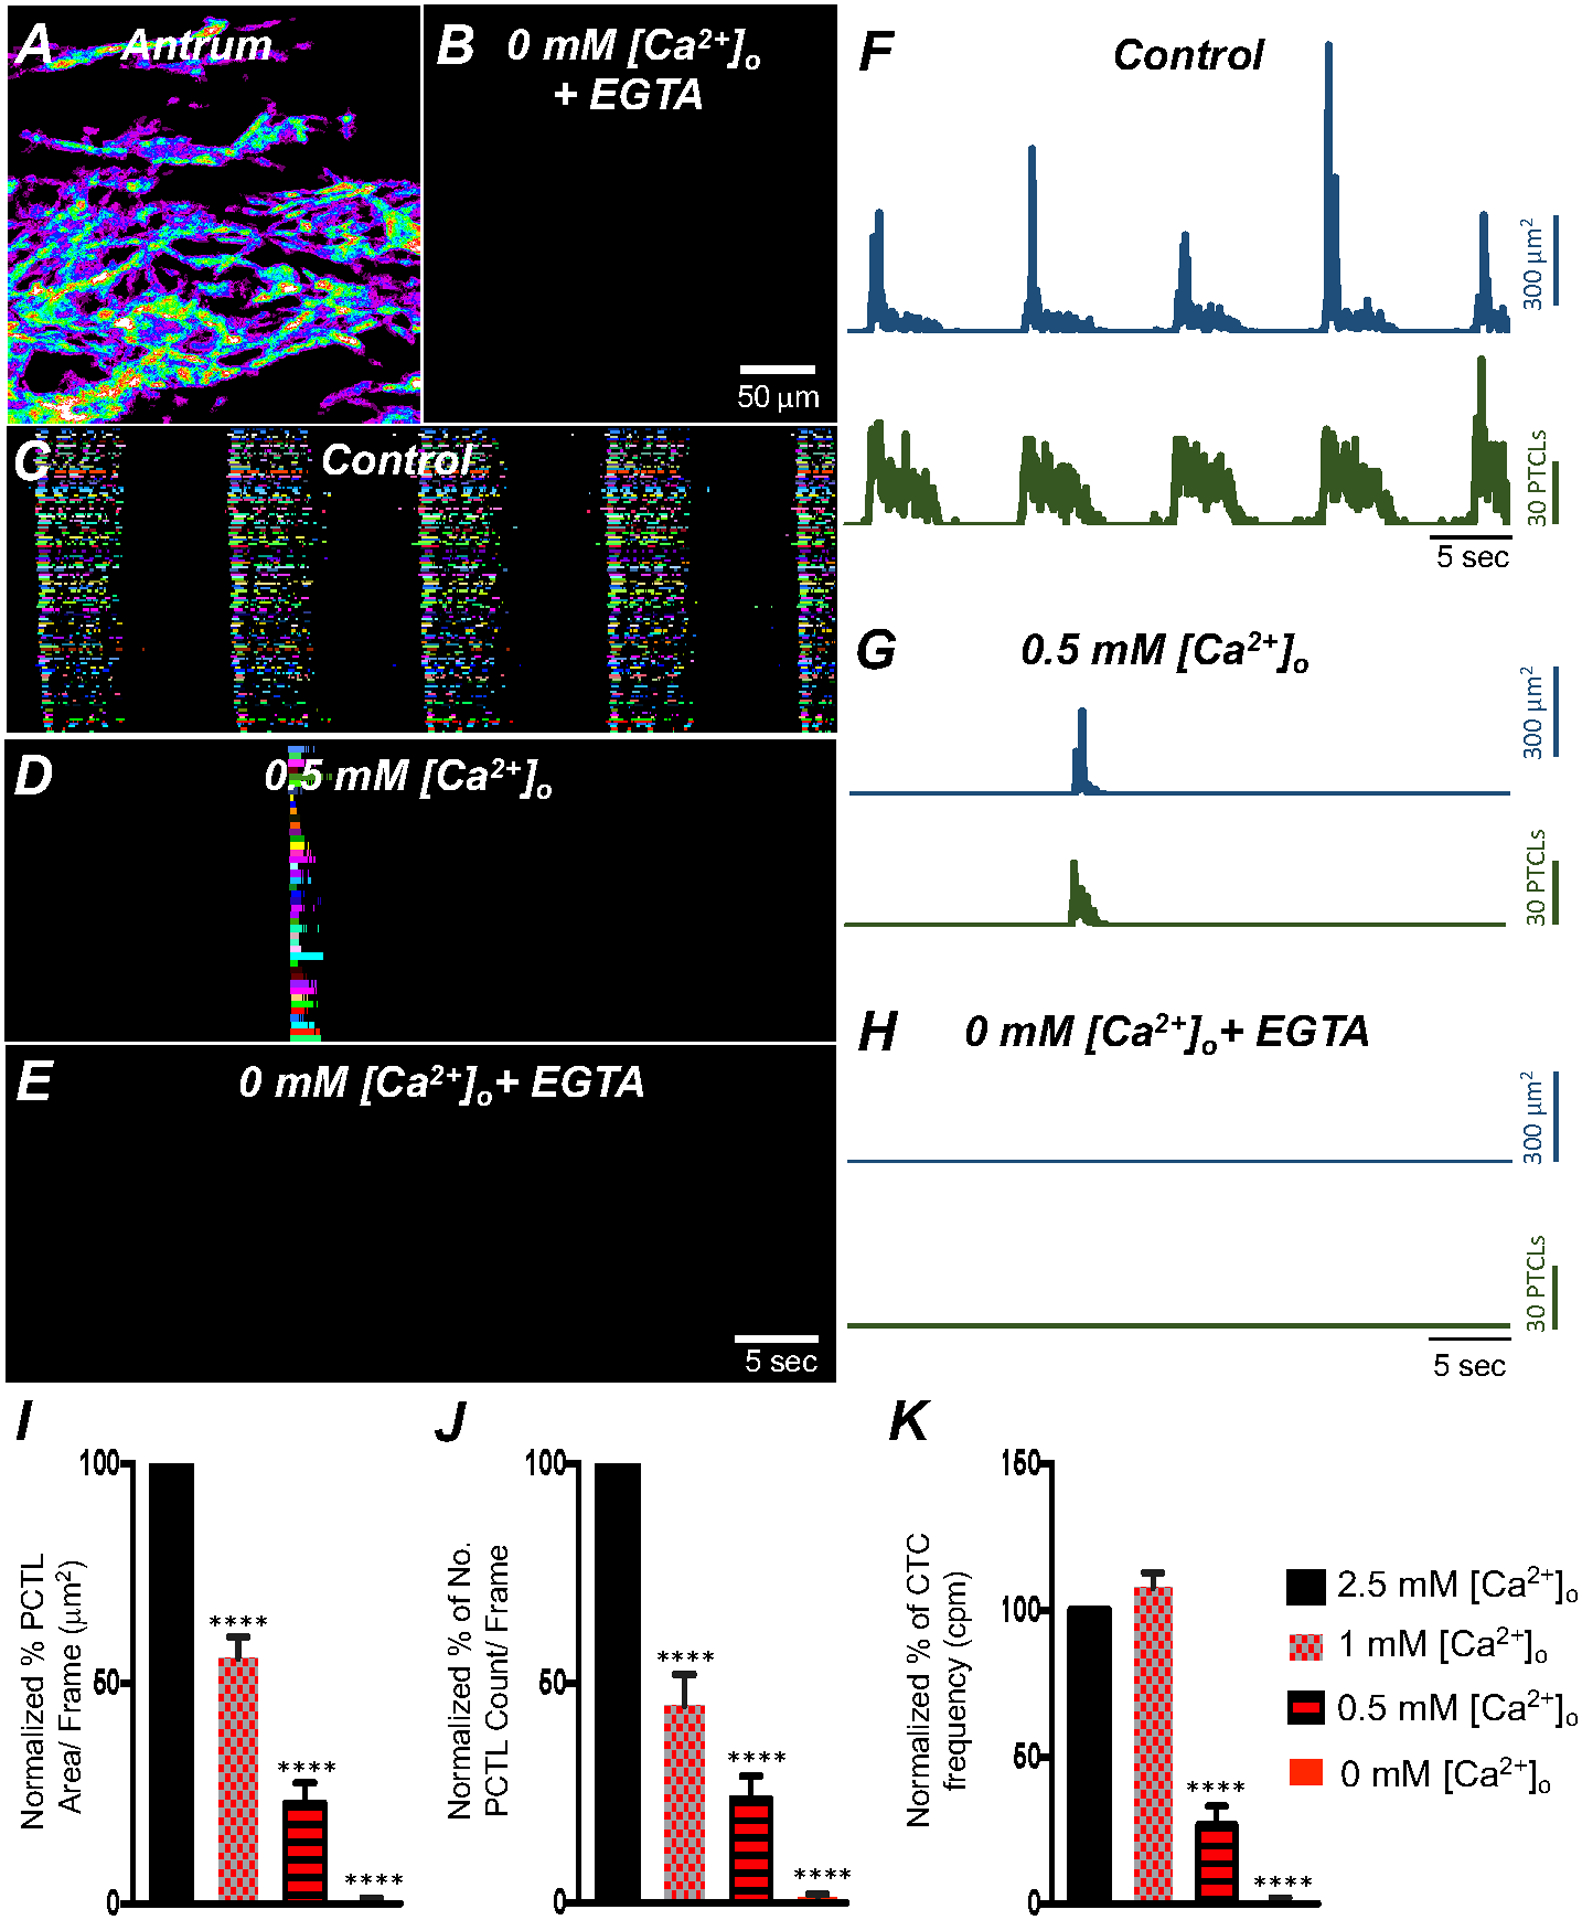
A Colored heat-map image of total Ca2+ transients of antrum ICC-MY under control conditions with [Ca2+]o = 2.5 mM and B after Ca2+ removal from the extracellular solution ([Ca2+]o = 0 mM and 0.5 mM EGTA). Ca2+ activity is color-coded with warm areas (white, red) representing bright areas of Ca2+ fluorescence and cold colors (purple, black) representing dim areas of Ca2+ fluorescence. Scale bar is 50 mm in both A & B. C Ca2+ transients of firing sites in ICC-MY were color-coded and plotted as an occurrence map under control conditions with [Ca2+]o = 2.5 mM. D showing the effects of reducing [Ca2+]o to 0.5 mM Ca2+. E showing the effects of removal of [Ca2+]o (final solution contain 0 mM Ca2+ and buffered with 0.5 mM EGTA). F–H Traces of Ca2+ PTCL activity in ICC-MY (PTCL area, blue and PTCL count, green) under control conditions F, in presence of 0.5 mM Ca2+ G and after removal of [Ca2+]o as shown in H. Summary graphs of Ca2+ PTCLs in ICC-MY under control conditions and with reduced [Ca2+]o to 1 mM, 0.5 mM and removal of [Ca2+]o is plotted in I (PTCL area); J (PTCL count) and K (CTC frequency). Data were normalized to controls and expressed as percentages (%). Significance was determined using one-way ANOVA, **** = P < 0.0001, n = 6. All data graphed as mean ± SEM.
3.4. Expression of Ca2+entry channels in gastric ICC
As demonstrated by the previous experiments the Ca2+ gradient is essential to maintain active Ca2+ transients in gastric ICC-MY. We examined the expression plasma membrane Ca2+ transporters that might be responsible for Ca2+ influx in ICC. ICC expressing the fluorescent reporter copGFP were dispersed enzymatically from corpus and antrum muscles, and ICC were sorted to purity by fluorescence activated cell-sorting (FACS), as previously described [45]. The purity of FACS-sorted antrum and corpus ICC was evaluated using cell-specific markers (Fig. 5A; n = 4). Throughout the GI tract, c-Kit receptors and ANO1 channels are considered signatures for ICC. Cells sorted by FACS displayed significant enrichment in Kit and Ano1 transcripts vs. unsorted cells (Fig. 5A; Table 1). Myh11 (smooth muscle cell marker), pdgfra (platelet-derived growth factor receptor α cell marker), and Uch11 (pan neuronal marker encoding PGP9.5) expression levels were minimal (Fig. 5A; Table 1), suggesting that ICC were enriched in the population of cells sorted by FACS. Expression of voltage-dependent Ca2+ channels and Na+/Ca2+ exchanger isoforms was assayed by qPCR (Fig. 5B&C).
Fig. 5. Molecular expression of Ca2+ influx channels in ICC.
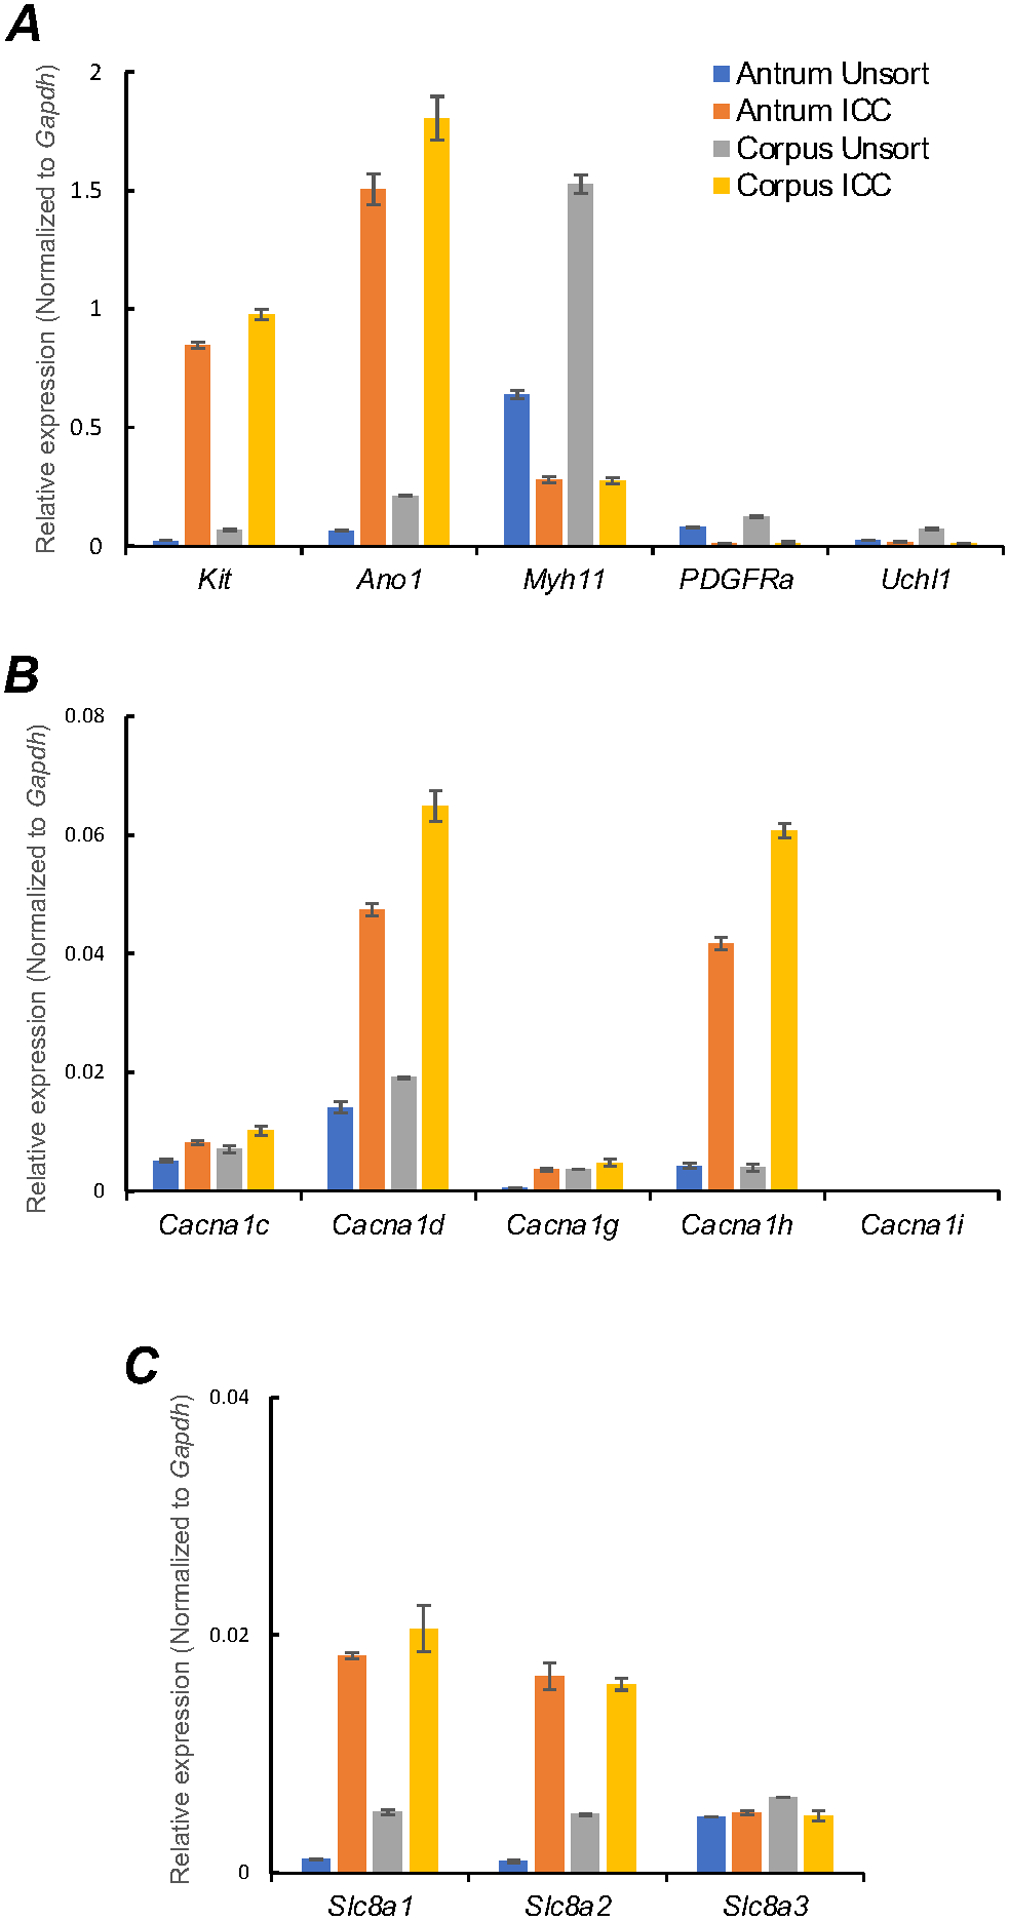
A Relative expression of cellular-specific biomarker genes in ICC (sorted to purity by FACS) and compared with unsorted cells dispersed from gastric antrum and corpus tissues obtained from Kit+/copGFP mice. Relative expression was determined by qPCR and normalized to Gapdh expression. Kit (tyrosine kinase receptor, found in ICC), Ano1 (Ca2+-activated Cl− channel), Myh11 (smooth muscle myosin). PDGFRa (platelet-derived growth factor receptor α cell marker) and Uch11 (neural marker encoding PGP 9.5) B Relative expression of major voltage dependent Ca2+ entry channels, l-Type Ca2+ channels (Cacna1c and Cacna1d) and T-type Ca2+ channels (Cacna1g, Cacna1h and Cacna1i). C Relative expression of the Na+/Ca2+ exchanger (NCX) isoforms (Slc8a1, Slc8a2 and Slc8a3) in gastric antrum and corpus ICC. All data graphed as mean ± SEM (n = 4).
Table 1.
Molecular expression quantification of important Ca2+ signaling genes in gastric ICC.
| Antrum Unsorted cells | ICC | P | Corpus Unsorted cells | ICC | P | |
|---|---|---|---|---|---|---|
| Kit | 0.024 ± 0.0001 | 0.849 ± 0.0057 | **** | 0.069 ± 0.0019 | 0.979 ± 0.0097 | **** |
| Ano1 | 0.064 ± 0.0008 | 1.506 ± 0.0286 | **** | 0.212 ± 0.0012 | 1.806 ± 0.0408 | **** |
| Myh11 | 0.640 ± 0.0079 | 0.280 ± 0.0058 | – | 1.527 ± 0.0176 | 0.275 ± 0.0054 | – |
| PDGFRa | 0.080 ± 0.0016 | 0.011 ± 0.0002 | – | 0.125 ± 0.0012 | 0.014 ± 0.0021 | – |
| Uchl1 | 0.024±0.0004 | 0.017±0.0008 | – | 0.072±0.0012 | 0.011±0.0008 | – |
| Cacna1c | 0.005 ± 0.0003 | 0.008 ± 0.0003 | **** | 0.007 ± 0.0006 | 0.010 ± 0.0006 | – |
| Cacna1d | 0.014 ± 0.0004 | 0.047 ± 0.0004 | **** | 0.019 ± 0.0001 | 0.065 ± 0.0012 | **** |
| Cacna1g | 0.001 ± 0.0001 | 0.004 ± 0.0001 | **** | 0.004 ± 0.0001 | 0.005 ± 0.0003 | **** |
| Cacna1h | 0.004 ± 0.0005 | 0.042 ± 0.001 | **** | 0.004 ± 0.0006 | 0.061 ± 0.0012 | **** |
| Cacna1i | undetected | undetected | undetected | undetected | ||
| Slc8a1 | 0.001 ± 0.00003 | 0.018 ± 0.0001 | **** | 0.005 ± 0.0003 | 0.021 ± 0.0009 | **** |
| Slc8a2 | 0.001 ± 0.00004 | 0.017 ± 0.0005 | **** | 0.005 ± 0.0004 | 0.016 ± 0.0002 | **** |
| Slc8a3 | 0.005 ± 0.0001 | 0.005 ± 0.0001 | – | 0.006 ± 0.0004 | 0.005 ± 0.0002 | – |
| Atp2a1 | undetected | undetected | undetected | undetected | – | |
| Atp2a2 | 0.139 ± 0.0021 | 1.469 ± 0.0128 | **** | 0.372 ± 0.0040 | 1.584 ± 0.0099 | **** |
| Atp2a3 | 0.031 ± 0.0006 | 0.622 ± 0.0062 | **** | 0.094 ± 0.0003 | 0.676 ± 0.0067 | **** |
| Itpr1 | 0.029 ± 0.0002 | 0.079 ± 0.0010 | **** | 0.076 ± 0.0033 | 0.116 ± 0.0005 | – |
| Itpr2 | 0.012 ± 0.0004 | 0.007 ± 0.0005 | – | 0.014 ± 0.0003 | 0.013 ± 0.0002 | NS |
| Itpr3 | 0.010 ± 0.00002 | 0.002 ± 0.00007 | – | 0.017 ± 0.0009 | 0.001 ± 0.0001 | – |
| Ryr1 | 0.0004 ± 0.0001 | 0.001 ± 0.0001 | **** | 0.0002 ± 0.0001 | 0.0004 ± 0.0001 | * |
| Ryr2 | 0.005 ± 0.001 | 0.012 ± 0.0006 | **** | 0.006 ± 0.0002 | 0.013 ± 0.0011 | **** |
| Ryr3 | 0.008 ± 0.0002 | 0.001 ± 0.0005 | – | 0.019 ± 0.0012 | 0.001 ± 0.0001 | – |
| Orai1 | 0.028 ± 0.0003 | 0.060 ± 0.0043 | **** | 0.052 ± 0.0006 | 0.069 ± 0.0025 | **** |
| Orai2 | 0.010 ± 0.0001 | 0.003 ± 0.0001 | – | 0.015 ± 0.0002 | 0.005 ± 0.0001 | – |
| Orai3 | 0.013 ± 0.0003 | 0.042 ± 0.0010 | **** | 0.038 ± 0.0001 | 0.047 ± 0.0014 | **** |
| Stim1 | 0.061 ± 0.0009 | 0.104 ± 0.0020 | **** | 0.089 ± 0.0030 | 0.119 ± 0.0029 | **** |
| Stim2 | 0.032 ± 0.0012 | 0.155 ± 0.0055 | **** | 0.058 ± 0.0009 | 0.176 ± 0.0041 | **** |
ANOVA post-test used to derive P values. P values indicated as not significant NS, P < 0.1 *, P < 0.01 **, P < 0.001 *** and P < 0.0001 ****. – indicate no significant gene enrichment in ICC compared to unsorted cell sample. n = 4.
L-type voltage-dependent Ca2+ channels (CaV1.2 and CaV1.3), encoded by Cacna1c and Cacna1d, are expressed in ICC, but transcripts for Cacna1d were more abundant in both antrum and corpus ICC (Fig. 5B; Table 1). T-type voltage-dependent Ca2+ channels, encoded by Cacna1g (CaV 3.1) and Cacna1h (CaV 3.2), transcripts were also expressed in antrum and corpus ICC, but Cacna1i (CaV 3.3) transcripts were not resolved (Fig. 5B; n = 4; Table 1). Ca2+ entry via the Na+/Ca2+ exchanger (NCX) was proposed as a mechanism to sustain ANO1 channel activation in ICC during the plateau phase of slow waves in small intestinal ICC-MY [48]. Expression of NCX isoforms (Slc8a1, Slc8a2 and Slc8a3) also occurs in gastric ICC. Slc8a1 and Slc8a2 showed highest expression in antrum and corpus ICC, as compared to Slc8a3 (Fig. 5C; n = 4; Table 1).
3.5. L-type and T-type Ca2+ channels contributions to Ca2+ transients in ICC-MY
Voltage-dependent Ca2+ channel (VDCC) transcripts for L-type Ca2+ channels (CaV1.3, CaV1.2) and T-type Ca2+ channels (CaV3.1, CaV3.2) were expressed in gastric ICC (Fig. 5B). As described above (Fig. 2) and previously, electrical slow waves persist in the stomach in the presence of dihydropyridines, such as nicardipine and nifedipine [43, 49, 50]. Therefore, we tested the effects of isradipine (an atagonist for both CaV1.3 and CaV1.2) to evaluate the contribution of these channels to Ca2+ transients and CTCs. Isradipine (1μM) reduced Ca2+ transients in ICC-MY (Fig. 6; n = 6), as shown by the reduction in firing sites evident in occurrence maps and Ca2+ PTCL plots (Fig. 6C–F). Ca2+ PTCL area was reduced to 76.2 ± 3.3% (Fig. 6G; n = 6), and PTCL count was reduced to 75.9 ± 3.5% (Fig. 6H; n = 6). The number of firing sites was reduced to 78.9 ± 2.9% by isradipine (Fig. 6I; n = 6). Isradipine also significantly reduced the durations of CTCs to 70.7 ± 5.7% (Fig. 6J; n = 6) and increased the frequency of CTCs to 107.2 ± 2.9% (n = 6). These data show that l-type Ca2+ channels, most likely CaV1.3 because CaV1.2 channels were pre-blocked with nicardipine, contribute to Ca2+ entry into ICC-MY and have a role in sustaining the durations of CTCs.
Fig. 6. L-type Ca2+ channel antagonist, isradipine effects on ICC-MY Ca2+ transients.
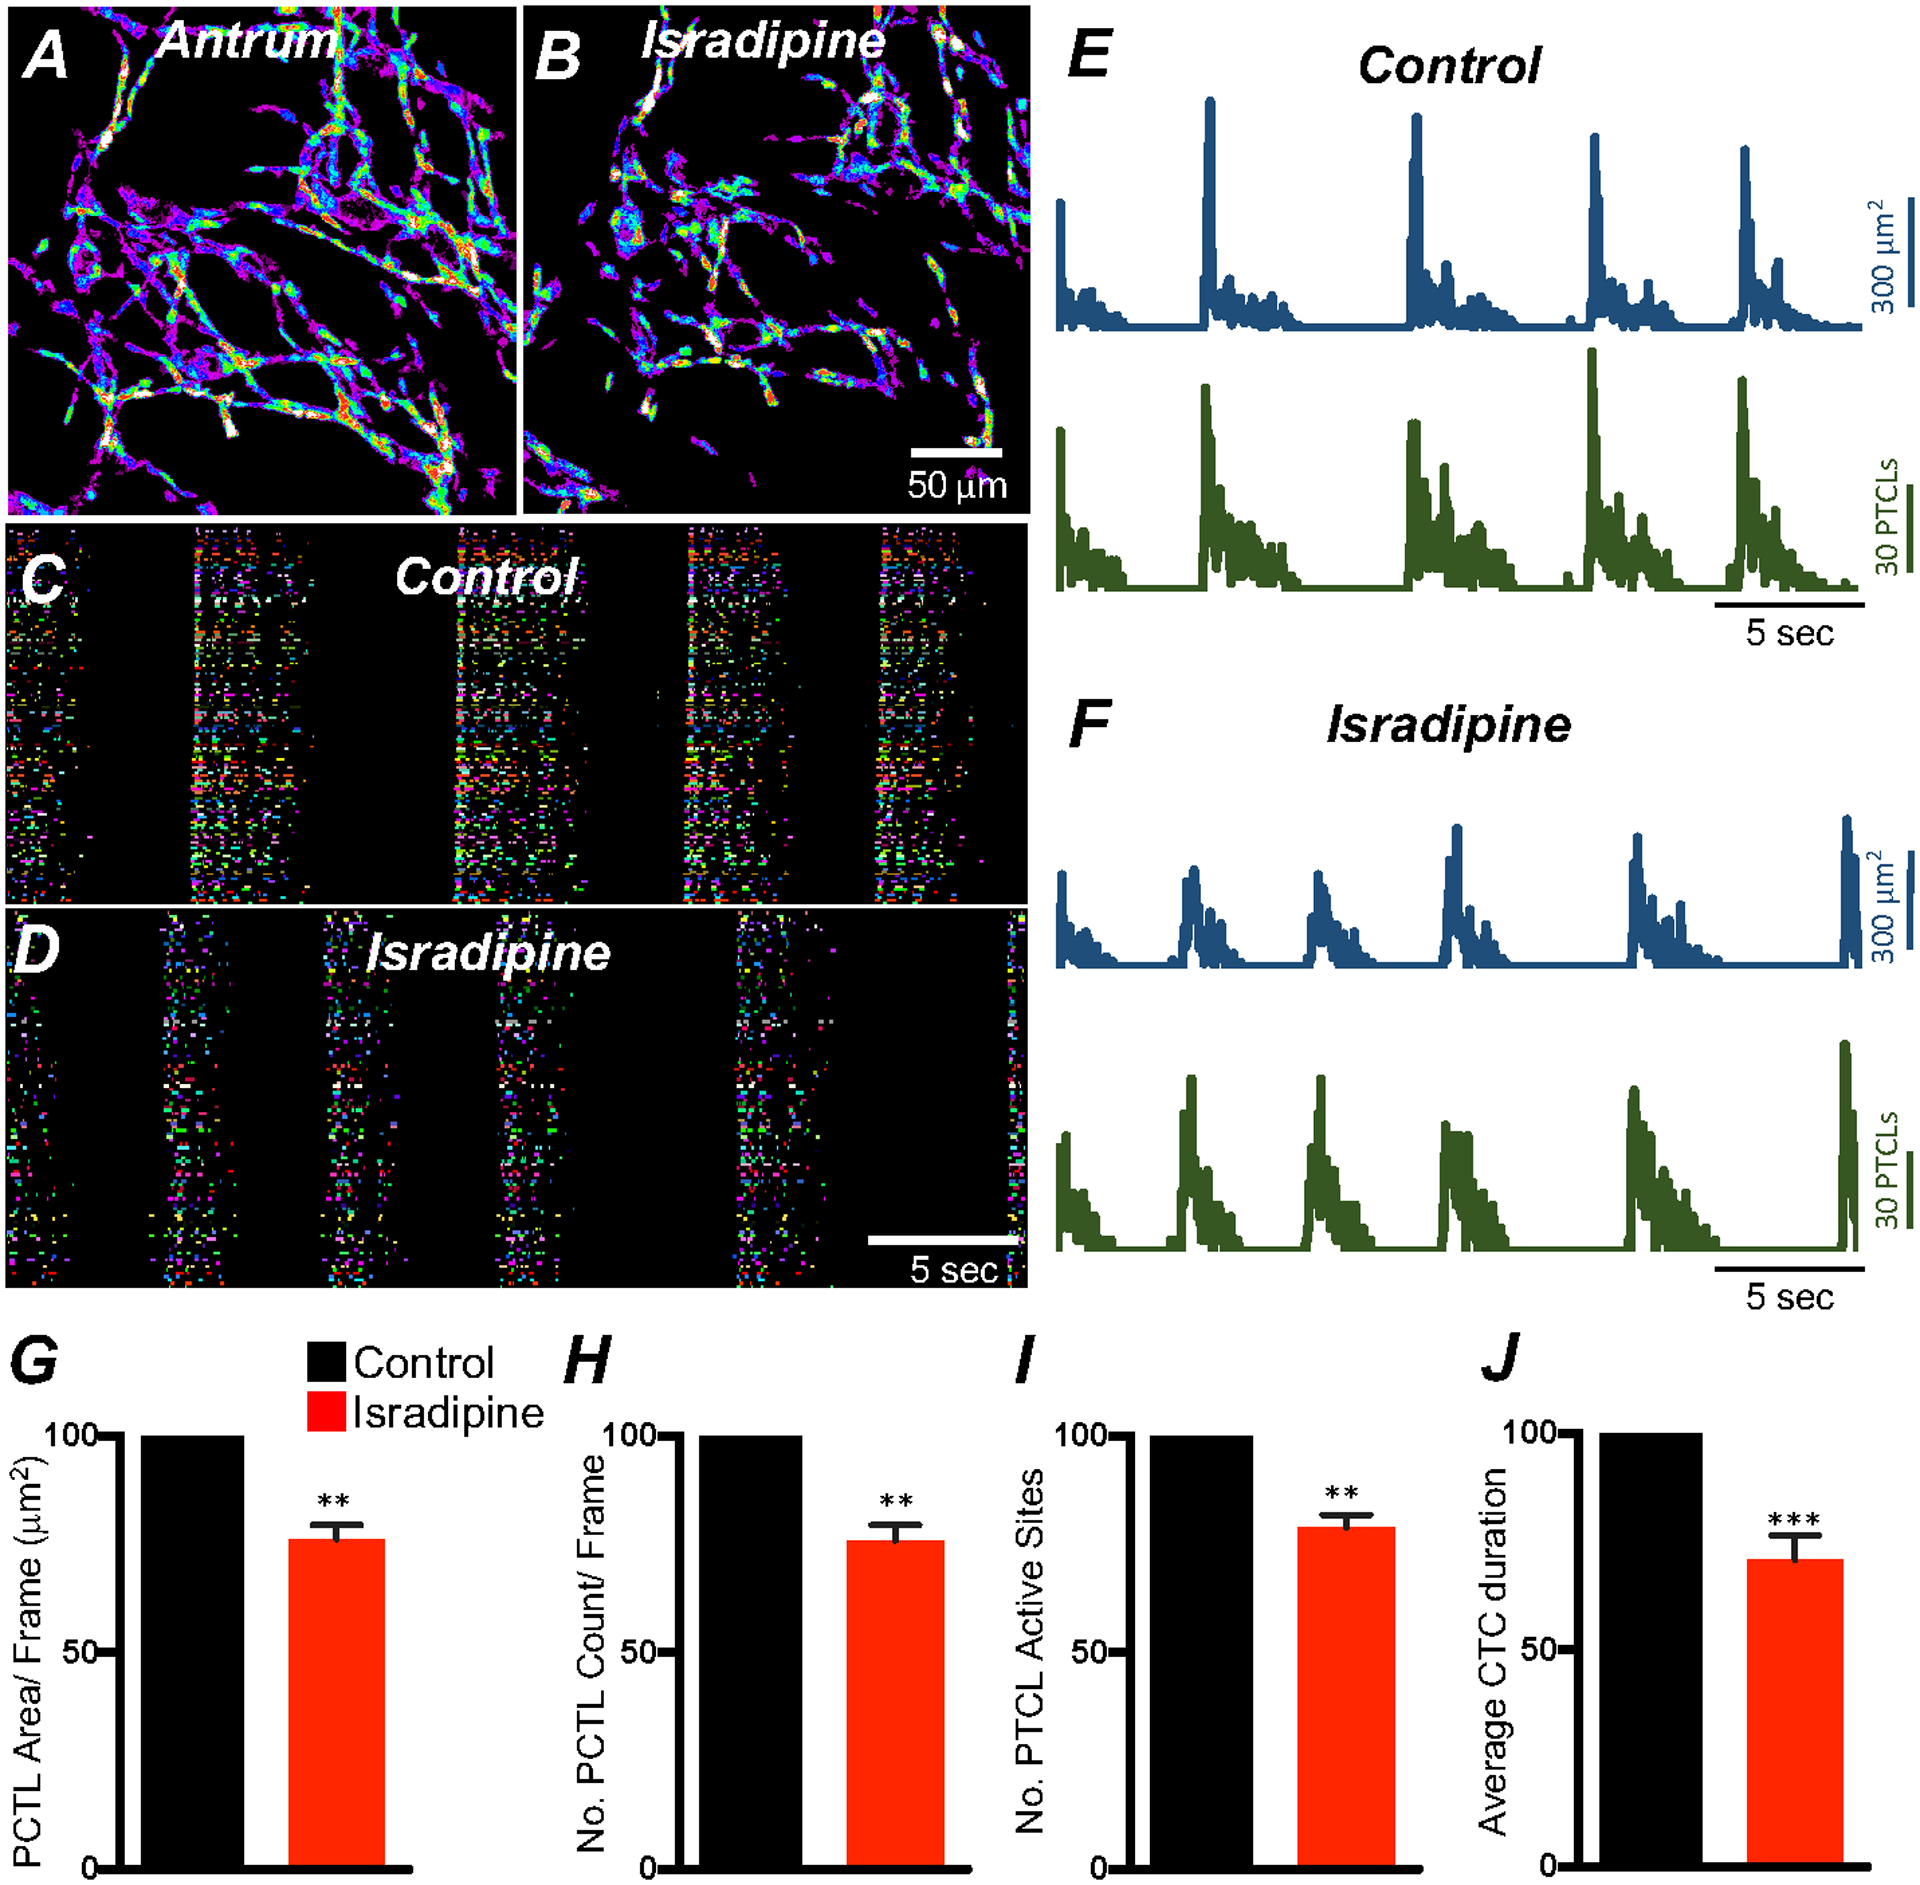
A&B Representative heat-map images of an antrum ICC-MY network showing active Ca2+ PTCLs under control conditions and in the presence of isradipine (1mM). Ca2+ activity is color-coded with warm areas (white, red) representing bright areas of Ca2+ fluorescence and cold colors (purple, black) representing dim areas of Ca2+ fluorescence. Scale bar is 50 mm in both A & B. C & D Ca2+ activity in ICC-MY showing color-coded Firing sites plotted as an occurrence map under control conditions C and in the presence of isradipine (1mM) D. Traces of firing sites showing PTCL area (E; blue) and PTCL count (E; green) under control conditions and in the presence of isradipine; PTCL area (F; blue) and PTCL count (F; green). Summary graphs of Ca2+ PTCL activity in ICC-MY before and in the presence of isradipine are shown in G (PTCL area/frame), H (PTCL count/frame), I the number of PTCL active sites. J Summary graph of Ca2+ transient clusters (CTCs) duration. Data were normalized to controls and expressed as percentages (%). Significance determined using unpaired t-test, ** = P < 0.01, *** = P < 0.001, n = 6. All data graphed as mean ± SEM.
Expression of T-type Ca2+ channels (Cacna1h) was also observed in gastric ICC (Fig. 5B), and previous studies suggested a role for this conductance in the upstroke depolarization and active propagation of slow waves [49, 50]. We evaluated the role of T-type Ca2+channels in modulating Ca2+signaling in ICC-MY using a specific T-type channel antagonist, NNC 55–0396 (10 μM). NNC 55–0396 reduced Ca2+ transient firing (Fig. 7; n = 6), Ca2+ transients firing sites (Fig. 7C&D), Ca2+ PTCL areas and PTCL counts (Fig. 7E&F). PTCL area was reduced to 28.3 ± 6.1% (Fig. 7G; n = 6) and PTCL count was reduced to 35.9 ± 5.8% (Fig. 7H; n = 6). The number of firing sites was reduced to 33.4 ± 9% (Fig. 7I; n = 6) by NNC 55–0396. NNC 55–0396 reduced CTC duration to 53.2 ± 4.5% (Fig. 7J; n = 6) and CTC frequency were also reduced to 68.2 ± 13.1% (n = 6). The data suggest that T-type Ca2+ channels are fundamental to the initiation and organization of Ca2+ transients into CTCs in ICC-MY.
Fig. 7. Effects of T-type Ca2+ channel antagonist, NNC 55–0396 on antrum ICC-MY Ca2+ transients.
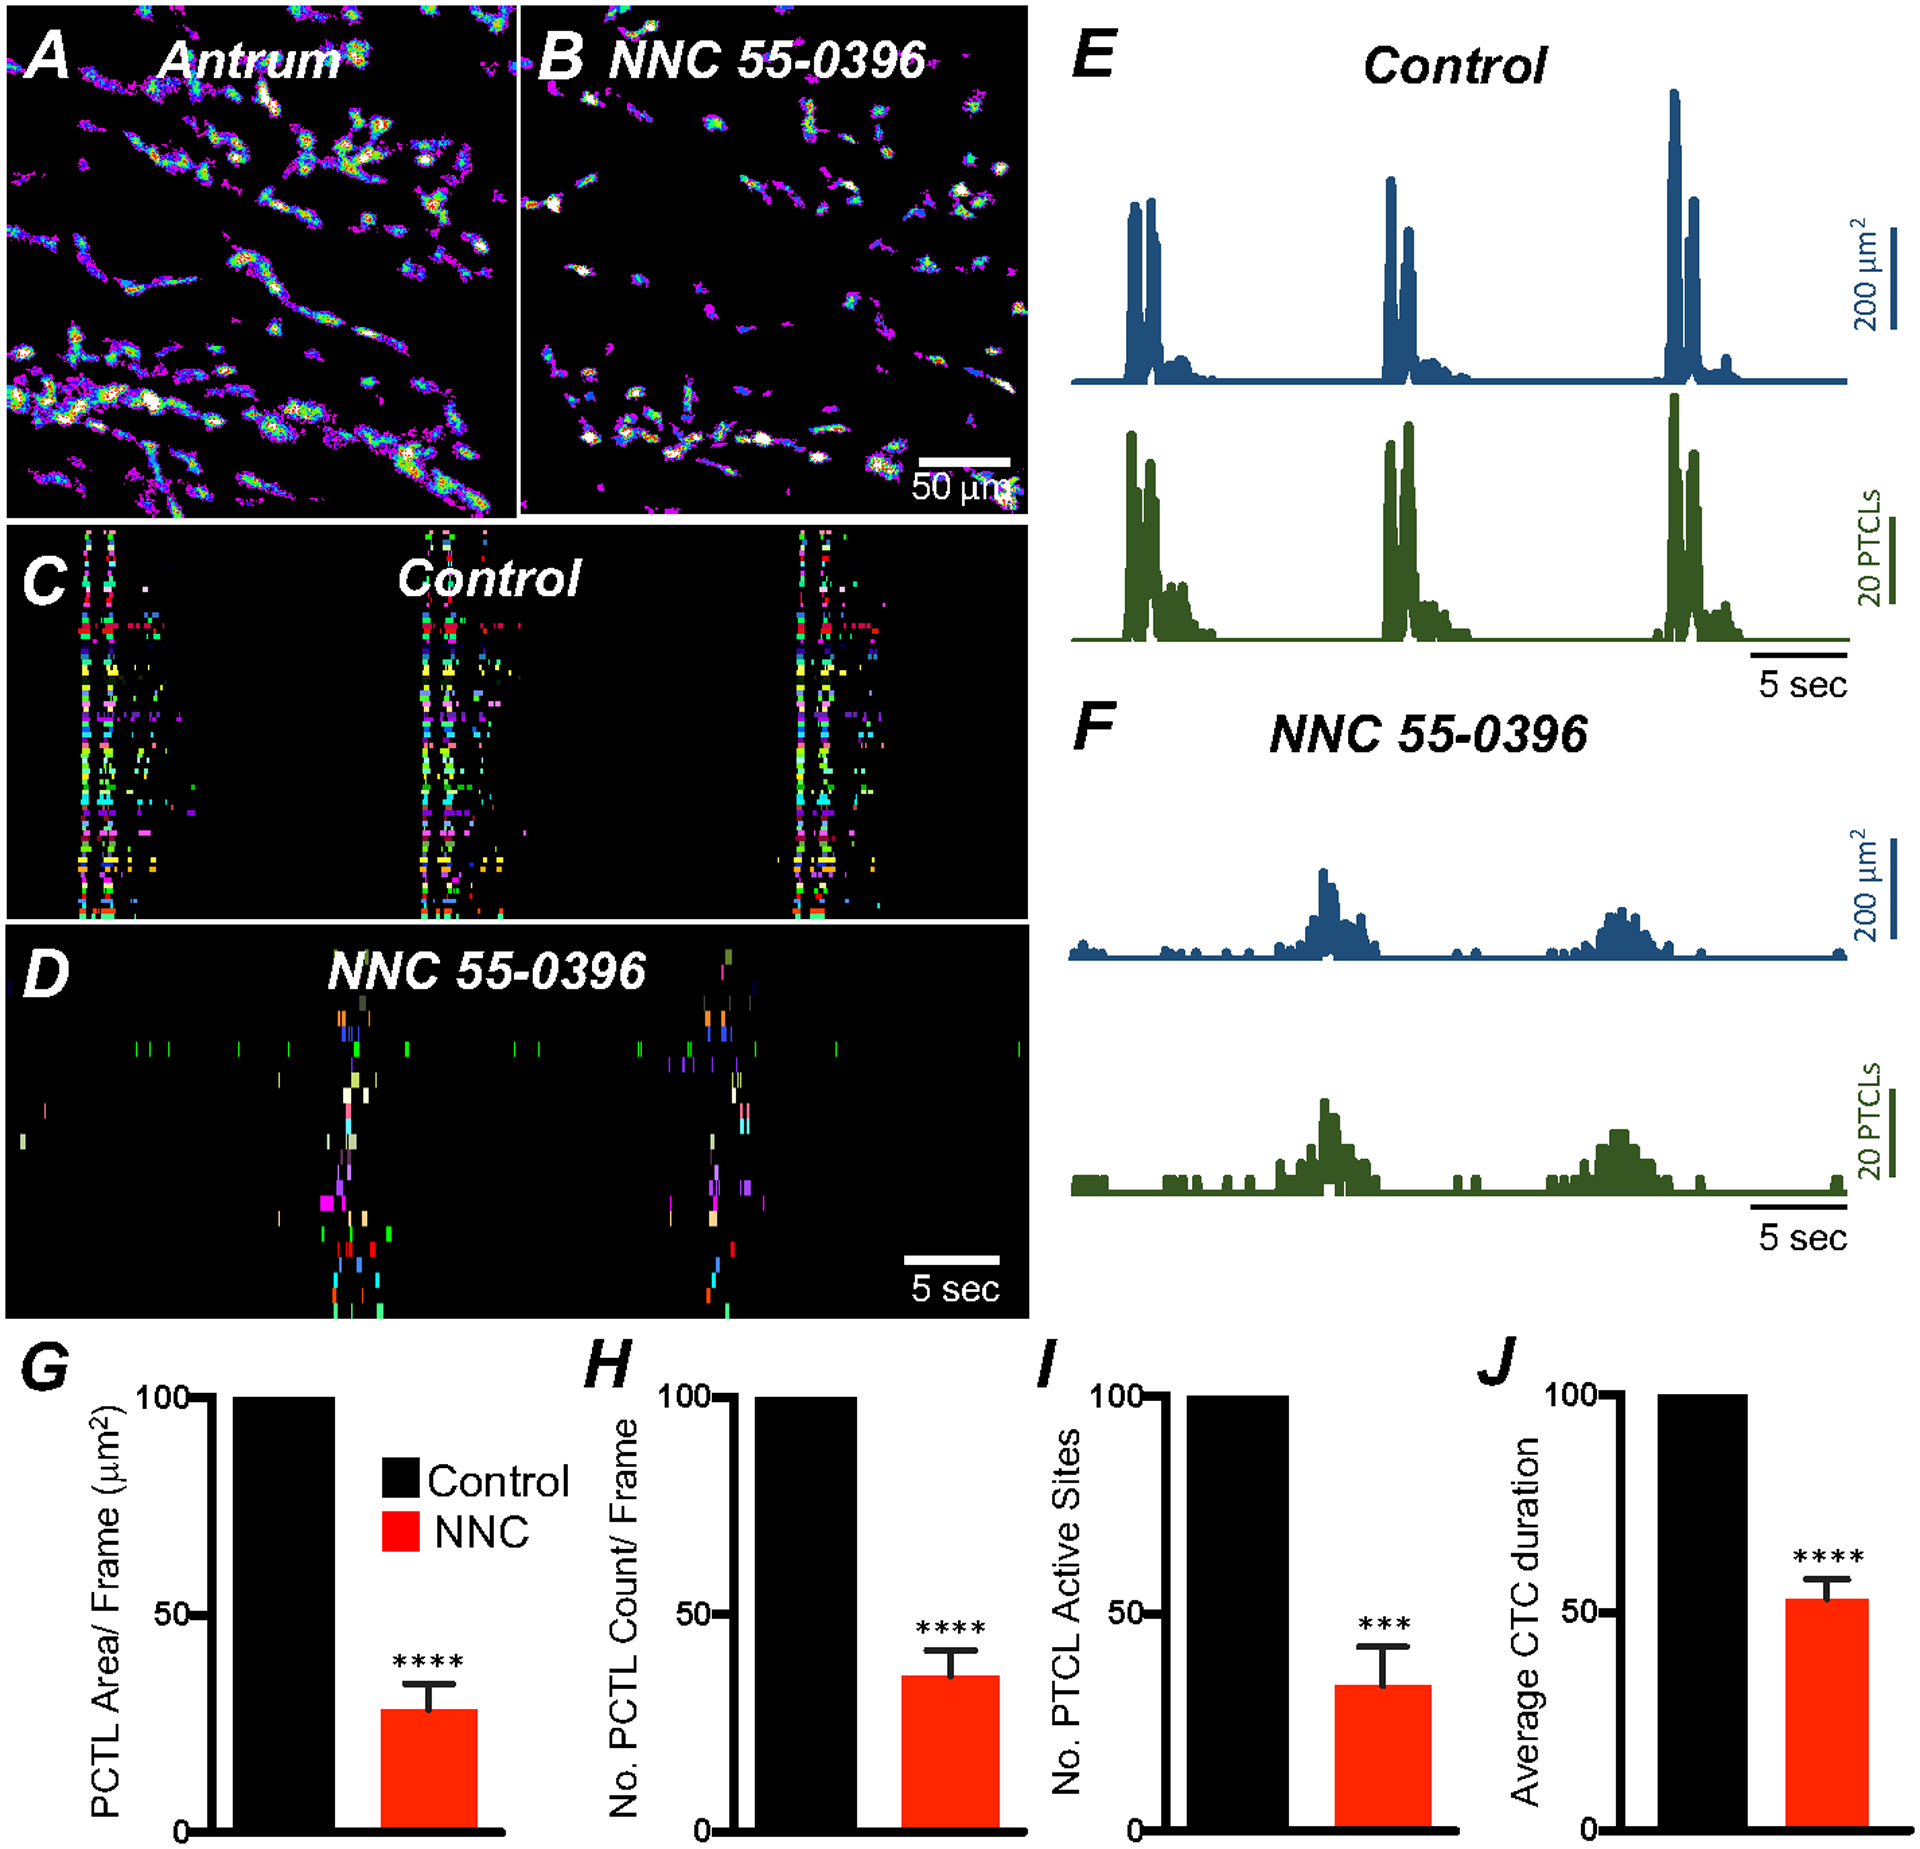
A&B Ca2+ transient particles heat-map images in ICC-MY under control conditions A and in the presence of NNC 55–0396 (10 μM) B. Active firing sites were color-coded and plotted as an occurrence maps in the ICC-MY network under control C and in the presence of NNC 55–0396 D. Trace plots of Ca2+ transient PTCLs activity of ICC-MY in control conditions showing PTCL area (blue) and PTCL count (green) E and in the presence of NNC 55–0396 F. Summary graphs of average percentage changes in PTCL area G, PTCL count H, the number of PTCL active sites I. J Average percentage changes of Ca2+ transient clusters (CTCs) duration. Data were normalized to controls and expressed as percentages (%). Significance determined using unpaired t-test, *** = P < 0.001, **** = P < 0.0001, n = 6. All data graphed as mean ± SEM.
Corpus ICC-MY Ca2+ transients were also reduced by NNC 55–0396 (Fig. 8; n = 5), Ca2+ transient firing sites were significantly reduced. Ca2+ PTCL area was reduced to 36.4 ± 4.9% (Fig. 8G; n = 5), and PTCL count was reduced to 40.2 ± 5.1% (Fig. 8H; n = 5). The number of firing sites was reduced by NNC 55–0396 to 32.9 ± 2.5% (Fig. 8I; n = 5). NNC 55–0396 also reduced CTC duration to 50.1 ± 3.1% (Fig. 8J; n = 5) and CTC frequency to 60.7 ± 6.3% (n = 5). An interesting observation was that the T-type Ca2+ antagonist disrupted the organization of CTCs in antrum and corpus ICC-MY. While NNC 55–0396 did not entirely abolish CTCs, there was a less well-defined wave front of initiation in the presence of the drug (Figs. 7D and 8 D), and there was an increase in stochastic firing of Ca2+ transients during inter-CTC intervals in antrum ICC-MY (Fig. 7C&D).
Fig. 8. Effects of T-type Ca2+ channel antagonist, NNC 55–0396 on corpus ICC-MY Ca2+ transients.
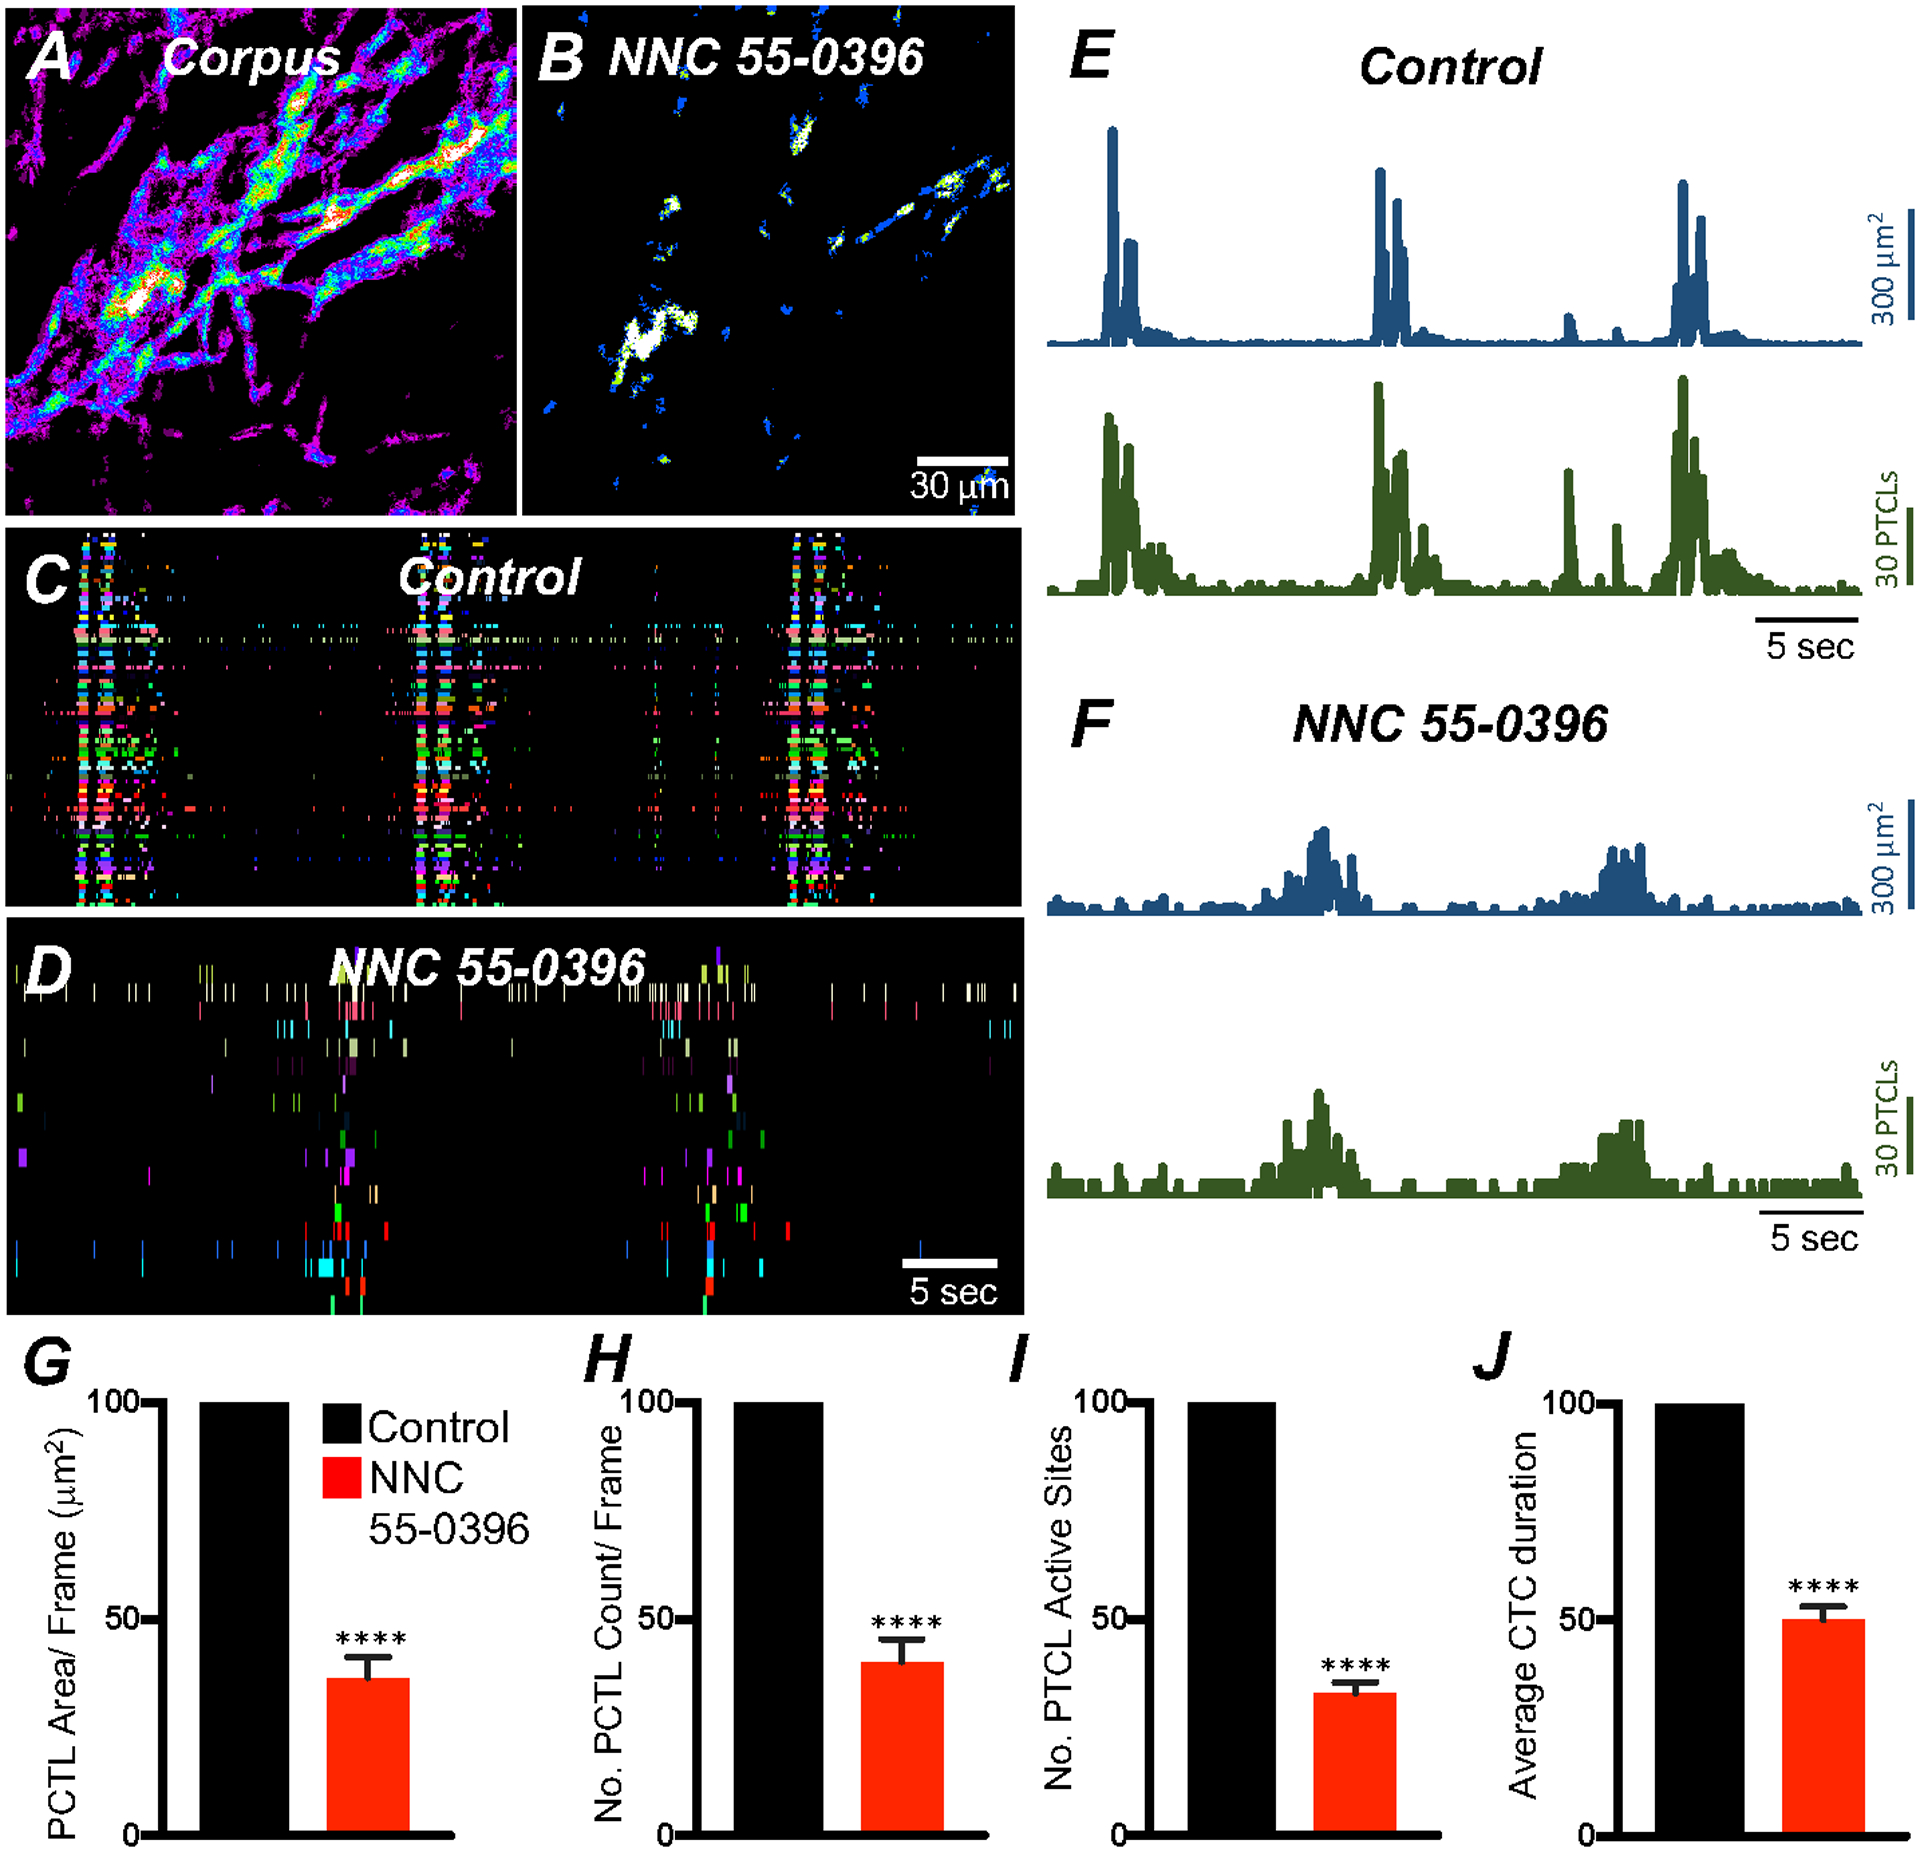
A&B Ca2+ transient particles heat-map images in ICC-MY under control conditions A and in the presence of NNC 55–0396 (10 μM) B. Ca2+ activity is color-coded with warm areas (white, red) representing bright areas of Ca2+ fluorescence and cold colors (purple, black) representing dim areas of Ca2+ fluorescence. Scale bar is 30 mm in both A & B. Active firing sites were color-coded and plotted as an occurrence maps in the ICC-MY network under control C and in the presence of NNC 55–0396 D. Trace plots of Ca2+ transient PTCL activity of ICC-MY in control conditions showing PTCL area (blue) and PTCL count (green) E and in the presence of NNC 55–0396 F. Summary graphs of average percentage changes in Ca2+ PTCL area G, PTCL count H, the number of PTCL active sites I. J Average percentage changes of Ca2+ transient clusters (CTCs) duration. Data were normalized to controls and expressed as percentages (%). Significance determined using unpaired t-test, **** = P < 0.0001, n = 5. All data graphed as mean ± SEM.
3.6. Effects membrane hyperpolarization on ICC-MY Ca2+ transients
T-type and L-type Ca2+ channels are both voltage-dependent. Thus, transmembrane potentials may have a significant effect on generation and propagation of CTCs. We tested the effects of hyperpolarization on CTCs using pinacidil (10 μM, a selective KATP channel agonist) that hyperpolarizes murine gastric muscles [51]. Pinacidil (10 μM) reduced the number of Ca2+ transient PTCLs to 82.6 ± 4.7% (Fig. 9H; n = 5), reduced the duration of CTCs to 74.4 ± 2.4% (Fig. 9J; n = 5) and increased CTC firing frequency to 116.1 ± 5.7% of control (n = 5). Other Ca2+ transient firing parameters were unchanged.
Fig. 9. membrane hyperpolarization effects on ICC-MY Ca2+ transients.
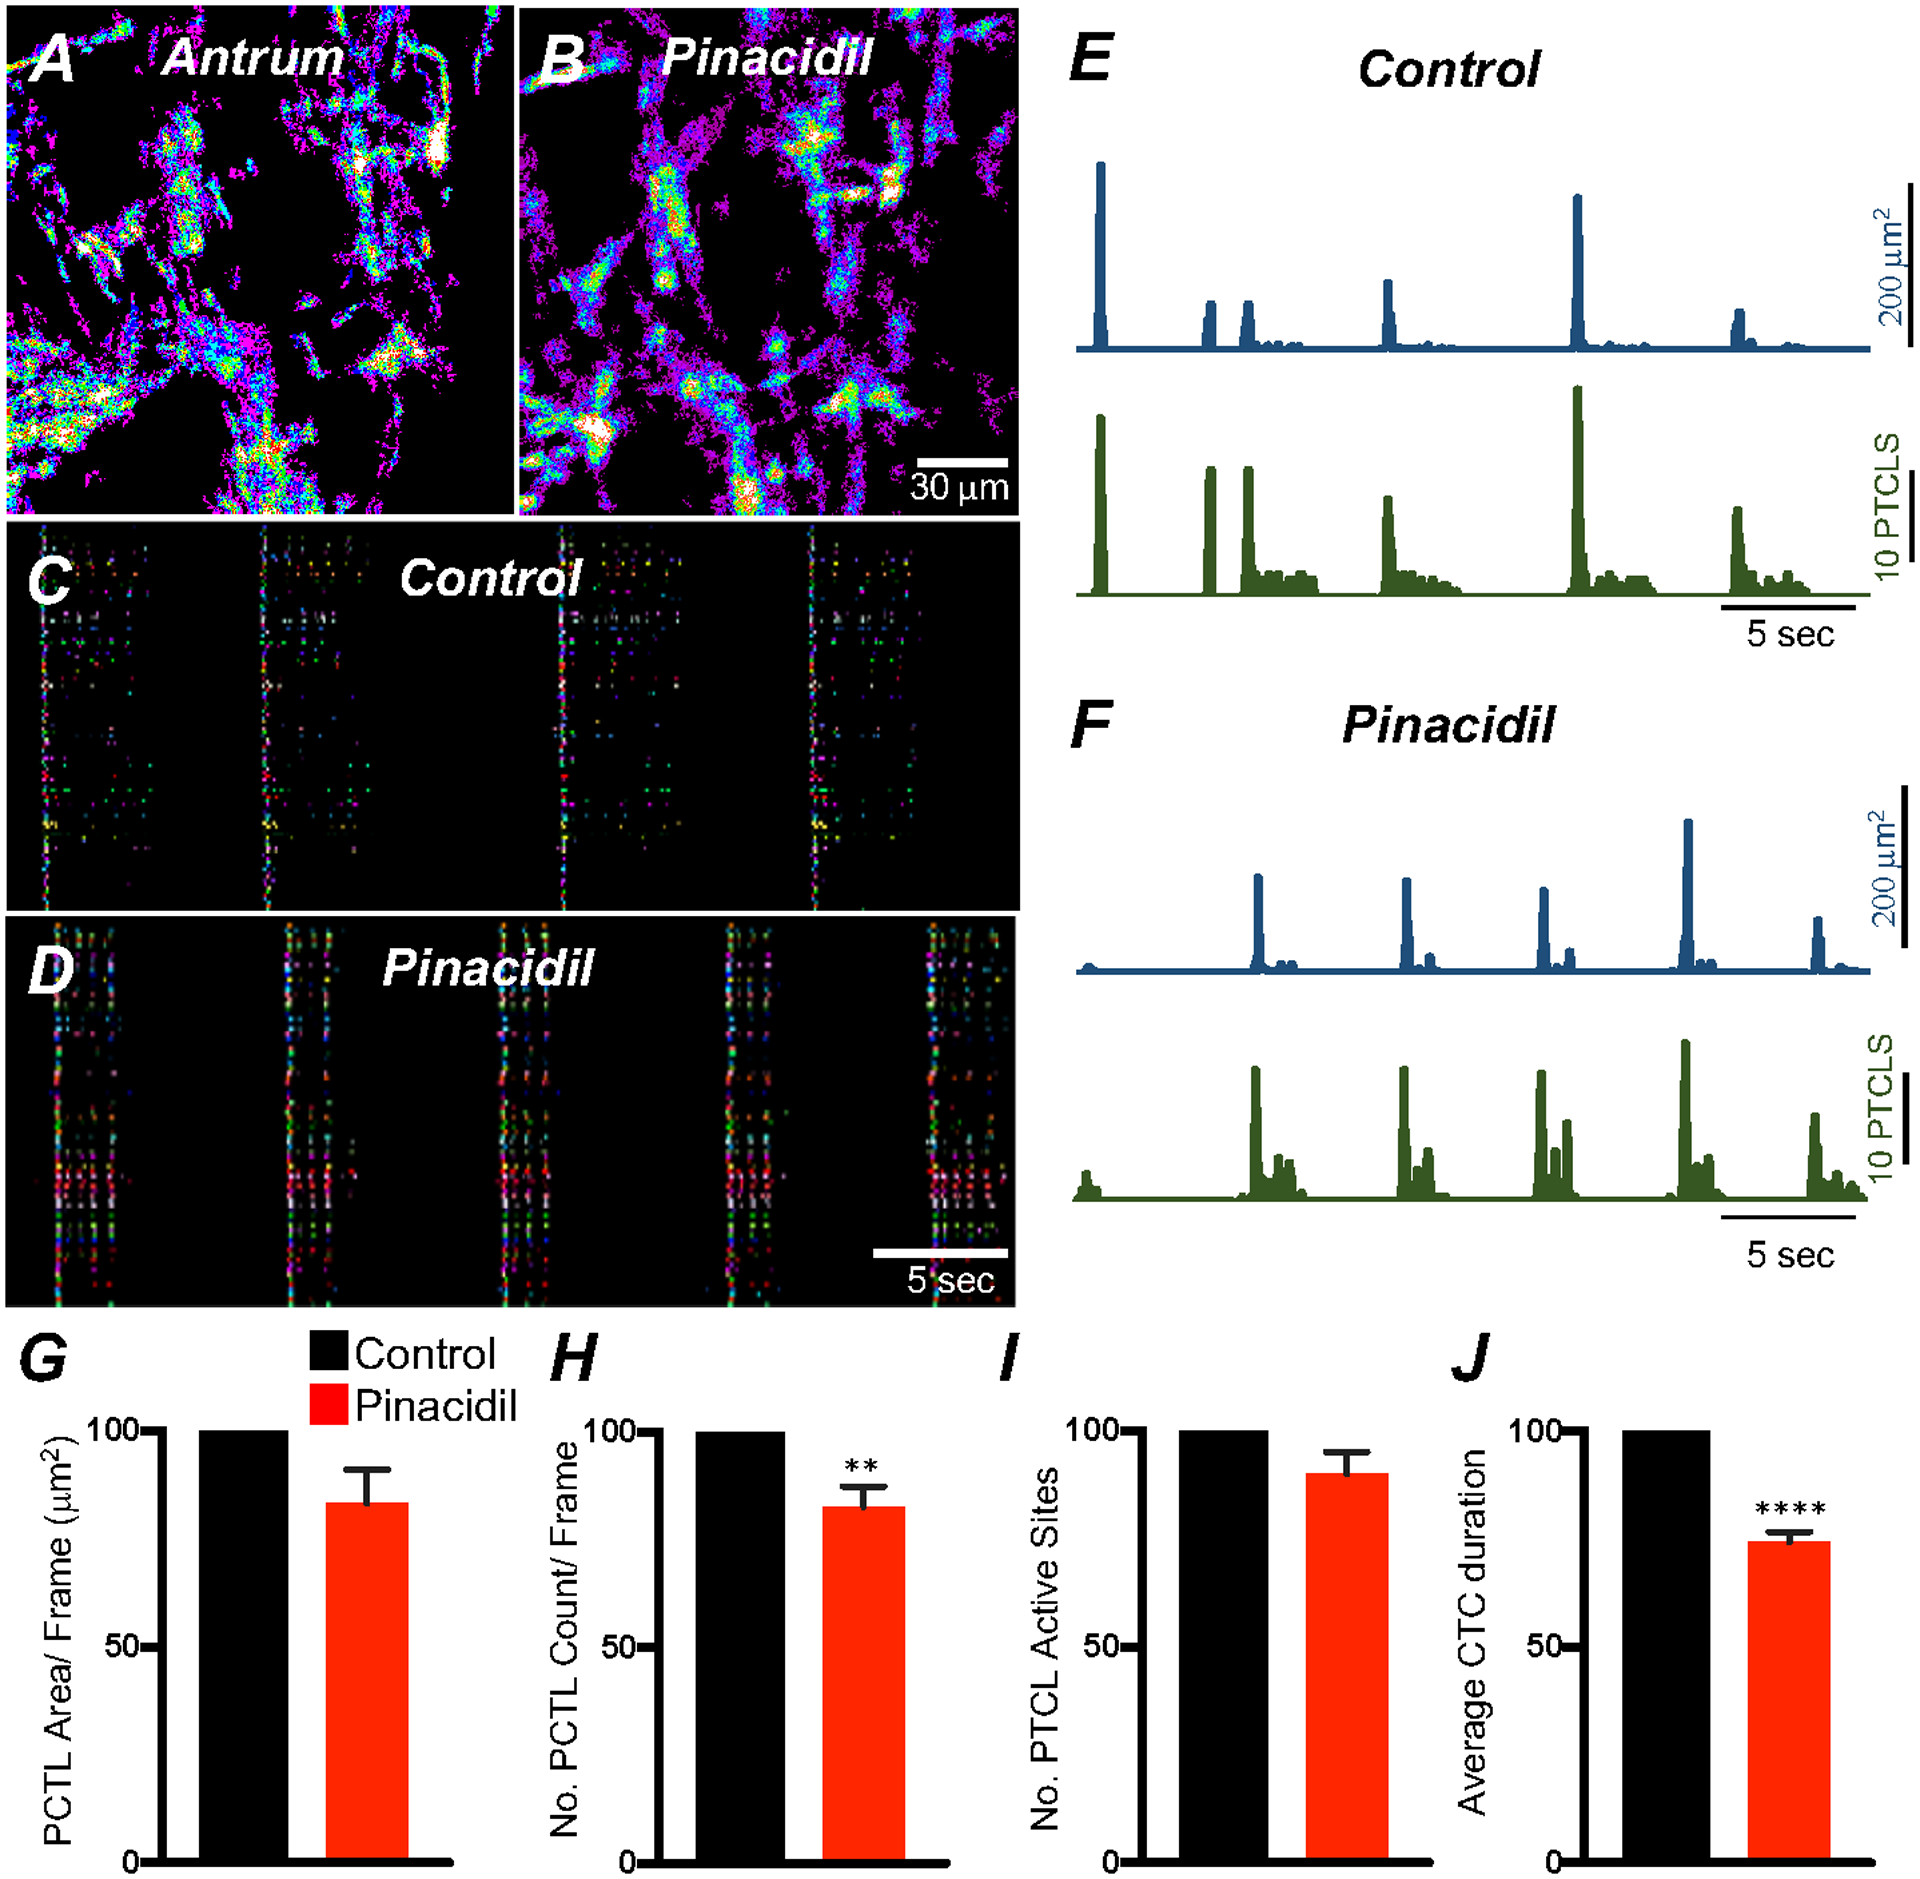
A Ca2+ Firing sites in ICC-MY are color-coded and plotted in a heat map under control conditions and in the presence of pinacidil (10 μM) B. Occurrence maps showing active firing sites under control conditions C and in the presence of pinacidil D. Trace activity of firing sites PTCL area (blue) and PTCL count (green) under each condition are shown in E&F. Summary graphs of Ca2+ PTCL activity in ICC-MY in the presence of v pinacidil are shown in G (PTCL area) and H (PTCL count). I The number of active Ca2+ PTCL and total Ca2+ transient cluster (CTC) duration in J. Data were normalized to controls and expressed as percentages (%). Significance determined using unpaired t-test, ** = P < 0.01, **** = P < 0.0001, n = 5. All data graphed as mean ± SEM.
3.7. Role of intracellular Ca2+ stores in Ca2+ transients and CTCs
Ca2+ store filling mechanisms provided by sarco/endoplasmic reticulum Ca2+ATPases (SERCA) pump are important regulators of Ca2+homeostasis and signaling in ICC GI organs [38, 52–55]. Therefore, we examined the molecular expression of the SERCA pump isoforms in gastric ICC. Atp2a2 and Atp2a3 were both are enriched in ICC, but transcripts of Atp2a1 were not resolved in ICC from the antrum and corpus (Fig. 10A; Table 1). ER Ca2+ channels (RyR and InsP3R) are expressed in extracts of GI muscles [56–59]. We evaluated the expression of RyR and InsP3R isoforms in gastric ICC. Abundant transcripts of Iptr1 were found in antrum and corpus ICC, as compared to Iptr2 and Iptr3 isoforms (Fig. 10B; Table 1). Ryr2 transcripts were more highly expressed than Ryr1 and Ryr3 (Fig. 10B; Table 1).
Fig. 10. Molecular expression of SERCA, RyR and InsP3R transcripts.
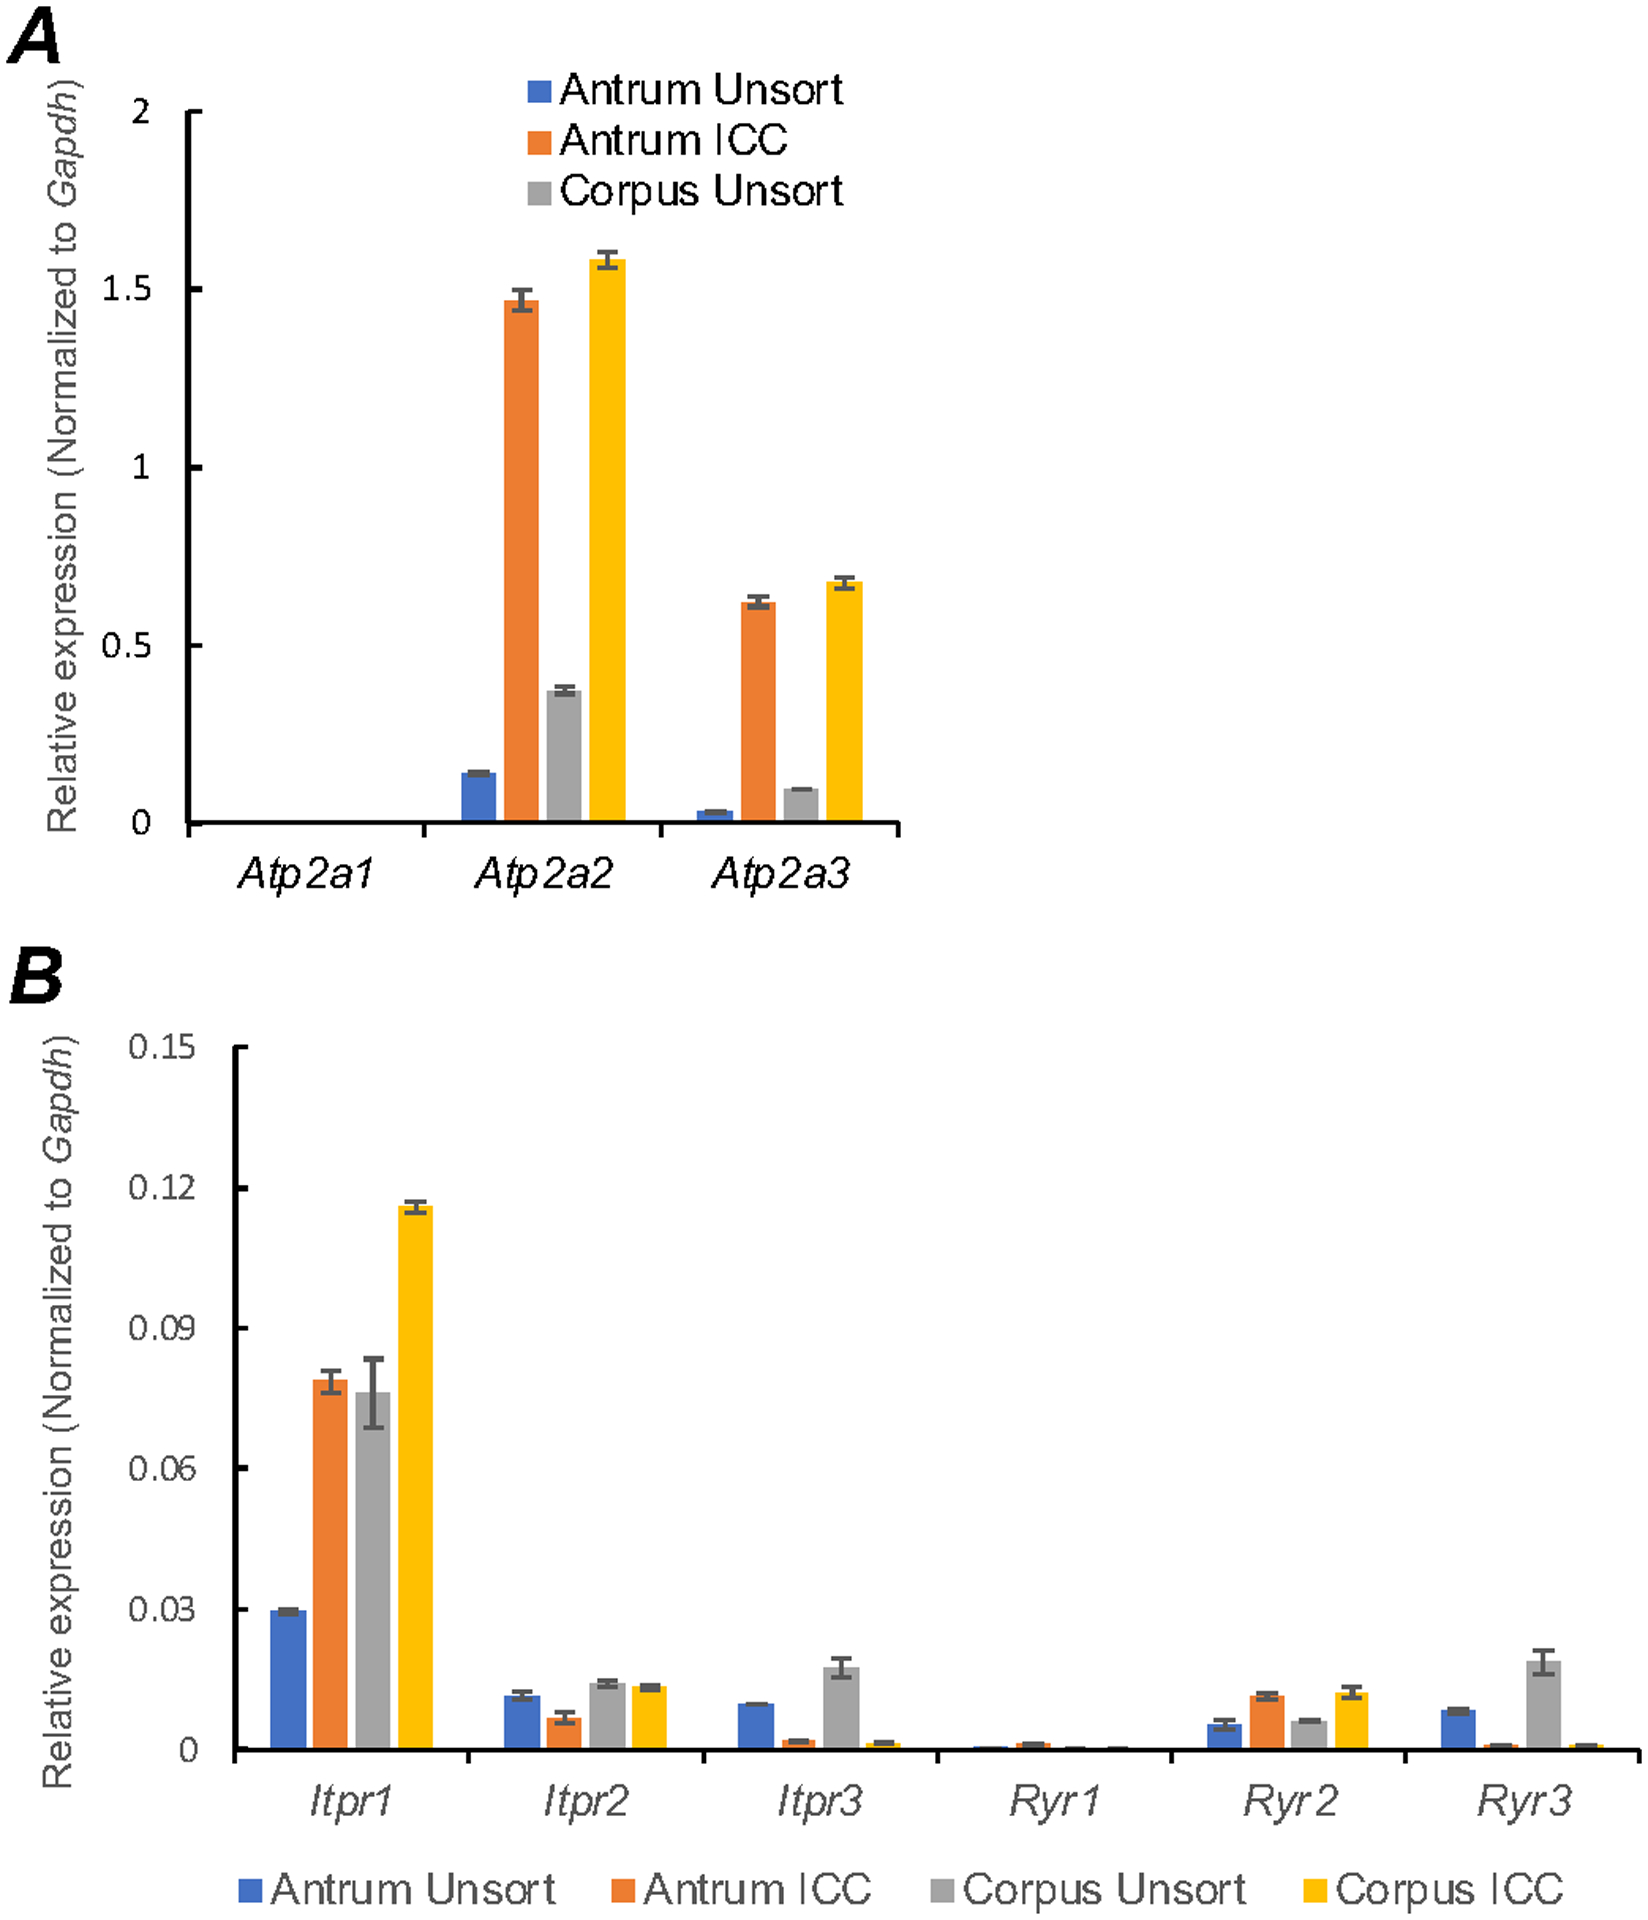
A Relative expression of the SERCA pump isoforms (Atp2a1, Atp2a2 and Atp2a3) in gastric ICC and compared with unsorted cells dispersed from gastric antrum and corpus tissues obtained from Kit+/copGFP mice. B Relative expression of ER Ca2+ channels (RyR and InsP3R) in antrum and corpus ICC. InsP3Rs encoded by (Iptr1, Iptr2 and Iptr3) and RyRs isoforms (Ryr1, Ryr2 and Ryr3). Expression was determined by qPCR and the relative expression of each gene was normalized to the house-keeping gene, Gapdh. All data graphed as mean ± SEM (n = 4).
Ca2+ release from intracellular stores is involved in generation of pacemaker currents and initiation of slow waves, as determined by electorphysiological methods [50, 55, 60]. We tested the effects of the SERCA pump antagonist, cyclopiazonic (CPA) on antrum slow waves to confirm the role of Ca2+ stores in murine gastric slow waves. Under the control conditions used in imaging studies (i.e. in the presence of nifedipine; 1 μM) gastric muscles displayed an average RMP of −69 ± 1.5 mV and generated spontaneous slow waves 38 ± 2.7 mV in amplitude, ½ maximal duration of 6.2 ± 0.4 s and frequency of 3.3 ± 0.2 cycles min−1 (Fig. 11A; n = 10). CPA (10 μM; 20 min) depolarized RMP to −59 ± 3 mV, decreased slow wave amplitude to 14 ± 5.6 mV, reduced ½ maximal duration of slow waves to 1.0 ± 0.3 s and reduced frequency to 1.6 ± 0.4 cycles min−1 (Fig. 11D–F; n = 5).
Fig. 11. Effect of cyclopiazonic acid on gastric antrum slow waves.
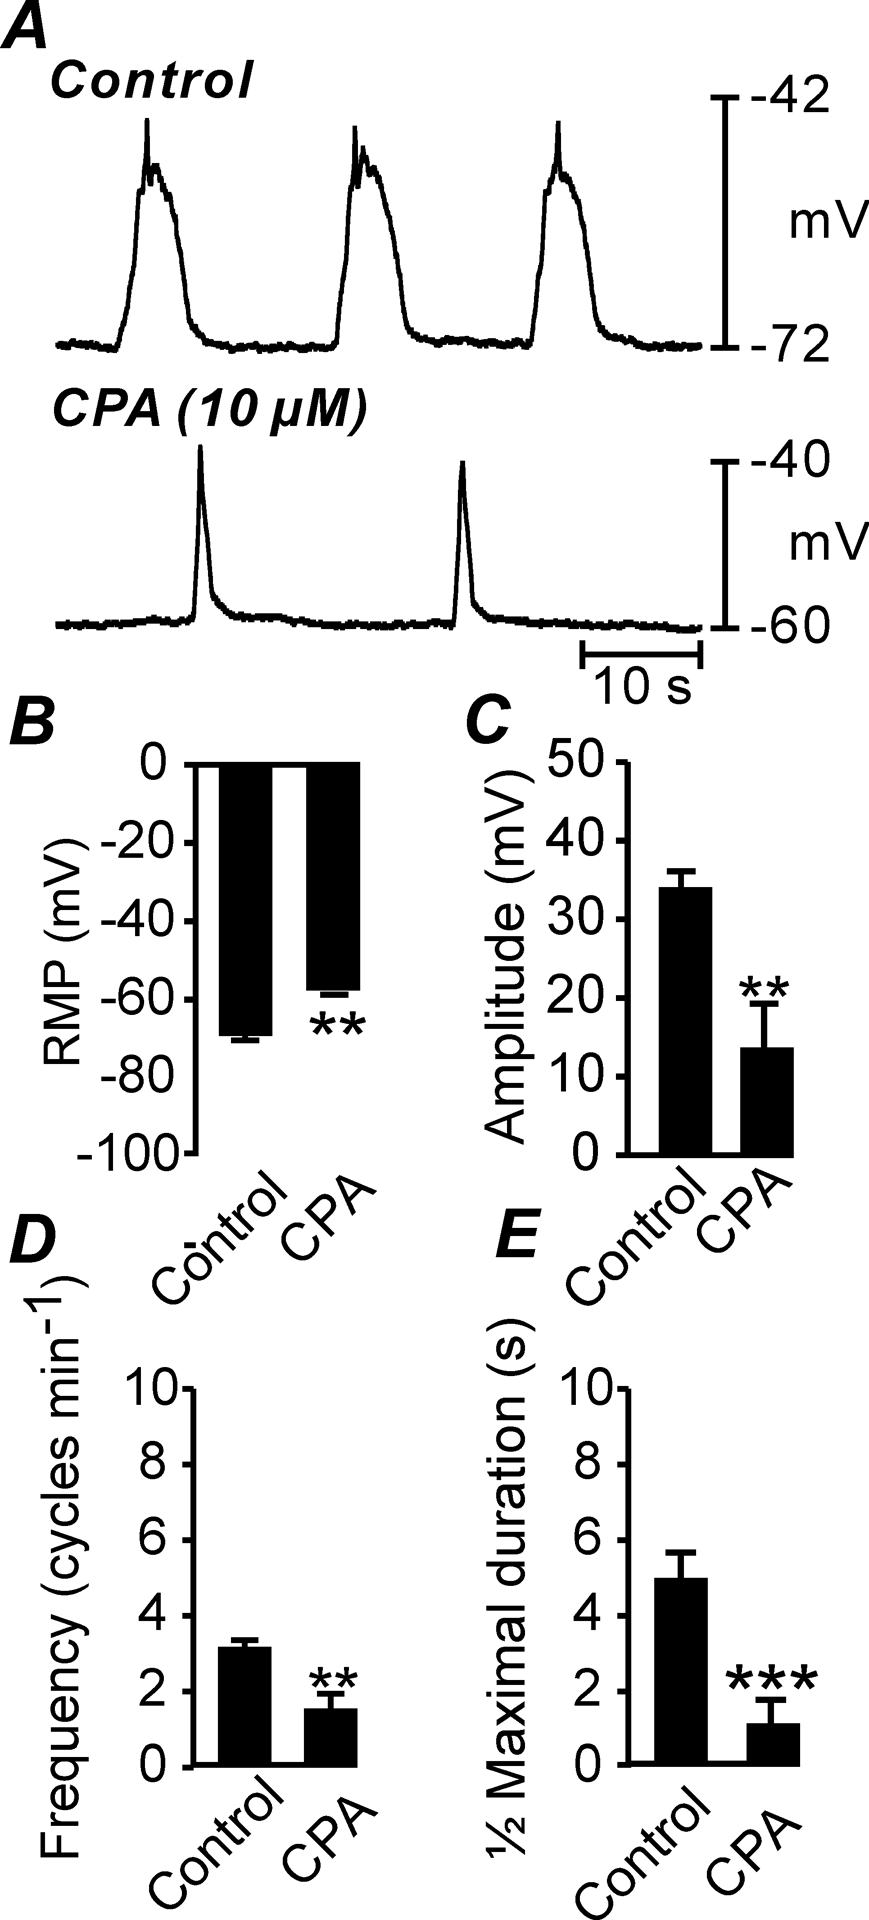
A Slow waves recorded under control conditions (in the presence of nifedipine (1μM) and after the addition of cyclopiazonic acid (CPA; 10 μM). B–E Summarized data of the effects of CPA (10 μM) on RMP (B), slow wave amplitude (C), slow wave frequency (D) and ½ maximal duration (E). ** P = <0.01; *** P = <0.001.
We examined whether Ca2+ release from intracellular stores affects Ca2+ signaling in ICC-MY. Thapsigargin (1 μM; A SERCA pump antagonist; 20 min) reduced but did not block, Ca2+ transient firing in antrum ICC-MY (Fig. 12A–H). Ca2+ PTCL area was reduced to 37.1 ± 9% (Fig. 12E; n = 6) and PTCL count was reduced to 33.8 ± 5.9% (Fig. 12F; n = 6). The number of firing sites was reduced by thapsigargin to 53.8 ± 4.9% (Fig. 12G; n = 6). Thapsigargin (1 μM) significantly reduced the CTCs duration to 21.4 ± 2.5% (Fig. 12H; n = 6) and the frequency of CTCs to 71.1 ± 11.2% (n = 6). After exposure for 40 min, thapsigargin (1 μM) further reduced Ca2+ transients in ICC-MY. PTCL area 4.9 ± 3% (Fig. 12E; n = 6), PTCL count 4.1 ± 2.4% (Fig. 12F; n = 6), number of firing sites 3.8 ± 2.3% (Fig. 12G; n = 6) and the CTCs duration were significantly reduced to 3.1 ± 1.6% (Fig. 12H; n = 6). Cyclopiazonic acid (CPA, 10 μM) also reduced Ca2+ transient firing (Fig. 12I–P). Ca2+ PTCL area was reduced to 16.8 ± 4% (Fig. 12M; n = 5) and PTCL count was reduced to 21.6 ± 2.9% (Fig. 12N; n = 5). The number of firing sites was reduced by CPA to 32.9 ± 2.8% (Fig. 12O; n = 5). CPA significantly reduced CTC duration to 20.1 ± 2.6% (Fig. 12P; n = 5) and frequency to 60 ± 5.8% (n = 5).
Fig. 12. Ca2+ stores contributions to Ca2+ transients in antrum ICC-MY.
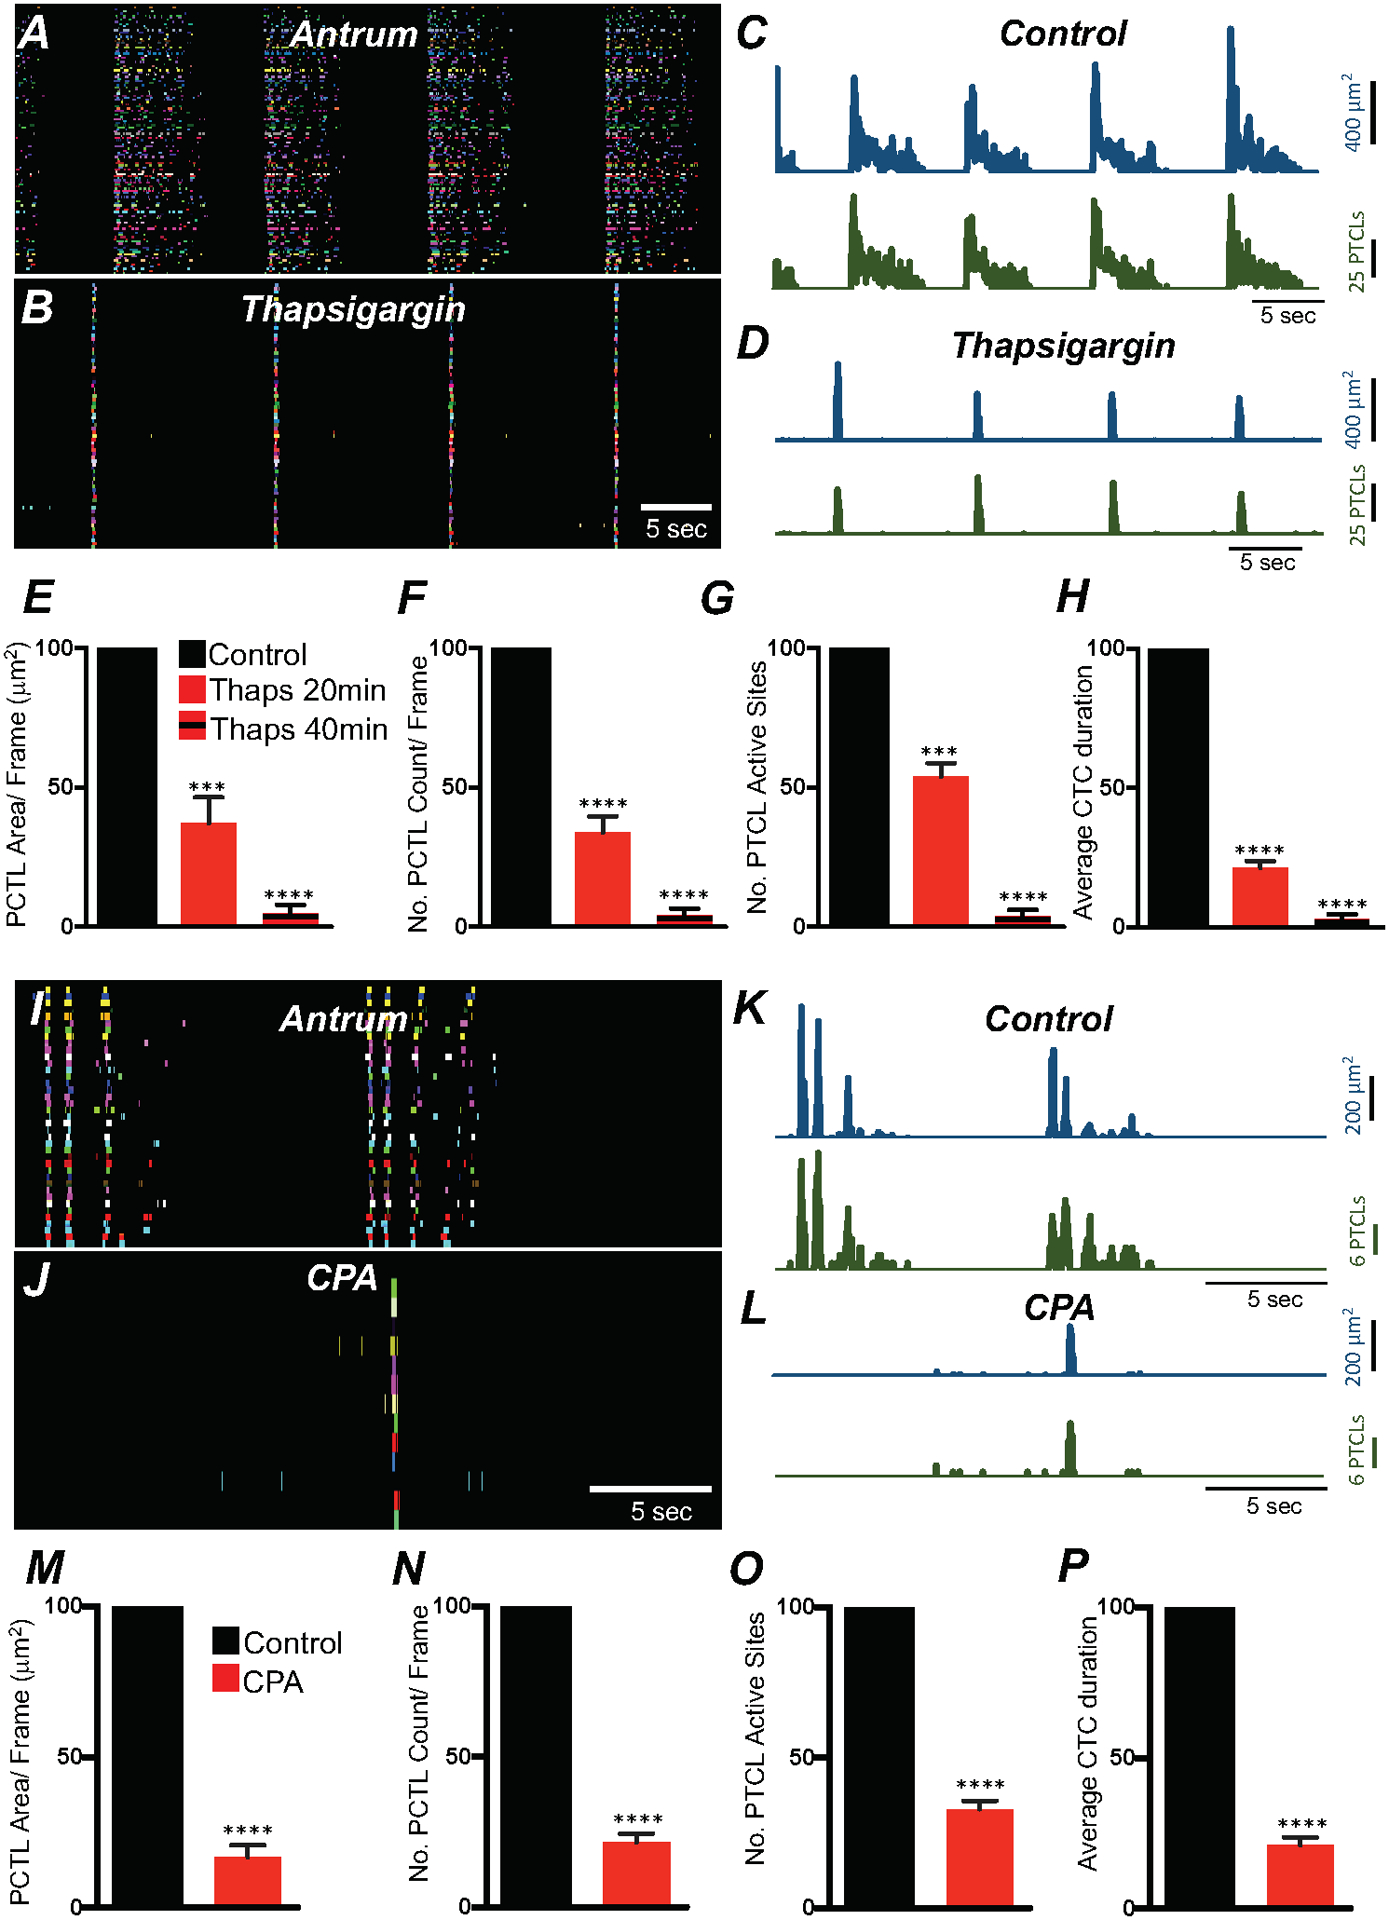
A ICC-MY Ca2+ firing site activity in antrum ICC-MY are color-coded and plotted in occurrence maps under control conditions and in the presence of thapsigargin (1 μM) B. Plot traces of firing sites PTCL area (C; blue) and PTCL count (C; green) under control conditions and in the presence of thapsigargin PTCL area (D; blue) and PTCL count (D; green). Summary graphs of Ca2+ PTCL activity in ICC-MY in the presence of thapsigargin after 20 min and 40 min incubation periods are shown in E (PTCL area), F (PTCL count), G the number of PTCL active sites and H Average percentage changes of Ca2+ transient clusters (CTCs) duration (n = 6). CPA (SERCA pump inhibitor; 10 μM) reduced transients compared to control as shown in occurrence maps of firing sites I&J and Ca2+ activity traces K&L. Summary graphs of Ca2+ PTCL activity in ICC-MY in the presence of CPA are shown in M (PTCL area), N (PTCL count), O the number of PTCL active sites. P Total CTC duration (n = 5). Data were normalized to controls and expressed as percentages (%). Significance determined using unpaired t-test, **** = P < 0.0001. All data graphed as mean ± SEM.
Ca2+ transient firing in corpus ICC-MY was also reduced by thapsigargin (1 μM; 20 min) in a time dependent manner similar to what was observed in antrum ICC-MY (Fig. 13A–D). Ca2+ PTCL area was reduced to 27.8 ± 4.4% (Fig. 13E; n = 5), PTCL count was reduced to 28.6 ± 5% (Fig. 13F; n = 5) and the number of firing sites to 69.5 ± 3.8% (Fig. 13G; n = 5). CTC duration was reduced to 29.7 ± 5.5% by thapsigargin (Fig. 13H; n = 5). Ca2+ transients in corpus ICC-MY were further reduced by thapsigargin after 40 min. PTCL area 1.6 ± 1% (Fig. 13E; n = 5), PTCL count 1.4 ± 1.2% (Fig. 13F; n = 5), number of firing sites 0.8 ± 0.6% (Fig. 13G; n = 5) and the CTCs duration were significantly reduced to 3.8 ± 2.3% (Fig. 13H; n = 5).
Fig. 13. Ca2+ stores contributions to Ca2+ transients in corpus ICC-MY.
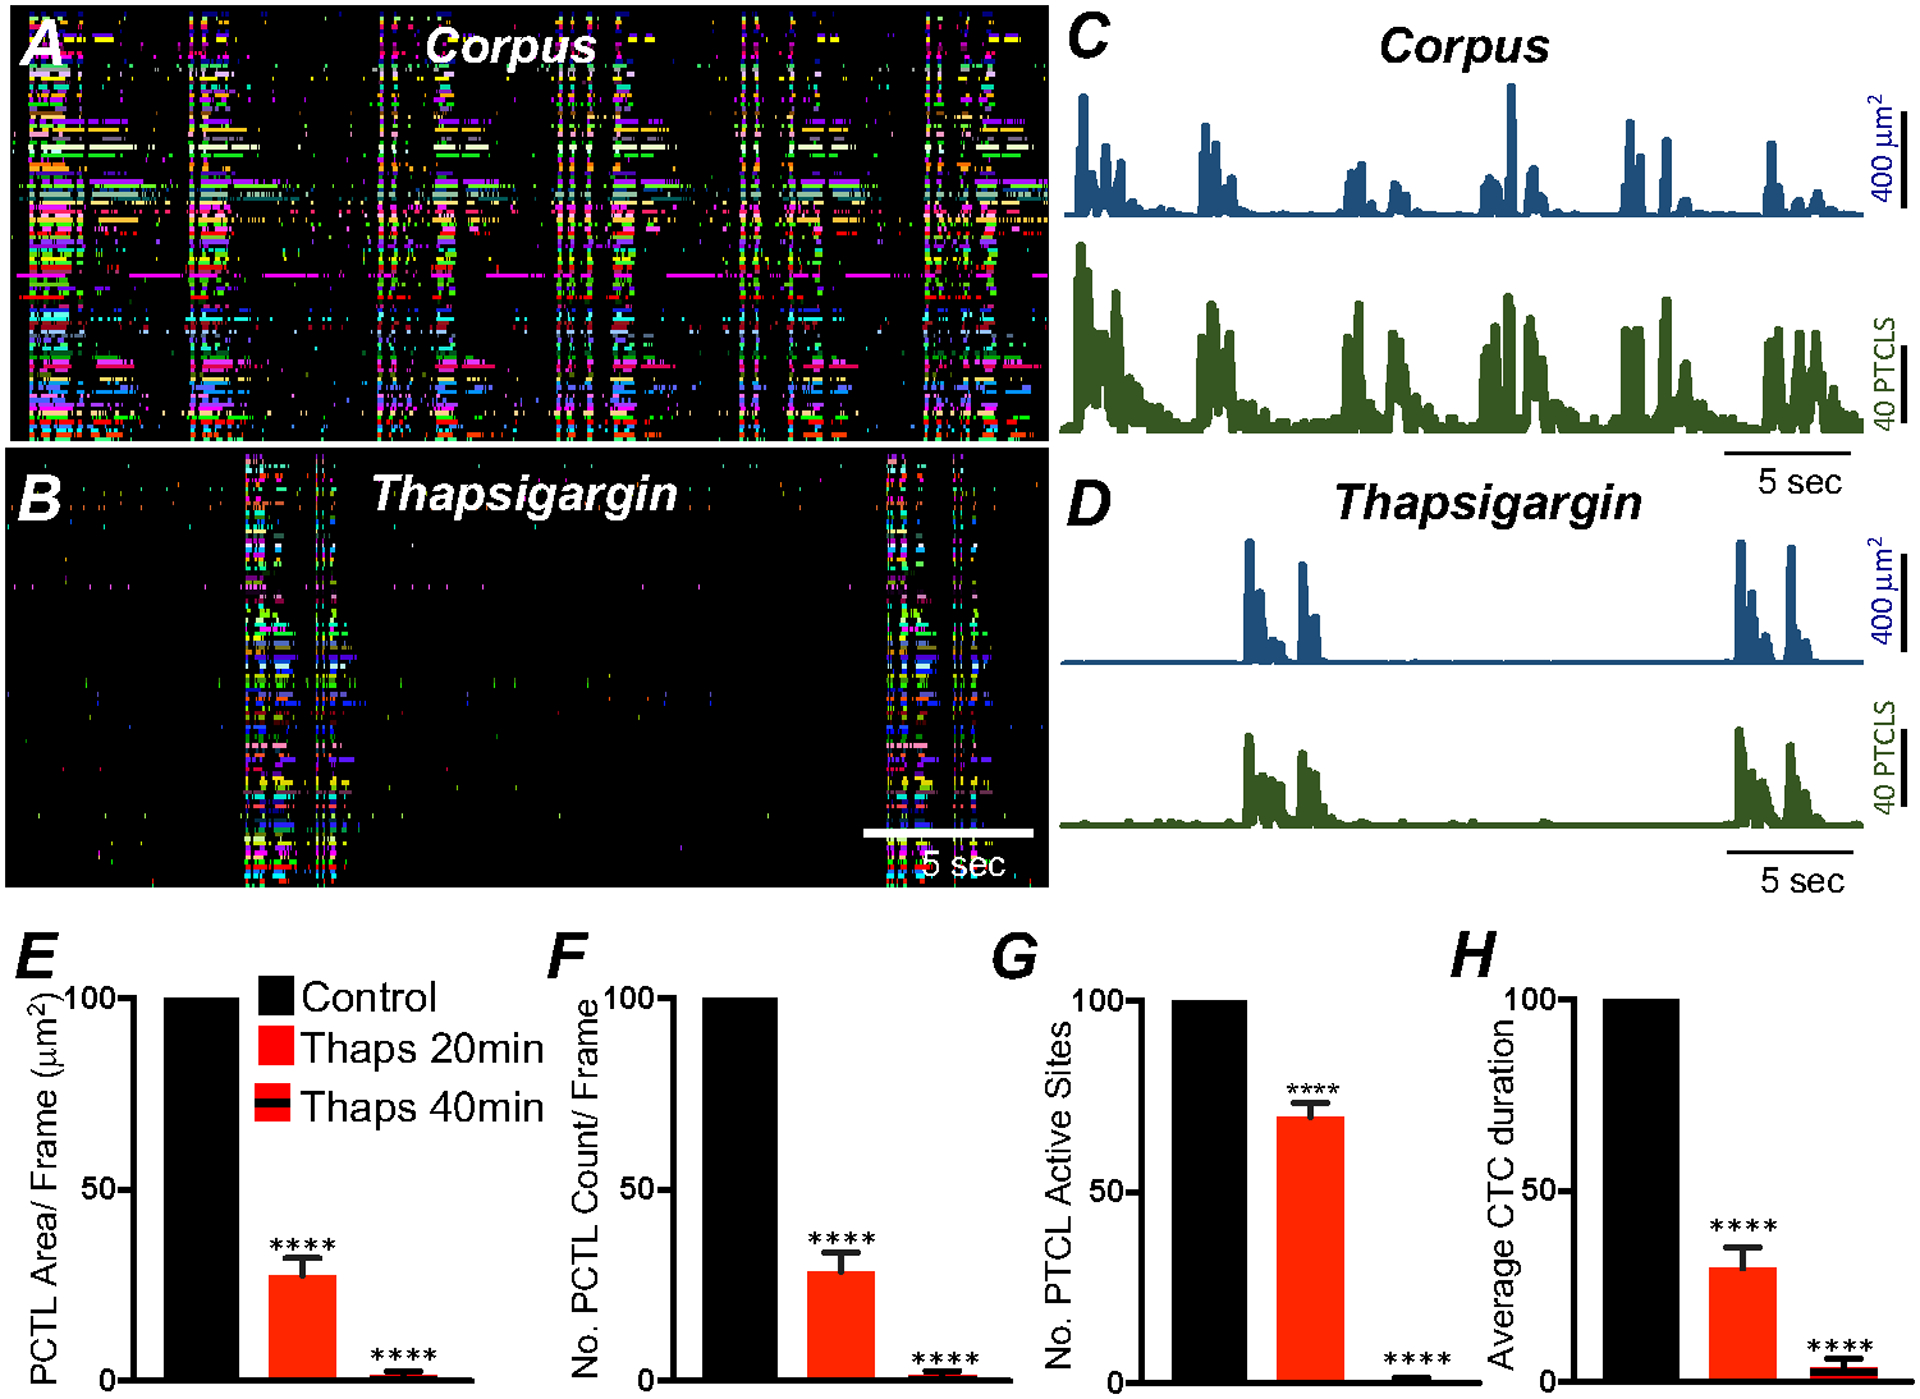
A ICC-MY Ca2+ firing site activity are color-coded and plotted in occurrence maps under control conditions and in the presence of thapsigargin (1 μM) B. Plot traces of firing sites PTCL area (C; blue) and PTCL count (C; green) under control conditions and in the presence of thapsigargin PTCL area (D; blue) and PTCL count (D; green). Summary graphs of Ca2+ PTCL activity in ICC-MY in the presence of thapsigargin after 20 min and 40 min incubation periods are shown in E (PTCL area), F (PTCL count), G the number of PTCL active sites and H Average percentage changes of Ca2+ transient clusters (CTCs) duration (n = 5). Data were normalized to controls and expressed as percentages (%). Significance determined using unpaired t-test, **** = P < 0.0001. All data graphed as mean ± SEM.
Store-operated calcium entry (SOCE) is a mechanism for maintenance of Ca2+ stores to sustain ER Ca2+ release. Ca2+ depletion from the ER causes STIM proteins to translocate to ER-plasma membrane (PM) junctions and bind to and activate Orai channels [45, 61–66]. Gastric antrum and corpus ICC showed enrichment in Orai1 and Orai3, and Orai2 showed a low level of expression (Fig. 14A; Table 1; n = 4). Transcripts of stromal interaction molecules, Stim1 and Stim2, were abundant in antrum and corpus ICC (Fig. 14A; Table 1; n = 4).
Fig. 14. Role of SOCE in maintaining ICC-MY Ca2+ transients.
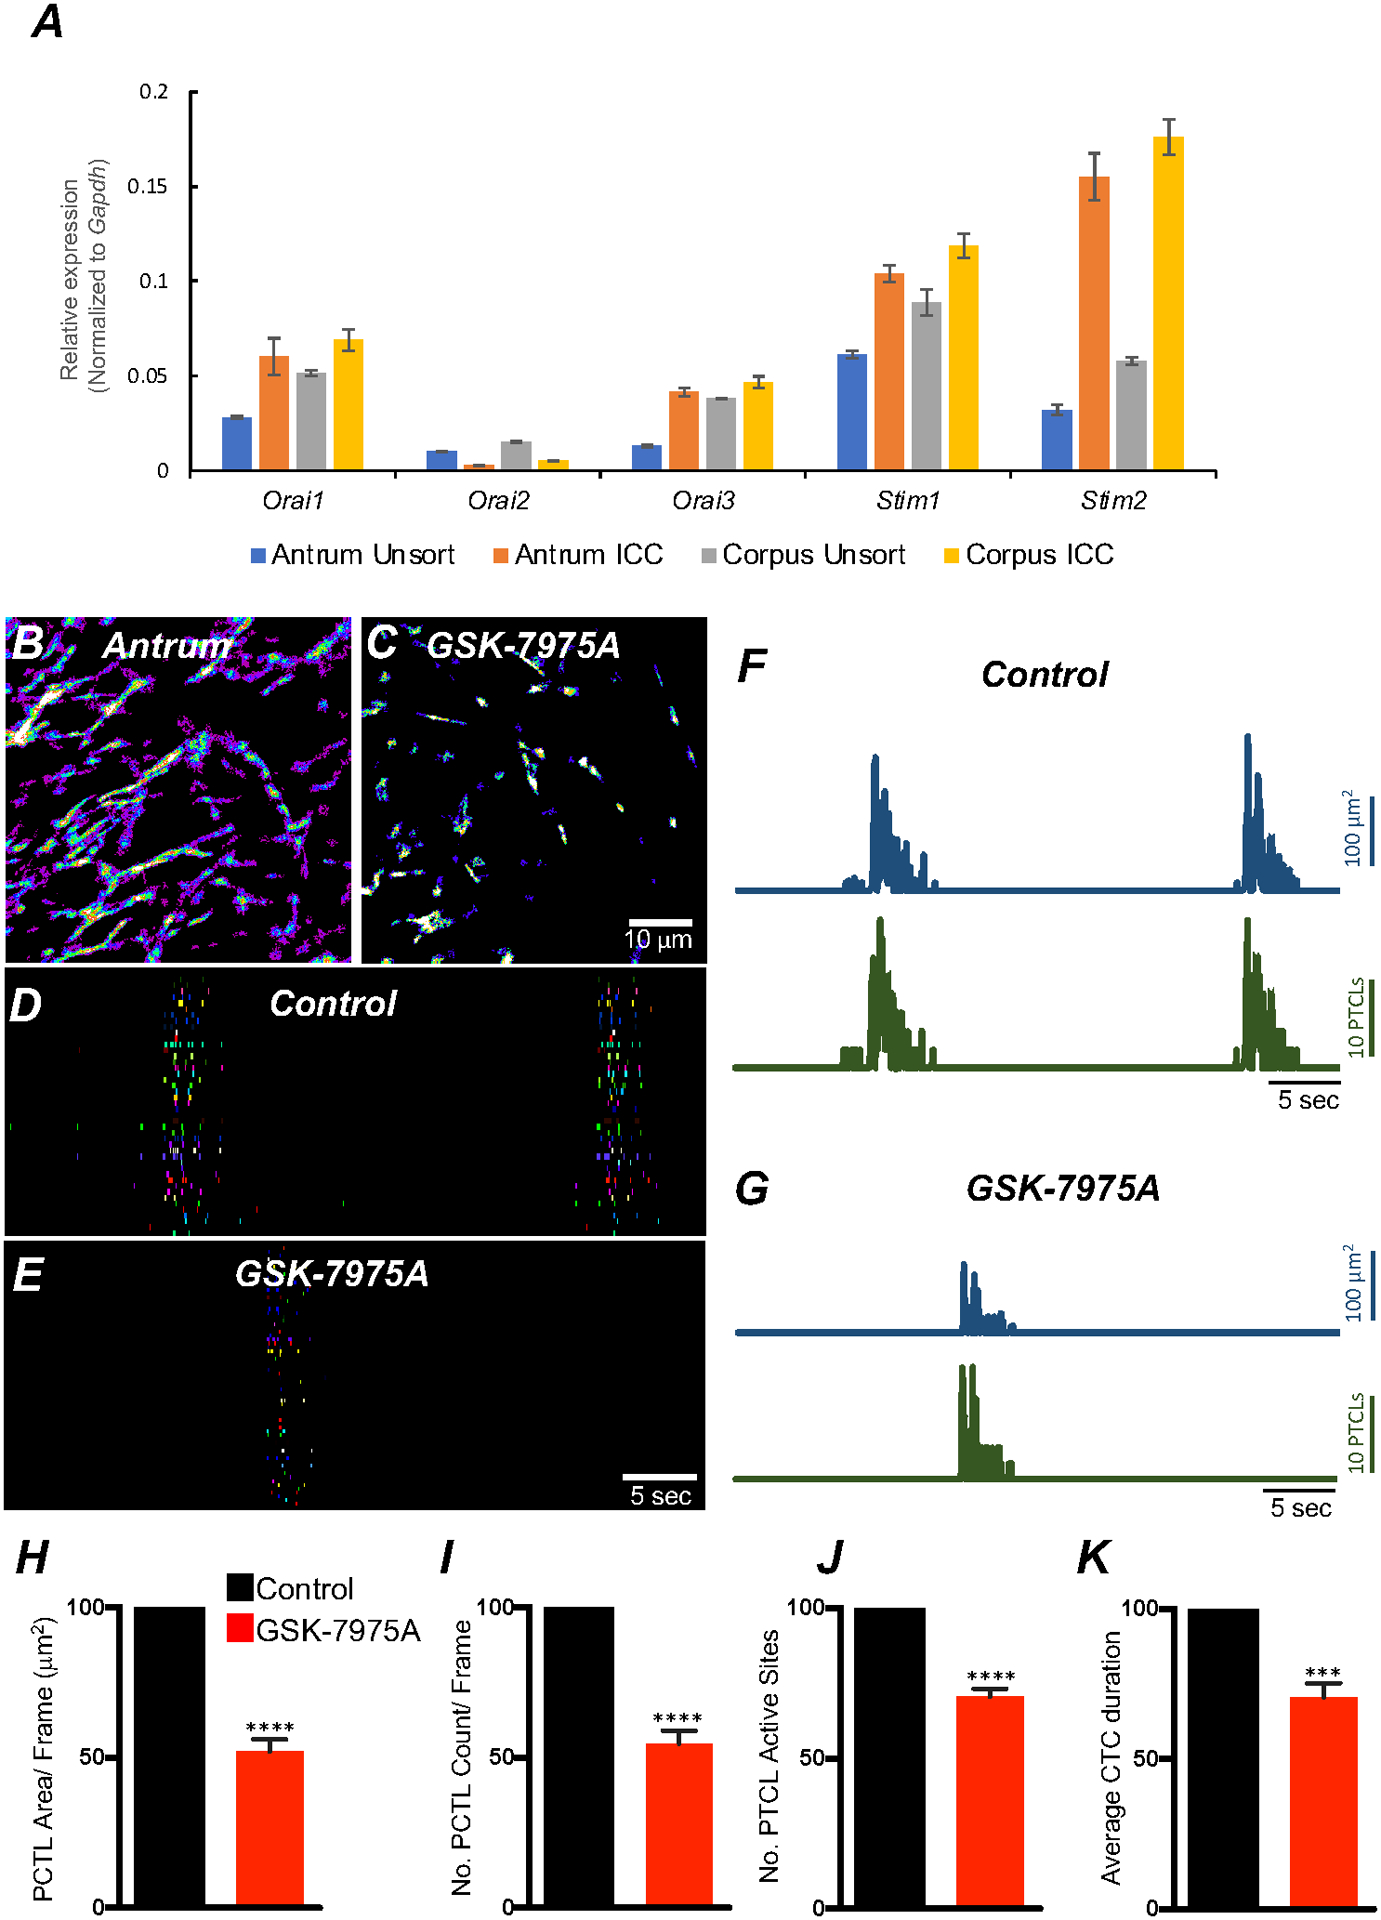
A Relative expression of store-operated Ca2+ entry (SOCE) channels (Orai1, Orai2 and Orai3) and stromal interaction molecules STIM1 and STIM2 in gastric ICC and compared with unsorted cells dispersed from gastric antrum and corpus tissues obtained from Kit+/copGFP mice. B Heat-map images of an antrum ICC-MY networks showing total active Ca2+ PTCLs under control conditions and in the presence of GSK-7975A (C, 10 μM, for 20 min). D & E occurrence maps of color-coded Ca2+ firing sites showing the effect of the SOCE channel antagonist, GSK-7975A (10 μM) on ICC-MY Ca2+ transients. Traces of PTCL area (F; blue) and PTCL count (F; green) under control conditions and in the presence of GSK-7975A, PTCL area (G; blue) and PTCL count (G; green). Summary graphs of Ca2+ PTCL activity in ICC-MY in the presence of GSK-7975A are shown in H (PTCL area), I (PTCL count), J the number of PTCL active sites and K Average percentage changes of Ca2+ transient clusters (CTCs) duration (n = 6). Significance determined using unpaired t-test, **** = P < 0.0001. All data graphed as mean ± SEM.
We examined the role of SOCE in maintenance Ca2+ transients in ICC-MY using an Orai antagonist: GSK 7975A (10 μM). GSK 7975A reduced the frequency of CTCs (Fig. 14B–G). Firing site occurrence (Fig. 14D&E) and Ca2+PTCL areas and counts were also reduced (Fig. 14F&G). Ca2+PTCL area was reduced to 52.1 ± 4.1% (Fig. 14H; n = 6), and the PTCL count was reduced to 55 ± 4.3% (Fig. 14I; n = 6). GSK 7975A also inhibited the number of firing sites to 70.5 ± 2.7% (Fig. 14J; n = 6). GSK 7975A also significantly reduced the CTC duration to 70.5 ± 4.8% (Fig. 14K; n = 6) and frequency to 73.5 ± 8.6% (n = 6). The data indicate that Ca2+influx via SOCE provides a mechanism to maintain Ca2+stores in ICC-MY.
4. Discussion
Slow wave activity is a fundamental behavior of gastric muscles and responsible for the peristaltic contractions that triturate solid foods into small particles to facilitate gastric emptying and efficient digestion and absorption of nutrients in the small intestine [4]. This study provides new insights into ICC mechanisms that lead to pacemaker dominance of the corpus, propagation of slow waves within ICC networks and why the plateau phase of gastric slow waves, that regulates excitation-contraction coupling and the force and duration of contractions [5], persists for seconds. We found that ICC-MY generate clusters of localized Ca2+ transients (CTCs) that correspond to the frequency of electrical slow waves. CTCs are initiated and organized by Ca2+ entry. Reduction in extracellular Ca2+ and a T-type Ca2+ channel antagonist reduced or blocked the rhythmic CTCs, as shown previously for slow waves [50]. When Ca2+ entry was blocked, Ca2+ transient activity resorted to stochastic activity similar to that observed in ICC lacking voltage-dependent Ca2+ entry mechanisms (e.g. ICC-DMP in the small intestine and ICC-IM in the colon) [34, 67]. Ca2+ transients in gastric ICC-MY resulted from release from intracellular stores, as indicated by the effects of SERCA pump antagonists. Analogous effects on electrical activity were observed with CPA, although it is realized that the effects of SERCA pump inhibitors might have complex effects in a syncytial tissue composed of multiple cell types. A role for store release of Ca2+ in ICC-MY was further supported by the effects of an ORAI channel antagonist, GSK-7975A, and suggested that stores are maintained, at least in part, by SOCE.
Electrophysiology experiments performed on gastric muscles from a variety of mammalian species have shown that isolated corpus muscles generate slow waves at a higher rate than isolated antrrum muscles [24, 26]. The frequency gradient leads to pacemaker dominance of the corpus in the intact stomach and facilitates spread of slow waves and contractions from the corpus through the antrum to the pyloric sphincter [68]. The reasons for dominance of the corpus vs. antrrum pacemaker cells was not determined by prior studies. An observation of major importance in the current study is that the pattern of Ca2+ transient firing differs dramatically in antrum and corpus ICC-MY. CTCs occur in ICC-MY in both regions of the stomach, but in antrum CTCs were followed by a dramatic refractory period, during which few Ca2+ transients occurred. However with time, refractoriness ebbed and sporadic Ca2+ transients developed. The occurrence of these events immediately preceded the onset the next CTC. This demonstrates the intrinsic pacemaker activity of the antrum, and shows it occurs at a lower frequency than in corpus. The pattern of Ca2+ transients was quite different in ICC-MY of the corpus. CTCs were followed by a definite reduction in firing frequency, but numerous Ca2+ transients persisted during the inter-CTC interval. Ca2+ release from stores activates Ano1 channels in ICC [38]. Ano1 currents depolarize ICC and bring the cells to the threshold for generation of slow wave currents [69]. The abundance of Ca2+ transients in corpus ICC-MY during the inter-CTC intervals increases the probability of STICs and STDs, the likelihood of summation of STDs and the probability of activating voltage-dependent Ca2+ conductances that initiate the slow wave upstroke potential and facilitate cell-to-cell active propagation [50]. These observations suggest that Ca2+ transients generated during the inter-CTC interval are the fundamental pacemaker events that initiate CTCs. The fact that inter-CTC Ca2+ transients are more prevalent in corpus ICC-MY is likely to explain why corpus pacemakers generate slow waves at higher frequencies and serve as the dominant pacemaker in the stomach.
Equivalent characteristics are also seen in electrophysiological recordings of slow waves from intact corpus and antrum muscles. Inter-slow wave depolarization of membrane potential can be observed in some cells in corpus muscles [24, 26, 70], and the inter-slow wave interval can include oscillations in membrane potential (like STDs) that precede the initiation of slow wave upstroke potentials (see Fig. 1). During the interval between slow waves, membrane potentials of antrum cells tend to be stable, and slow wave upstroke potentials in antrum muscles, when electrically coupled to the corpus, take off from an exponential ‘foot’ depolarization, indicating they are propagated events (see Fig. 1).
The refractory period for Ca2+ release following CTCs is a novel observation that is likely to be the key mechanism for regulation of slow wave frequency. Cessation of Ca2+ release events may be due to unloading of Ca2+ stores during CTCs. A similar refractory period was observed for generation of STDs (also termed ‘unitary potentials’) in which the frequency of STDs decreased after a slow wave and then gradually increased before initiation of the next slow wave [71]. These authors suggested that STDs occurring during the interval between slow waves triggers the upstroke of the next slow wave, a conclusion consistent with the findings of the current study. In canine and guinea pig gastric muscles the refractory period for the upstroke is relatively short, but several seconds are required to fully reset the plateau phase [72, 73]. Reloading of stores is consistent with the relatively long refractory periods for restoration of the plateau potential, as this phase depends upon Ca2+ release from stores and was greatly reduced in duration by SERCA pump antagonists. The long refractory periods for the plateau phase of gastric slow waves (~8–12 s) are consistent with the time required to refill Ca2+ stores after unloading episodes [74]. The long refractory periods of slow waves are unlikely to be a function of voltage dependent Ca2+ channels, as the activation and inactivation kinetics and resetting of these channels upon restoration of negative membrane potentials occur more rapidly than the long refractory periods of slow waves [75]. We speculate that reloading of Ca2+ stores restores the excitability of Ca2+ release channels in the ER and this is the primary determinant of slow wave frequency.
Our study showed how CTC duration can affect the frequency of these events and therefore slow waves. Blocking l-type Ca2+ channels (most likely CaV1.3) and modestly reducing extracellular Ca2+ (to 1 mM) reduced the durations of CTCs and increased their frequency. Reduced CTC duration was associated with fewer Ca2+ release events and therefore reduced store unloading. This might reduce the duration of the refractory period and explain the increase in CTC frequency. Future investigation of how pacing frequency affects store loading and the refractory periods of Ca2+ transients and CTCs will be needed to more fully understand how slow wave frequencies are regulated by neurotransmitters and hormones that display chronotropic effects.
Once initiated, slow waves spread actively through networks of ICC [21, 50, 76], but these events conduct passively into SMCs and through regions of smooth muscle devoid of ICC [8, 9]. Because antrum slow waves are so important for the peristaltic contractions of the distal. stomach and eventual emptying of solids [4], we devoted considerable attention to the underlying Ca2+ dynamics in antrum ICC-MY. There was a impressive clustering of discrete Ca2+ transients during each slow wave cycle (see Fig. 3H and supplemental Video 1). Ca2+ transients originated from a multitude of Ca2+ release sites in the processes and soma of ICC-MY. Clusters were initiated by an initial rise in [Ca2+]i during the first 600 msec. This sharp transition in [Ca2+]i likely represents Ca2+ entry as it persisted after addition of thapsigargin. After the initial rise in [Ca2+]i due to entry, Ca2+ release sites were unleashed, causing a dynamic array of Ca2+ transients that was sustained for at least 4 s. Multiple release events were observed from most sites during each CTC cycle.
The extended period of Ca2+ release during CTCs correspond to the long durations of depolarization during the plateau phase of slow waves. Sustaining the plateau depolarization likely results from an extended period of activation of Ano1 channels. Direct recordings from ICC have shown that the plateau phase reaches a maximum depolarization to approximately −10 mV [9, 51, 77–80]. This potential approximates the reversal potential for STICs that are due to activation of Ano1 channels [81] and thus approximates the transmembrane equilibrium potential for Cl− ions (ECl) in ICC.
Outward current mechanisms, via activation of voltage- or Ca2+ dependent K+ conductances, that might be involved in or required for slow wave repolarization have not been resolved in ICC [69]. This is a distinguishing feature of the excitable events generated by ICC and different from other excitable cells. The lack of an outward current conductance is likely to be a necessary feature for preserving the long durations of the slow wave plateau phase, because if a voltage- or Ca2+-dependent outward current developed upon depolarization or a rise in [Ca2+]i, then it would compete with the dominance of the Cl− conductance that tends to ‘clamp’ membrane potential near ECl during the plateau phase. When Ca2+ transients cease, the open probabilities of Ano1 channels are reduced and repolarization of slow waves occurs. In other words, membrane potentials of ICC-MY are bistable: one level (RMP or the inter-slow wave potential) is determined by dominant K+ conductances, and the other level (plateau phase of slow waves) is determined by the dominance of the Cl− conductance (i.e. Ano1). Jumping between levels requires initial depolarization (provided by STICs and activation of a T-type Ca2+ conductance), Ca2+ entry and activation of intracellular Ca2+transients (as characterized in the current study), and activation of Ano1 channels. The plateau phase is terminated by cessation of Ca2+ transients and restoration of low open probability for Ano1 channels. Our results suggest that the dynamic changes in Ca2+ release provide the mechanism for activation and deactivation of Ano1 currents during the slow wave cycle.
The question of what sustains Ca2+ release events for several seconds during the plateau phase is important to consider. Ca2+ entry through a T-type conductance is likely to be very brief, yet some mechanism sustains the occurrence of Ca2+ transients, and these events can fire repetitively during a single CTC (Fig. 15). The plateau appears to be dependent upon sustained Ca2+ entry, as reducing extracellular Ca2+ and antagonists of L-type Ca2+ channels reduce the amplitude and duration of the plateau phase [5, 24, 50, 80, 82]. Genes encoding CaV1.2 and CaV1.3 (i.e. Cacna1c and Cacna1d) L-type channels were expressed in gastric ICC, and this family of channels displays window currents (i.e. sustained low level channel activation due to incomplete inactivation) [83] in the range of potentials experienced during the plateau phase [9, 80]. In the present study we found that isradipine, an equipotent antagonist of CaV1.2 (containing α1C) and CaV1.3 (containing α1D) channels [84, 85], reduced the durations of CTCs. Studies on small intestinal ICC-MY suggest that the Na+/Ca2+ exchanger (NCX) can flip into Ca2+ entry mode during the plateau depolarization due to the entry of Na+ resulting from the recovery of Cl− via the Na+K+Cl− exchanger (NKCC1) [48, 81]. Genes for NCX1 and NCX2 are expressed in gastric ICC, but this mechanism has not yet been investigated in gastric ICC. Entry of Ca2+ through ORAI channels, expected to be activated by Ca2+ release and store depletion, could also be a contributing factor. However, SOCE would not seem to be a major mechanism for sustaining the durations of Ca2+ transient clusters, as this would represent positive feedback that would tend to prevent repolarization from the plateau phase.
Fig. 15. Ca2+ signaling drives pacemaker activity in gastric ICC-MY.
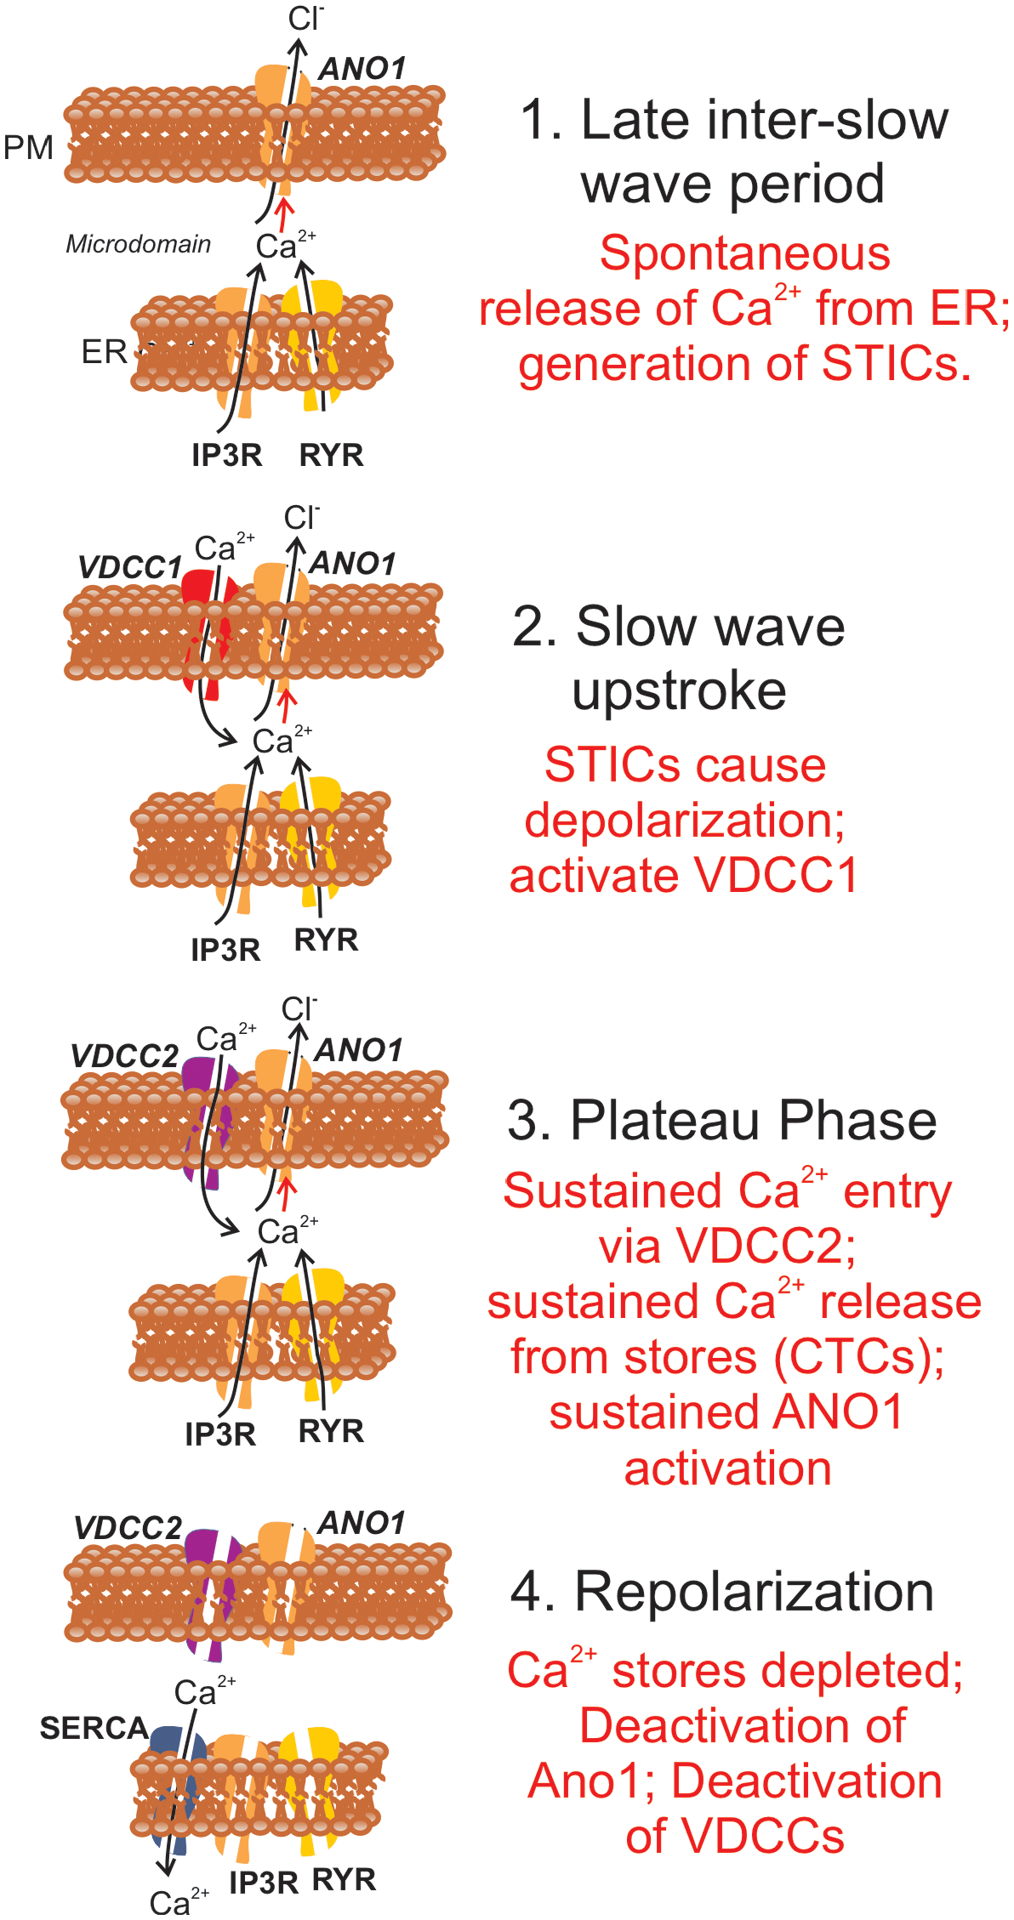
Steps in Ca2+ signaling in relation to generation of slow waves in gastric muscles are shown. For clarity the various proteins functioning during the slow wave cycle appear in panels at the stages where they become functional. 1. During the inter-slow wave interval, Ca2+ release from ER causes Ca2+ transients that activate Ano1 channels in the plasma membrane (PM). Activation of Ano1 causes development of spontaneous transient inward currents (STICs) which have depolarizing influence and generate spontaneous transient depolarizations (STDs). 2. Slow wave upstroke. The depolarization from STDs activates T-type Ca2+ current (VDCC1) that rapidly depolarize ICC-MY close to 0 mV. Influx of Ca2+ contributes to activation of Ano1 channels. 3. Plateau phase. Depolarization caused by the slow wave upstroke activates L-type Ca2+ current (VDCC2). Ca2+ entry causes localized Ca2+ induced Ca2+ release, and a multitude of Ca2+ release sites leads to development of CTCs. Ca2+ transient during CTCs activate Ano1 channels and maintain the depolarized state during the plateau phase. 4. Repolarization. When stores are depleted, Ca2+ transients cease and the open probability of Ano1 channels decreases to low levels causing repolarization. Repolarization also causes deactivation of VDCCs. SOCE (not shown) and SERCA pumps restore store Ca2+ to reset the mechanism for the next slow wave cycle. Corpus and antrum ICC-MY both manifest intrinsic pacemaker activity, however the frequency of pacemaking in the corpus is higher than in antrum. The present study suggests that the major difference between the pacemakers in the corpus and antrum is that the probability of Ca2+ transient firing is higher in corpus ICC-MY than in antrum. It should also be noted that scheme illustrated in the figure is relevant only to Ca2+ transients and activation of conductances in ICC. In intact muscles ICC are electrically coupled to SMCs. Electrical activity is recorded typically from SMCs, so additional conductances contribute to the shaping of the waveforms of slow waves. For example, the rapid repolarization following the initial upstroke (see Fig. 1C) is due to activation of an A-type current in SMCs [86, 87].
In summary the long duration plateau phase in gastric muscles is mirrored by the long period of Ca2+ release events in ICC-MY. Ca2+ release in ICC activates Ano1 channels that push membrane potential toward ECl. Ca2+ transients are organized into CTCs by voltage-dependent Ca2+ entry through a T-type Ca2+ cconductance. CTCs appear to be initiated by Ca2+-induced Ca2+ release. CTCs are sustained for seconds by continuous Ca2+ entry through L-type Ca2+ channels, most likely CaV1.3 operating within the voltage range for window currents. CTCs are followed by refractory periods during which the occurrence of Ca2+ transients is reduced. Initiation of CTCs corresponds to waning of the refractory period, increase in spontaneous Ca2+ transients, summation of Ca2+ transients, summation of Ano1 currents and depolarization of ICC-MY to the threshold for activation of T-type Ca2+ channels (Fig. 15). The occurrence of Ca2+ transients in corpus ICC-MY during the inter-CTC interval is likely to explain why the frequency of corpus slow waves is higher than in antrum and why the corpus ICC-MY serve as the dominant pacemaker for slow waves in the stomach.
Supplementary Material
Acknowledgements
The authors would like to thank Nancy Horowitz for maintenance and breeding of mice and Lauren Peri for qPCR analysis. Mohagoney Moore and Wesley A. Leigh for the analyzing Ca2+ imaging data and conducting initial imaging experiments.
6. Funding
This project was supported by R01s DK057236 and DK120759 from the National Institutes of Health, USA. National Institute of Diabetes and Digestive and Kidney Diseases (NIDDK).
Footnotes
Declaration Competing Interest
Authors declare that they have no competing interests
Supplementary materials
Supplementary material associated with this article can be found, in the online version, at doi:10.1016/j.ceca.2021.102472.
7. Data and materials availability
All data are available in the main text or the supplementary materials
References
- [1].Tack J, Gastric motor and sensory function, Curr Opin Gastroenterol 21 (2005) 665–672. [DOI] [PubMed] [Google Scholar]
- [2].van den Elzen BD, Boeckxstaens GE, Review article: a critical view on impaired accommodation as therapeutic target for functional dyspepsia, Aliment Pharmacol Ther 23 (2006) 1499–1510. [DOI] [PubMed] [Google Scholar]
- [3].Kelly KA, Code CF, Elveback LR, Patterns of canine gastric electrical activity, Am J Physiol 217 (1969) 461–470. [DOI] [PubMed] [Google Scholar]
- [4].Szurszewski JH, Electrical basis for gastrointestinal motility, in: Johnson LR (Ed.), Physiology of the Gastrointestinal Tract, Raven Press, New York, 1987, pp. 383–422. [Google Scholar]
- [5].Ozaki H, Stevens RJ, Blondfield DP, Publicover NG, Sanders KM, Simultaneous measurement of membrane potential, cytosolic Ca2+, and tension in intact smooth muscles, Am J Physiol 260 (1991) C917–C925. [DOI] [PubMed] [Google Scholar]
- [6].Vogalis F, Publicover NG, Hume JR, Sanders KM, Relationship between calcium current and cytosolic calcium in canine gastric smooth muscle cells, Am J Physiol 260 (1991) C1012–C1018. [DOI] [PubMed] [Google Scholar]
- [7].Mitra R, Morad M, Ca2+ and Ca2+-activated K+ currents in mammalian gastric smooth muscle cells, Science 229 (1985) 269–272. [DOI] [PubMed] [Google Scholar]
- [8].Ordog T, Ward SM, Sanders KM, Interstitial cells of cajal generate electrical slow waves in the murine stomach, J Physiol 518 (1999) 257–269. Pt 1. [DOI] [PMC free article] [PubMed] [Google Scholar]
- [9].Dickens EJ, Hirst GD, Tomita T, Identification of rhythmically active cells in guinea-pig stomach, J Physiol 514 (1999) 515–531. Pt 2. [DOI] [PMC free article] [PubMed] [Google Scholar]
- [10].Komuro T, Structure and organization of interstitial cells of Cajal in the gastrointestinal tract, J Physiol 576 (2006) 653–658. [DOI] [PMC free article] [PubMed] [Google Scholar]
- [11].Komuro T, Atlas of interstitail cells of Cajal in the gastrointestinal tract, Springer, Dordrecht, 2012. [Google Scholar]
- [12].Kurahashi M, Zheng H, Dwyer L, Ward SM, Don Koh S, Sanders KM, A functional role for the ‘fibroblast-like cells’ in gastrointestinal smooth muscles, J Physiol 589 (2011) 697–710. [DOI] [PMC free article] [PubMed] [Google Scholar]
- [13].Sanders KM, Koh SD, Ro S, Ward SM, Regulation of gastrointestinal motility–insights from smooth muscle biology, Nat Rev Gastroenterol Hepatol 9 (2012) 633–645. [DOI] [PMC free article] [PubMed] [Google Scholar]
- [14].Sanders KM, Ward SM, Koh SD, Interstitial cells: regulators of smooth muscle function, Physiol Rev 94 (2014) 859–907. [DOI] [PMC free article] [PubMed] [Google Scholar]
- [15].Angeli TR, Cheng LK, Du P, Wang TH, Bernard CE, Vannucchi MG, Faussone-Pellegrini MS, Lahr C, Vather R, Windsor JA, Farrugia G, Abell TL, O’Grady G, Loss of Interstitial Cells of Cajal and Patterns of Gastric Dysrhythmia in Patients With Chronic Unexplained Nausea and Vomiting, Gastroenterology 149 (2015) e55, 56–66. [DOI] [PMC free article] [PubMed] [Google Scholar]
- [16].Grover M, Farrugia G, Lurken MS, Bernard CE, Faussone-Pellegrini MS, Smyrk TC, Parkman HP, Abell TL, Snape WJ, Hasler WL, Unalp-Arida A, Nguyen L, Koch KL, Calles J, Lee L, Tonascia J, Hamilton FA, Pasricha PJ, Consortium NGCR, Cellular changes in diabetic and idiopathic gastroparesis, Gastroenterology 140 (2011) e1578, 1575–1585. [DOI] [PMC free article] [PubMed] [Google Scholar]
- [17].Ordog T, Interstitial cells of Cajal in diabetic gastroenteropathy, Neurogastroenterol Motil 20 (2008) 8–18. [DOI] [PubMed] [Google Scholar]
- [18].Ward SM, Burns AJ, Torihashi S, Sanders KM, Mutation of the proto-oncogene c-kit blocks development of interstitial cells and electrical rhythmicity in murine intestine, J Physiol 480 (Pt 1) (1994) 91–97. [DOI] [PMC free article] [PubMed] [Google Scholar]
- [19].Torihashi S, Ward SM, Nishikawa S, Nishi K, Kobayashi S, Sanders KM, c-kit-dependent development of interstitial cells and electrical activity in the murine gastrointestinal tract, Cell Tissue Res 280 (1995) 97–111. [DOI] [PubMed] [Google Scholar]
- [20].Hwang SJ, Blair PJA, Britton FC, O’Driscoll KE, Hennig G, Bayguinov YR, Rock JR, Harfe BD, Sanders KM, Ward SM, Expression of anoctamin 1/TMEM16A by interstitial cells of Cajal is fundamental for slow wave activity in gastrointestinal muscles, The Journal of Physiology 587 (2009) 4887–4904. [DOI] [PMC free article] [PubMed] [Google Scholar]
- [21].Drumm BT, Hennig GW, Battersby MJ, Cunningham EK, Sung TS, Ward SM, Sanders KM, Baker SA, Clustering of Ca(2+) transients in interstitial cells of Cajal defines slow wave duration, J Gen Physiol 149 (2017) 703–725. [DOI] [PMC free article] [PubMed] [Google Scholar]
- [22].Singh RD, Gibbons SJ, Saravanaperumal SA, Du P, Hennig GW, Eisenman ST, Mazzone A, Hayashi Y, Cao C, Stoltz GJ, Ordog T, Rock JR, Harfe BD, Szurszewski JH, Farrugia G, Ano1, a Ca2+-activated Cl− channel, coordinates contractility in mouse intestine by Ca2+ transient coordination between interstitial cells of Cajal, J Physiol 592 (2014) 4051–4068. [DOI] [PMC free article] [PubMed] [Google Scholar]
- [23].Malysz J, Gibbons SJ, Saravanaperumal SA, Du P, Eisenman ST, Cao C, Oh U, Saur D, Klein S, Ordog T, Farrugia G, Conditional genetic deletion of Ano1 in interstitial cells of Cajal impairs Ca(2+) transients and slow waves in adult mouse small intestine, Am J Physiol Gastrointest Liver Physiol 312 (2017) G228–G245. [DOI] [PMC free article] [PubMed] [Google Scholar]
- [24].el-Sharkawy TY, Morgan KG, Szurszewski JH, Intracellular electrical activity of canine and human gastric smooth muscle, J Physiol 279 (1978) 291–307. [DOI] [PMC free article] [PubMed] [Google Scholar]
- [25].Forrest AS, Ordog T, Sanders KM, Neural regulation of slow-wave frequency in the murine gastric antrum, Am J Physiol Gastrointest Liver Physiol 290 (2006) G486–G495. [DOI] [PubMed] [Google Scholar]
- [26].Forrest AS, Hennig GW, Jokela-Willis S, Park CD, Sanders KM, Prostaglandin regulation of gastric slow waves and peristalsis, Am J Physiol Gastrointest Liver Physiol 296 (2009) G1180–G1190. [DOI] [PMC free article] [PubMed] [Google Scholar]
- [27].Camilleri M, Bharucha AE, Farrugia G, Epidemiology, mechanisms, and management of diabetic gastroparesis, Clin Gastroenterol Hepatol 9 (2011) 5–12, quiz e17. [DOI] [PMC free article] [PubMed] [Google Scholar]
- [28].Parkman HP, Yates K, Hasler WL, Nguyen L, Pasricha PJ, Snape WJ, Farrugia G, Koch KL, Calles J, Abell TL, McCallum RW, Lee L, Unalp-Arida A, Tonascia J, Hamilton F, D, National Institute of, Digestive, C. Kidney Diseases Gastroparesis Clinical Research, Similarities and differences between diabetic and idiopathic gastroparesis, Clin Gastroenterol Hepatol 9 (2011) 1056–1064, quiz e1133–1054. [DOI] [PMC free article] [PubMed] [Google Scholar]
- [29].Blair PJ, Hwang SJ, Shonnard MC, Peri LE, Bayguinov Y, Sanders KM, Ward SM, The Role of Prostaglandins in Disrupted Gastric Motor Activity Associated With Type 2 Diabetes, Diabetes 68 (2019) 637–647. [DOI] [PMC free article] [PubMed] [Google Scholar]
- [30].Bradshaw LA, Cheng LK, Chung E, Obioha CB, Erickson JC, Gorman BL, Somarajan S, Richards WO, Diabetic gastroparesis alters the biomagnetic signature of the gastric slow wave, Neurogastroenterol Motil 28 (2016) 837–848. [DOI] [PMC free article] [PubMed] [Google Scholar]
- [31].O’Grady G, Angeli TR, Du P, Lahr C, Lammers WJ, Windsor JA, Abell TL, Farrugia G, Pullan AJ, Cheng LK, Abnormal initiation and conduction of slow-wave activity in gastroparesis, defined by high-resolution electrical mapping, Gastroenterology 143 (2012) 589–598, e581–583. [DOI] [PMC free article] [PubMed] [Google Scholar]
- [32].Chen H, Ordog T, Chen J, Young DL, Bardsley MR, Redelman D, Ward SM, Sanders KM, Differential gene expression in functional classes of interstitial cells of Cajal in murine small intestine, Physiol Genomics 31 (2007) 492–509. [DOI] [PubMed] [Google Scholar]
- [33].Gomez-Pinilla PJ, Gibbons SJ, Bardsley MR, Lorincz A, Pozo MJ, Pasricha PJ, Van de Rijn M, West RB, Sarr MG, Kendrick ML, Cima RR, Dozois EJ, Larson DW, Ordog T, Farrugia G, Ano1 is a selective marker of interstitial cells of Cajal in the human and mouse gastrointestinal tract, American journal of physiology. Gastrointestinal and liver physiology 296 (2009) G1370–G1381. [DOI] [PMC free article] [PubMed] [Google Scholar]
- [34].Baker SA, Drumm BT, Saur D, Hennig GW, Ward SM, Sanders KM, Spontaneous Ca transients in interstitial cells of Cajal located within the deep muscular plexus of the murine small intestine, J Physiol (2016). [DOI] [PMC free article] [PubMed] [Google Scholar]
- [35].Lee HT, Hennig GW, Fleming NW, Keef KD, Spencer NJ, Ward SM, Sanders KM, Smith TK, The Mechanism and Spread of Pacemaker Activity Through Myenteric Interstitial Cells of Cajal in Human Small Intestine, Gastroenterology 132 (2007) 1852–1865. [DOI] [PubMed] [Google Scholar]
- [36].Park KJ, Hennig GW, Lee HT, Spencer NJ, Ward SM, Smith TK, Sanders KM, Spatial and temporal mapping of pacemaker activity in interstitial cells of Cajal in mouse ileum in situ, Am J Physiol Cell Physiol 290 (2006) C1411–C1427. [DOI] [PubMed] [Google Scholar]
- [37].Yamazawa T, Iino M, Simultaneous imaging of Ca2+ signals in interstitial cells of Cajal and longitudinal smooth muscle cells during rhythmic activity in mouse ileum, J Physiol 538 (2002) 823–835. [DOI] [PMC free article] [PubMed] [Google Scholar]
- [38].Zhu MH, Sung TS, O’Driscoll K, Koh SD, Sanders KM, Intracellular Ca(2+) release from endoplasmic reticulum regulates slow wave currents and pacemaker activity of interstitial cells of Cajal, Am J Physiol Cell Physiol 308 (2015) C608–C620. [DOI] [PMC free article] [PubMed] [Google Scholar]
- [39].Jin B, Ha SE, Wei L, Singh R, Zogg H, Clemmensen B, Heredia DJ, Gould TW, Sanders KM, Ro S, Colonic Motility is Improved by the Activation of 5-HT, Gastroenterology (2021). [DOI] [PMC free article] [PubMed] [Google Scholar]
- [40].Baker SA, Drumm BT, Saur D, Hennig GW, Ward SM, Sanders KM, Spontaneous Ca(2+) transients in interstitial cells of Cajal located within the deep muscular plexus of the murine small intestine, J Physiol 594 (2016) 3317–3338. [DOI] [PMC free article] [PubMed] [Google Scholar]
- [41].Shaylor LA, Hwang SJ, Sanders KM, Ward SM, Convergence of inhibitory neural inputs regulate motor activity in the murine and monkey stomach, Am J Physiol Gastrointest Liver Physiol 311 (2016) G838–G851. [DOI] [PMC free article] [PubMed] [Google Scholar]
- [42].Baker SA, Drumm BT, Skowronek KE, Rembetski BE, Peri LE, Hennig GW, Perrino BA, Sanders KM, Excitatory Neuronal Responses of Ca(2+) Transients in Interstitial Cells of Cajal in the Small Intestine, eNeuro (2018) 5. [DOI] [PMC free article] [PubMed] [Google Scholar]
- [43].Suzuki H, Hirst GD, Regenerative potentials evoked in circular smooth muscle of the antral region of guinea-pig stomach, J Physiol 517 (1999) 563–573. Pt 2. [DOI] [PMC free article] [PubMed] [Google Scholar]
- [44].Beckett EA, McGeough CA, Sanders KM, Ward SM, Pacing of interstitial cells of Cajal in the murine gastric antrum: neurally mediated and direct stimulation, J Physiol 553 (2003) 545–559. [DOI] [PMC free article] [PubMed] [Google Scholar]
- [45].Baker SA, Leigh WA, Del Valle G, De Yturriaga IF, Ward SM, Cobine CA, Drumm BT, Sanders KM, Ca, Elife, 10 (2021). [DOI] [PMC free article] [PubMed] [Google Scholar]
- [46].Leigh WA, Del Valle G, Kamran SA, Drumm BT, Tavakkoli A, Sanders KM, Baker SA, A high throughput machine-learning driven analysis of Ca, Cell Calcium 91 (2020), 102260. [DOI] [PMC free article] [PubMed] [Google Scholar]
- [47].Hwang SJ, Pardo DM, Zheng H, Bayguinov Y, Blair PJ, Fortune-Grant R, Cook RS, Hennig GW, Shonnard MC, Grainger N, Peri LE, Verma SD, Rock J, Sanders KM, Ward SM, Differential sensitivity of gastric and small intestinal muscles to inducible knockdown of anoctamin 1 and the effects on gastrointestinal motility, J Physiol (2019). [DOI] [PMC free article] [PubMed] [Google Scholar]
- [48].Zheng H, Drumm BT, Zhu MH, Xie Y, O’Driscoll KE, Baker SA, Perrino BA, Koh SD, Sanders KM, Na+/Ca2+ Exchange and Pacemaker Activity of Interstitial Cells of Cajal, Front Physiol 11 (2020) 230. [DOI] [PMC free article] [PubMed] [Google Scholar]
- [49].Huang S, Nakayama S, Iino S, Tomita T, Voltage sensitivity of slow wave frequency in isolated circular muscle strips from guinea pig gastric antrum, Am J Physiol Gastrointest Liver Physiol 276 (1999) G518–G528. [DOI] [PubMed] [Google Scholar]
- [50].Bayguinov O, Ward SM, Kenyon JL, Sanders KM, Voltage-gated Ca2+ currents are necessary for slow-wave propagation in the canine gastric antrum, Am J Physiol Cell Physiol 293 (2007) C1645–C1659. [DOI] [PubMed] [Google Scholar]
- [51].Kito Y, Suzuki H, Electrophysiological properties of gastric pacemaker potentials, J Smooth Muscle Res 39 (2003) 163–173. [DOI] [PubMed] [Google Scholar]
- [52].Hashitani H, Suzuki H, Properties of spontaneous Ca2+ transients recorded from interstitial cells of Cajal-like cells of the rabbit urethra in situ, J Physiol 583 (2007) 505–519. [DOI] [PMC free article] [PubMed] [Google Scholar]
- [53].Dixon RE, Britton FC, Baker SA, Hennig GW, Rollings CM, Sanders KM, Ward SM, Electrical slow waves in the mouse oviduct are dependent on extracellular and intracellular calcium sources, Am J Physiol Cell Physiol 301 (2011) C1458–C1469. [DOI] [PMC free article] [PubMed] [Google Scholar]
- [54].Drumm BT, Hennig GW, Battersby MJ, Cunningham EK, Sung TS, Ward SM, Sanders KM, Baker SA, Clustering of Ca2+ transients in interstitial cells of Cajal defines slow wave duration, J Gen Physiol 149 (2017) 703–725. [DOI] [PMC free article] [PubMed] [Google Scholar]
- [55].Zhu MH, Sung TS, O’Driscoll K, Koh SD, Sanders KM, Intracellular Ca2+ release from endoplasmic reticulum regulates slow wave currents and pacemaker activity of interstitial cells of Cajal, Am J Physiol Cell Physiol 308 (2015) C608–C620. [DOI] [PMC free article] [PubMed] [Google Scholar]
- [56].Fujino I, Yamada N, Miyawaki A, Hasegawa M, Furuichi T, Mikoshiba K, Differential expression of type 2 and type 3 inositol 1,4,5-trisphosphate receptor mRNAs in various mouse tissues: in situ hybridization study, Cell Tissue Res 280 (1995) 201–210. [DOI] [PubMed] [Google Scholar]
- [57].Giannini G, Conti A, Mammarella S, Scrobogna M, Sorrentino V, The ryanodine receptor/calcium channel genes are widely and differentially expressed in murine brain and peripheral tissues, J Cell Biol 128 (1995) 893–904. [DOI] [PMC free article] [PubMed] [Google Scholar]
- [58].Aoyama M, Yamada A, Wang J, Ohya S, Furuzono S, Goto T, Hotta S, Ito Y, Matsubara T, Shimokata K, Chen SR, Imaizumi Y, Nakayama S, Requirement of ryanodine receptors for pacemaker Ca2+ activity in ICC and HEK293 cells, J Cell Sci 117 (2004) 2813–2825. [DOI] [PubMed] [Google Scholar]
- [59].Morel JL, Rakotoarisoa L, Jeyakumar LH, Fleischer S, Mironneau C, Mironneau J, Decreased expression of ryanodine receptors alters calcium-induced calcium release mechanism in mdx duodenal myocytes, J Biol Chem 279 (2004) 21287–21293. [DOI] [PubMed] [Google Scholar]
- [60].Ward SM, Ordog T, Koh SD, Baker SA, Jun JY, Amberg G, Monaghan K, Sanders KM, Pacemaking in interstitial cells of Cajal depends upon calcium handling by endoplasmic reticulum and mitochondria, J Physiol 525 (2000) 355–361. Pt 2. [DOI] [PMC free article] [PubMed] [Google Scholar]
- [61].Lyfenko AD, Dirksen RT, Differential dependence of store-operated and excitation-coupled Ca2+ entry in skeletal muscle on STIM1 and Orai1, J Physiol 586 (2008) 4815–4824. [DOI] [PMC free article] [PubMed] [Google Scholar]
- [62].Putney JW, The physiological function of store-operated calcium entry, Neurochem Res 36 (2011) 1157–1165. [DOI] [PMC free article] [PubMed] [Google Scholar]
- [63].Trebak M, Putney JW, ORAI Calcium Channels, Physiology 32 (2017) 332–342. [DOI] [PMC free article] [PubMed] [Google Scholar]
- [64].Zheng H, Drumm BT, Earley S, Sung TS, Koh SD, Sanders KM, SOCE mediated by STIM and Orai is essential for pacemaker activity in the interstitial cells of Cajal in the gastrointestinal tract, Sci Signal 11 (2018). [DOI] [PMC free article] [PubMed] [Google Scholar]
- [65].Prakriya M, Lewis RS, Store-Operated Calcium Channels, Physiol Rev 95 (2015) 1383–1436. [DOI] [PMC free article] [PubMed] [Google Scholar]
- [66].Chen J, Sanderson MJ, Store-operated calcium entry is required for sustained contraction and Ca2+ oscillations of airway smooth muscle, Journal of Physiology 595 (2017) 3203–3218. [DOI] [PMC free article] [PubMed] [Google Scholar]
- [67].Drumm BT, Hwang SJ, Baker SA, Ward SM, Sanders KM, Ca J Physiol 597 (2019) 3587–3617. [DOI] [PMC free article] [PubMed] [Google Scholar]
- [68].Hinder RA, Kelly KA, Human gastric pacesetter potential. Site of origin, spread, and response to gastric transection and proximal gastric vagotomy, Am J Surg 133 (1977) 29–33. [DOI] [PubMed] [Google Scholar]
- [69].Zhu MH, Kim TW, Ro S, Yan W, Ward SM, Koh SD, Sanders KM, A Ca(2+)-activated Cl(−) conductance in interstitial cells of Cajal linked to slow wave currents and pacemaker activity, J Physiol 587 (2009) 4905–4918. [DOI] [PMC free article] [PubMed] [Google Scholar]
- [70].Morgan KG, Szurszewski JH, Mechanisms of phasic and tonic actions of pentagastrin on canine gastric smooth muscle, J Physiol 301 (1980) 229–242. [DOI] [PMC free article] [PubMed] [Google Scholar]
- [71].Hirst GD, Edwards FR, Generation of slow waves in the antral region of guinea-pig stomach–a stochastic process, J Physiol 535 (2001) 165–180. [DOI] [PMC free article] [PubMed] [Google Scholar]
- [72].Publicover NG, Sanders KM, Effects of frequency on the wave form of propagated slow waves in canine gastric antral muscle, J Physiol 371 (1986) 179–189. [DOI] [PMC free article] [PubMed] [Google Scholar]
- [73].Nose K, Suzuki H, Kannan H, Voltage dependency of the frequency of slow waves in antrum smooth muscle of the guinea-pig stomach, Jpn J Physiol 50 (2000) 625–633. [DOI] [PubMed] [Google Scholar]
- [74].Berridge MJ, Inositol trisphosphate and calcium signalling, Nature 361 (1993) 315–325. [DOI] [PubMed] [Google Scholar]
- [75].van Helden DF, Imtiaz MS, Nurgaliyeva K, von der Weid P, Dosen PJ, Role of calcium stores and membrane voltage in the generation of slow wave action potentials in guinea-pig gastric pylorus, J Physiol 524 (2000) 245–265. Pt 1. [DOI] [PMC free article] [PubMed] [Google Scholar]
- [76].Ward SM, Baker SA, de Faoite A, Sanders KM, Propagation of slow waves requires IP3 receptors and mitochondrial Ca2+ uptake in canine colonic muscles, J Physiol 549 (2003) 207–218. [DOI] [PMC free article] [PubMed] [Google Scholar]
- [77].Kito Y, Suzuki H, Pacemaker frequency is increased by sodium nitroprusside in the guinea pig gastric antrum, J Physiol 546 (2003) 191–205. [DOI] [PMC free article] [PubMed] [Google Scholar]
- [78].Kito Y, Ward SM, Sanders KM, Pacemaker potentials generated by interstitial cells of Cajal in the murine intestine, Am J Physiol Cell Physiol 288 (2005) C710–C720. [DOI] [PubMed] [Google Scholar]
- [79].Kito Y, Mitsui R, Ward SM, Sanders KM, Characterization of slow waves generated by myenteric interstitial cells of Cajal of the rabbit small intestine, Am J Physiol Gastrointest Liver Physiol 308 (2015) G378–G388. [DOI] [PMC free article] [PubMed] [Google Scholar]
- [80].Kito Y, Suzuki H, Properties of pacemaker potentials recorded from myenteric interstitial cells of Cajal distributed in the mouse small intestine, The Journal of physiology 553 (2003) 803–818. [DOI] [PMC free article] [PubMed] [Google Scholar]
- [81].Zhu MH, Sung TS, Kurahashi M, O’Kane LE, O’Driscoll K, Koh SD, Sanders KM, Na+-K+-Cl− cotransporter (NKCC) maintains the chloride gradient to sustain pacemaker activity in interstitial cells of Cajal, Am J Physiol Gastrointest Liver Physiol 311 (2016) G1037–G1046. [DOI] [PMC free article] [PubMed] [Google Scholar]
- [82].Kito Y, Mitsui R, Ward SM, Sanders KM, Characterization of slow waves generated by myenteric interstitial cells of Cajal of the rabbit small intestine, American Journal of Physiology - Gastrointestinal and Liver Physiology 308 (2015) G378–G388. [DOI] [PMC free article] [PubMed] [Google Scholar]
- [83].Cohen NM, Lederer WJ, Calcium current in isolated neonatal rat ventricular myocytes, J Physiol 391 (1987) 169–191. [DOI] [PMC free article] [PubMed] [Google Scholar]
- [84].Koschak A, Reimer D, Huber I, Grabner M, Glossmann H, Engel J, J Striessnig, alpha 1D (Cav1.3) subunits can form l-type Ca2+ channels activating at negative voltages, J Biol Chem 276 (2001) 22100–22106. [DOI] [PubMed] [Google Scholar]
- [85].Rüegg UT, Hof RP, Pharmacology of the calcium antagonist isradipine, Drugs 40 (1990) 3–9. Suppl 2. [DOI] [PubMed] [Google Scholar]
- [86].Amberg GC, Baker SA, Koh SD, Hatton WJ, Murray KJ, Horowitz B, Sanders KM, Characterization of the A-type potassium current in murine gastric antrum, J Physiol 544 (2002) 417–428. [DOI] [PMC free article] [PubMed] [Google Scholar]
- [87].Amberg GC, Koh SD, Imaizumi Y, Ohya S, Sanders KM, A-type potassium currents in smooth muscle, American Journal of Physiology 284 (2003) C583–C595. [DOI] [PubMed] [Google Scholar]
Associated Data
This section collects any data citations, data availability statements, or supplementary materials included in this article.
Supplementary Materials
Data Availability Statement
All data are available in the main text or the supplementary materials


