

Abstract
Despite decades of investigation, we cannot predict, prevent, or adequately treat the most common and deadly complications of pregnancy, including pre-eclampsia (pregnancy-induced hypertension). The current working hypothesis for the repeated failures of several multicenter studies that measured a wide variety of biomarkers is common pregnancy complications like pre-eclampsia are most likely heterogeneous syndromes with various etiologies; therefore, no combination of blood-based biomarkers will provide predictive power. Although the clinical syndrome of pre-eclampsia may have various causes, the current dogma is most cases share similar placental pathology, including accelerated chorionic villous maturation and an increased frequency of malperfusion-related infarctions. This pathology is thought to begin in the late first trimester of pregnancy. The challenge has been to develop an approach to monitor placental health in vivo. New contrast-enhanced imaging studies of blood flow to the placenta are providing insights, but rapid liquid-based assays using maternal blood would be more cost-effective. Recently, there has been a growing interest in placental extracellular vesicles (EVs) to determine if these complex lipid-based spheres involved in intercellular communication offer clues to the early pathophysiology of placental damage. Most EVs are nanoscale-sized exosomes (~60–120 nm) that retain cell-specific plasma membrane surface markers. Their concentration, composition, and relative size distribution may provide clinical predictive power, but more investigation is needed. A major obstacle to advancement in this field has been the lack of EV imaging and isolation assays that can provide both cell- and size-specificity. Nanoscale multiplex high-resolution flow cytometry being developed in a number of laboratories may provide a solution. It is a potential means to quantitate both cell- and size-specific EVs from various cell sources, including the placenta.
INTRODUCTION
Pregnancy-induced hypertension, which is also known as pre-eclampsia, or “toxemia” usually presents clinically after 20 weeks of gestation in previously normotensive women and resolves after delivery.1 It is a common multifactorial disorder that is the leading cause of pregnancy-related intensive care unit admissions, and it is responsible for 75,000 maternal deaths world-wide each year.2 Despite decades of investigation, we cannot predict or prevent this serious pregnancy complication. There have been several multicenter studies that measured a range of biomarkers, but these studies failed to provide sufficient predictive value for clinical utility.3–7 This failure has led to the hypothesis that pre-eclampsia may be too heterogeneous for a candidate biomarker approach to work.3 The speculation has been reinforced by transcriptomic analysis of women who were diagnosed with pre-eclampsia showing multiple potential “preeclampsia” phenotypes.8 These various phenotypes do not necessarily imply causality, but they do support a variety of affected pathways (eg, endothelial cell activation, immune system dysregulation, placental malperfusion, and placental damage) that may be associated with the clinical presentation of pre-eclampsia. What is needed is an approach to study the early pathophysiology of pre-eclampsia phenotypes in vivo.
In turn, many laboratories are now working to develop new approaches for early pregnancy screening in an attempt to better identify women at risk for pre-eclampsia. For example, our group has pioneered new contrast-enhanced imaging modalities to measure blood flow to the placenta and test for variance that may be an underlying cause of later pregnancy complications.9–11 These studies are providing new insights into the early pathophysiology of placental damage and they may provide a specific diagnostic test for placental malperfusion in the future, but a more efficient approach is needed for routine pregnancy screening. Blood-based assays should be the answer, but a new perspective is required.
For example, measuring blood levels of placental growth factor relative to soluble fms-like tyrosine kinase 1 is currently the best approach to provide negative predictive value (no pre-eclampsia in the subsequent weeks), but this ratio does not have sufficient positive predictive value to better understand the early pathophysiology of the disease process or to identify women for high-risk monitoring.12
For a new perspective, consider the potential utility of cell- and size-specific extracellular vesicles (EVs). EVs are lipid spheres with plasma membrane elements reflecting the cell of origin (eg, placental alkaline phosphatase [PLAP] on the surface of placental villous syncytiotrophoblasts). Most EVs are smaller than 200 nm and are generally considered to be exosomes that arise from multivesicular bodies in the cytoplasm released in response to stimuli (for an extensive review of definitions and methodological guidelines, see Coumans et al.13 EVs in the ~150 nm−1 um range are currently called microvesicles (a.k.a. microparticles, or nanoparticles), which bud directly from the plasma membrane, or they are released secondary to cell damage. EVs larger than 1 um are often apoptotic or necrotic debris.13
EVs are released into body fluids by a wide variety of cell types, including platelets, endothelial cells, red blood cells, cancer cells14 and by the placenta.15 Depending on their size, EVs contain microRNA, mRNA, cytoplasmic proteins, and fragments of DNA.16,17 Cell-specific EVs seem to be abundant in human blood (105–108/mL [actual numbers are not entirely clear because of method limitations; Table I]) and seem to play a role in cell-to-cell communication.18 Targeting of EVs for biologic function likely relies on ligands and receptors on their outer surface. The cell source of the EVs may be deduced because their outer surface is composed of plasma membrane surface elements (Fig 1). Addition or subtraction from this composition to customize EVs for their destination is the subject of intense research, but the field has been handicapped because of the lack of nanoscale “negative” controls that may be simultaneous isolated from the same fluid samples and exclude co-isolated contaminants (technical “hitchhikers”).
Table I.
Comparison of extracellular vesicle isolation and quantitation methods
| Method | Description | Strength | Weakness | Cell- and size-specificity |
|---|---|---|---|---|
| Differential centrifugation | Step-wise centrifugation of supernatant from 1500 × gravity to 100,000 × gravity | Commonly employed | Poor EV recovery and laborious | Poor cell- and size-specificity |
| Density gradient centrifugation | lodizanol or sucrose gradients to separate EVs by mass and density | Better size-specificity | Lipoprotein contamination | Poor cell-specificity |
| Affinity capture | Monoclonal antibody conjugated to extraction surface (eg, beads or chip) | Better cell-specificity | No size-specificity | Good if combined with centrifugation |
| Nano-scale high-resolution flow cytometry | Fluorescence-based antibody labeling coupled with light scatter for sizing and polystyrene bead standardized controls | Rapid assay for cell- and size-specificity | New approach requiring more validation | Potentially excellent if validated |
Blood contains extracellular vesicles (EVs) from a wide variety of cell types and in a variety of sizes. In our experience, the primary advantage of imaging and flow sorting EVs by flow cytometry is cell-specificity based on multiplex antibody labeling, which is more accurate than single antibody affinity capture; and, size-specificity relative to polystyrene beads (100 nm-900 nm). Flow cytometry also provides accurate quantitation (counts/mL) of these cell-and size-specific targets in the starting material (eg, plasma, culture media), because counts may be compared with spiked-in known quantities of polystyrene 200 nm beads (Fig 4).
Fig 1.
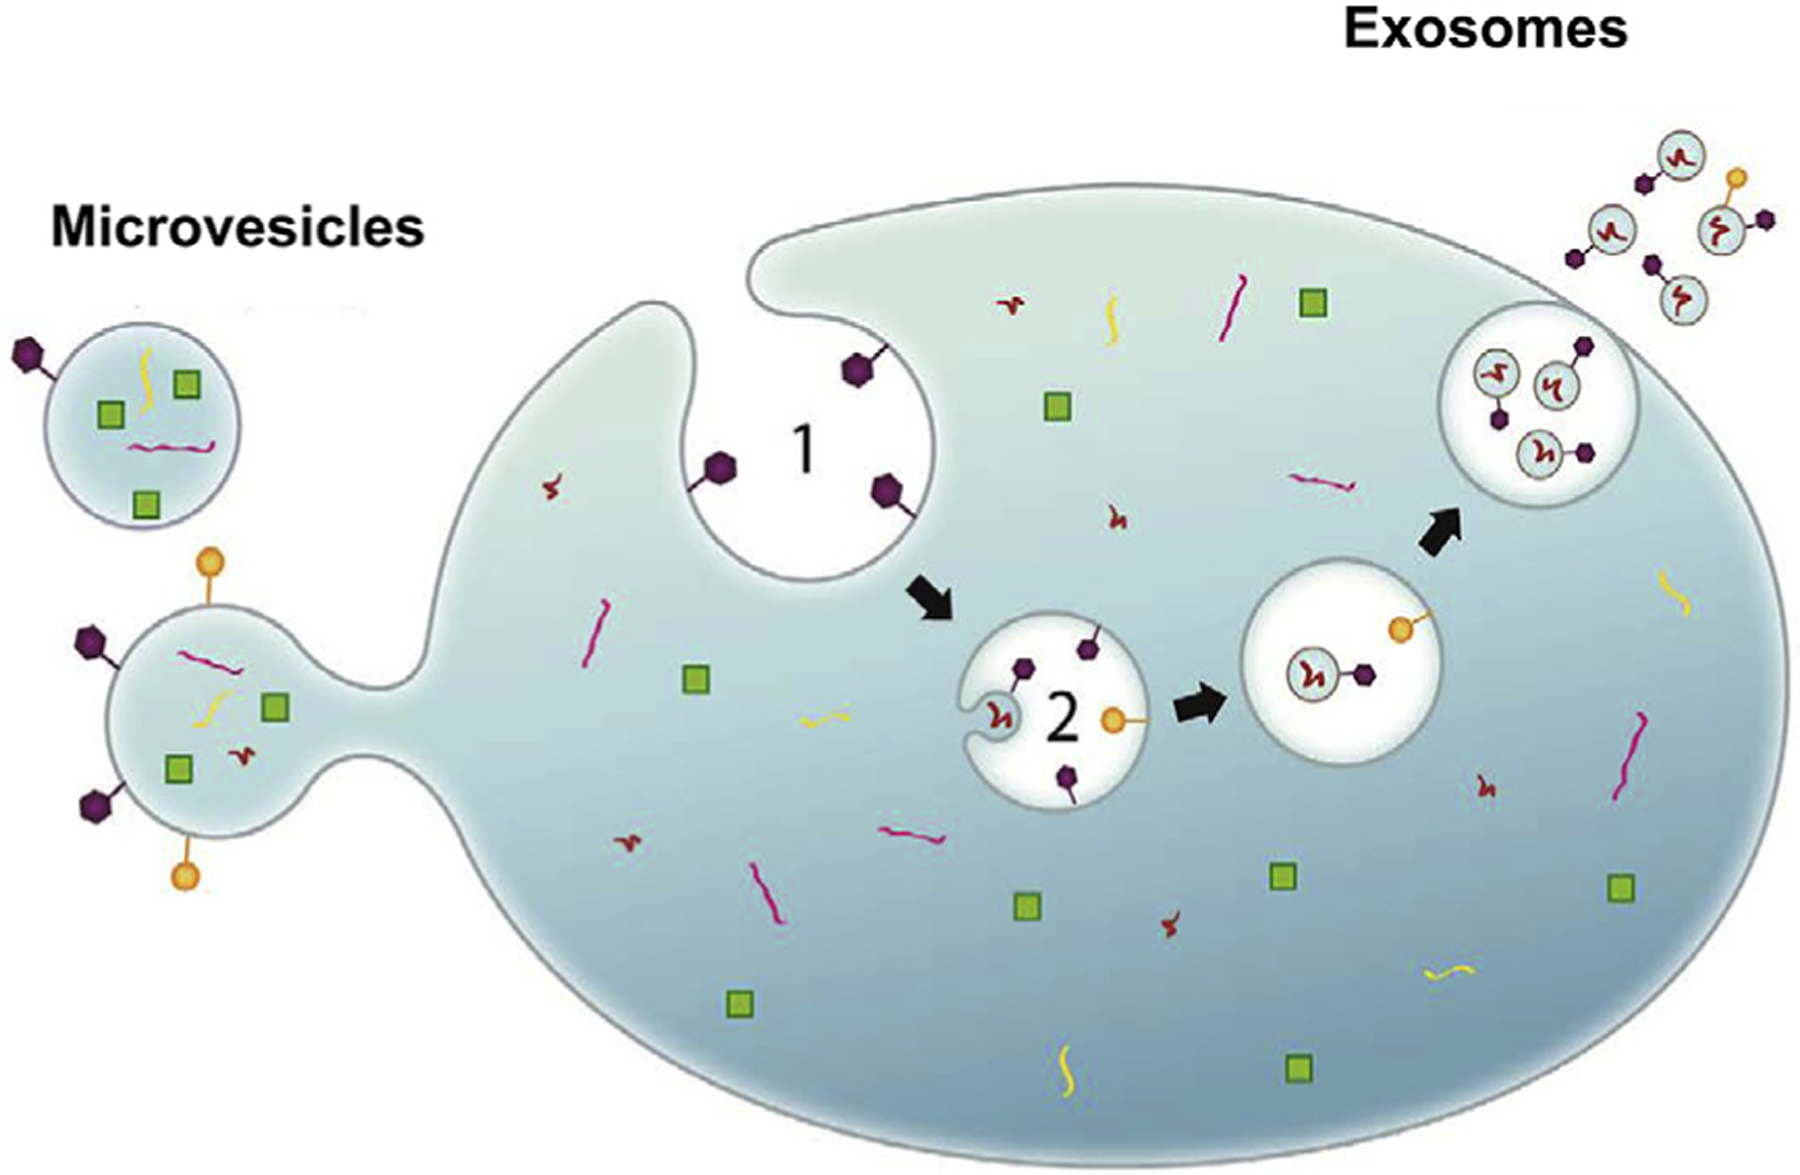
Cells release extracellular vesicles (EVs) with cell-specific surface antigens that may be employed to label, image, and isolate, cell-specific EVs by various methods.
Greater precision in EV surface (and content) characterization is needed to better understand their biologic activity.16,17 The International Society for Extracellular Vesicles recognizes the field requires new methods to more precisely isolate cell- and size-specific EVs for –omics research.16 This is not only important for a more accurate description of EV content and surface markers, but it will be a significant step toward understanding biologic signaling and function. This is not only a problem of cell-specific EV isolation for study (remedied by cell culture analysis), but it is also a problem of EV size precision for content analysis. The relationship between EV size and function is the subject of intense investigation and is only beginning to be understood.17 Exosomes made in cell culture appear to be made in various sizes (60–80vs nm 90–120 nm) with distinct proteomic profiles that may affect biologic activity. In our experience, commonly employed EV isolation methods like differential ultracentrifugation and density gradient centrifugation cannot provide this level of segregation for analysis (Table I). Moreover, commonly employed “sizing” methods are inadequate, including nanoparticle tracking analysis (NanoSight) and transmission electron microscopy.13
The placenta releases EVs into the maternal blood stream early in pregnancy. Exosomes have been detected at 6 weeks gestation (term is 40 weeks)15 and differences in placental EV counts per milliliter of blood have been associated with pre-eclampsia19–27. Early placental EV studies tested for the presence of apoptotic bodies and placental microvilli released by damaged placentas.19–21 Later, differences in placental microvesicles and exosomes were inferred by counting totals/mL of blood and measuring fractional placental protein biomarkers (eg. PLAP).22–27 Women who later developed pre-eclampsia seemed to have more total exosomes and more PLAP/mL of blood.27 Although intriguing, this type of analysis is an inference. Total exosome differences may be related to other cell types. Total PLAP levels/mL may be related to free protein aggregates or placental cell fragments isolated coincidentally with the “exosome” fraction. This is a well-known limitation of density gradient centrifugation EV assays.13 Instead, it would be more accurate to characterize the number and size of individual placental-specific EVs.
HIGH-RESOLUTION FLOW CYTOMETRY RESOLVES CELL- AND SIZE-SPECIFIC EVS
Differential centrifugation and density gradient extraction are useful, but suboptimal because they cannot purify both cell- and size-specific EVs from the total EV mixture.13 Conventional flow cytometry methods used to phenotype placental cells have also been tried for EVs,23,24 but submicron resolution of these particles and reproducible standardization of results is a major obstacle.28 Multicenter working groups have now proposed standardized collection and plasma processing methods to make “nanoscale flow cytometry,” or high-resolution flow cytometry (HRFC), reproducible between laboratories.13,28–31 Moreover, multicolor flow cytometry provides an approach to test for differences in placental EV production, as well as EV-related tetraspanins (CD9, CD63, and CD81) and internal maternal platelet (CD41) EV controls.
This type of analysis was pioneered for placental EV analysis by the Oxford group.23,24 With the benefit of recent technological advances,28–31 we have employed nanoscale HRFC to test first trimester human blood samples (unpublished data) with surprisingly good cell- and size-specific resolution relative to nanoparticle tracking analysis (NanoSight) and cryogenic electron microscopy (more accurate biologic dimensions than imaging desiccated EVs dried onto grids). The premise is based on the combination of light scatter used to provide a size estimate and fluorescently labeled antibody targeting of cell-specific EVs. FITC-labeled polystyrene beads are commercially available (Megamix, Biocytex; available in USA from Stago) to provide standardized machine settings and demonstrate machine resolution. Cell-based flow cytometry (eg, lymphocytes) usually relies on forward light scatter, which is a function of both cell size and internal complexity reflected in the refractive index of the cell. Although forward scatter and refractive index work well for characterizing cells, it does not work as well as side scatter (SSC) when visualizing EVs. This is because the diameter of most EVs, including exosomes, is smaller than the wavelength of light (Fig 2, A). In contrast, the SSC is a more sensitive detector of sub-500 nm sized EVs because it is exponentially related to the diameter of the particle. When employing both SSC on the y-axis and fluorescence on the x-axis, FITC-conjugated polystyrene bead controls may be resolved at 40 nm intervals (Fig 2, B). Notably, larger beads have greater surface area and are labeled with more FITC which creates a step-like pattern from left to right along the x-axis from 100 nm to 900 nm. In addition, unlike NanoSight which is confounded by nonlabeled background nanoscale “noise,” HRFC might provide more accurate counts/mL of cell- and size-specific targets.
Fig 2.
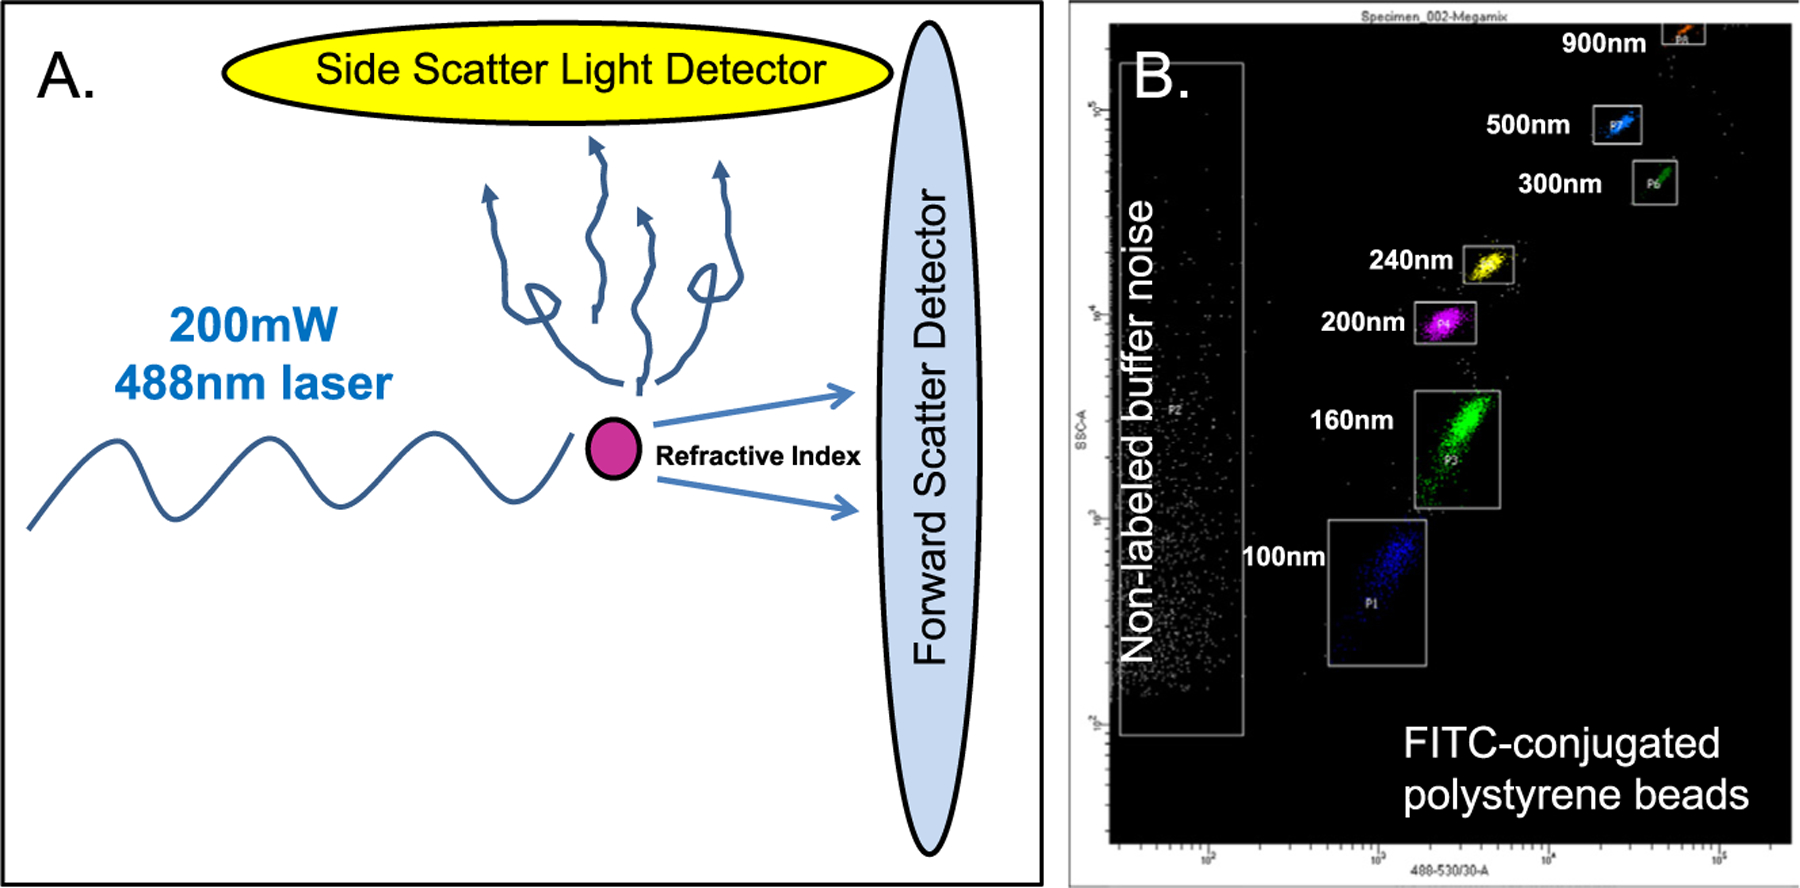
High-resolution flow cytometry takes advantage of light scatter from nanoscale particles, including EVs, or commercially available polystyrene beads. Moreover, the strength of this approach is it couples light scatter with target fluorescence (FITC in this case) that separates targets from the unlabeled nanoscale noise.
Perhaps the greatest power provided by HRFC is its ability to flow sort any imaged EVs within targeted gates (Fig 3). For example, commercially available FITC-labeled polystyrene beads ranging from 100 nm to 900 nm in size may be readily resolved by HRFC using various machines (BD Biosciences FacsAria Fusion in this case; similar resolution has been reported with an Astrios EQ by Beckman Coulter31) with light SSC on the y-axis and fluorescent intensity on the x-axis. Imaged nanoscale targets are gated (boxed around populations in Fig 3) such that the flow cytometer will electrically charge any nanoliter droplet containing a target within the specified gate. The charged particle is then diverted from the main stream into a sorting vial dependent on its charge. If the sample is appropriately diluted (~1:100 platelet poor plasma into 0.1 um filtered phosphate-buffered saline buffer) before HRFC, very high sorting efficiencies may be achieved. If it is not appropriately diluted, numerous particles per nanoliter droplet “swarm” the detectors creating nanoliter droplets with multiples particles and/or droplet and sorting efficiency is low. The example in Fig 3 reveals 50-nm resolution with >99% sorting efficiency of FITC-labeled polystyrene beads.
Fig 3.
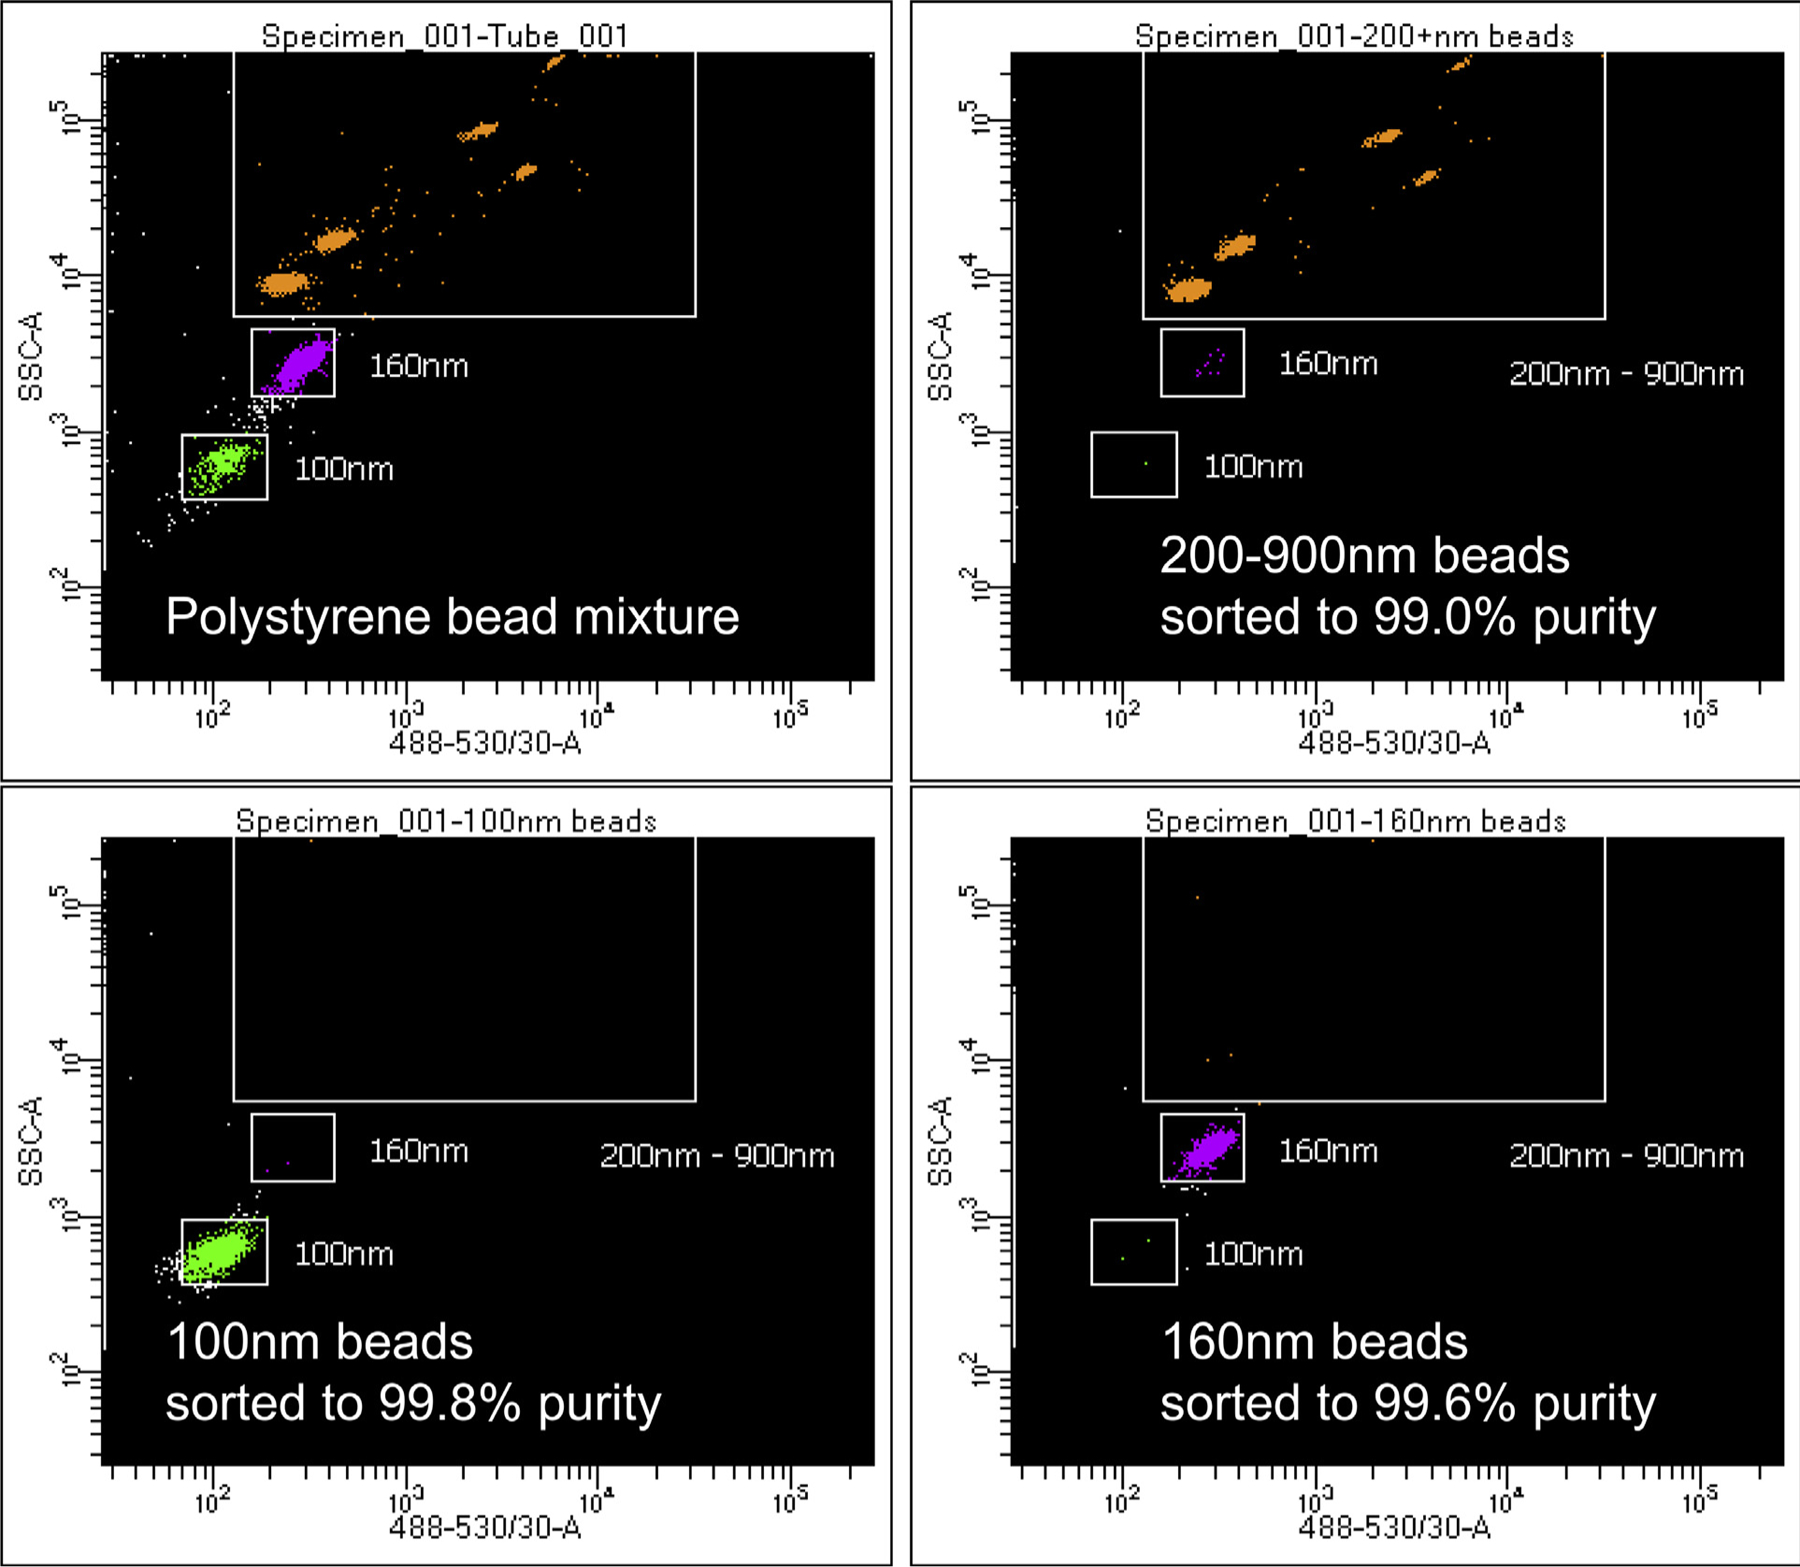
High-resolution flow cytometry provides a method to visualize and reliably sort nanoscale particles at 40 nm resolution represented in this 3-way sort of 100 nm, 160 nm, and >200 nm polystyrene beads.
Reproducibility depends on standardized blood collections, processing, banking, antibody labeling, dilutions for HRFC, and the use of uniform bead standards for machine set up and sample dilution buffer. We also employ plasma EV standards such as CD41+ platelet EVs and CD9+, CD63, CD81+ tetraspanins co-expressed on EVs that are present in all blood samples as internal positive controls (Fig 4). Nonpregnant male or female plasma serves as negative plasma controls. Antibody aggregates are controlled for by using stained phosphate-buffered saline, or DMSO pretreatment of plasma samples to digest EVs before antibody staining. In our hands, this approach has proven to be reproducible using archived platelet poor plasma aliquots tested 6 months apart on the same HRFC machine and on separate machines within and between institutions. The example in Fig 4 illustrates the use of sorted 200 nm bead buffer employed as a dilution buffer for all of the plasma samples tested in an experimental batch. The bead provides an internal size standard and a measurement volume standard (eg, on our machine 5000 beads equal 25 uL of diluted plasma sample tested). Multiplex HRFC enables testing of individual EVs for co-expression of surface markers like CD41 and CD9 shown in this example. The same plasma is also stained for PLAP (lower left panel, which also shows up in top left CD41 panel not gated for APC). Additional placental surface markers like HLA-G, HLA-C (invasive extravillous trophoblasts), CD56 (uterine arterial trophoblastic plug cells), PLAC-1 (floating villous cytotrophoblasts), may also be assayed to measure placental cell subpopulation specific EV populations (data not shown). Sorting the PLAP+ population, which appears to be predominantly 50–150 nm in size relative to Megamix (Fig 2—all experiments are set to this SSC scale relative to Megamix), yields significant PLAP+ EV enrichment relative to unstained “noise” from the plasma sample. The sorted population is 85–135 nm in size per nanoparticle tracking analysis and predominantly 75 nm in size by cryoEM (data not shown).
Fig 4.
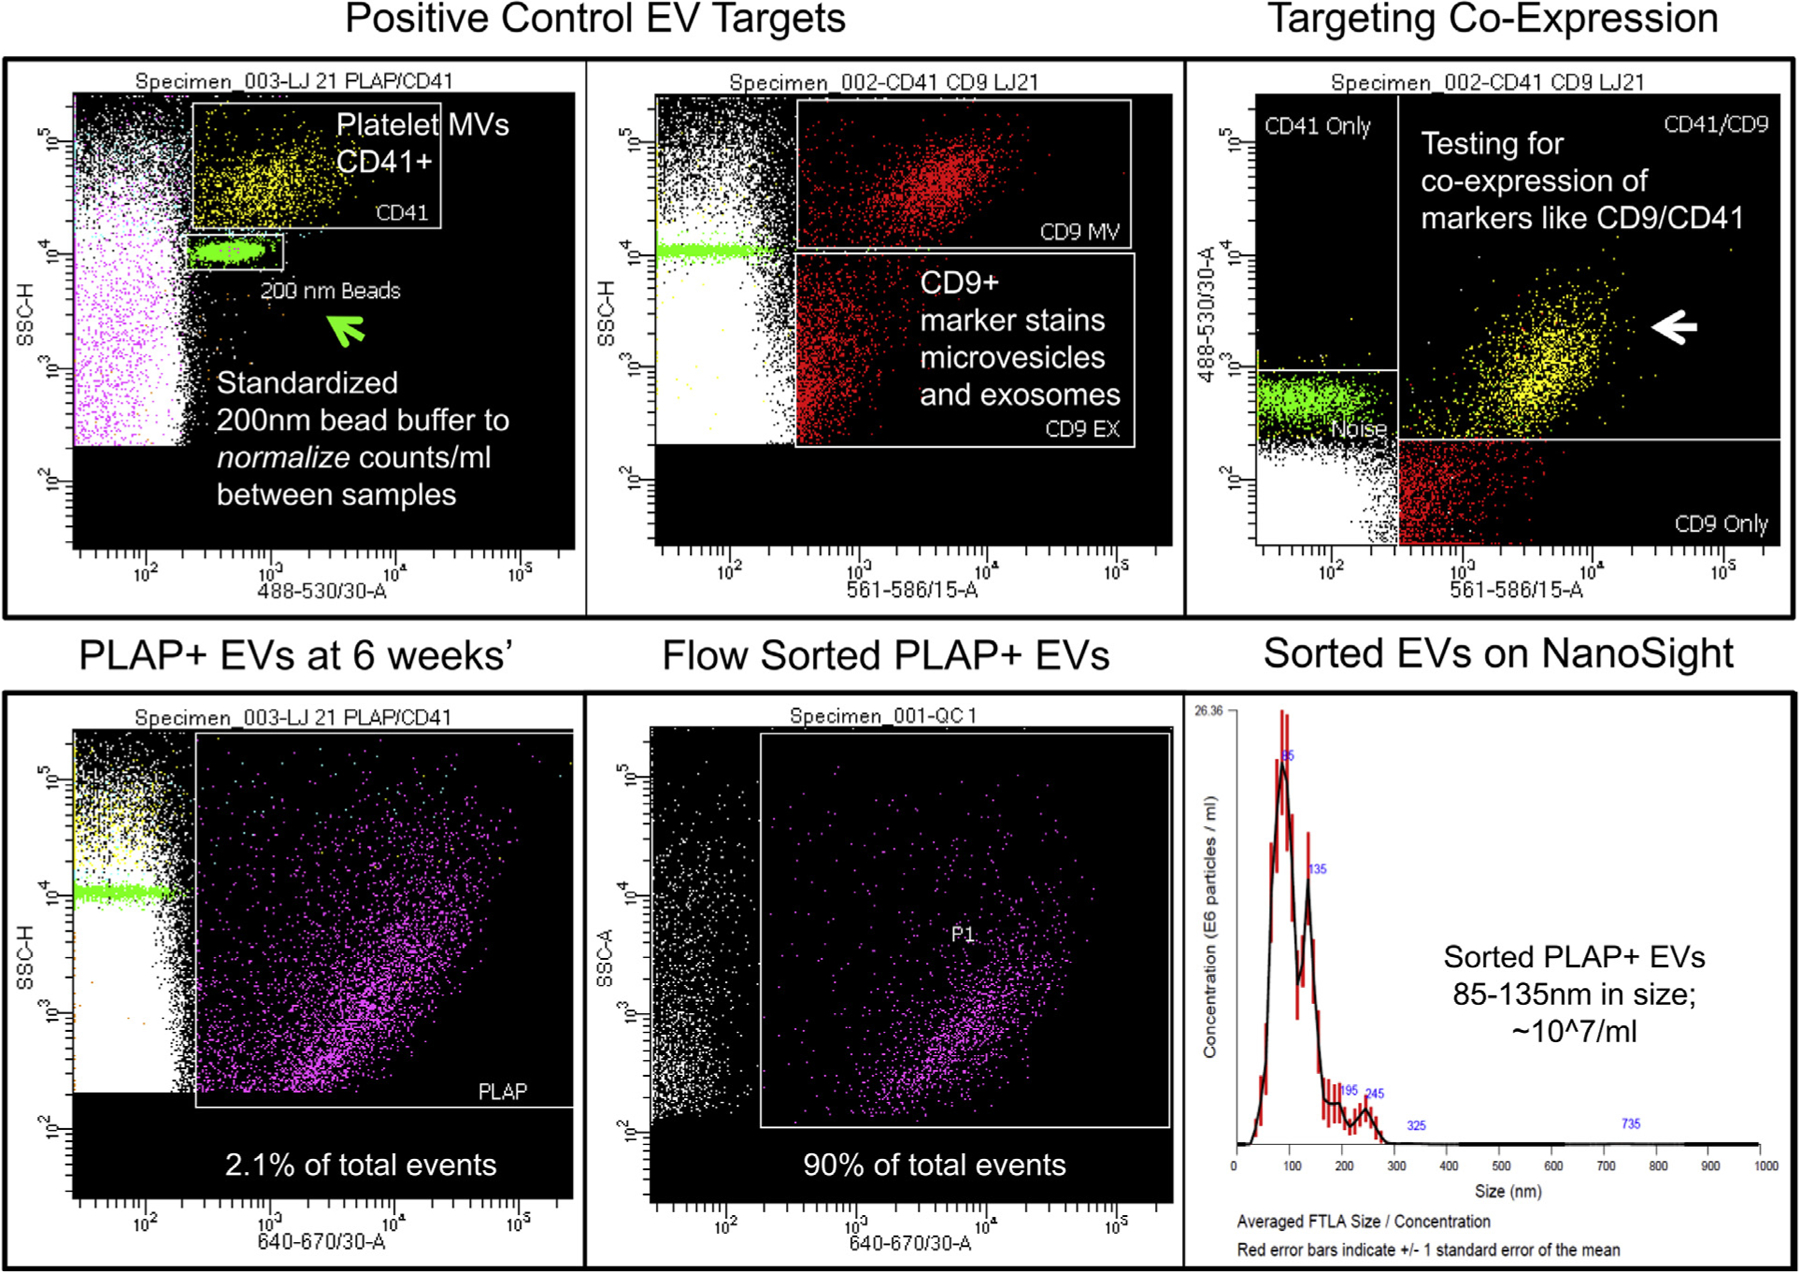
Multiplex high-resolution flow cytometry of pregnant human plasma at 6 weeks’ gestation using sorted 200 nm bead buffer to dilute plasma samples. Standardized bead buffer provides a denominator to control the volume of plasma tested between samples and between machines for independent replication studies. Platelet CD41 positive extracellular vesicles (EVs) and targeted tetraspanins like CD9 provide internal positive controls in plasma. Flow cytometry provides an approach to test for co-labeling of an EV by multiplex analysis. Moreover, flow sorting provides a means to isolate labeled EVs (PLAP+ from the placenta in this case) for validation studies.
HRFC VERSUS CONVENTIONAL APPROACHES TO COUNT AND ISOLATE EVS
To date, the major obstacle to counting and isolating placental EVs from maternal blood has been the limitations inherent to ultracentrifugation.25,26 Step-wise differential ultracentrifugation provides an abundant source of EVs, but the product is a compiled mixture of EVs from various cell sources, EV sizes, and contamination from protein aggregates, lipoproteins, and cellular debris. Affinity capture of cell-specific targets from this mixture enriches the population of interest, but does not discriminate by EV size. Size matters because exosomes are different than microvesicles. Density gradient ultracentrifugation provides more size-specific fractions than th starting ultracentrifugation pellet (eg, exosomes are enriched in the 1.12–1.19 g/mL fraction in sucrose gradients), but this approach requires days of preparation, exposes the EVs to high levels of shear stress during centrifugation, and our analysis of various “exosome” fractions illustrates the poor signal:noise target ratio and contamination with larger microvesicles (Fig 5). Contamination includes placental microvilli, which may confound PLAP protein analysis used to infer relative PLAP+ contributions to the fraction.26 In this representative experiment, we tested maternal plasma from a woman at 12 weeks gestation and used an antibody against human PLAP conjugated to an APC fluorophore (eBiosciences [note that although the eBiosciences clone works well for flow cytometry it does not work well in immunostaining paraffin-embedded histologic sections or in Western blot analysis. Our more recent work suggests Abcam clone number 212383 has superior characteristics staining both EVs and providing validation by immunostaining and Western blot analysis]). HRFC highlights the lack of cell- and size-specificity obtained using differential centrifugation followed by density gradient centrifugation and fractionation. Ninety-nine percent of the nanoscale mixture is smaller than 200 nm (green bar at SSC-H 104—our standard setting for 200 nm sorted from Megamix bead size controls). Ninety-nine percent of the mixture is not PLAP positive placental exosomes. A significant population is larger than 200 nm, which flow sorting reveals to be microvilli fragments with cytoplasmic actin filaments likely shed by the placenta into maternal blood as maternal arterial jets impact the placenta late in the first trimester.10 HRFC can discriminate and isolate these various populations for validation studies, including electron microscopy (cryoEM shown here), protein assays (eg, PLAP Western blotting), and –omics. These distinctions based solely on size are not entirely specific, however. Microvesicles budding from the cell surface may be smaller than 200 nm and appear in the exosome size range. An advantage of HRFC is the ability to multiplex multiple surface markers like PLAP and CD63, which we think may better distinguish exosomes (CD63 positive) from PLAP positive microvesicles (negative for CD63 in our experience). This is important because the content and biologic activity of exosomes vs similar sized microvesicles is likely to be different (eg, microvesicles may contain intact mRNA and cytoplasmic proteins). Moreover, no single antibody marker will be entirely specific for a cell of origin. For example, low levels of PLAP may be seen in smokers, breast cancer, small cell carcinoma of the lung, and normal nonpregnant females.32 It is not yet clear whether these low level PLAP values identified in plasma are present on EVs, but in our experience testing males and nonpregnant females, we observe PLAP+ EVs in the 105/mL range in some people. Multiplexing for multiple markers like PLAP, C63, HLA-C, HLA-G, pregnancy-specific glycoprotein, and others improves specificity and eliminates false positive PLAP signal in negative controls.
Fig 5.

High-resolution flow cytometry can more precisely sort EVs from cell- and size-specific populations than density gradient ultracentrifugation. In this example, exosome fractions (1.12–1.19 g/mL) from a standard density gradient ultracentrifugation preparation A were analyzed. Most of the <200 nm events were not cell-specific and the fraction also contained larger >200 nm populations B, which were sorted and validated by cryo-based electron microscopy that provided excellent imaging and size confirmation. The larger microvesicles contained actin filaments C consistent with cytoplasmic blebbing or shearing of placental microvilli that cover the surface of floating placental villi. D, In contrast, sorted extracellular vesicles (EVs) smaller than 200 nm showed characteristic exosome morphology at about 100 nm in size. Scale bar is 200 nm.
In conclusion, cell- and size-specific EV imaging, quantitation, and isolation are possible. Ongoing work by our laboratory and others is validating new approaches like HRFC with the hope that EV-related diagnostics may find a way to identify women at risk for pre-eclampsia and provide new targetes for preventative interventions.
ACKNOWLEDGMENTS
The author has read the journal’s policy on disclosure of potential conflicts of interest and there is no financial or personal relationship with organizations (including BD Biosciences cited in this review) that could potentially be perceived as unduly influential. The author has read the journal authorship agreement. The review was funded in part by the Human Placental Project (NICHD HD-16–037), and Oregon Health & Science University Knight Cancer Institute and the Cancer Early Detection Advanced Research Center (CEDAR). Drs. Antonio Frias, Philip Streeter, and Kevin Judge, played key roles in the development of HRFC and the Frias group assisted with the creation of Figure 1 for this manuscript.
Abbreviations:
- EV
extracellular vesicles
- HRFC
high-resolution flow cytometry
- PLAP
placental alkaline phosphatase
- SSC
side scatter
REFERENCES
- 1.Vitoratos N, Vrachnis N, Iavazzo C, Kyrgiou M. Preeclampsia: molecular mechanisms, predisposition, and treatment. J Pregnancy 2012:ID:145487. [DOI] [PMC free article] [PubMed] [Google Scholar]
- 2.Lo J, Mission J, Caughey A. Hypertensive disease of pregnancy and maternal mortality. Curr Opin Obstet Gynecol 2013;25: 124–32. [DOI] [PubMed] [Google Scholar]
- 3.Roberts JM, Myatt L, Spong CY, et al. Vitamins C and E to prevent complications of pregnancy- associated hypertension. N Engl J Med 2010;362:1282–91. [DOI] [PMC free article] [PubMed] [Google Scholar]
- 4.Myatt L, Clifton RG, Roberts JM, et al. First-Trimester Prediction of Preeclampsia in Nulliparous Women at Low Risk. Obstet Gynecol 2012;119:1234–42. [DOI] [PMC free article] [PubMed] [Google Scholar]
- 5.Myatt L, Miodovnik M. Prediction of preeclampsia. Semin Perinatol 1999;23:45–57. [DOI] [PubMed] [Google Scholar]
- 6.Myatt L, Clifton RG, Roberts JM, et al. Can changes in angiogenic biomarkers between the first and second trimesters of pregnancy predict development of pre-eclampsia in a low-risk nulliparous patient population. BJOG 2013;120:1183–91. [DOI] [PMC free article] [PubMed] [Google Scholar]
- 7.Kenny LC, Black MA, Poston L, et al. Early pregnancy prediction of preeclampsia in nulliparous women, combining clinical risk and biomarkers: the Screening for Pregnancy Endpoints (SCOPE) international cohort study. Hypertension 2014;64: 644–52. [DOI] [PubMed] [Google Scholar]
- 8.Leavey K, Bainbridge SA, Cox BJ. Large scale aggregate microarray analysis reveals three distinct molecular subclasses of human preeclampsia. PLoS One 2015;10:e0116508. [DOI] [PMC free article] [PubMed] [Google Scholar]
- 9.Lo J, Roberts V, Schabel M, et al. Novel detection of placental insufficiency by MRI in the non-human primate. Reprod. Sci 2018;25:64–73. [DOI] [PMC free article] [PubMed] [Google Scholar]
- 10.Roberts V, Morgan T, Bednarek P, et al. Early first trimester uteroplacental blood flow and the progressive disintegration of spiral artery plugs: New insights from contrast-enhanced ultrasound and tissue histopathology. Hum Reprod 2017;32:2382–93. [DOI] [PMC free article] [PubMed] [Google Scholar]
- 11.Roberts V, Lo J, Salati J, et al. Quantitative assessment of placental perfusion by contrast-enhanced ultrasound in macaques and human subjects. Am J Obstet Gynecol 2016;214:369, e1–8. [DOI] [PMC free article] [PubMed] [Google Scholar]
- 12.Zeisler H, Llurba E, Chantraine F, et al. Predictive value of the sFLT-1:PlGF ratio in women with suspected preeclampsia. NEJM 2016;374:13–22. [DOI] [PubMed] [Google Scholar]
- 13.Coumans F, Brisson A, Buzas E, et al. Methodological guidelines to study extracellular vesicles. Circ Res 2017;120:1632–48. [DOI] [PubMed] [Google Scholar]
- 14.Raposo G, Stoorvogel W. Extracellular vesicles: exosomes, microvesicles, and friends. J Cell Biol 2013;200:373–83. [DOI] [PMC free article] [PubMed] [Google Scholar]
- 15.Sarker S, Scholz-Romero K, Perez A, et al. Placenta-derived exosomes continuously increase in maternal circulation over the first trimester of pregnancy. J Trans Med 2014;12:1–19. [DOI] [PMC free article] [PubMed] [Google Scholar]
- 16.Mateescu B, Kowal E, van Balkom B, et al. Obstacles and opportunities in the functional analysis of extracellular vesicle RNA—an ISEV position paper. J Extracell Ves 2017;6:1286095. [DOI] [PMC free article] [PubMed] [Google Scholar]
- 17.Zhang H, Freitas D, Kim H, et al. Identification of distinct nanoparticles and subsets of extracellular vesicles by asymmetric flow field-flow fractionation. Nat Cell Biol 2018;20:332–43. [DOI] [PMC free article] [PubMed] [Google Scholar]
- 18.Tkach M, Thery C. Communication by extracellular vesicles: where we are and where we need to go. Cell 2016;164:1226–32. [DOI] [PubMed] [Google Scholar]
- 19.Knight M, Redman CW, Linton EA, Sargent IL. Shedding of syncytiotrophoblast microvilli into the maternal circulation in preeclamptic pregnancies. Br J Obstet Gynaecol 1998;105: 632–40. [DOI] [PubMed] [Google Scholar]
- 20.Orozco A, Jorgez C, Ramos-Perez W, et al. Placental release of distinct DNA-associated micro- particles into maternal circulation: Reflective of gestation time and preeclampsia. Placenta 2009;30:891–7. [DOI] [PMC free article] [PubMed] [Google Scholar]
- 21.Rajakumar A, Cerdeira A, Rana S, et al. Transcriptionally active syncytial aggregates in the maternal circulation may contribute to circulating soluble fms-like tyrosine kinase 1 in preeclampsia. Hypertension 2012;59:256–64. [DOI] [PMC free article] [PubMed] [Google Scholar]
- 22.Germain SJ, Sacks GP, Sooranna SR, Sargent IL, Redman CW. Systemic inflammatory priming in normal pregnancy and pre-eclampsia: the role of circulating syncytiotrophoblast microparticles. J Immunol 2007;178:5949–56. [DOI] [PubMed] [Google Scholar]
- 23.Lok C, Van Der Post J, Sargent I, et al. Changes in microparticle numbers and cellular origin during pregnancy and preeclampsia. Hypertens Pregnancy 2008;27:344–60. [DOI] [PubMed] [Google Scholar]
- 24.Lok C, Boing A, Sargent I, et al. Circulating platelet-derived and placenta-derived microparticles expose flt-1 in preeclampsia. Reprod Sci 2008;15:1002–10. [DOI] [PubMed] [Google Scholar]
- 25.Mitchell M, Peiris H, Kobayashi M, et al. Placental exosomes in normal and complicated pregnancy. Am J Obstet Gynecol 2015; October:S173–81. [DOI] [PubMed] [Google Scholar]
- 26.Salomon C, Guanzon D, Scholz-Romero K, et al. Placental exosomes as early biomarker of preeclampsia: Potential role of exosomal micro-RNAs across gestation. J Clin Endocrinol Metab 2017;102:3182–94. [DOI] [PubMed] [Google Scholar]
- 27.Dragovic R, Southcombe J, Tannetta D, et al. Multicolor flow cytometry and nanoparticle tracking analysis of extracellular vesicles in the plasma of normal pregnant and preeclamptic women. Biol Reprod 2013;89:151, 1–12. [DOI] [PubMed] [Google Scholar]
- 28.Cointe S, Judicone C, Robert S, et al. Standardization of microparticle enumeration across different flow cytometry platforms: results of a multicenter collaborative workshop. J Thromb Haemost 2016;14:1–7. [DOI] [PMC free article] [PubMed] [Google Scholar]
- 29.Van der Vlist E, Nolte-t’ Hoen E, Stoorvogel W, et al. Fluorescent labeling of nanoscale vesicles released by cells and subsequent quantitative and qualitative analysis by high-resolution flow cytometry. Nat Protoc 2012;7:1311–26. [DOI] [PubMed] [Google Scholar]
- 30.Kormelink T, Arkestijn G, Nauwelaers F, et al. Prerequisites for the analysis and sorting of extracellular vesicle subpopulations by high-resolution flow cytometry. Cytometry 2016;89:135–47. [DOI] [PubMed] [Google Scholar]
- 31.Morales-Kastresana A, Telford B, Musich T, et al. Labeling extracellular vesicles for nanoscale flow cytometry. Sci Rep 2017;7:1878. [DOI] [PMC free article] [PubMed] [Google Scholar]
- 32.Muensch H, Maslow W, Azama F, et al. Placental-like alkaline phosphatase: Re-evaluation of the tumor marker with exclusion of smokers. Cancer 1986;58:1689–94. [DOI] [PubMed] [Google Scholar]