

Abstract
Background
Calcitonin gene-related peptide plasma levels have frequently been determined as a biomarker for primary headaches. However, published data is often inconsistent resulting from different methods that are not precisely described in most studies.
Methods
We applied a well-proven enzyme-linked immunosorbent assay to measure calcitonin gene-related peptide concentrations in human blood plasma, we modified parameters of plasma preparation and protein purification and used calcitonin gene-related peptide-free plasma for standard solutions, which are described in detail.
Results
Calcitonin gene-related peptide levels are stable in plasma with peptidase inhibitors and after deep-freezing. Calcitonin gene-related peptide standard solutions based on synthetic intercellular fluid or pooled plasma with pre-absorbed calcitonin gene-related peptide influenced the measurements but yielded both comprehensible results. In a sample of 56 healthy subjects the calcitonin gene-related peptide plasma levels varied considerably from low (<50 pg/mL) to very high (>500 pg/mL) values. After a 12-hour exposure of these subjects to normobaric hypoxia the individual calcitonin gene-related peptide levels remained stable.
Conclusion
Buffering with peptidase inhibitors and immediate freezing or processing of plasma samples is essential to achieve reliable measurements. Individuals show considerable differences and partly high calcitonin gene-related peptide plasma levels without detectable pathological reason. Thus plasma measurements are suited particularly to follow calcitonin gene-related peptide levels in longitudinal studies.
The use of data for this study was approved by the Ethics Committee of the Medical
University of Innsbruck (https://www.i-med.ac.at/ethikkommission/; EK Nr: 1242/2017).
Keywords: Calcitonin gene-related peptide, enzyme-linked immunosorbent assay, blood plasma, normobaric hypoxia
Introduction
The 37 amino acid calcitonin gene-related peptide (CGRP) with its two subtypes, α- and β-CGRP, is mainly expressed in neurons of the central and peripheral nervous system (1) but has also been suggested to occur in non-neuronal cells like lymphocytes, mononuclear cells, adipocytes as well as endothelial and epithelial cells (2). Apart from motor endplates (3), CGRP is present in a main fraction of primary afferent neurons, α-CGRP primarily in the somatosensory and the trigeminal system and β-CGRP in gastrointestinal afferents (1). In rodents, all CGRP producing afferents, the majority of which form C-fibres but a minor proportion also Aδ-fibres, have nociceptive functions and are usually co-expressing transient receptor potential (TRP) cation channels of the vanilloid 1 and ankyrin type (TRPV1 and TRPA1) (4–6). Upon activation of these nociceptors CGRP is released into the innervated tissues, where it contributes to neurogenic inflammatory responses, particularly arterial vasodilatation (1). Subsequently it is likely absorbed by postcapillary vessels and finally appears in the circulation (7), where it is regarded as a biomarker for disorders that typically come along with strong activation of nociceptive primary afferents and hence pain (8). However, to date only in migraine pain and cluster headache the concentration of CGRP in venous blood drained from the head has been associated with the severity of these diseases (9), although this is not without conflicting results, especially when the blood was taken from the cubital veins (10,11). One reason for this inconsistency may be that only a minor fraction of CGRP appears in blood samples taken from body veins, especially if these are far away from the sites of CGRP release. Because CGRP is degraded by peptidases in the blood plasma with a half-life of about 7–10 minutes (12), only a fraction of the original concentration will appear at the site of blood sampling like the cubital veins.
However, more relevant for the differing data on CGRP plasma concentrations in the literature may be the different performance of analysis methods, even if same techniques like enzyme-linked immunosorbent assays (ELISAs) are used. The handling of these assays is variable and has not been described precisely enough in most papers, so that it is hardly possible for other groups to repeat the respective measurements. Therefore, it is not astonishing that inconsistent data about the CGRP levels in human blood has been published, even in same disorders like migraine and other severe headache disorders, where increased CGRP levels have been found in the venous outflow from the head (13–16).
This problem has initiated the present experimental survey. We have used human blood plasma from volunteers including a previous study with hypoxic exposure (17) and explain step by step the procedures, imponderables and pitfalls of plasma CGRP measurements with an approved enzyme-linked immunosorbent assay (ELISA).
Methods
Participants
For the preparatory experiments some of the authors were involved in the study. For the applied experiments the participants consisted of a subset of healthy volunteers that participated in a previous prospective trial, in which headache occurrence during experimental hypoxia was studied (17). The present study conformed with the ethical standards of the Declaration of Helsinki from 2008, adhered to the principles and guidelines of the CONSORT statement (18) and was approved by the Ethics Committee of the Medical University of Innsbruck (EK Nr: 1242/2017). All participants gave their written informed consent to the procedures and the analysis of their blood samples.
In brief, the participants did not suffer from any cardiovascular, respiratory, neurological or psychiatric diseases including migraine or other forms of headaches. They did not smoke and had abstained from all anti-inflammatory medication, nutritional supplements or alcohol for two weeks prior to the experiments. All 56 volunteers (33/23 m/f) of this previous study providing blood for the present examination were exposed to normobaric hypoxia for 12 hours in a hypoxic chamber at Innsbruck simulating an altitude hypoxia of 4500 m with a partial pressure of inspired oxygen of 83.9 mmHg and constant temperature and humidity (17). During hypoxia exposure they were allowed to eat the same food and take non-alcoholic drinks as desired, and they could sit or move around slowly but did not sleep. Blood was taken twice, before entering the hypoxic chamber and after finishing the 12 hr exposure to normobaric hypoxia.
Blood collection and separation of plasma
Blood was taken from a cubital vein using EDTA-K tubes (S-Monovetten, Sarstedt, Nümbrecht, Germany) and centrifuged at 4°C for ca. 5 min with 3000 rpm/5000 g, if not stated otherwise. The plasma fraction was taken off with an Eppendorff pipette, transferred to cryovials (Nunc CryoTubes, Merck, Darmstadt, Germany), some of them were buffered (see below), and all were frozen in liquid nitrogen and stored at 80°C within 10–12 min after blood sampling.
Sample processing and principle of the CGRP enzyme-linked immunosorbent assay
The persons who analysed the plasma were blinded regarding the preceding experimental procedures and the allocation of plasma samples. Frozen plasma samples were defrosted at room temperature and gently mixed by tilting. From each tube 100 µL were taken with an Eppendorff pipette for processing with the enzyme-linked immunosorbent assay (ELISA) for human CGRP (CGRP Enzyme Immunoassay #A05481, shortly also named CGRP EIA, Bertin Bioreagent, Montigny-le-Bretonneux, France). The ELISA is based on a double-antibody sandwich technique and has 100% cross-reactivity for human α- and β-CGRP but < 0.01% cross-reactivity for amylin, calcitonin and substance P according to the manufacturer’s information. The wells of a 96 well plate are coated with mouse monoclonal antibodies capturing the N-terminal (6–7 amino acids) of CGRP molecules (Figure 1). The CGRP tracer contains monoclonal antibodies that bind the C-terminal (6–7 amino acids) of CGRP molecules. They are conjugated with acetylcholine esterase (AchE), which converts Ellman’s reagent (DTNB; 5,5'-dithio-bis-2-nitrobenzoic acid) to the ionized form of 2-nitro-5-thiobenzoate (TNB2−) that has a spectrophotometrically detectable yellow colour. The assay shows the same sensitivity for α- and β-CGRP, the lower detection limit is 2 pg CGRP/mL according to the manufacturer’s information.
Figure 1.

Schematic representation of the sandwich ELISA technique used. CGRP molecules in buffered plasma are bound by the capture antibodies that are fixed to the well. Other CGRP epitopes bind tracer antibodies conjugated with acetyl choline esterase (AchE), which converts Ellman’s reagent (DTNB) to TNB that gets ionized and appears yellow. Not CGRP- bound tracer antibodies are washed away. The amount of TNB2− is proportional to the amount of AchE-conjugated antibodies and hence CGRP molecules.
Preparation of solutions
Synthetic interstitial solution (SIF) was prepared by dissolving (in mM) 108 NaCl, 3.48 KCl, 3.69 MgSO4, 26 NaHCO3, 11.67 NaH2PO4, 1.5 CaCl2, 9.6 Na-gluconate, 5.55 glucose and 7.6 sucrose in ultrapure water adjusted to pH 7.4. All following substances were obtained from Bertin Bioreagent. EIA Buffer supplied as powder containing protease inhibitors was reconstituted at room temperature (20°C) with 10 mL ultrapure water for concentrated EIA buffer. Standard buffer was made by diluting 1 volume part of concentrated buffer with 4 parts of SIF. In the following, the phrase “buffered” always means that protease inhibitors are contained in the buffer solution. Human CGRP Standard supplied as powder was reconstituted with 1 mL standard buffer to a final concentration of 1 ng/mL. From the dissolved CGRP standard, serial dilutions of 500, 250, 125, 62.5, 31.25, 15.63 and 7.81 pg/mL CGRP were prepared in propylene tubes with 500 µL standard buffer. Alternatively, blood plasma (usually freed from CGRP) was used to dissolve the same series of CGRP concentrations (see below). Standard buffer (or CGRP-free plasma) was used as lowest (0 pg/mL) CGRP standard. CGRP Tracer supplied as powder was reconstituted with 11.5 mL standard buffer. 1 mL concentrated wash buffer was diluted with 400 mL ultrapure water, and 200 µL Tween 20 was added. Finally, Ellman’s reagent (powder) was reconstituted with 49 mL ultrapure water and 1 mL wash buffer solution.
Assay processing
The 96 well plate was rinsed 5 times with wash buffer solution. To produce the reference curve, 100 µL of each of the 8 CGRP standard solutions was transferred to wells and 100 µL CGRP tracer solution was added. Similarly, 100 µL of the buffered samples were transferred to wells and 100 µL CGRP tracer antibody solution was added. One well was filled with 100 µL SIF without CGRP as a zero control. The plate was covered and incubated for 16–20 hrs at 4°C. Then the wells were emptied and rinsed 5 times with wash buffer solution. 200 µL Ellman’s reagent was filled in each well, the plate covered and incubated in the dark at room temperature on an orbital shaker. Subsequently, the plate was analysed with a plate reader (Dynex Opsys MR, Aspect Scientific Ltd; Cheshire, UK) at a wavelength of 405 nm every 30 minutes until the absorbance approached a maximum, which was usually the case at 60 minutes. The reference curve was fitted to the specified CGRP values (Figure 2) and the CGRP concentration of each sample was determined based on the reference curve. The final CGRP concentration was calculated considering the dilution of samples with EIA buffer (usually 1.25 times, if not specifically mentioned). Reference curves specified in the software (Revelation, Langenau, Germany) were based on linear regression (Figure 3a) or the Akima interpolation (Figure 3b), which is built from piecewise third order polynomials, point for point connecting the standard values (19). CGRP values are given as pg/mL. If values extended the upper standard of 500 or 1000 pg/mL, the measurements were repeated using the same samples, again undiluted and additionally diluted 1:5 or 1:10 with standard buffer.
Figure 2.

Original reference curve fitted linearly to the absorbance at 405 nm wavelength of the CGRP standards 7.81, 15.63, 31.25, 62.5, 125, 250, 500 and 1000 pg/mL.
Figure 3.
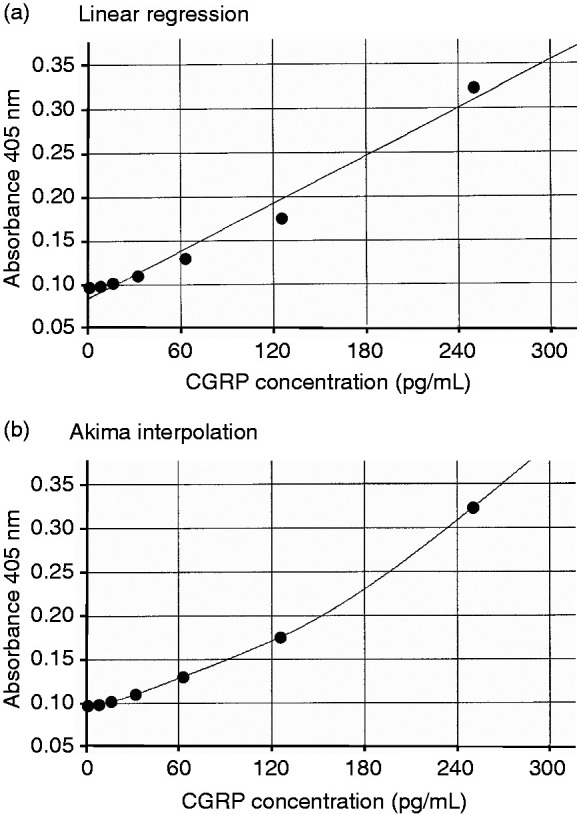
Original reference curves fitted linearly (a) and by Akima interpolation (b) to the absorbance at 405 nm wavelength of the CGRP standards 7.81, 15.63, 31.25, 62.5, 125 and 250 pg/mL.
Purification of plasma by extraction
Extraction is recommended prior to the CGRP assay to purify heterogenous fluids containing high concentrations of different proteins. Blood plasma (1 mL) was 1:4 diluted with 4% acetic acid and passed through a 1 mL C-18 reverse phase cartridge (Bertin Pharma), which beforehand was cleaned by methanol (5 mL) and ultrapure water (10 mL). Then the cartridge was washed with 4% acetic acid (10 mL), and 3 mL of a solution of methanol and 4% acetic acid (9:1) was passed through the cartridge (3 times 1 mL). The elution was dried in a vacuum desiccator at room temperature overnight and reconstituted with 1 mL standard buffer.
Preparation of CGRP-free plasma
Blood plasma of one subject or pooled plasma freed from CGRP (see Results) was prepared for the standard solutions in plasma. 400 µL plasma and 50 µL CGRP Affinity Sorbent (Bertin Bioreagent, A19482) were mixed in a plastic tube and incubated overnight at 4°C on a tilting shaker, then passed through a column with a filter paper at the bottom (Bertin Bioreagent). The sorbent is bound on a matrix resin and contains the same mouse anti-CGRP monoclonal antibody as that coating the wells. According to the manufacturer, 1 mL of the sorbent can free up to 20 mL sample volume from CGRP. The eluate was collected and used for producing the CGRP standard solutions as described above.
Data analysis
Excel software 2013 (Microsoft Corporation, USA) and Statistica 7.0 (StatSoft, Tulsa, OK, USA) was used for calculation and statistical analysis of data. Distribution of values was approved for normality and compared using two-tailed Student’s t-test or analysis of variance (ANOVA). Differences were considered significant at p < 0.05. Values are given as mean ± standard error of the mean (SEM).
Results
Preparatory experiments
Role of buffering and freezing
Plasma was obtained by centrifugation (5000 rpm for 3 min at 5740 g) of fresh venous blood of one male individual. From this plasma 12 aliquots of 100 µL each were buffered with EIA buffer (4:1) containing peptidase inhibitors, the other 4 remained unbuffered. Eight samples (6 buffered, 2 unbuffered) were spiked with 50 µL of the CGRP standard containing 50 pg CGRP before freezing, the remaining 8 samples (6 buffered, 2 unbuffered) were spiked with the same amount of CGRP after freezing and thawing one week later. Two additional aliquots were not spiked with CGRP but with same volumes of normal buffer as a control. The immunoassay was run as described and CGRP values were determined using the standard buffer solutions as reference (see below). Recalculated CGRP concentrations (compensating buffer volumes) were 75.1 ± 8.6 pg/mL in the samples spiked with CGRP before freezing and 63.6 ± 5.1 pg/mL in the samples spiked after freezing and thawing. Among these, the 4 unbuffered samples yielded 42.5 ± 1.4 pg/mL. The control samples without CGRP spiking yielded 11.5 and 10.1 pg/mL. The statistical analysis (factorial ANOVA) indicated a significant difference between buffered and not buffered samples (F1,12 = 32.98, p < 0.001) but not between samples spiked before or after freezing with CGRP (F1,12 = 0.96, p = 0.35). We concluded that buffering of plasma samples with peptidase inhibitors is important to maintain the CGRP concentration, whereas deep-freezing for some days (≤1 week) causes no significant loss of CGRP in the samples. Therefore, immediate deep-freezing of plasma samples was applied for all following experiments.
Role of plasma extraction
Plasma of the same subject as above was subjected to extraction as described in the Methods. 16 aliquots of 100 µL each of the plasma as mentioned in the previous paragraph were treated in exactly the same way and analysed with the CGRP immunoassay. Recalculated CGRP concentrations (compensating buffer volumes) were 140.4 ± 5.6 pg/mL in the samples spiked with 50 pg CGRP before freezing and 114.1 ± 5.4 pg/mL in the samples spiked after freezing and thawing. The calculated CGRP concentration in the 4 control samples without buffering was 148.2 ± 10.7 pg/mL.
We concluded that the CGRP assay after plasma extraction does not reproduce the actual CGRP concentration but rather produces unrealistic high values, and therefore, extraction was not used for further studies.
Mutual use of standard solutions
To find the best solvent for the CGRP standard solutions to reproduce CGRP concentrations in plasma samples, we used three different solutions: (A) buffered SIF (standard buffer); (B) buffered plasma (from same subject as above) stored deep-frozen; and (C) deep-frozen plasma buffered after defrosting. Each of these solutions was used to produce the graded CGRP standards, containing 250, 125, 62.5, 31.25, 15.63, 7.81 and 0 pg/mL CGRP. The actual CGRP concentrations contained in the three standard solution series were calculated using alternately each of the graded solutions for establishing the reference curve. The results are shown in Table 1a. Calculated CGRP concentrations in the plasma analysed with Standard A (buffered SIF) are similar, irrespective if samples were buffered before or after freezing (Table 1a, compare 2nd and 3rd column measured with Standard A), however, concentrations >20 pg/mL are underestimated, while lower concentrations cannot reliably be discriminated. CGRP concentrations based on the references made from plasma, irrespective if buffered before or after freezing (Standards B and C) represent one another best (Table 1, compare 5th and 7th column), whereas the higher CGRP concentrations in buffered SIF (Standard A) are overestimated by about 2-fold compared to the expected values when measured with any of the plasma Standards B or C (see 4th and 6th column).
Table 1.
Comparison of graded CGRP concentrations in different standard solutions (a) and as the result of two reference curve fittings (b). The first column shows the prepared (and expected) CGRP concentrations in the standard solutions. Standard A: standard buffer (buffered SIF); Standard B: buffered plasma stored deep-frozen; Standard C: deep-frozen plasma, buffered after thawing; n.d.: not determined, levels below lowest standard value.
| 1a. Comparison of standard solutions | ||||||
|---|---|---|---|---|---|---|
|
| ||||||
| ExpectedCGRP (pg/mL) |
Standard B |
Standard C |
Standard A |
Standard C |
Standard A |
Standard B |
|
measured with | ||||||
| Standard A | Standard B | Standard C | ||||
| 250 | 193.2 | 197.6 | 555.1 | 338.7 | 545.5 | 327.9 |
| 125 | 77.0 | 72.3 | 250.6 | 116.9 | 249.0 | 127.1 |
| 62.5 | 41.6 | 37.4 | 110.5 | 55.7 | 112.4 | 66.6 |
| 31.25 | 25.8 | 24.6 | 52.3 | 32.6 | 55.1 | 39.0 |
| 15.63 | 19.2 | 16.7 | 24.1 | 19.3 | 28.0 | 27.6 |
| 7.8 | 17.3 | 15.7 | 15.7 | 16.4 | 20.0 | 23.2 |
| 0 | 16.0 | 13.1 | 8.1 | 10.2 | 12.8 | 22.4 |
|
| ||||||
| 1b. Comparison of linear regression and Akima interpolation. | ||||||
|
| ||||||
|
Standard A |
|
Standard C |
|
|||
|
CGRP (pg/mL) measured with Standard B |
||||||
|
CGRP (pg/mL) |
Linear |
Akima |
Linear |
Akima |
|
|
| 250 | 555.1 | 454.9 | 338.7 | 317.1 | ||
| 125 | 250.6 | 259.5 | 116.9 | 145.8 | ||
| 62.5 | 110.5 | 138.3 | 55.7 | 68.1 | ||
| 31.25 | 52.3 | 63.6 | 32.6 | 35.5 | ||
| 15.63 | 24.1 | 21.0 | 19.3 | 10.9 | ||
| 7.8 | 15.7 | n.d. | 16.4 | n.d | ||
| 0 | 8.1 | n.d. | 10.2 | n.d. | ||
We concluded that standard solutions based on different media like SIF and plasma are crucially influencing the CGRP measurements.
Application of different reference curves
The discrepancies between the values of the different standard solutions and the deviation of lower and higher values from the expected CGRP concentrations are partly due to the reference curves fitting the reference values of the standard CGRP solutions. This is especially conspicuous when CGRP standards in plasma are used. The most frequently used method is a linear fit, which nicely represents the standard values in SIF but not in plasma. Table 1b as an extreme example shows the difference of results when mutually compared standard curves were analysed with linear regression and Akima interpolation. Figure 3 shows the underlying reference curves. Akima represents most values slightly better, however, very low values are not detected, because they are below the apparent value of the lowest standard. Conversely, this means that very low values detected with the linear read-out are not representing the true CGRP concentrations. Keeping this in mind, we used mostly the linear fit to avoid loss of data.
Use of different standard solutions for sample testing
In addition to the mutual use of the three CGRP standard solution series as reference, we tested which of the solutions represents a low given CGRP concentration in plasma best. We spiked buffered SIF and plasma of the same individual with CGRP 50 pg/mL prior to freezing or after freezing and thawing as explained above and subjected two samples of each treatment to the assay. The results of the final calculation of the CGRP content are shown in Table 2. The two samples of each preparation (1st and 2nd) revealed very similar CGRP values indicating that repeatability of measurements was good. When CGRP was added to SIF (1st row), values were best represented in the CGRP standard series made of buffer (Standard A) but were quite above 50 pg/mL when they were measured in CGRP standard series made of plasma, regardless if they were buffered before or after freezing (Standards B and C). One could assume that the surplus CGRP content of about 30 pg/mL was originally contained in the plasma before spiking, however, the CGRP content in the (unspiked) plasma samples (Control, 4th and 6th row) was low and close to the detection level of 5 pg/mL CGRP, regardless of its treatment. The calculated CGRP concentrations in spiked plasma (3rd and 5th row) were closest to 50 pg/mL when they were measured in graded CGRP concentrations dissolved in plasma (Standards B and C), whereby buffering before freezing yielded slightly better values. However, when the plasma samples were measured in the SIF standard (Standard A), they revealed only about half of the expected value of 50 pg/mL. Finally, unbuffered plasma samples spiked with CGRP (7th row) and measured in plasma standards (B and C) represented the expected CGRP concentration of 50 pg/mL best, if very low pre-existing levels of CGRP in the plasma were assumed. On the other hand, unbuffered plasma (last row) measured with the plasma standards B and C yielded about 30 pg/mL CGRP, equalling the surplus of the 1st row.
Table 2.
Comparison of CGRP concentrations in SIF and plasma differently treated and measured with standard A (buffered SIF), standard B (buffered plasma stored deep-frozen) and standard C (deep-frozen plasma, buffered after thawing); n.d., not detectable.
|
CGRP (pg/mL) measured with |
||||||
|---|---|---|---|---|---|---|
|
Standard A |
Standard B |
Standard C |
||||
| Treatment | 1st | 2nd | 1st | 2nd | 1st | 2nd |
| CGRP 50 pg/mL in SIF buffered before freezing | 45.7 | 46.7 | 78.9 | 80.6 | 77.8 | 79.6 |
| Control (SIF buffered before freezing) | 1.2 | 1.3 | 0.2 | n.d. | 1.0 | 1.2 |
| CGRP 50 pg/mL in plasma buffered before freezing | 27.7 | 26.4 | 47.1 | 44.8 | 46.8 | 44.7 |
| Control (plasma buffered before freezing) | 4.4 | 4.7 | 5.9 | 6.4 | 6.6 | 7.2 |
| CGRP 50 pg/mL in plasma buffered after freezing | 24.9 | 24.3 | 42.2 | 41.1 | 42.1 | 41.0 |
| Control (plasma buffered after freezing) | 4.7 | 5.0 | 6.3 | 6.8 | 7.0 | 7.3 |
| CGRP 50 pg/mL in plasma without buffering | 31.0 | 31.3 | 52.9 | 53.4 | 52.5 | 53.0 |
| Plasma frozen but not buffered | 17.5 | 17.8 | 29.0 | 29.6 | 29.2 | 29.7 |
We concluded that unbuffered plasma samples can also be used for fairly reliable measurements of CGRP concentrations if they are quickly deep-frozen, but they should be measured in CGRP standards made of plasma.
Stability of high CGRP concentrations in frozen plasma
From the results of the preparatory experiments we have concluded that in deep-frozen plasma the CGRP content is fairly stable for at least one week. To test whether unbuffered deep-frozen plasma with high CGRP concentrations keeps its CGRP content for a longer time, we repeated the CGRP measurements of 7–9 plasma samples of 3 individuals with high CGRP levels after 8 months. For CGRP measurements we used standard solutions in buffered SIF. The mean CGRP concentrations of the first measurement were 623.2 ± 11.2, 838.6 ± 8.4 and 1926.3 ± 17.0 pg/mL, the repeated measurements after 8 months yielded 224.4 ± 5.6, 758.8 ± 9.7 and 1261.8 ± 7.4 pg/mL, which is 36.7 ± 1.3, 90.5 ± 0.8 and 65.5 ± 0.6% of the firstly measured concentration. The difference is highly significant (t-test, p < 0.0001). The plasma samples with the highest loss (65.5%) appeared cloudy after thawing.
We concluded that the loss of CGRP in plasma frozen for several weeks is substantial, so that frozen samples should be measured as quickly as possible.
Applied experiments
CGRP absorption for standard solutions
When plasma with unknown CGRP content is used to establish the CGRP standard solutions, it is recommended to free the plasma from CGRP beforehand. To probe the effect of CGRP absorption on the CGRP standard solutions dissolved in plasma, plasma samples from 17 (10/7 m/f) healthy volunteers prior to their exposure to hypoxia were taken. From these, 13 samples with ample volume were selected and 0.5 mL of each sample was used for pooling. Half of the pooled plasma was treated with Affinity Sorbent (see Methods), the other half was not treated. Then the actual CGRP concentrations contained in the CGRP standard solution series made from buffered SIF (Standard I), from untreated plasma (Standard II) and from plasma after CGRP absorption (Standard III) were calculated using mutually each of the graded solutions as reference ranging from the lowest (standard buffer or CGRP-free plasma) of virtually 0 pg/mL CGRP to the highest with 1000 pg/mL. The results are shown in Table 3. The reference standard solutions based on SIF (Standard I) and plasma with absorbed CGRP (Standard III) mutually represent the prepared CGRP concentrations in pre-absorbed plasma or SIF, respectively, best (compare 3rd and 6th column); although high CGRP values (>100 pg/mL) in pre-absorbed plasma (Standard III) measured in the SIF standard (Standard I) are underestimated by about 10% and lower values are overestimated (3rd column), as illustrated in Figure 4. In untreated pooled plasma measured with Standard I or III (2nd and last column) all CGRP concentrations are about 400 pg/mL above the expected values, which was likely due to the actual CGRP concentration in the pooled plasma without CGRP absorption. Expectedly, the standard curve based on the untreated pooled plasma (Standard 3) displayed no measurable values (4th and 5th column), likely because the high pre-existing CGRP values led to a reference curve that reduced all CGRP values of the other standard solutions.
Table 3.
Mutual application of standard solutions. The first column shows the prepared (and expected) CGRP concentrations in the standard solutions. Standard I: standard buffer (buffered SIF); Standard II: pooled plasma without CGRP absorption; Standard III: pooled plasma with CGRP absorption; n.d., not determined, levels below lowest standard value.
| Expected CGRP (pg/mL) |
Standard II |
Standard III |
Standard I |
Standard III |
Standard I |
Standard II |
|---|---|---|---|---|---|---|
|
Measured with | ||||||
| Standard I | Standard II | Standard III | ||||
| 1000 | 1269.0 | 915.3 | 763.3 | 618.3 | 1155.2 | 1412.2 |
| 500 | 841.9 | 474.6 | 86.5 | 126.2 | 469.9 | 924.7 |
| 250 | 463.5 | 221.1 | n.d. | n.d. | 180.8 | 498.6 |
| 125 | 462.5 | 106.0 | n.d. | n.d. | 89.2 | 497.1 |
| 62.5 | 439.8 | 70.8 | n.d. | n.d. | 45.4 | 470.9 |
| 31.25 | 412.0 | 52.9 | n.d. | n.d. | 26.2 | 440.1 |
| 15.63 | 398.8 | 45.6 | n.d. | n.d. | 18.1 | 425.0 |
| 7.8 | 389.9 | 43.8 | n.d. | n.d. | 14.9 | 414.7 |
| 0 | 363.9 | 43.0 | n.d. | n.d. | 13.1 | 385.7 |
Figure 4.

Mutual comparison of standard curves. Prepared CGRP solutions of Standard III (made of pooled plasma after CGRP absorption) were measured with the reference curve based on Standard I (buffered SIF) and vice versa. Low CGRP values of Standard III appear higher related to the reference curve based on SIF and values > 500 pg/mL of Standard I are overestimated in relation to the reference curve made in plasma.
Therefore, we conclude that pre-absorption of CGRP is necessary if plasma is used for the CGRP standard solutions, whereas graded standard solutions based on extracellular fluid like SIF yield also reasonable measurements of CGRP in plasma.
Application of two different standard solutions for sample testing
The CGRP concentration in plasma samples of the 17 subjects was determined based on the CGRP standard solutions in buffered SIF (Standard I, see above) and plasma after CGRP absorption (Standard III). The finally calculated CGRP concentrations in the samples are listed in Table 4 in ascendant order. The CGRP values determined with the two standard solutions are similar in the order of CGRP concentrations. However, low values (below 100 pg/mL) are displayed significantly higher in the SIF standard in comparison with the plasma standard, while very high values (above 1000 pg/mL) appear about 10% lower in the SIF standard. It seems as low CGRP values measured in the SIF standard had an “offset” of about 25 pg/mL. The pooled plasma was sampled from subjects # 2–4, 6, 8–12 and 15–17 and measured afterwards based on the SIF and the pre-absorbed plasma standards I and II. The mean CGRP concentration of these pooled plasma samples was 506.6 pg/mL measured with the SIF standard (Standard I) and 486.8 pg/mL measured with the plasma standard solutions (Standard II); the high mean value was due to three very high individual values in the pool.
Table 4.
CGRP concentrations in the plasma of 17 individuals determined with CGRP standards prepared in SIF (Standard I) and in pooled plasma after pre-absorption of CGRP (Standard III).
|
CGRP (pg/mL) measured with |
||||
|---|---|---|---|---|
| Subject # | Standard I | Standard III | Difference | % difference |
| 1 | 39.8 | 12.5 | 27.3 | −68.7 |
| 2 | 41.6 | 14.4 | 27.2 | −65.4 |
| 3 | 43.7 | 16.7 | 27.0 | −61.8 |
| 4 | 44.0 | 17.1 | 26.9 | −61.1 |
| 5 | 44.1 | 17.3 | 26.8 | −60.8 |
| 6 | 45.5 | 18.7 | 26.8 | −58.9 |
| 7 | 49.7 | 23.5 | 26.2 | −52.7 |
| 8 | 49.8 | 23.9 | 25.9 | −52.0 |
| 9 | 50.4 | 24.3 | 26.1 | −51.8 |
| 10 | 50.2 | 24.6 | 25.6 | −51.0 |
| 11 | 54.0 | 28.5 | 25.5 | −47.2 |
| 12 | 64.6 | 40.4 | 24.2 | −37.5 |
| 13 | 91.1 | 70.3 | 20.8 | −22.8 |
| 14 | 1389.9 | 1530.8 | −140.9 | 10.1 |
| 15 | 1412.3 | 1555.2 | −142.9 | 10.1 |
| 16 | 1926.6 | 2126.0 | −199.4 | 10.3 |
| 17 | 2059.5 | 2189.1 | −129.6 | 6.3 |
We conclude that CGRP concentrations at least up to about 500 pg/mL can be removed with the CGRP Affinity Sorbent, and this pre-absorbed plasma can be used for establishing the CGRP standards of the CGRP enzyme immunoassay. Second, unusually high CGRP concentrations in the plasma are probably not an artefact of pooled plasma used for preparing the standard solutions.
Repeated CGRP measurements
The deep-frozen plasma samples of the 56 subjects taken before and after exposure to normobaric hypoxia were defrosted and inspected; all samples appeared clear. Their CGRP content was determined with the enzyme immunoassay using the standard solutions made from buffered SIF (Standard I) and from pooled pre-absorbed plasma (Standard III) as explained above. The calculated CGRP concentrations varied considerably between subjects but intra-individual values were quite consistent, as repeated measurements showed high conformity (Table 5). In 10 samples (7 from male subjects) we found CGRP concentrations of > 100 < 600 pg/mL and in 7 samples (5 from male subjects) CGRP levels exceeded 500 pg/mL. Again, low CGRP values were lower when determined with the pooled plasma standard (Standard III) compared to the SIF standard (Standard I), while high values (<500 pg/mL) were overestimated in the plasma standard (Figure 5). The difference between the values measured with the two standards before and after hypoxic exposure was significant (t-test for dependent samples, p = 0.038 and p = 0.026, respectively). In contrast, the CGRP concentration in the plasma samples taken before and after hypoxic exposure, regardless if measured with Standard 1 (97.2% ± 1.9%) or Standard 3 (99.1% ± 0.9%) were very similar (Figure 6). The difference is clearly not significant (t-test for dependent samples, p = 0.69 and p = 0.57, respectively).
Table 5.
CGRP concentrations in the plasma of 56 individuals before (Pre) and after 12 hr exposure (Post) to isobaric hypoxia, determined with CGRP standards prepared in SIF (Standard I) and in pooled plasma after pre-absorption of CGRP (Standard III). Pre-post, difference between pre and post. Post-pre, relative rate between post and pre.
|
CGRP (pg/mL) Standard I |
CGRP (pg/mL) |
% CGRP post/pre |
CGRP (pg/mL) Standard III |
CGRP (pg/mL) |
% CGRP post/pre |
|||
|---|---|---|---|---|---|---|---|---|
| # | Pre | Post | Pre-post | Post-pre | Pre | Post | Pre-post | Post-pre |
| 1 | 39.83 | 39.88 | −0.05 | 100.12 | 12.48 | 12.42 | 0.06 | 99.55 |
| 2 | 41.57 | 40.62 | 0.95 | 97.72 | 14.43 | 13.58 | 0.85 | 94.10 |
| 3 | 43.71 | 43.86 | −0.15 | 100.33 | 16.67 | 17.16 | −0.49 | 102.93 |
| 4 | 43.97 | 42.19 | 1.78 | 95.95 | 17.05 | 15.24 | 1.81 | 89.40 |
| 5 | 44.11 | 42.31 | 1.81 | 95.90 | 17.29 | 15.20 | 2.09 | 87.90 |
| 6 | 45.53 | 44.76 | 0.77 | 98.31 | 18.75 | 18.09 | 0.66 | 96.48 |
| 7 | 45.53 | 44.76 | 0.77 | 98.31 | 18.75 | 18.09 | 0.66 | 96.48 |
| 8 | 49.76 | 49.92 | −0.16 | 100.32 | 23.94 | 23.72 | 0.22 | 99.07 |
| 9 | 50.21 | 48.58 | 1.63 | 96.75 | 24.56 | 22.17 | 2.39 | 90.26 |
| 10 | 50.42 | 51.82 | −1.40 | 102.78 | 24.32 | 26.32 | −2.00 | 108.22 |
| 11 | 53.00 | 53.87 | −0.88 | 101.65 | 6.25 | 6.41 | −0.16 | 102.54 |
| 12 | 53.31 | 55.95 | −2.64 | 104.95 | 6.41 | 8.28 | −1.88 | 129.30 |
| 13 | 53.34 | 52.55 | 0.79 | 98.51 | 6.87 | 5.64 | 1.22 | 82.20 |
| 14 | 53.48 | 52.89 | 0.59 | 98.90 | 6.42 | 5.94 | 0.48 | 92.50 |
| 15 | 53.72 | 53.01 | 0.71 | 98.68 | 7.51 | 6.33 | 1.18 | 84.28 |
| 16 | 53.75 | 55.76 | −2.01 | 103.73 | 7.59 | 9.40 | −1.81 | 123.89 |
| 17 | 53.86 | 52.87 | 0.99 | 98.17 | 7.66 | 6.82 | 0.85 | 88.97 |
| 18 | 54.00 | 53.65 | 0.35 | 99.35 | 28.49 | 28.04 | 0.45 | 98.41 |
| 19 | 54.06 | 52.56 | 1.50 | 97.23 | 7.32 | 5.60 | 1.72 | 76.54 |
| 20 | 54.26 | 52.87 | 1.38 | 97.45 | 6.73 | 5.90 | 0.83 | 87.68 |
| 21 | 5469 | 54.87 | −0.18 | 100.32 | 7.83 | 8.22 | −0.38 | 104.89 |
| 22 | 54.94 | 53.11 | 1.82 | 96.68 | 7.68 | 5.52 | 2.16 | 71.85 |
| 23 | 55.06 | 53.52 | 1.54 | 97.21 | 8.59 | 6.50 | 2.09 | 75.67 |
| 24 | 55.28 | 56.31 | −1.03 | 101.86 | 8.07 | 10.43 | −2.36 | 129.24 |
| 25 | 55.72 | 57.31 | −1.59 | 102.84 | 9.10 | 10.87 | −1.78 | 119.53 |
| 26 | 55.80 | 54.96 | 0.85 | 98.48 | 9.39 | 8.29 | 1.10 | 88.26 |
| 27 | 56.21 | 56.96 | −0.75 | 101.33 | 10.09 | 10.46 | −0.37 | 103.66 |
| 28 | 56.32 | 55.23 | 1.09 | 98.06 | 9.77 | 8.42 | 1.34 | 86.24 |
| 29 | 56.43 | 56.88 | −0.45 | 100.79 | 9.99 | 10.36 | −0.37 | 103.66 |
| 30 | 56.69 | 58.20 | −1.51 | 102.67 | 10.09 | 11.84 | −1.75 | 117.30 |
| 31 | 61.24 | 57.75 | 3.50 | 94.29 | 15.72 | 11.98 | 3.74 | 76.21 |
| 32 | 64.59 | 63.26 | 1.33 | 97.94 | 40.41 | 39.03 | 1.39 | 96.57 |
| 33 | 68.23 | 70.77 | −2.54 | 103.72 | 23.29 | 25.60 | −2.30 | 109.89 |
| 34 | 71.47 | 73.05 | −1.58 | 102.22 | 26.73 | 27.52 | −0.79 | 102.94 |
| 35 | 77.85 | 75.50 | 2.35 | 96.98 | 33.14 | 31.45 | −1.69 | 94.89 |
| 36 | 86.86 | 86.41 | 0.45 | 99.48 | 44.32 | 43.53 | 0.79 | 98.22 |
| 37 | 91.11 | 92.41 | −1.31 | 101.43 | 70.31 | 71.74 | −1.43 | 102.03 |
| 38 | 114.43 | 79.63 | 34.80 | 69.59 | 74.61 | 35.88 | 38.74 | 48.08 |
| 39 | 160.90 | 144.52 | 16.38 | 89.82 | 127.11 | 108.70 | 18.41 | 85.52 |
| 40 | 194.22 | 208.98 | −14.76 | 107.60 | 164.49 | 180.94 | −16.45 | 110.00 |
| 41 | 195.26 | 177.73 | 17.54 | 91.02 | 165.84 | 146.01 | 19.83 | 88.04 |
| 42 | 207.68 | 201.67 | 6.01 | 97.11 | 179.56 | 172.84 | 6.72 | 96.26 |
| 43 | 248.66 | 234.87 | 13.79 | 94.46 | 225.00 | 210.22 | 14.78 | 93.43 |
| 44 | 270.62 | 294.63 | −24.01 | 108.87 | 249.85 | 277.21 | −27.36 | 110.95 |
| 45 | 310.68 | 352.05 | −41.37 | 113.32 | 295.19 | 341.67 | −46.47 | 115.74 |
| 46 | 388.73 | 353.29 | 35.44 | 90.88 | 381.68 | 342.21 | 39.47 | 89.66 |
| 47 | 390.62 | 422.91 | −32.28 | 108.26 | 384.55 | 420.87 | −36.32 | 109.44 |
| 48 | 554.58 | 624.93 | −70.35 | 112.69 | 568.89 | 647.33 | −78.44 | 113.79 |
| 49 | 1287.02 | 1318.09 | −31.07 | 102.41 | 1368.45 | 1379.83 | −11.37 | 100.83 |
| 50 | 1389.88 | 1192.87 | 197.01 | 85.83 | 1530.75 | 1315.27 | 215.49 | 85.92 |
| 51 | 1412.31 | 1360.89 | 51.43 | 96.36 | 1555.22 | 1501.66 | 53.57 | 96.56 |
| 52 | 1525.71 | 1580.31 | −54.60 | 103.58 | 1533.05 | 1606.97 | −73.91 | 104.82 |
| 53 | 1548.00 | 1596.75 | −48.75 | 103.15 | 1651.07 | 1617.64 | 33.43 | 97.98 |
| 54 | 1601.04 | 1645.01 | −43.98 | 102.75 | 1583.57 | 1627.50 | −43.93 | 102.77 |
| 55 | 1926.59 | 1916.01 | 10.58 | 99.45 | 2125.97 | 2116.45 | 9.52 | 99.55 |
| 56 | 2059.48 | 1988.68 | 70.80 | 96.56 | 2189.10 | 2163.21 | 25.90 | 98.82 |
| Mean | 318.94 | 317.06 | 1.88 | 99.06 | 303.26 | 300.45 | 2.75 | 97.20 |
| SEM | 72.63 | 72.04 | 4.65 | 0.87 | 79.21 | 78.35 | 4.87 | 1.94 |
Figure 5.

Comparison of plasma CGRP concentrations of subjects 1-56 measured with the reference curve based on Standard I (buffered SIF) and with the reference curve of Standard III (pooled plasma after CGRP absorption). Low CGRP values are higher when determined with the SIF standard curve but values > 500 pg/mL are lower.
Figure 6.

CGRP Plasma concentrations of 56 individuals measured before (0 h) and after exposition to hypoxic conditions (12 h) depicted on a logarithmic scale ranging from 35-2500 pg/mL.
We conclude that repeated measurement of CGRP in plasma samples reveals nearly identical results if the same procedure is applied, although the actual values differ individually and considerably. Second, CGRP levels in plasma can also be analysed with standard solutions based on buffered physiological solutions, if they are compared within this method. Third, a 12-hour exposure of healthy volunteers to normobaric hypoxia obviously had no influence on the CGRP level in circulating venous blood, although the majority of subjects had developed headache, some even migraine-like headache ( 17 ). There were no statistically significant differences between the subjects developing headaches and those that did not.
Discussion
CGRP is the most hyped biomarker for some primary headaches like migraine and cluster headache and a specific target of preventative therapies in migraine (20,21). CGRP has been found to be released upon stimulation of primary meningeal afferents in animal experiments (22–25) and appears during provoked, as well as, spontaneous migraine and cluster headache attacks at elevated concentrations in the jugular plasma (14,26–30), possibly also in the plasma of the cubital veins (9). Elevations of blood CGRP have also been reported interictally in cluster headache (31) and in chronic migraine (15).
The present project was performed to optimize methods for measuring CGRP in human plasma with an enzyme-linked immunosorbent assay (ELISA), to clarify difficulties and pitfalls of this procedure and provide practical solutions. Since in most published papers the method of CGRP detection is not or insufficiently reported, we presented highly detailed instructions in the Methods section of this manuscript. The whole process as recommended for CGRP measurements in plasma samples is summarized by the flow chart shown in Figure 7. Second, using plasma samples of a previous project with healthy volunteers exposed to hypoxic conditions we aimed to evaluate how reliable repetitive measurements of CGRP in same plasma are. Finally, the previous project was a longitudinal study, which provided the possibility to compare plasma samples of same subjects drawn under identical conditions and to test if repeated measurements yield identical results.
Figure 7.

Flow chart illustrating all steps of a longitudinal experiment from plasma sampling to the final calculation of CGRP concentrations. Instead of pooled plasma and CGRP absorption, buffer can be used for the CGRP standard solutions without significant deviation. Incubation steps in the wells are depicted within the hemicycle.
Important conclusions from our survey are that either immediate buffering with peptidase inhibitors or rapid subsequent deep-freezing of plasma samples is necessary to maintain the CGRP content, that same standard solutions should be used as reference for the CGRP measurements and that pre-absorption of CGRP is necessary if plasma is used for the CGRP standard solutions. Using these precautions, repeated measurements of CGRP levels reveal nearly identical results, whereas the actual CGRP levels differ individually and considerably. Therefore, measurements of plasma CGRP are highly reliable within same individuals and best suitable for longitudinal experiments. Finally, exposure of healthy subjects to hypoxia in our sample did not change the individual CGRP level in circulating cubital venous blood.
Standard solutions for reference
The standard solutions, on which the reference curves are based, is decisive for the resulting CGRP concentration. For aqueous solutions with low peptide content such as SIF or cerebrospinal fluid the standard curve is usually made from graded concentrations in buffer, which has been approved repeatedly in animal experiments (32–34). For solutions with high peptide content such as blood plasma, standard curves made from the same medium like plasma are recommended. We have tried different modes of standardizing the quantitative CGRP analysis in plasma and came to the conclusion that a standard curve with graded concentrations of CGRP based on CGRP-free plasma may represent given CGRP plasma levels best. However, if the absolute CGRP concentration is less important than higher reproducibility, a reference curve based on standards made from buffered extracellular fluid (SIF) is preferable, because plasma is highly variable and may contain substances that cross-react with the assay. Another advantage of SIF is that it can be exactly reproduced and can be used to analyse samples from different subjects collected at different days, whereas pooled plasma must be stored frozen when it is used more than once for the standards. For the repeated analysis of plasma from subjects exposed to hypoxia we have compared CGRP values of same samples calculated with CGRP standard solutions made with SIF and with pooled plasma and found no significant differences.
Variance of CGRP plasma levels
The high individual variance of CGRP plasma levels are remarkable. First, we tested if there was a technical problem causing this variance but repeated measures without and with dilution revealed consistent results. According to the manufacturer, the ELISA is highly specific for CGRP and does not cross-react with other neuropeptides of the CGRP family like amylin or adrenomedullin, however, we cannot fully exclude that other rare proteins that are individually contained in human plasma show cross-reaction with the ELISA. A strong argument to assume that it is really CGRP, which has been recognized by the ELISA, is that the pooled plasma of 13 subjects contained around 500 pg/mL CGRP according to the measurements with both the pre-absorbed plasma and the SIF standards. This amount of CGRP was obviously fully removed by pre-absorption, so that this plasma could be used for measuring the CGRP content in the individual plasma samples. Human plasma may contain high levels of CGRP due to other reasons of very different pathologies, for example sepsis (35), endocrine tumors (36), acute psoriasis (37) or severe pain states (38,39) other than headaches. Nerve regeneration is accompanied by a high expression of CGRP (40), which could possibly contribute to elevated plasma levels. There is currently no evidence for such pathological reasons, as none of the volunteers included in this study did suffer from any of those disorders. Thus the reason for the high differences in CGRP levels remains open; it would be interesting to know if other groups have similar experiences with their measurements.
Guidance for optimal analysis of plasma CGRP with an ELISA
Collect sufficient amounts of fresh blood in EDTA vials, separate it by centrifugation, not longer than 4 minutes.
Separate clear plasma and immediately add 20% buffer containing peptidase inhibitors. Freeze and store buffered plasma samples at < −20°C, better −80°C; alternatively, plasma samples may be buffered immediately after defrosting.
Analyse samples belonging to the same experiment together with the same assay batch; if possible, analyse all samples on the same plate; keep plasma from each subject for repeating the analysis.
Use CGRP-free pooled plasma or plasma of the same source as that to be analysed for establishing the CGRP standards and hence the reference curve. CGRP can be removed by pre-absorption based on the same CGRP-binding antibodies as for the assay; note that pre-absorption retains at least half of the original plasma volume.
If pre-absorbed plasma is not available, CGRP-free physiological solutions can be used instead, but do not mix data analysed with different standards.
For absolute values re-calculate the CGRP concentration according to the added buffer volume.
If values exceed the highest CGRP standard, dilute the plasma with buffered physiological solution and repeat the assay.
For reliable comparison of plasma samples, all steps should be made in exactly the same way.
Key findings
CGRP in human plasma can easily be analysed using an enzyme-linked immunosorbent assay without purification of the plasma.
Immediate buffering of plasma samples with peptidase inhibitors is recommended but immediate freezing is more important; identical treatment of samples is most important to guarantee comparability.
After storage of deep-frozen plasma for weeks or months the CGRP content seems to decrease significantly.
There are considerable inter-individual differences in CGRP plasma levels without detectable pathological reason but intra-individual values are consistent and highly reproducible.
Plasma CGRP measurements are not suitable to differentiate pathological states between different subjects, they are rather suitable to follow changes in CGRP levels in same subjects.
Footnotes
Ethic approval and patient consent: The study was reviewed and approved by the Ethics Committee of the Medical University of Innsbruck (approval # 1242/2017). All participants were informed about the experimental procedures and gave their informed written consent to participate in the study.
Author contributions: KM, FF and GB designed the experiments; BV, AK and JS conducted the experiments; KM and BV analysed the data; KM, FF and GB wrote the manuscript.
Declaration of conflicting interests: The authors declare that there is no conflict of interest with respect to the research, authorship, and/or publication of this article.
Funding: The authors received no financial support for the research, authorship, and/or publication of this article.
ORCID iDs: Karl Messlinger https://orcid.org/0000-0002-8099-3860
Florian Frank https://orcid.org/0000-0002-7236-5557
References
- 1.Russell FA, King R, Smillie S-J, et al. Calcitonin gene-related peptide: physiology and pathophysiology. Physiol Rev 2014; 94: 1099–1142. [DOI] [PMC free article] [PubMed] [Google Scholar]
- 2.Hu R, Li Y-J, Li X-H. An overview of non-neural sources of calcitonin gene-related peptide. Curr Med Chem 2016; 23: 763–773. [DOI] [PubMed] [Google Scholar]
- 3.Victoria Vega A, Avila G. CGRP, a vasodilator neuropeptide that stimulates neuromuscular transmission and EC coupling. Curr Vasc Pharmacol 2010; 8: 394–403. [DOI] [PubMed] [Google Scholar]
- 4.Lawson SN, Crepps B, Perl ER. Calcitonin gene‐related peptide immunoreactivity and afferent receptive properties of dorsal root ganglion neurones in guinea‐pigs. J Physiol 2002; 540: 989–1002. [DOI] [PMC free article] [PubMed] [Google Scholar]
- 5.Eftekhari S, Warfvinge K, Blixt FW, et al. Differentiation of nerve fibers storing CGRP and CGRP receptors in the peripheral trigeminovascular system. J Pain Off J Am Pain Soc 2013; 14: 1289–1303. [DOI] [PubMed] [Google Scholar]
- 6.Dux M, Rosta J, Messlinger K. TRP channels in the focus of trigeminal nociceptor sensitization contributing to primary headaches. Int J Mol Sci 2020; 21: 342. [DOI] [PMC free article] [PubMed] [Google Scholar]
- 7.Messlinger K. The big CGRP flood - sources, sinks and signalling sites in the trigeminovascular system. J Headache Pain 2018; 19: 22. [DOI] [PMC free article] [PubMed] [Google Scholar]
- 8.Schou WS, Ashina S, Amin FM, et al. Calcitonin gene-related peptide and pain: a systematic review. J Headache Pain 2017; 18: 34. [DOI] [PMC free article] [PubMed] [Google Scholar]
- 9.Ramón C, Cernuda-Morollón E, Pascual J. Calcitonin gene-related peptide in peripheral blood as a biomarker for migraine: Curr Opin Neurol 2017; 30: 281–286. [DOI] [PubMed] [Google Scholar]
- 10.Tfelt-Hansen P, Ashina M. CGRP in migraine. J Headache Pain 2009; 10: 385–385. [DOI] [PMC free article] [PubMed] [Google Scholar]
- 11.Lee MJ, Lee S-Y, Cho S, et al. Feasibility of serum CGRP measurement as a biomarker of chronic migraine: a critical reappraisal. J Headache Pain 2018; 19: 53. [DOI] [PMC free article] [PubMed] [Google Scholar]
- 12.Kraenzlin ME, Ch’ng JLC, Mulderry PK, et al. Infusion of a novel peptide, calcitonin gene-related peptide (CGRP) in man. Pharmacokinetics and effects on gastric acid secretion and on gastrointestinal hormones. Regul Pept 1985; 10: 189–197. [DOI] [PubMed] [Google Scholar]
- 13.Tvedskov JF, Lipka K, Ashina M, et al. No increase of calcitonin gene-related peptide in jugular blood during migraine. Ann Neurol 2005; 58: 561–568. [DOI] [PubMed] [Google Scholar]
- 14.Kruuse C, Iversen HK, Jansen-Olesen I, et al. Calcitonin gene-related peptide (CGRP) levels during glyceryl trinitrate (GTN)-induced headache in healthy volunteers. Cephalalgia Int J Headache 2010; 30: 467–474. [DOI] [PubMed] [Google Scholar]
- 15.Cernuda-Morollón E, Larrosa D, Ramón C, et al. Interictal increase of CGRP levels in peripheral blood as a biomarker for chronic migraine. Neurology 2013; 81: 1191–1196. [DOI] [PubMed] [Google Scholar]
- 16.Fan P-C, Kuo P-H, Lee MT, et al. Plasma calcitonin gene-related peptide: a potential biomarker for diagnosis and therapeutic responses in pediatric migraine. Front Neurol 2019; 10: 10. [DOI] [PMC free article] [PubMed] [Google Scholar]
- 17.Broessner G, Rohregger J, Wille M, et al. Hypoxia triggers high-altitude headache with migraine features: A prospective trial. Cephalalgia 2016; 36: 765–771. [DOI] [PubMed] [Google Scholar]
- 18.Moher D, Schulz KF, Altman D, et al. The CONSORT statement: revised recommendations for improving the quality of reports of parallel-group randomized trials. JAMA 2001; 285: 1987–1991. [DOI] [PubMed] [Google Scholar]
- 19.Akima H. A new method of interpolation and smooth curve fitting based on local procedures. J Assoc Computing Machinery 1970; 17: 589–602. [Google Scholar]
- 20.Bigal ME, Walter S, Rapoport AM. Calcitonin gene-related peptide (CGRP) and migraine current understanding and state of development. Headache 2013; 53: 1230–1244. [DOI] [PubMed] [Google Scholar]
- 21.Edvinsson L, Haanes KA, Warfvinge K, et al. CGRP as the target of new migraine therapies - successful translation from bench to clinic. Nat Rev Neurol 2018; 14: 338–350. [DOI] [PubMed] [Google Scholar]
- 22.Goadsby PJ, Edvinsson L, Ekman R. Release of vasoactive peptides in the extracerebral circulation of humans and the cat during activation of the trigeminovascular system. Ann Neurol 1988; 23: 193–196. [DOI] [PubMed] [Google Scholar]
- 23.Ebersberger A, Averbeck B, Messlinger K, et al. Release of substance P, calcitonin gene-related peptide and prostaglandin E2 from rat dura mater encephali following electrical and chemical stimulation in vitro. Neuroscience 1999; 89: 901–907. [DOI] [PubMed] [Google Scholar]
- 24.Eltorp CT, Jansen-Olesen I, Hansen AJ. Release of calcitonin gene-related peptide (CGRP) from guinea pig dura mater in vitro is inhibited by sumatriptan but unaffected by nitric oxide. Cephalalgia Int J Headache 2000; 20: 838–844. [DOI] [PubMed] [Google Scholar]
- 25.Dux M, Will C, Eberhardt M, et al. Stimulation of rat cranial dura mater with potassium chloride causes CGRP release into the cerebrospinal fluid and increases medullary blood flow. Neuropeptides 2017; 64: 61–68. [DOI] [PubMed] [Google Scholar]
- 26.Goadsby PJ, Edvinsson L. The trigeminovascular system and migraine: studies characterizing cerebrovascular and neuropeptide changes seen in humans and cats. Ann Neurol 1993; 33: 48–56. [DOI] [PubMed] [Google Scholar]
- 27.Goadsby PJ, Edvinsson L. Human in vivo evidence for trigeminovascular activation in cluster headache. Neuropeptide changes and effects of acute attacks therapies. Brain J Neurol 1994; 117: 427–434. [DOI] [PubMed] [Google Scholar]
- 28.Fanciullacci M, Alessandri M, Figini M, et al. Increase in plasma calcitonin gene-related peptide from the extracerebral circulation during nitroglycerin-induced cluster headache attack. Pain 1995; 60: 119–123. [DOI] [PubMed] [Google Scholar]
- 29.Sarchielli P, Alberti A, Codini M, et al. Nitric oxide metabolites, prostaglandins and trigeminal vasoactive peptides in internal jugular vein blood during spontaneous migraine attacks. Cephalalgia Int J Headache 2000; 20: 907–918. [DOI] [PubMed] [Google Scholar]
- 30.Juhasz G, Zsombok T, Modos EA, et al. NO-induced migraine attack: strong increase in plasma calcitonin gene-related peptide (CGRP) concentration and negative correlation with platelet serotonin release. Pain 2003; 106: 461–470. [DOI] [PubMed] [Google Scholar]
- 31.Snoer A, Vollesen ALH, Beske RP, et al. Calcitonin-gene related peptide and disease activity in cluster headache. Cephalalgia Int J Headache 2019; 39: 575–584. [DOI] [PubMed] [Google Scholar]
- 32.Gupta S, Amrutkar DV, Mataji A, et al. Evidence for CGRP re-uptake in rat dura mater encephali. Br J Pharmacol 2010; 161: 1885–1898. [DOI] [PMC free article] [PubMed] [Google Scholar]
- 33.Dux M, Will C, Vogler B, et al. Meningeal blood flow is controlled by H2S-NO crosstalk activating HNO-TRPA1-CGRP signalling. Br J Pharmacol 2016; 173: 431–445. [DOI] [PMC free article] [PubMed] [Google Scholar]
- 34.De Col R, Messlinger K, Hoffmann T. Differential conduction and CGRP release in visceral versus cutaneous peripheral nerves in the mouse. J Neurosci Res 2018; 96: 1398–1405. [DOI] [PubMed] [Google Scholar]
- 35.Arnalich F, Hernanz A, Jiménez M, et al. Relationship between circulating levels of calcitonin gene-related peptide, nitric oxide metabolites and hemodynamic changes in human septic shock. Regul Pept 1996; 65: 115–121. [DOI] [PubMed] [Google Scholar]
- 36.Takami H, Shikata J-I, Kakudo K, et al. Calcitonin gene-related peptide in patients with endocrine tumors. J Surg Oncol 1990; 43: 28–32. [DOI] [PubMed] [Google Scholar]
- 37.Reich A, Orda A, Wiśnicka B, et al. Plasma concentration of selected neuropeptides in patients suffering from psoriasis. Exp Dermatol 2007; 16: 421–428. [DOI] [PubMed] [Google Scholar]
- 38.Gavrilov SG, Vasilieva GYu, Vasiliev IM, et al. Calcitonin gene-related peptide and substance P as predictors of venous pelvic pain. Acta Naturae 2019; 11: 88–92. [DOI] [PMC free article] [PubMed] [Google Scholar]
- 39.Neychev D, Sbirkova T, Ivanovska M, et al. Correlation between CGRP levels and the neuropathic and inflammatory component of postoperative pain. Folia Med (Plovdiv) 2020; 62: 365–371. [DOI] [PubMed] [Google Scholar]
- 40.Toth CC, Willis D, Twiss JL, et al. Locally synthesized calcitonin gene-related peptide has a critical role in peripheral nerve regeneration. J Neuropathol Exp Neurol 2009; 68: 326–337. [DOI] [PMC free article] [PubMed] [Google Scholar]