

Abstract

Imaging platforms that enable long-term, high-resolution imaging of biofilms are required to study cellular level dynamics within bacterial biofilms. By combining high spatial and temporal resolution and low phototoxicity, lattice light sheet microscopy (LLSM) has made critical contributions to the study of cellular dynamics. However, the power of LLSM has not yet been leveraged for biofilm research because the open-on-top imaging geometry using water-immersion objective lenses is not compatible with living bacterial specimens; bacterial growth on the microscope’s objective lenses makes long-term time-lapse imaging impossible and raises considerable safety concerns for microscope users. To make LLSM compatible with pathogenic bacterial specimens, we developed hermetically sealed, but optically accessible, microfluidic flow channels that can sustain bacterial biofilm growth for multiple days under precisely controllable physical and chemical conditions. To generate a liquid- and gas-tight seal, we glued a thin polymer film across a 3D-printed channel, where the top wall had been omitted. We achieved negligible optical aberrations by using polymer films that precisely match the refractive index of water. Bacteria do not adhere to the polymer film itself, so that the polymer window provides unobstructed optical access to the channel interior. Inside the flow channels, biofilms can be grown on arbitrary, even nontransparent, surfaces. By integrating this flow channel with LLSM, we were able to record the growth of S. oneidensis MR-1 biofilms over several days at cellular resolution without any observable phototoxicity or photodamage.
1. Introduction
Bacterial biofilms are microbial communities that grow on various surfaces and encase themselves in a self-produced extracellular matrix (ECM) containing proteins, DNA, and polysaccharides.1−3 Owing to their communal and cooperative behaviors, biofilm-dwelling cells have shown emergent capabilities beyond those of planktonic cells.3−5 Consequently, biofilms are orders of magnitude more tolerant toward external threats, including antibiotic treatments and immune system clearance.4,6−8 Because biofilms are a major component of microbial life, it is vitally important to understand how population-level capabilities emerge from the coordination of individual cell behaviors.9 To gain this understanding, noninvasive imaging techniques that are capable of resolving and tracking individual cells in 3D biofilms are required.
Fluorescence microscopy is one of the best tools to reveal both the spatial and temporal contexts that affect cellular behaviors in a biofilm.10−12 However, conventional wide-field and confocal techniques illuminate the entire thickness of the specimen, even though useful information is only obtained from a single slice in the specimen that is coincident with the microscope’s focal plane.13,14 Repeated illumination of the entire specimen results in increased phototoxicity and photodamage, which results in a disadvantageous trade-off between temporal resolution and total imaging time.15 In contrast, light sheet fluorescence microscopy approaches, while achieving similar resolution to confocal microscopy, are more photon efficient because they utilize coincident excitation and detection planes, so that out-of-focus specimen regions are not illuminated.16−18 Among light-sheet-based fluorescence microscopies, lattice light sheet microscopy (LLSM) has proven especially powerful for noninvasive 3D live imaging of embryos, cells, and cellular organelles at high spatial and temporal resolution.19−22 Dual inverted selective plane illumination microscopy (diSPIM)23 is another high-resolution light-sheet-based fluorescence microscopy modality that has recently been applied to biofilm imaging.12 With the ability to acquire images from two orthogonal views, diSPIM can provide isotropic resolution. However, it is important to note that isotropic resolution comes at the cost of twice the number of image exposures. If the goal is to reduce the amount of photobleaching and phototoxicity, the number of image frames should be kept to a minimum, if at all possible.
Bacterial biofilms pose an additional challenge for high numerical aperture LLSM, diSPIM, and similar dual-objective light sheet implementations. The high numerical aperture water immersion objective lenses require the sample to be in close proximity to the objective lenses. In the original LLSM implementation,22 the sample is therefore not physically separated from the objective lenses, but is simply mounted on a spoon-like sample holder and then immersed into an aqueous growth medium for imaging. This is in contrast to conventional inverted fluorescence microscopy setups, where a glass coverslip provides a physical barrier between the microscope and the specimen.22,24
The open-on-top sample mounting approach allows for direct optical access, but it is not suitable for long-term biofilm imaging. First, biofilms eventually grow on the objective lenses themselves and thereby attenuate the excitation and emission light intensities leading to a loss of signal. Second, colonized microscope components could expose microscope users to potentially harmful bacterial pathogens.25,26 Third, an open sample basin makes any biological sample vulnerable to airborne biological and chemical contaminants, which could affect a living specimens in unpredictable ways.27 Containing a living biological specimen in an enclosed environment, separate from the microscope components, is necessary to ensure well-controlled experimental conditions and the safety of laboratory personnel who work with pathogenic specimens.
Microfluidic channels, made from biocompatible polydimethylsiloxane (PDMS) adhered to a glass coverslip, have been widely used for live-cell biofilm imaging on conventional inverted microscopes.28,29 These studies have demonstrated that shear forces due to fluid flow is a critical factor influencing the growth of biofilms; in some cases, fluid flow is arguably a necessary factor to image biofilms in physiologically relevant environments. Hartmann et al. have recorded the growth dynamics of Vibrio cholerae with a spinning disk confocal microscope using PDMS-based microfluidic flow systems.11 Thomen et al. studied the effects of hydrodynamics on growing biofilms by utilizing PDMS flow channels of various sizes with bright-field and epifluorescent microscopes.30 Coyte et al. studied the hydrodynamic interactions between competing biofilms through a Y-shaped microfluidic system with bright-field and epifluorescent microscopes.31 Because of the widespread use of single-objective inverted microscope implementations, recent developments have also enabled high-numerical aperture light sheet imaging using only a single objective lens.32−34 These implementations share many of the critical benefits of LLSM (low phototoxicity/photodamage and high spatial and temporal resolution) while also enabling high-resolution bottom-to-top imaging of cells in a biofilm. However, the necessity of the biofilm growth substrate to be optically transparent is an inherent drawback of such inverted microscope imaging geometries.
Integrating microfluidic technology with LLSM is challenging for two reasons. First, the space between the two LLSM objective lenses is very small, which necessitates a small microfluidic device footprint. Typical PDMS-based microfluidic devices are tens of millimeters in size28,35,36 and therefore too large for LLSM. Second, the refractive index of PDMS does not match the refractive index of the aqueous growth media,37 which would result in unacceptable optical aberrations.24,38 Because of these challenges, LLSM-integrated microfluidic channels are rare. Only very recently, Fan et al. reported an LLSM-integrated channel sealed with Sarstedt Lumox film, a biocompatible material that has a refractive index similar to water.39 However, repeated high-resolution imaging of living cells over time was not possible because the numerical aperture (NA) of that imaging system was 0.8 (the imaging system used here has an NA of 1.1), and the channel was not mounted on a motorized sample stage which would enable imaging of large specimen volumes by stage scanning. Instead, 3D imaging was achieved by flowing unattached cells through the light sheet. To image sessile cell populations repeatedly over time at high resolution, a more versatile imaging system and flow channel integration is needed.
Here, we report a flow channel design that is fully compatible with high-resolution LLSM and demonstrate its application in extended time live-cell biofilm imaging. A 3D-printed folded channel architecture ensures full compatibility with the original and most widely adapted LLSM implementation. A refractive index matched polymer film was used to seal the observation window on the top channel. We found that precise refractive index matching (1.333) substantially reduces optical aberrations, thus enabling close to optimal imaging conditions. Using this channel, we obtained high quality time-lapse images of growing biofilms over several days with the possibility to extend the imaging duration even further. Single-cell resolution was maintained at all time points. A completely enclosed flow channel, as describe here, can benefit any water-dipping dual-objective light sheet implementation, including diSPIM. Although diSPIM imaging of Vibro cholera biofilms could be performed for 16 h with an open top chamber containing growth medium,12 an enclosed channel could further enhance the versatility of diSPIM for biofilm research, specifically by providing better control over physical and chemical growth conditions and by preventing airborne contaminants from reaching the biofilm. We anticipate that the integration of microfluidic technologies with noninvasive, high-resolution imaging technologies and computational image analysis40,41 will enable studies on how individual cells’ behavioral phenotypes as well as chemical and mechanical driving forces shape bacterial communities and determine their emergent functional capabilities.
2. Materials and Methods
2.1. Flow Channel Design and Fabrication
The flow channel was designed by using SolidWorks 2020 (Dassault Systèmes SOLIDWORKS Corp.) (Figure 1). The main chamber was 12.10 mm long and 4.40 mm wide. To physically isolate the inner chamber space from the outside environment, a detection window with a length of 5.00 mm was draped over the top of the channel to allow light transmission into the entire collection solid angle of the detection objective. A platform holding an arbitrary substrate for biofilm growth was positioned in the middle of the main chamber. A folded channel architecture was chosen to minimize channel/sample drift and to ensure easy routing of plastic tubing away from optical and optomechanical components of the LLSM. These measures also made it easier to mount and then translate the channel on automated micro- and nanopositioning stages. To reduce the impact of the refractive index boundaries in the excitation and emission light paths, a 50 μm thick film of MY133-V2000 polymer (My Polymers, Israel) was used to seal the detection window. The refractive index of MY133-V2000 (n = 1.333) is very close to the refractive index of the media used in our experiments.
Figure 1.

Schematic of the experimental setup. (a) Sample area of the custom-built lattice light-sheet microscope. (b) 3D model of 3D-printed microfluidic channel. (c) Cross section of the microfluidic channel; red arrows indicate the flow direction of cellular growth media.
Channels were fabricated by using Clear Resin V4 in a low-force stereolithography Form 3B 3D printer (Form Laboratories). After printing, we washed the channels with isopropyl alcohol using the Form Wash instrument (Form Laboratories) for 10 min to remove uncured resin. Then, the channels were removed from the supports and rinsed again in isopropyl alcohol for another 10 min. After washing, the channels were dried for 1 h at room temperature to allow the isopropyl alcohol to evaporate. Finally, we cured the channels by UV light using the Form Cure instrument (Form Laboratories) for 15 min at 35 °C.
2.2. Refractive Index-Matched Polymer Film Fabrication
To create an ∼50 μm thick film of MY133-V2000 polymer, we cut a 6 × 6 cm2 square opening into a 50 μm Teflon film (FEP Teflon, DuPont). The Teflon film was then put onto a flat glass plate (McMaster-Carr, 8476K62), and ∼200 μL of MY133-V2000 polymer was deposited into the opening. A second flat glass plate was then put on the top of the Teflon film opening, and a force of ∼50 N was applied to spread the polymer within (Figure 2a). The two glass plates were then clamped together by binder clips, and the liquid polymer was cured under ultraviolet (UV) illumination (∼28 mW/cm2) for 2 h by using a UV/ozone cleaning instrument (Novascan) (Figure 2b). The UV curing process resulted in a MY133-V2000 film of ∼50 μm thickness.
Figure 2.

Fabrication of the MY133-V2000 polymer film. (a, b) Suitable uniform film thickness was achieved by using a Teflon film as a spacer between two glass plates that are pressed together. The liquid polymer was then cured by using UV light. (c, d) The cured polymer film was cut into proper sizes by using a razor blade and glued onto the 3D-printed channel. The fully assembled channel is hermetically sealed and supports biofilm growth under fluid flow.
2.3. Flow Channel Assembly
For channel assembly, a piece of film, slightly larger than the detection window, was cut by using a razor blade (Figure 2c). The film piece was sterilized by immersing it into 70% ethanol and allowed to dry out at room temperature. The film piece was then glued onto the channel by using LOCA-133 adhesive (My Polymers, Israel) to make an optical transparent, hermetically sealed window (Figure 2d).
2.4. Flow Channel Operation
Kanamycin resistant S. oneidensis MR-1, constitutively expressing the green fluorescence protein (GFP), was cultured at 30 °C overnight in LB medium with 50 μg/mL Kanamycin. Overnight cultures were diluted 100 times into the same culture medium, grown to an optical density at 600 nm (OD600) of 0.4–1.0, and then diluted to OD600 = 0.05 by M9 medium with 0.05% (w/v) casamino acids before channel inoculation. For the results reported in this paper, a 3 mm2 coverslip coated by poly(l-lysine) was set on the bottom of the upper channel. The channel was then sterilized by using 70% ethanol and rinsed with ddH2O (double distilled water). The channel was then inoculated with live bacterial cell cultures by using a syringe. After inoculation, the channel was mounted on a piezo-nanopositioning stage (Mad City Laboratories, NanoOP100HS) and immersed in the basin medium (water or sucrose solution to match the refractive index of the growth media). The channel inlet port was connected to a syringe pump (Harvard Apparatus, Model 22), and the channel outlet port was connected to a waste container by using PVC tubing. Before medium flow through the channel was initiated, cells were given an hour to attach to the poly(l-lysine)-coated coverslip. Then, the flow rate was ramped up to 0.5 mL/h for 20 min to flush away nonadherent cells. Next, the flow rate was reduced to 0.03 mL/h for the duration of imaging.
GFP fluorescence was excited by using 488 nm light sheet excitation. Biofilms were imaged every 30 min. At each time point, a 3D image stack containing 301 2D slices was recorded using a 235 nm step size between slices. Each slice was acquired with a short 10 ms exposure time to reduce motion blur from loosely attached and therefore wiggling cells.
2.5. Lattice Light Sheet Evaluation
The polymer film that confines the live cell specimens in the flow channel introduces refractive index boundaries in both the optical excitation and emission paths (Figure 3). To reduce the optical aberrations that may result because of these refractive index boundaries, the objective lenses were immersed in a sucrose solution that had the same refractive index as the medium in the channel (RI = 1.3350, M9 medium in this experiment). The refractive index of the polymer film itself is 1.3333. Differences between the refractive index of the immersion medium, the polymer film, and the growth medium will lead to refraction of the excitation and emission light according to Snell’s law. A previous study has computationally shown that precise refractive index matching is crucial for producing a high quality lattice light sheet.39 We therefore evaluated the importance of refractive index matching experimentally using 488 nm laser excitable fluorescent beads (200 nm FluoSpheres, Thermo Fisher) as calibration samples. Beads were coated on a 3 × 3 mm2 coverslip (Deckglaser). The coverslip was positioned into the channel below the observation window (see Figure 2d). A hexagonal lattice light sheet and a square lattice light sheet were used for illumination separately. By visualizing the intensity change of a bead during a scan, a cross section of the lattice pattern at the focal plane was generated, as described previously.22 An open window (i.e., no polymer foil) was used as a positive control for perfect refractive index matching. As test cases we used two different polymer foils: a 50 μm thick fluorinated ethylene propylene Teflon (FEP Teflon, DuPont) film and MY133-V2000 (My Polymers, Israel). FEP Teflon is a commonly used material in light sheet microscopy application because its refractive index is close to that of water (1.3440 vs 1.3327).
Figure 3.

Schematic for lattice light sheet imaging. (a) Arrangement of two objectives and the microfluidic channel. (b) Excitation and emission light paths for lattice light sheet imaging. Refractive index differences between the polymer film and medium lead to optical aberractions (due to ray deflections or wavefront distortions).
2.6. Resolution Evaluation
In a second
set of measurements, we evaluated the size of the microscope’s
point-spread function (PSF) for different polymer foils. We evaluated
the full width at half-maximum (FWHM) of the PSFs of 200 nm fluorescence
beads (FluoSpheres, Thermo Fisher). We first scanned the lattice light
sheet and the detection objective simultaneously along the z-axis to obtain a 3D volume of a fluorescence bead. Then,
an XZ image of the PSF was generated by the maximum
intensity projection. This XZ projection image was
then fitted by a 2D Gaussian function, 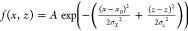 , where σx is the standard deviation
along the x-axis and
σz is the standard deviation along
the z-axis. The FWHM was then calculated by using
FWHMz/x =
, where σx is the standard deviation
along the x-axis and
σz is the standard deviation along
the z-axis. The FWHM was then calculated by using
FWHMz/x = 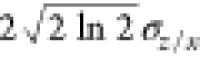 .
.
2.7. Biofilm Images Evaluation
The quality of experimental biofilm images was evaluated by estimating the resolution and signal-to-background ratio. For resolution estimation, we used a previously reported decorrelation analysis.42 To estimate the signal-to-background ratios (SBRs), we manually determined the intensities of five “signal” and five “background” regions in the images. The SBRs were computed as the mean signal intensity divided by the mean background intensity.
2.8. Volumetric Image Stitching and Display
To image 3D biofilms that are larger than the field-of-view of the LLSM, a tiled scan was applied. Volumetric tiles were aligned through pairwise phase correlation and global optimization using BigSticher.43 To minimize boundary artifacts, less weight (a cosine-shaped fade-out) was placed on border voxels of the input stacks. Final 3D views were rendered in ChimeraX.44
3. Results and Discussion
3.1. Microscope Performance When Imaging through Polymer Films
The change from an open sample platform to an enclosed channel introduces four additional refractive index boundaries: two in the excitation path and two in the emission path (Figure 3). To determine the influence of these additional refractive boundaries, we recorded the xz cross section of the lattice light sheet pattern. The light sheet cross sections show minimal distortions from an ideal lattice pattern when the channel window is not covered by a polymer foil (Figure 4a). When the window is covered with a MY133-V2000 polymer film, slight distortions begin to manifest, and when the window is covered by FEP Teflon, more severe blurring is evident (Figure 4b,c). The refractive index difference between FEP Teflon and water is only 0.0113, indicating that better refractive index matching is required. The refractive index difference between MY133-V2000 and water is 0.0006. Indeed, this polymer material provides a lattice pattern that more closely resembles that obtained without a polymer window. These results show that refractive index matching is a crucial parameter for optimizing imaging performance in LLSM.
Figure 4.

Evaluation of the effect of refractive index mismatch. Cross-sectional profiles of the lattice light sheet at the focal plane when imaged through different window materials: (a) no polymer, (b) MY133-V2000 polymer, and (c) FEP. Cross-sectional profiles of 200 nm fluorescent beads when imaged through different window materials: (d) no polymer, (e) MY133-V2000 polymer, and (f) FEP.
The superiority of the MY133-V2000 polymer was further confirmed by measuring the lateral and longitudinal FWHM of 200 nm fluorescence bead images. These images represent the size of the microscopes’ point spread function (PSF) convolved with the size of the 200 nm diameter fluorescence beads. As expected, the smallest FWHM values were obtained when no polymer is present in the light path (Figure 4d). When the channel window is covered with MY133-V2000 polymer, the FWHM increases slightly (Figure 4e), and when the channel window is covered with FEP Teflon, the largest FWHM is obtained for the conditions tested here (Figure 4f). Because the same types of beads were imaged under all conditions, the increase in the FWHM of the bead images can be attributed to an increase in the microscope’s PSF. These results show again that better refractive index matching results in less severe optical aberrations and thus in smaller PSF sizes, which will ultimately result in crisper, higher resolution images. For the materials tested here, MY133-V2000 polymer films produced a smaller PSF than FEP films. Therefore, we used the MY133-V2000 polymer for channel construction in all subsequent experiments.
3.2. Live-Cell LLSM Imaging of Bacterial Biofilms in Flow Channels
To test the performance of the flow channels with a live specimen, we acquired time-lapse 3D stacks of S. oneidensis MR-1 biofilms every 30 min for 20 h at 30 °C. A small number of surface-attached cells developed into a multilayer biofilm that eventually covered the whole field of view at the 20 h time point (Figure 5a). These results indicate that bacteria continue to proliferate within the flow channel and build biofilm structures in the presence of fluid flow, consistent with previous reports.45−47 Leaching of un-cross-linked chemical compounds from the 3D-printed channel body is therefore not a phototoxicity concern, at least for S. oneidensis MR-1. Visual inspection of the obtained images show densely packed cells bodies, indicating that cellular resolution is obtained at every time point without any noticeable degradation in image quality. To quantify these observations, we evaluated the resolution and signal-to-background ratio of the images over time (Figure 5b). Although the SBR decreases as biofilms grow larger and denser, SBRs of >2 were maintained at every time point. The decreased SBRs can be attributed to an increased background due to greater light scattering off of the bacterial cells. Estimation of the image resolution showed that a spatial resolution of ∼500 nm was maintained over 20 h. These results demonstrate that long-term single-cell biofilm imaging can be performed by using LLSM and the flow channels reported here.
Figure 5.

Live-cell imaging of GFP expressing S. oneidensis MR-1 cells. (a) Maximum intensity projections show the initial 20 h of S. oneidensis MR-1 biofilm development under fluid flow. The inset in the first image shows a phase contrast image of isolated S. oneidensis MR-1 cells on a glass coverslip. (b) Image resolution and signal-to-background ratio (SBR) over 20 h of imaging.
To demonstrate the advantage of using LLSM for long duration imaging, we have compared photobleaching between the LLSM and a spinning disk confocal microscope (Nikon Ti2 inverted microscope with a Yokogawa CSU-W1 SoRa spinning disk) (Figure S1). Comparisons were made by recording image volumes with similar voxel resolution (∼100 nm) and similar initial SBRs using GFP expressing Shewanella oneidensis MR-1 biofilms. Consistent with previous reports comparing light sheet- to confocal-based approaches, our results show about an order of magnitude slower photobleaching when using LLSM. The decreased photobleaching rate of LLSM thus enables either long-term time lapse image without substantial degradation of fluorescence intensity or increased frame rates (i.e., better time resolution) at comparable photobleaching rates. For the last image volume in Figure S1, the SBR obtained by the LLSM is ∼56% higher than the SBR obtained by the spinning disk confocal microscope (2.57 vs 1.65). As systematically assessed in a recent study,40 an SBR of 2.57 vs 1.65 can make an important difference for obtaining (or not obtaining) accurate cell segmentation results.
Previous studies have shown that S. oneidensis MR-1 biofilms form mushroom-like 3D structures after several days of development under fluid flow conditions.45,46 To test whether such structures also manifest in our flow channels, we repeated the above experiment but continued to image until the 72 h mark. S. oneidensis MR-1 biofilms indeed formed large mushroom-like structures that extended to about 20 μm above the growth substrate surface. The size of these structures is larger than the field of view of the LLSM. Therefore, a tiled image acquisition had to be used to capture these structures in their entirety. These volumetric image tiles were then computationally stitched together43 into a 40 × 32 × 22 μm3 image volume (Figure 6a). As is the case for every optical microscopy modality, image quality decreases when imaging deeper into a biological specimen that itself contains numerous refractive index boundaries. To quantify this effect in our images, we estimated the image resolution and SBR as a function of biofilm depth using the tallest mushroom-like structure in the imaged volume. SBR and spatial resolution in the selected image continually decreased as imaging depth increased (Figure 6b). However, even at the deepest part of the S. oneidensis MR-1 biofilm, cell bodies remain clearly visible at an estimated resolution better than 600 nm and an SBR > 1.5. Preliminary segmentation results using BCM3D40 indeed show physiologically reasonable cell shapes for a vast majority of cells (Figure 6c and Movie S1). We note, however, that cells located at the deepest parts of thick biofilms are still challenging for segmentation due to the lower contrast and resolution. Future work will therefore focus on increasing the contrast and resolution in bacterial biofilm images. While the structured illumination mode of the LLSM can provide higher spatial resolution and better contrast, such improvements come at a cost of higher photobleaching/phototoxicity.22 Software solutions that can process images with limited resolution and low SBRs will therefore play an important role. In light of these challenges, we are developing a segmentation pipeline that is more robust to low SBR images. Furthermore, CNN-based image processing modules, such as CARE10 and Noise2Void,49 have shown great promise for contrast and resolution enhancement and denoising. Incorporating these tools into the segmentation workflow should help to further improve segmentation accuracies.
Figure 6.

Live-cell imaging for GFP expressing S. oneidensis MR-1 biofilms. (a) 3D rendering and selected 2D slices of a mushroom-like structure with an S. oneidensis MR-1 biofilm after 72 h of growth under fluid flow conditions. Colored rectangles in the 3D rendering indicate the position for the 2D slices shown to the right. The red dashed rectangle indicates the region used for evaluation in panel b. (b) Resolution and signal-to-background ratio (SBRs) as a function of imaging depth. (c) Preliminary segmentation results for the image shown in panel a. Different colors indicate different cells. White rectangles indicate two regions whose architectural properties are further analyzed in Figure S2. Image slices are the same as in panel a, as indicated by the colored outlines.
Two regions (indicated in Figure 6c) were further selected for a quantitative analysis of architectural parameters, including distance to the nearest neighbor, distance to the substrate surface, elevation angle, and azimuthal angle (Figure S2). The similar distribution of nearest-neighbor distances indicates these two biofilm regions have similar cell density. In region 1, 41% of cells are more than 10 μm above the substrate surface compared to only 8% of cells in region 2, which indicates region 1 is a taller biofilm structure. The generally low elevation indicates the number of vertically oriented cells is low in both regions, in contrast to what is observed for submerged Vibrio cholerae biofilms.12,50,51 In addition, the two peaks at 0°/360° and 180° of the azimuthal angle distribution suggest bacterial cells in these two regions tend to align with the flow direction, which is consistent with Vibrio cholerae biofilms exposed to high shear stresses due to fluid flow.11 Together these results demonstrate that our LLSM-compatible flow channels enable long-term time-lapse imaging of the complex 3D cellular architecture within bacterial biofilms.
4. Conclusions
Owing to its high spatiotemporal resolution, low photobleaching, and minimal phototoxicity, LLSM, and high-NA light-sheet-based fluorescence microscopy modalities in general, have emerged as the method of choice for live-cell imaging. Depending on the implementation, specimens are imaged from top to bottom or from bottom to top. Because of the open-on-top imaging geometry of the initial LLSM implementation, this microscope modality has not been applicable for microbiological research for which sample containment is paramount. Here, we have addressed this limitation by integrating LLSM with 3D-printed microfluidic flow channels. These channels enable top-to-bottom imaging of bacterial biofilms at unprecedented spatiotemporal resolution on arbitrary and even nontransparent surfaces. Imaging is performed through an ultrathin polymer film that closely matches the refractive index of the aqueous bacterial growth medium and does not itself get colonized by bacterial biofilms. Precise refractive index matching (Δn < 10–3) was found to be necessary to minimize optical aberrations and thereby enable high-resolution imaging. By use of MY133-V2000 polymer films, it was possible to record 3D time-lapse images of bacterial biofilms at cellular resolution over periods of several days without noticeable degradation in image quality.
The reported LLSM-integrated microfluidic system isolates biofilm samples from the outside environment, which prevents contamination of the microscope components and provides a precisely controllable physicochemical environment for long duration time-lapse imaging. In this study, we recorded the colonization of glass surfaces by S. oneidensis MR-1 biofilms under fluid flow over a time period of 3 days, visualizing the evolution of single surface-attached cells into a large 3D biofilm. Longer imaging experiments are possible. While the present channel enables imaging of bacterial populations growing on abiotic substrates, we envision that with minor modifications the current design can be adapted to image bacterial population interacting with human organoid-derived epithelia, which have recently been stably reconstituted in dual-channel microphysiological devices.52,53 Visualizing how single bacterial cells cooperate or antagonize each other in heterogeneous biofilm environments will provide important insights for the rational design of microbial ecosystems with desirable functional capabilities in physiologically relevant environments.54−57
Acknowledgments
This work was supported in part by the US National Institute of General Medical Sciences Grant 1R01GM139002 (A.G.). We thank Scott Karas and Dr. James Landers for help with 3D printing the microfluidic channels. We thank Dr. Ariel Pani for help with acquiring confocal microscopy data.
Supporting Information Available
The Supporting Information is available free of charge at https://pubs.acs.org/doi/10.1021/acs.jpcb.1c07759.
Figure S1: quantitative comparison of photobleaching for LLSM and spinning disk confocal microscopy; Figure S2: architectural parameters comparison between two selected regions from Figure 6 (PDF)
3D-rendered movie of preliminary segmentation results of a mushroom-like structure S. oneidensis MR-1 biofilm after 72 h of continuous growth (AVI)
Author Contributions
|| J.Z. and M.Z. contributed equally to this work; J.Z., M.Z., and A.G. designed research; J.Z., M.Z., Y.W., and E.D. performed research; J.Z., M.Z., Y.W., E.D., and A.G. analyzed data; and J.Z., M.Z., Y.W., E.D., and A.G. wrote the paper.
The authors declare no competing financial interest.
Special Issue
Published as part of The Journal of Physical Chemistry virtual special issue “W. E. Moerner Festschrift”.
Supplementary Material
References
- Flemming H.-C.; Wingender J. The biofilm matrix. Nat. Rev. Microbiol. 2010, 8 (9), 623–633. 10.1038/nrmicro2415. [DOI] [PubMed] [Google Scholar]
- Jayathilake P. G.; Gupta P.; Li B.; Madsen C.; Oyebamiji O.; Gonzalez-Cabaleiro R.; Rushton S.; Bridgens B.; Swailes D.; Allen B.; et al. A mechanistic Individual-based Model of microbial communities. PLoS One 2017, 12 (8), e0181965. 10.1371/journal.pone.0181965. [DOI] [PMC free article] [PubMed] [Google Scholar]
- Nadell C. D.; Drescher K.; Foster K. R. Spatial structure, cooperation and competition in biofilms. Nat. Rev. Microbiol. 2016, 14 (9), 589. 10.1038/nrmicro.2016.84. [DOI] [PubMed] [Google Scholar]
- Flemming H. C.; Wingender J.; Szewzyk U.; Steinberg P.; Rice S. A.; Kjelleberg S. Biofilms: an emergent form of bacterial life. Nat. Rev. Microbiol. 2016, 14 (9), 563–75. 10.1038/nrmicro.2016.94. [DOI] [PubMed] [Google Scholar]
- Nadell C. D.; Xavier J. B.; Foster K. R. The sociobiology of biofilms. FEMS microbiology reviews 2009, 33 (1), 206–224. 10.1111/j.1574-6976.2008.00150.x. [DOI] [PubMed] [Google Scholar]
- Yan J.; Bassler B. L. Surviving as a community: antibiotic tolerance and persistence in bacterial biofilms. Cell Host Microbe 2019, 26 (1), 15–21. 10.1016/j.chom.2019.06.002. [DOI] [PMC free article] [PubMed] [Google Scholar]
- Frost I.; Smith W. P.; Mitri S.; San Millan A.; Davit Y.; Osborne J. M.; Pitt-Francis J. M.; MacLean R. C.; Foster K. R. Cooperation, competition and antibiotic resistance in bacterial colonies. ISME J. 2018, 12 (6), 1582–1593. 10.1038/s41396-018-0090-4. [DOI] [PMC free article] [PubMed] [Google Scholar]
- De la Fuente-Núñez C.; Reffuveille F.; Fernández L.; Hancock R. E. Bacterial biofilm development as a multicellular adaptation: antibiotic resistance and new therapeutic strategies. Curr. Opin. Microbiol. 2013, 16 (5), 580–589. 10.1016/j.mib.2013.06.013. [DOI] [PubMed] [Google Scholar]
- Hall-Stoodley L.; Costerton J. W.; Stoodley P. Bacterial biofilms: from the natural environment to infectious diseases. Nat. Rev. Microbiol. 2004, 2 (2), 95–108. 10.1038/nrmicro821. [DOI] [PubMed] [Google Scholar]
- Weigert M.; Schmidt U.; Boothe T.; Müller A.; Dibrov A.; Jain A.; Wilhelm B.; Schmidt D.; Broaddus C.; Culley S.; et al. Content-aware image restoration: pushing the limits of fluorescence microscopy. Nat. Methods 2018, 15 (12), 1090–1097. 10.1038/s41592-018-0216-7. [DOI] [PubMed] [Google Scholar]
- Hartmann R.; Singh P. K.; Pearce P.; Mok R.; Song B.; Díaz-Pascual F.; Dunkel J.; Drescher K. Emergence of three-dimensional order and structure in growing biofilms. Nat. Phys. 2019, 15 (3), 251–256. 10.1038/s41567-018-0356-9. [DOI] [PMC free article] [PubMed] [Google Scholar]
- Qin B.; Fei C.; Bridges A. A.; Mashruwala A. A.; Stone H. A.; Wingreen N. S.; Bassler B. L. Cell position fates and collective fountain flow in bacterial biofilms revealed by light-sheet microscopy. Science 2020, 369 (6499), 71–77. 10.1126/science.abb8501. [DOI] [PMC free article] [PubMed] [Google Scholar]
- Stelzer E. H. Light-sheet fluorescence microscopy for quantitative biology. Nat. Methods 2015, 12 (1), 23–26. 10.1038/nmeth.3219. [DOI] [PubMed] [Google Scholar]
- Power R. M.; Huisken J. A guide to light-sheet fluorescence microscopy for multiscale imaging. Nat. Methods 2017, 14 (4), 360–373. 10.1038/nmeth.4224. [DOI] [PubMed] [Google Scholar]
- Jemielita M.; Taormina M. J.; DeLaurier A.; Kimmel C. B.; Parthasarathy R. Comparing phototoxicity during the development of a zebrafish craniofacial bone using confocal and light sheet fluorescence microscopy techniques. Journal of biophotonics 2013, 6 (11–12), 920–928. 10.1002/jbio.201200144. [DOI] [PMC free article] [PubMed] [Google Scholar]
- Voleti V.; Patel K. B.; Li W.; Campos C. P.; Bharadwaj S.; Yu H.; Ford C.; Casper M. J.; Yan R. W.; Liang W.; et al. Real-time volumetric microscopy of in vivo dynamics and large-scale samples with SCAPE 2.0. Nat. Methods 2019, 16 (10), 1054–1062. 10.1038/s41592-019-0579-4. [DOI] [PMC free article] [PubMed] [Google Scholar]
- Parthasarathy R. Monitoring microbial communities using light sheet fluorescence microscopy. Curr. Opin. Microbiol. 2018, 43, 31–37. 10.1016/j.mib.2017.11.008. [DOI] [PMC free article] [PubMed] [Google Scholar]
- Olarte O. E.; Andilla J.; Gualda E. J.; Loza-Alvarez P. Light-sheet microscopy: a tutorial. Adv. Opt. Photonics 2018, 10 (1), 111–179. 10.1364/AOP.10.000111. [DOI] [Google Scholar]
- Rosenberg J.; Cao G.; Borja-Prieto F.; Huang J. Lattice light-sheet microscopy multi-dimensional analyses (LaMDA) of T-cell receptor dynamics predict T-cell signaling states. Cell systems 2020, 10 (5), 433. 10.1016/j.cels.2020.04.006. [DOI] [PMC free article] [PubMed] [Google Scholar]
- Mimori-Kiyosue Y. Imaging mitotic processes in three dimensions with lattice light-sheet microscopy. Chromosome Res. 2021, 29, 37. 10.1007/s10577-021-09656-3. [DOI] [PMC free article] [PubMed] [Google Scholar]
- Manley H. R.; Potter D. L.; Heddleston J. M.; Chew T. L.; Keightley M. C.; Lieschke G. J. Frontline Science: Dynamic cellular and subcellular features of migrating leukocytes revealed by in vivo lattice lightsheet microscopy. J. Leukocyte Biol. 2020, 108 (2), 455–468. 10.1002/JLB.3HI0120-589R. [DOI] [PubMed] [Google Scholar]
- Chen B.-C.; Legant W. R.; Wang K.; Shao L.; Milkie D. E.; Davidson M. W.; Janetopoulos C.; Wu X. S.; Hammer J. A.; Liu Z. Lattice light-sheet microscopy: imaging molecules to embryos at high spatiotemporal resolution. Science 2014, 346 (6208), 1304. 10.1126/science.1257998. [DOI] [PMC free article] [PubMed] [Google Scholar]
- Wu Y.; Wawrzusin P.; Senseney J.; Fischer R. S.; Christensen R.; Santella A.; York A. G.; Winter P. W.; Waterman C. M.; Bao Z.; et al. Spatially isotropic four-dimensional imaging with dual-view plane illumination microscopy. Nat. Biotechnol. 2013, 31 (11), 1032–1038. 10.1038/nbt.2713. [DOI] [PMC free article] [PubMed] [Google Scholar]
- Gao R.; Asano S. M.; Upadhyayula S.; Pisarev I.; Milkie D. E.; Liu T.-L.; Singh V.; Graves A.; Huynh G. H.; Zhao Y.; et al. Cortical column and whole-brain imaging with molecular contrast and nanoscale resolution. Science 2019, 363 (6424), eaau8302. 10.1126/science.aau8302. [DOI] [PMC free article] [PubMed] [Google Scholar]
- Høiby N.; Ciofu O.; Bjarnsholt T. Pseudomonas aeruginosa biofilms in cystic fibrosis. Future Microbiol. 2010, 5 (11), 1663–1674. 10.2217/fmb.10.125. [DOI] [PubMed] [Google Scholar]
- Nickerson K. P.; Chanin R. B.; Sistrunk J. R.; Rasko D. A.; Fink P. J.; Barry E. M.; Nataro J. P.; Faherty C. S. Analysis of Shigella flexneri Resistance, Biofilm Formation, and Transcriptional Profile in Response to Bile Salts. Infect. Immun. 2017, 10.1128/IAI.01067-16. [DOI] [PMC free article] [PubMed] [Google Scholar]
- Langdon S. P. Cell culture contamination. Cancer Cell Culture 2003, 88, 309–317. 10.1385/1-59259-406-9:309. [DOI] [PubMed] [Google Scholar]
- Kim J.; Park H.-D.; Chung S. Microfluidic approaches to bacterial biofilm formation. Molecules 2012, 17 (8), 9818–9834. 10.3390/molecules17089818. [DOI] [PMC free article] [PubMed] [Google Scholar]
- Azeredo J.; Azevedo N. F.; Briandet R.; Cerca N.; Coenye T.; Costa A. R.; Desvaux M.; Di Bonaventura G.; Hébraud M.; Jaglic Z.; et al. Critical review on biofilm methods. Crit. Rev. Microbiol. 2017, 43 (3), 313–351. 10.1080/1040841X.2016.1208146. [DOI] [PubMed] [Google Scholar]
- Thomen P.; Robert J.; Monmeyran A.; Bitbol A.-F.; Douarche C.; Henry N. Bacterial biofilm under flow: first a physical struggle to stay, then a matter of breathing. PLoS One 2017, 12 (4), e0175197. 10.1371/journal.pone.0175197. [DOI] [PMC free article] [PubMed] [Google Scholar]
- Coyte K. Z.; Tabuteau H.; Gaffney E. A.; Foster K. R.; Durham W. M. Microbial competition in porous environments can select against rapid biofilm growth. Proc. Natl. Acad. Sci. U. S. A. 2017, 114 (2), E161–E170. 10.1073/pnas.1525228113. [DOI] [PMC free article] [PubMed] [Google Scholar]
- Yordanov S.; Neuhaus K.; Hartmann R.; Díaz-Pascual F.; Vidakovic L.; Singh P. K.; Drescher K. Single-objective high-resolution confocal light sheet fluorescence microscopy for standard biological sample geometries. Biomed. Opt. Express 2021, 12 (6), 3372–3391. 10.1364/BOE.420788. [DOI] [PMC free article] [PubMed] [Google Scholar]
- Yang B.; Chen X.; Wang Y.; Feng S.; Pessino V.; Stuurman N.; Cho N. H.; Cheng K. W.; Lord S. J.; Xu L.; et al. Epi-illumination SPIM for volumetric imaging with high spatial-temporal resolution. Nat. Methods 2019, 16 (6), 501–504. 10.1038/s41592-019-0401-3. [DOI] [PMC free article] [PubMed] [Google Scholar]
- Millett-Sikking A.; Dean K. M.; Fiolka R.; Fardad A.; Whitehead L.; York A. G.. High NA single-objective light-sheet. 2019; 10.5281/zenodo.3244420. [DOI]
- Yawata Y.; Nguyen J.; Stocker R.; Rusconi R. Microfluidic studies of biofilm formation in dynamic environments. J. Bacteriol. 2016, 198 (19), 2589–2595. 10.1128/JB.00118-16. [DOI] [PMC free article] [PubMed] [Google Scholar]
- Straub H.; Eberl L.; Zinn M.; Rossi R. M.; Maniura-Weber K.; Ren Q. A microfluidic platform for in situ investigation of biofilm formation and its treatment under controlled conditions. J. Nanobiotechnol. 2020, 18 (1), 1–12. 10.1186/s12951-020-00724-0. [DOI] [PMC free article] [PubMed] [Google Scholar]
- Raman K.; Murthy T. S.; Hegde G. Fabrication of refractive index tunable polydimethylsiloxane photonic crystal for biosensor application. Phys. Procedia 2011, 19, 146–151. 10.1016/j.phpro.2011.06.139. [DOI] [Google Scholar]
- Liu T.-L.; Upadhyayula S.; Milkie D. E.; Singh V.; Wang K.; Swinburne I. A.; Mosaliganti K. R.; Collins Z. M.; Hiscock T. W.; Shea J. Observing the cell in its native state: Imaging subcellular dynamics in multicellular organisms. Science 2018, 360 (6386), 900. 10.1126/science.aaq1392. [DOI] [PMC free article] [PubMed] [Google Scholar]
- Fan Y.-J.; Hsieh H.-Y.; Tsai S.-F.; Wu C.-H.; Lee C.-M.; Liu Y.-T.; Lu C.-H.; Chang S.-W.; Chen B.-C. Microfluidic channel integrated with a lattice lightsheet microscopic system for continuous cell imaging. Lab Chip 2021, 21 (2), 344–354. 10.1039/D0LC01009J. [DOI] [PubMed] [Google Scholar]
- Zhang M.; Zhang J.; Wang Y.; Wang J.; Achimovich A. M.; Acton S. T.; Gahlmann A. Non-invasive single-cell morphometry in living bacterial biofilms. Nat. Commun. 2020, 11 (1), 1–13. 10.1038/s41467-020-19866-8. [DOI] [PMC free article] [PubMed] [Google Scholar]
- Jeckel H.; Drescher K. Advances and opportunities in image analysis of bacterial cells and communities. FEMS Microbiol. Rev. 2020, 45, fuaa062. 10.1093/femsre/fuaa062. [DOI] [PMC free article] [PubMed] [Google Scholar]
- Descloux A.; Grußmayer K. S.; Radenovic A. Parameter-free image resolution estimation based on decorrelation analysis. Nat. Methods 2019, 16 (9), 918–924. 10.1038/s41592-019-0515-7. [DOI] [PubMed] [Google Scholar]
- Horl D.; Rojas Rusak F.; Preusser F.; Tillberg P.; Randel N.; Chhetri R. K.; Cardona A.; Keller P. J.; Harz H.; Leonhardt H.; Treier M.; Preibisch S. BigStitcher: reconstructing high-resolution image datasets of cleared and expanded samples. Nat. Methods 2019, 16 (9), 870–874. 10.1038/s41592-019-0501-0. [DOI] [PubMed] [Google Scholar]
- Pettersen E. F.; Goddard T. D.; Huang C. C.; Meng E. C.; Couch G. S.; Croll T. I.; Morris J. H.; Ferrin T. E. UCSF ChimeraX: Structure visualization for researchers, educators, and developers. Protein Sci. 2021, 30 (1), 70–82. 10.1002/pro.3943. [DOI] [PMC free article] [PubMed] [Google Scholar]
- Thormann K. M.; Saville R. M.; Shukla S.; Pelletier D. A.; Spormann A. M. Initial phases of biofilm formation in Shewanella oneidensis MR-1. J. Bacteriol. 2004, 186 (23), 8096–8104. 10.1128/JB.186.23.8096-8104.2004. [DOI] [PMC free article] [PubMed] [Google Scholar]
- Teal T. K.; Lies D. P.; Wold B. J.; Newman D. K. Spatiometabolic stratification of Shewanella oneidensis biofilms. Appl. Environ. Microbiol. 2006, 72 (11), 7324–7330. 10.1128/AEM.01163-06. [DOI] [PMC free article] [PubMed] [Google Scholar]
- Thormann K. M.; Saville R. M.; Shukla S.; Spormann A. M. Induction of rapid detachment in Shewanella oneidensis MR-1 biofilms. J. Bacteriol. 2005, 187 (3), 1014–1021. 10.1128/JB.187.3.1014-1021.2005. [DOI] [PMC free article] [PubMed] [Google Scholar]
- Krull A.; Buchholz T.-O.; Jug F. In Noise2void-learning denoising from single noisy images, Proceedings of the IEEE/CVF Conference on Computer Vision and Pattern Recognition, 2019; pp 2129–2137.
- Yan J.; Sharo A. G.; Stone H. A.; Wingreen N. S.; Bassler B. L. Vibrio cholerae biofilm growth program and architecture revealed by single-cell live imaging. Proc. Natl. Acad. Sci. U. S. A. 2016, 113 (36), E5337–E5343. 10.1073/pnas.1611494113. [DOI] [PMC free article] [PubMed] [Google Scholar]
- Drescher K.; Dunkel J.; Nadell C. D.; Van Teeffelen S.; Grnja I.; Wingreen N. S.; Stone H. A.; Bassler B. L. Architectural transitions in Vibrio cholerae biofilms at single-cell resolution. Proc. Natl. Acad. Sci. U. S. A. 2016, 113 (14), E2066–E2072. 10.1073/pnas.1601702113. [DOI] [PMC free article] [PubMed] [Google Scholar]
- Tovaglieri A.; Sontheimer-Phelps A.; Geirnaert A.; Prantil-Baun R.; Camacho D. M.; Chou D. B.; Jalili-Firoozinezhad S.; De Wouters T.; Kasendra M.; Super M. Species-specific enhancement of enterohemorrhagic E. coli pathogenesis mediated by microbiome metabolites. Microbiome 2019, 7 (1), 43. 10.1186/s40168-019-0650-5. [DOI] [PMC free article] [PubMed] [Google Scholar]
- Steinway S. N.; Saleh J.; Koo B.-K.; Delacour D.; Kim D.-H. Human Microphysiological Models of Intestinal Tissue and Gut Microbiome. Front. Bioeng. Biotechnol. 2020, 10.3389/fbioe.2020.00725. [DOI] [PMC free article] [PubMed] [Google Scholar]
- Fredrickson J. K. Ecological communities by design. Science 2015, 348 (6242), 1425–1427. 10.1126/science.aab0946. [DOI] [PubMed] [Google Scholar]
- Grosskopf T.; Soyer O. S. Synthetic microbial communities. Curr. Opin. Microbiol. 2014, 18, 72–7. 10.1016/j.mib.2014.02.002. [DOI] [PMC free article] [PubMed] [Google Scholar]
- Jagmann N.; Philipp B. Design of synthetic microbial communities for biotechnological production processes. J. Biotechnol. 2014, 184, 209–18. 10.1016/j.jbiotec.2014.05.019. [DOI] [PubMed] [Google Scholar]
- Kouzuma A.; Kato S.; Watanabe K. Microbial interspecies interactions: recent findings in syntrophic consortia. Front. Microbiol. 2015, 6, 477. 10.3389/fmicb.2015.00477. [DOI] [PMC free article] [PubMed] [Google Scholar]
Associated Data
This section collects any data citations, data availability statements, or supplementary materials included in this article.