Abstract
A model to quantitatively characterize the effect of evinacumab, an investigational monoclonal antibody against angiopoietin‐like protein 3 (ANGPTL3) on lipid trafficking is needed. A quantitative systems pharmacology (QSP) approach was developed to predict the transient responses of different triglyceride (TG)‐rich lipoprotein particles in response to evinacumab administration. A previously published hepatic lipid model was modified to address specific queries relevant to the mechanism of evinacumab and its effect on lipid metabolism. Modifications included the addition of intermediate‐density lipoprotein and low‐density lipoprotein compartments to address the modulation of lipoprotein lipase (LPL) activity by evinacumab, ANGPTL3 biosynthesis and clearance, and a target‐mediated drug disposition model. A sensitivity analysis guided the creation of virtual patients (VPs). The drug‐free QSP model was found to agree well with clinical data published with the initial hepatic liver model over simulations ranging from 20 to 365 days in duration. The QSP model, including the interaction between LPL and ANGPTL3, was validated against clinical data for total evinacumab, total ANGPTL3, and TG concentrations as well as inhibition of apolipoprotein CIII. Free ANGPTL3 concentration and LPL activity were also modeled. In total, seven VPs were created; the lipid levels of the VPs were found to match the range of responses observed in evinacumab clinical trial data. The QSP model results agreed with clinical data for various subjects and was shown to characterize known TG physiology and drug effects in a range of patient populations with varying levels of TGs, enabling hypothesis testing of evinacumab effects on lipid metabolism.
Study Highlights.
WHAT IS THE CURRENT KNOWLEDGE ON THE TOPIC?
Evinacumab, an investigational angiopoietin‐like protein 3 inhibitor, was demonstrated to reduce triglycerides (TGs), low‐density lipoprotein cholesterol, and non–high‐density lipoprotein cholesterol levels in healthy volunteers and in patients with homozygous familial hypercholesterolemia who were receiving stable lipid lowering therapies. To better understand the evinacumab mechanism of action, a model quantitatively characterizing lipid metabolism following evinacumab administration is needed.
WHAT QUESTION DID THIS STUDY ADDRESS?
Can quantitative systems pharmacology (QSP) modeling approaches evaluate changes in lipid trafficking and predict the transient responses of different TG‐rich lipoprotein particles in response to the downstream modulation of lipoprotein lipase activity following evinacumab administration?
WHAT DOES THIS STUDY ADD TO OUR KNOWLEDGE?
A novel approach determining TG flux between particles, without an explicit apolipoprotein B balance, was used. The QSP model integrates current understanding of evinacumab and target biology and clinical trial data; this allows hypothesis testing, enabling a greater understanding of the mechanism of action of evinacumab.
HOW MIGHT THIS CHANGE CLINICAL PHARMACOLOGY OR TRANSLATIONAL SCIENCE?
Greater understanding of the mechanism of action of evinacumab and the changes in lipid metabolism following evinacumab administration potentially enables physicians to maximize the therapeutic benefit for patients with hypertriglyceridemia in different populations.
INTRODUCTION
Hypertriglyceridemia, or elevated triglycerides (TGs), is associated with an increased risk of atherosclerotic cardiovascular disease 1 , 2 , 3 ; severe hypertriglyceridemia (TGs ≥500 mg/dL) is a well‐known cause of acute pancreatitis. 4 , 5 , 6 , 7 There are many causes of hypertriglyceridemia, including abnormalities in peripheral lipolysis or the overproduction or impaired clearance of lipoprotein. 8
The metabolism of TG‐rich lipoproteins (TRLs) occurs via two major pathways. In the exogenous pathway, TGs from dietary fat are transported through the body in the form of chylomicrons, which are formed in the endoplasmic reticulum of the small intestine. 9 Once in the circulation, chylomicrons are hydrolyzed by lipoprotein lipase (LPL) located on the luminal surface of capillaries, producing free fatty acids (FFA) and chylomicron remnants. The FFAs are oxidized by various cell types, or stored in adipose tissue, while the chylomicron remnants are removed by the liver. 10
The endogenous pathway is regulated by the liver, with the synthesis and secretion of very‐low‐density lipoproteins (VLDLs) enabling the liver to remove excess TGs from cytosolic stores. 11 Hydrolysis of secreted VLDLs also occurs by the action of LPL‐mediated hydrolysis in the plasma, generating the smaller lipoproteins intermediate‐density lipoprotein (IDL) and low‐density lipoprotein (LDL). Some IDL is removed from circulation by the liver, while other IDL undergoes further catabolism by LPL and hepatic TG lipase to produce LDL particles. 12 The secretion of VLDLs by the liver is influenced by insulin and FFA content. 13
LPL is a key enzyme in the metabolism of TRLs, hydrolyzing TGs found in the core of chylomicrons and VLDLs. LPL is primarily expressed by myocytes and adipocytes and is transported to the capillary endothelium by the protein GPIHBP1. 14 , 15 The activity of LPL is regulated by several proteins, including apolipoprotein (Apo)CIII, ApoA5, and angiopoietin‐like proteins (ANGPTL) 3 and 4. 16 LPL expression in adipose tissue is also regulated according to nutritional (fasting vs. fed state) and hormonal status. For example, in fed conditions, insulin results in increased LPL activity, leading to the increased uptake of FFAs. 17
The overall metabolism of TRLs by both pathways is illustrated in Figure 1a, and the interaction between lipid metabolism and carbohydrate metabolism is illustrated in Figure 1b.
FIGURE 1.
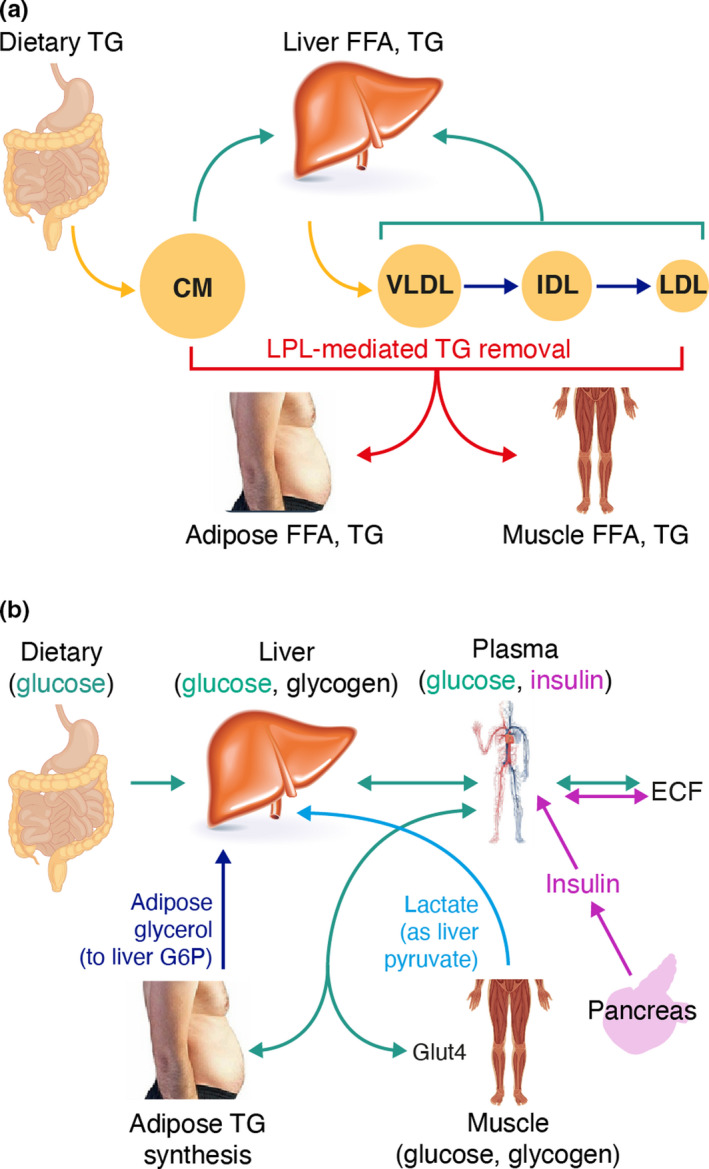
Physiological components of the model: (a) overview of triglyceride‐rich lipoprotein metabolism and (b) effect of carbohydrate metabolism on triglyceride metabolism. CM, chylomicron; ECF, extracellular fluid; FFA, free fatty acid; G6P, glucose 6‐phosphate; Glut4, glucose transporter type 4; IDL, intermediate‐density lipoprotein; LDL, low‐density lipoprotein; LPL, lipoprotein lipase; TG, triglyceride; VLDL, very‐low‐density lipoprotein
Approved TG‐lowering therapies have been shown to have limited efficacy or associations with adverse events or drug–drug interactions 18 , 19 , 20 , 21 , 22 ; therefore, alternative therapeutic options are needed for patients with hypertriglyceridemia. One alternative is therapies targeting ANGPTL3. ANGPTL3 plays a key role in lipid metabolism by inhibiting both LPL and endothelial lipase activity, 23 , 24 , 25 leading to the reduced clearance of TRLs upstream of LDL, raising plasma concentrations of TGs and high‐density lipoprotein cholesterol (HDL‐C). 26 In individuals, ANGPTL3 loss‐of‐function (LOF) variants are associated with lower LDL cholesterol (LDL‐C), TG, and HDL‐C levels. 27 , 28 , 29 , 30 Of note, the inhibition of LPL by ANGPTL proteins is influenced by the overall nutritional state; under fasting conditions, adipose LPL is inhibited by ANGPTL4, whereas under fed conditions, muscle LPL is inhibited by both ANGPTL3 and ANGPTL4. 31
Evinacumab is a fully human monoclonal antibody that binds to ANGPTL3. 32 , 33 , 34 Inhibition of ANGPTL3 with evinacumab in combination with stable lipid‐lowering therapies has been shown to reduce TGs, non‐HDL‐C, and LDL‐C in healthy human volunteers, in patients with homozygous familial hypercholesterolemia (HoFH), 32 , 33 , 35 or in subjects with mild‐to‐moderately elevated TGs and/or LDL‐C. 36 The changes in lipid parameters with evinacumab mirror the lipid phenotype observed in individuals with ANGPTL3 LOF variants. 27 , 28 , 29 , 30 Because of the complex nature of TRL metabolism, as described previously, there is an imminent need to develop a model that integrates our current knowledge of TRL metabolism with clinical data to better understand the mechanism of action of evinacumab.
Quantitative systems pharmacology (QSP) is a modeling approach that has been incorporated into most pharmaceutical and biotech research programs. 37 It integrates diverse mechanistic data to quantitatively evaluate the dynamic interactions between drug(s) and biological systems. 38 , 39 Several mechanistic QSP models have been developed evaluating various aspects of lipoprotein metabolism, 40 , 41 , 42 , 43 , 44 including modeling of the effect of various lipid‐lowering therapies. 45 , 46 , 47
The objective of this work was to develop a QSP modeling approach to evaluate changes in lipid trafficking following evinacumab administration and to further elucidate the mechanism of action of evinacumab to be able to predict the transient responses of different TRL particles in response to the downstream modulation of LPL activity by evinacumab. The QSP modeling platform is based on a previously published hepatic lipid model, 44 which provided a framework to study the effects of insulin resistance in multiple tissues on the accumulation of TGs in the liver. The hepatic lipid model has been augmented and adapted to enable specific queries relevant to the mechanism of evinacumab to be addressed, as described in methodology section.
METHODS
Development of the QSP modeling platform
Hepatic lipid model
The lipid model published by Pratt and colleagues 44 was implemented in SimBiology™ software (Mathworks, Natick, MA). This allowed MATLAB® scripting to be used to calibrate and test the representation of TG, glucose and insulin data, as published with the model. Modifications of the hepatic lipid model included a change in the initial concentration of liver glycogen from 48 to 300 mmol/L; a change in the Michaelis constant (Km) of hexokinase for glucokinase from 8 mmol/L to approximately 0.03 mmol/L; and parameter adjustments to ensure “appropriate” state values and transients, including adjustments to muscle energy usage to obtain the correct split between plasma glucose and FFAs as well as tuning parameters to obtain observed data on steady‐state values. 44
Overall modifications to the hepatic lipid model
To enable quantitative predictions of the effects of evinacumab on lipid metabolism, several modifications and adaptions to the previous hepatic lipid model were made. These included the following:
Addition of an extracellular fluid compartment to match the apparent volume of approximately 14 L established in intravenous glucose tolerance tests.
The effects of LPL, LDL receptor, and related receptors (e.g., LDL receptor‐related protein) and ApoCIII were added, including descriptors for generation, clearance, and activity.
The notional adenosine monophosphate variable, or P variable, was changed to an algebraic expression due to stiffness concerns. This function was used to switch muscle metabolism from carbohydrates to lipids and vice versa (refer to Data S1 for further details).
The unit description for insulin was modified (refer to Data S1 for further details).
When adjusting parameters in the initial hepatic liver model, it was observed that some states would vary without affecting the stable range, for example, those for glycogen and TG values. Therefore, where physiologically relevant, new functions were added, or the parameters were changed, so that the input and/or output functions had a more relevant relationship with respect to the value of the state, ensuring that the species remained in a physiologically reasonable range.
In addition, as the hepatic liver model contained only two plasma TG compartments (meal‐derived chylomicrons and hepatically derived VLDL), IDL‐TG and LDL‐TG compartments were added to enable more physiologically relevant TG uptake and particle progression. A target‐mediated drug disposition (TMDD) model was included. 48 Lastly, ANGPTL3 biosynthesis and clearance were included in the model. The modeling of TG flux between particles and the TMDD model are described in more detail in the following paragraphs.
The overall structure of the QSP lipid‐modeling platform is shown in Figure 2. Further details of the model, including the ordinary differential equations, rate laws, variables, and parameter values, are provided in the Supplement (Data S2 and Tables S1 and S2).
FIGURE 2.
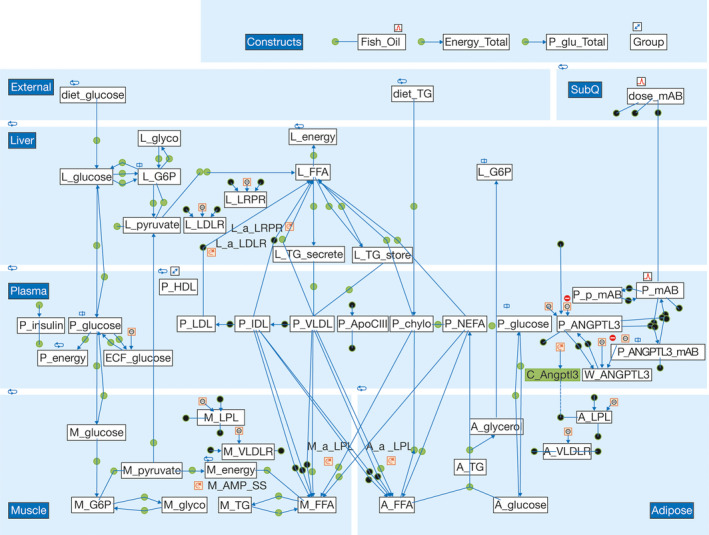
Graphical representation of the quantitative systems pharmacology model developed in SimBiology. The quantitative systems pharmacology model was created in SimBiology with MATLAB® scripting. At the top left of the diagram is shown the dietary input of glucose and triglycerides (TGs), whereas at the top right is shown the subcutaneous administration of evinacumab. Moving left to right down the figure are shown the liver, plasma, muscle, and adipose components (variables in each section denoted by L, P, M, and A precursors, respectively). All other abbreviations are defined in Table S1
QSP approach to model LPL effect on TG flux
A critical innovation in the development of the QSP lipid‐modeling platform was determining TG flux between TG‐containing particles without using an explicit particle number balance as measured by ApoB content. It was noted that most reports of TRL particle data are based on assays that define the particle size, and a review of the available data showed that the amount of TG per particle was relatively constant, suggesting that explicit modeling of ApoB was not necessary. Furthermore, as the available Regeneron Pharmaceuticals, Inc., trial data (NCT02107872 and NCT01749878) were comprehensive and reported TG for various nominal particles, the model was modified to represent LPL action as both removing TGs for use in tissue and also how said LPL action caused reclassification of TG‐containing particles. For example, LPL action on VLDL results in both TG uptake into tissue but also flux of TGs from VLDL to IDL sized particles. This approach was refined to include the effect of LPL action and particle size on whole particle receptor‐mediated uptake in the tissues.
Lipolysis of TG in VLDL by LPL activity in muscle and adipose tissue results in VLDL particles shrinking and becoming IDL particles. If it is assumed that the amount of TG in each particle remains constant, then we can calculate the flux of TG from VLDL to IDL as follows:
Here, the V2IDLratio is merely the amount of TG per IDL particle divided by the difference in the amount of TG between VLDL and IDL particles. A similar equation for TG transport from IDL to LDL was used.
Pharmacokinetic modeling
For the QSP model of ANGPTL3 action, it was crucial to understand the level of free (active) ANGPTL3. However, the available clinical trial data with evinacumab measured only total ANGPTL3 concentrations (total ANGPTL3 includes both free ANGPTL3 and ANGPTL3 bound to evinacumab). A TMDD model for evinacumab was incorporated to account for the different rates of clearance of free ANGPTL3 compared with evinacumab/ANGPTL3 complexes.
Model qualification
The drug‐free model (without evinacumab treatment) was tested for fit against multiple data sets. 3 , 49 , 50 Following the initial qualification of the model, the TMDD model predictions of free ANGPTL3 concentrations were integrated into the model to appropriately affect LPL activity. A sensitivity analysis using a finite difference method (parameter perturbed by ±10%; simulate for 10 days) was undertaken to identify parameters, both alone and in combination, which had strong effects on simulated outcomes. 51 This guided the creation of virtual patients (VPs), representing several classes of clinical phenotypes. The resulting models and VPs were then fit to clinical trial data.
RESULTS
Drug‐free QSP model testing
The initial hepatic lipid model created in SimBiology was calibrated and tested against the clinical data published with the model 44 and other available data sets 49 , 52 , 53 ; the model results agreed well with the previously published data. Following the development of the QSP lipid‐modeling platform, the drug‐free model (without evinacumab treatment) performance was compared with multiple published data sources. The model matched fasting values for each lipoprotein species, with all species exhibiting pseudo‐steady‐state conditions, and was stable over simulations ranging in duration from 20 to 365 days. The peak‐to‐peak variation exhibited over 35 days is shown in Figure 3; the diurnal variations are due to simulation of typical meal intake.
FIGURE 3.
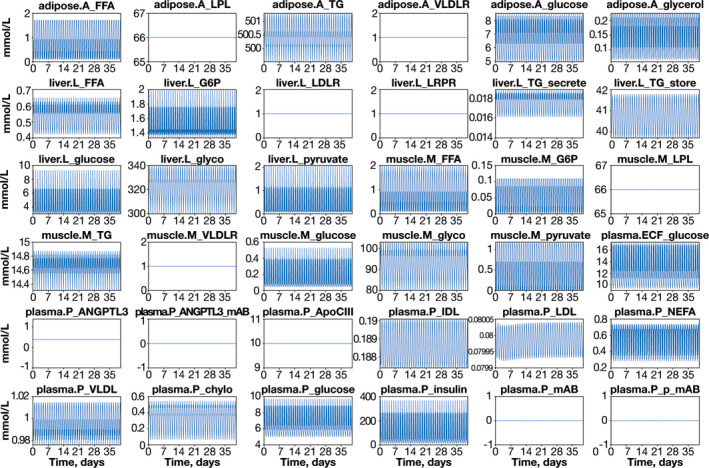
Stability test of the drug‐free quantitative systems pharmacology model. Diurnal variations are due to feeding. Meal times were modeled by algebraic equations, with specified meal times and equations for breakfast, lunch, and dinner; parameters were dependent on meal size. This method of simulation and plotting proved extremely sensitive in highlighting how close the model was to pseudo‐steady state. All abbreviations are defined in Table S1
Incorporation of the TMDD model
To be able to predict the effect of evinacumab treatment on lipid metabolism, a TMDD model was incorporated into the QSP model enabling the determination of the concentration of evinacumab as well as free and total ANGPTL3 concentrations. The model was found to fit the pharmacokinetic profile of evinacumab from clinical trial data across several doses of evinacumab (Figure S1). A physiological model, including the mechanism of interaction between LPL and ANGPTL3, was then tested and validated against clinical data (Figure 4).
FIGURE 4.
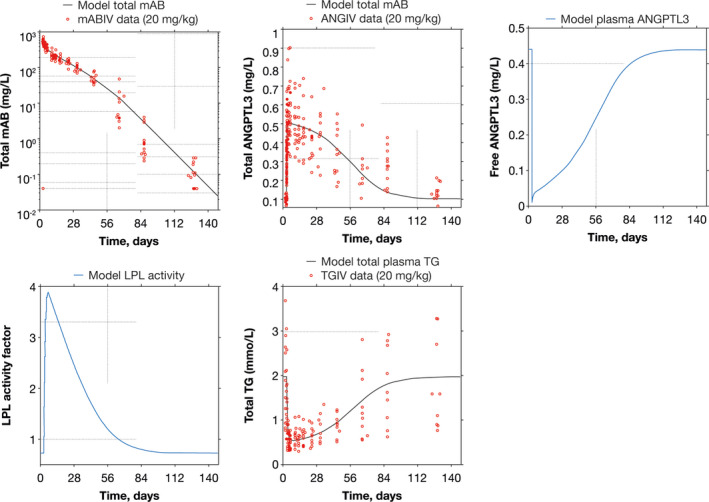
Quantitative systems pharmacology model simulation of evinacumab clinical trial data. Evinacumab clinical data taken from a phase I, single ascending dose study with evinacumab in subjects with hypertriglyceridemia (NCT01749878). ANGIV, angiopoietin‐like protein 3 time course data in intravenous administration; ANGPTL3, angiopoietin‐like protein 3; LPL, lipoprotein lipase; mAB, monoclonal antibody; mABIV, monoclonal antibody time course data in intravenous administration; TG, triglyceride; TGIV, triglyceride time course data in intravenous administration
Sensitivity analyses and fit with clinical trial data
Data from the single ascending dose study with evinacumab were used to create VPs (NCT01749878). 33 , 36 Sensitivity analyses were conducted using a finite difference method (parameter perturbed by ±10% and simulation run for 10 days) to identify influential parameters for the creation of VPs. The tornado diagram showing the single‐parameter sensitivity of TGs to parametric change is shown in Figure S2. Total TG was sensitive to ApoCIII, ANGPTL3, and LPL concentrations; adipose TG lipolysis to nonesterified fatty acid gain (betaf) was also shown to have influence on total TGs. Potential VPs were tested against multiple criteria, with only those that represented the trial phenotype and known physiological criteria being accepted for use. 44
In total, seven VPs were finalized, representing seven population types; these VPs were one baseline normal VP, five VPs with elevated TG, and one VP representing a patient with HoFH with extremely high levels of LDL‐C (parameter values for VPs are presented in Table S3). All VPs matched the range of responses observed in clinical trial data (Figure 5).
FIGURE 5.
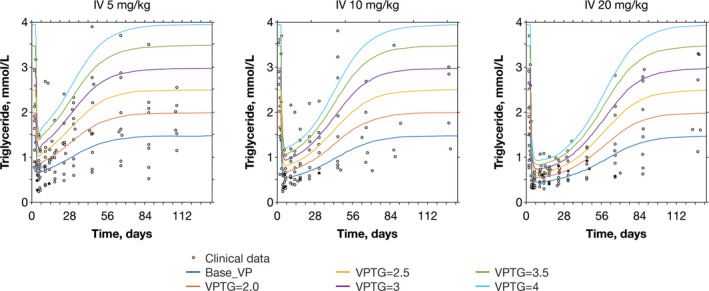
Simulation of observed evinacumab clinical trial data with VPs. Evinacumab clinical data taken from a phase I, single ascending dose study with evinacumab in subjects with hypertriglyceridemia (NCT01749878). IV, intravenous; TG, triglyceride; VP, virtual patient
The QSP model results agreed with in‐house clinical data (Figure 6).
FIGURE 6.
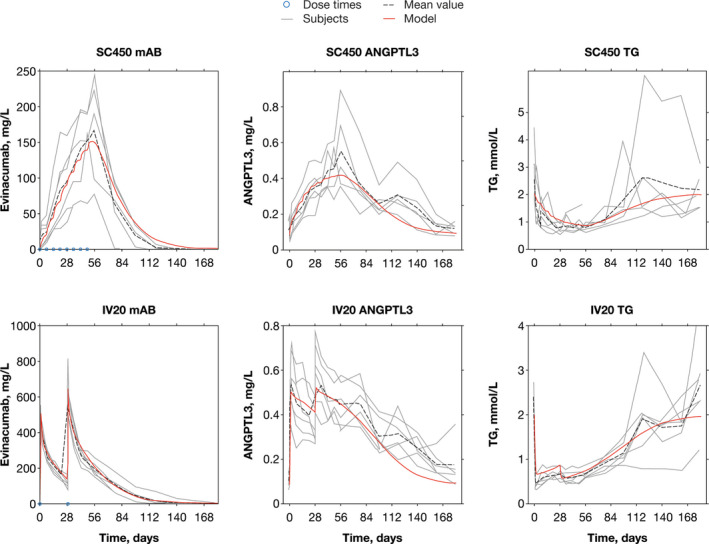
Quantitative systems pharmacology model simulation (red) overlaid on evinacumab clinical trial data for selected subjects. The solid red line represents the quantitative systems pharmacology model simulation, the dashed black line represents the mean value of observed clinical trial data, and the solid gray lines represent individual participant data. The blue dots represent evinacumab dosing, which was consistent across all separate IV and SC panels. Evinacumab clinical data taken from a phase I, multiple ascending dose study with evinacumab in subjects with hypertriglyceridemia (NCT02107872). The subjects were selected to show both SC and IV dosing at the higher evinacumab dose levels. ANGPTL3, angiopoietin‐like protein 3; IV, intravenous, mAb, monoclonal antibody; SC, subcutaneous; TG, triglyceride
DISCUSSION
This QSP modeling platform was developed with the aim to quantify the transient responses of different TRL particles to evinacumab therapy, enabling a better understanding of the clinical impact of treatment. For the QSP modeling platform to support this goal, several key elements needed to be achieved. First, the drug‐free QSP model had to fit the original data published with the Pratt et al. lipid model 44 and other relevant published data in metabolomic data sets. 54 Also, the pharmacokinetic component of the model had to fit evinacumab and total ANGPTL3 concentrations from clinical trial data. The integrated model (with evinacumab dosing) had to fit the TG clinical data for the various TRL particle types; the cohort of VPs had to represent the variability observed in evinacumab clinical data. Finally, the model and parameters matching the single ascending dose evinacumab trial data must also match other available clinical trial data. 35
Preliminary evaluation of the clinical pharmacokinetic data for evinacumab showed an increase in total ANGPTL3 concentrations after evinacumab administration. Prior experience with the pharmacokinetics of monoclonal antibodies, and the timing of the increase in total ANGPTL3 concentrations, suggested that this was due to a protective effect, with the evinacumab/ANGPTL3 complex being cleared more slowly than free ANGPTL3. Therefore, a TMDD model for evinacumab was incorporated. 55
At higher evinacumab doses and at earlier timepoints following evinacumab administration, a higher pharmacodynamic response was observed, which was found to be accurately represented by the QSP model. In contrast, at lower evinacumab doses and at later timepoints, smaller responses were observed in both the clinical trial data and QSP model data, hence leading to a lower ratio of response to noise in these situations. However, we are confident that the QSP model accurately represents the most clinically important areas of the pharmacokinetics and pharmacodynamic response.
The QSP model was shown to allow the stable (>1 year) and accurate representation of plasma concentrations of TGs, glucose, and insulin. Furthermore, the use of a physiologically based TMDD model allowed the representation and prediction of clinical trial data, reflecting changes in evinacumab, total ANGPTL3, and TG concentrations. The TMDD approach also allowed the inference of unmeasured quantities of interest, such as the concentration of free ANGPTL3. Further confidence in the model was obtained from the replication of clinical trial data with ApoCIII siRNA therapies (data not shown). Finally, the QSP modeling platform was shown to represent TG physiology and treatment effects in a range of patient populations with varying levels of TGs and/or cholesterol.
A limitation of this study is the use of VPs to represent true physiological variability. In the current study, the VPs were created using an investigation of the variations in multiple parameters, which showed that most interactions had a minimal influence on the model. Therefore, the limitations of VP methodology are expected to have a minimal effect.
Although evinacumab is known to affect lipid metabolism by inhibiting ANGPTL3, 32 , 33 with changes in plasma lipid concentrations mirroring the lipid phenotype observed in individuals with ANGPTL3 LOF variants, 27 , 28 , 29 , 30 the detailed mechanism by which evinacumab modifies lipid metabolism is yet to be elucidated. 34 The QSP modeling platform provides a unique tool to allow different hypotheses to be tested. For example, the model could be used to give reasonable estimates of LDL‐C, and with additional calibration and mechanisms could address fat accumulation in the liver, as occurs in nonalcoholic steatohepatitis and nonalcoholic fatty liver disease. In addition, the model could be extended to represent cholesterol in TRL particles, thereby enabling the effects of statins to be modeled, allowing the investigation of combination therapies with statins or, for example, with ApoCIII inhibitors. Further investigations are in progress to evaluate the drug effect on LDL‐C and total cholesterol as well as the differential effects of ANGPTL3 on LPL as it affects, for example, chylomicrons and VLDL/IDL/LDL TG metabolism.
In conclusion, the QSP modeling platform successfully integrated known features of evinacumab and target biology and was shown to represent the variability observed in evinacumab clinical trial data. These features of the QSP model allow hypothesis testing, enabling an enhancement of our understanding of the mechanism of action of evinacumab and possibly an explanation of the variability in lipid responses observed with evinacumab clinical trial data. This will allow physicians to maximize the therapeutic benefit for patients with hypertriglyceridemia in different populations.
CONFLICT OF INTEREST
M.K.T., Y.Z., F.Y., X.P., J.D.D., and N.H. are employees of and stockholders in Regeneron Pharmaceuticals, Inc. J.B. is the principal of Clermont, Bosley LLC and is an employee of Novadiscovery, Lyon, France. He received compensation for this work. L.M.P. is the founder of Lynx BioConsulting and received funding for their role in the development of the model.
AUTHOR CONTRIBUTIONS
M.K.T. wrote the manuscript. M.K.T., J.B., Y.Z., L.P., F.Y., X.P., J.D.D., and N.A‐H. designed the research. M.K.T., J.B., L.P., Y.Z., F.Y., X.P., J.D.D., and N.A‐H. performed the research. M.K.T., J.B., L.P., Y.Z., F.Y., X.P., J.D.D., and N.A‐H. analyzed the data.
Supporting information
Fig S1
Fig S2
Table S1
Table S2
Table S3
Supplementary Material
ACKNOWLEDGMENTS
The authors thank the patients, their families, and all investigators involved in the studies used in this analysis. In addition, many thanks to Dr A. Thomas DiCioccio for useful discussions and his support and Dr Adrian Pratt (now Principal Modelling Analyst for NHS Bristol) for useful discussions. Medical writing support was provided by Rachel Dunn, PhD, of Prime, Knutsford, UK, supported by Regeneron Pharmaceuticals, Inc., according to Good Publication Practice guidelines (Link). The sponsor was involved in the study design and collection, analysis, and interpretation of data as well as data checking of information provided in the manuscript. The authors were responsible for all content and editorial decisions and received no honoraria related to the development of this publication.
Khaksar Toroghi M, Bosley J, Powell LM, et al. A quantitative systems pharmacology modeling platform for evaluating triglyceride profiles in patients with high triglycerides receiving evinacumab. CPT Pharmacometrics Syst Pharmacol. 2021;10:1332–1342. 10.1002/psp4.12694
Funding information
This analysis was funded by Regeneron Pharmaceuticals, Inc.
REFERENCES
- 1. Hokanson JE, Austin MA. Plasma triglyceride level is a risk factor for cardiovascular disease independent of high‐density lipoprotein cholesterol level: a meta‐analysis of population‐based prospective studies. J Cardiovasc Risk. 1996;3:213‐219. [PubMed] [Google Scholar]
- 2. Sarwar N, Sandhu MS, Ricketts SL, et al. Triglyceride‐mediated pathways and coronary disease: collaborative analysis of 101 studies. Lancet (London, England). 2010;375:1634‐ 1639. [DOI] [PMC free article] [PubMed] [Google Scholar]
- 3. Crosby J, Peloso GM, Auer PL, et al. Loss‐of‐function mutations in APOC3, triglycerides, and coronary disease. N Engl J Med. 2014;371:22‐31. [DOI] [PMC free article] [PubMed] [Google Scholar]
- 4. Lloret Linares C, Pelletier AL, Czernichow S, et al. Acute pancreatitis in a cohort of 129 patients referred for severe hypertriglyceridemia. Pancreas. 2008;37:13. [DOI] [PubMed] [Google Scholar]
- 5. Jellinger PS, Handelsman Y, Rosenblit PD, et al. American association of clinical endocrinologists and American college of endocrinology guidelines for management of dyslipidemia and prevention of cardiovascular disease ‐ executive summary. Endocr Pract. 2017;23:479‐497. [DOI] [PubMed] [Google Scholar]
- 6. Sandhu S, Al‐Sarraf A, Taraboanta C, Frohlich J, Francis GA. Incidence of pancreatitis, secondary causes, and treatment of patients referred to a specialty lipid clinic with severe hypertriglyceridemia: a retrospective cohort study. Lipids Health Dis. 2011;10:157. [DOI] [PMC free article] [PubMed] [Google Scholar]
- 7. Mach F, Baigent C, Catapano AL, et al. 2019 ESC/EAS guidelines for the management of dyslipidaemias: lipid modification to reduce cardiovascular risk. Eur Heart J. 2020;41:111‐188. [DOI] [PubMed] [Google Scholar]
- 8. Hassing HC, Surendran RP, Mooij HL, Stroes ES, Nieuwdorp M, Dallinga‐Thie GM. Pathophysiology of hypertriglyceridemia. Biochim Biophys Acta. 2012;1821:826‐832. [DOI] [PubMed] [Google Scholar]
- 9. Kersten S. Angiopoietin‐like 3 in lipoprotein metabolism. Nat Rev Endocrinol. 2017;13:731‐739. [DOI] [PubMed] [Google Scholar]
- 10. Toth PP. Triglyceride‐rich lipoproteins as a causal factor for cardiovascular disease. Vasc Health Risk Manag. 2016;12:171‐183. [DOI] [PMC free article] [PubMed] [Google Scholar]
- 11. Feingold KR, Grunfeld C. Introduction to lipids and lipoproteins. In: Feingold KR, Anawalt B, Boyce A, Chrousos G, Dungan K, Grossman A et al. eds. Endotext. MDText.com, Inc; 2018. [Google Scholar]
- 12. Miller M, Stone NJ, Ballantyne C, et al. Triglycerides and cardiovascular disease: a scientific statement from the American Heart Association. Circulation. 2011;123:2292‐2333. [DOI] [PubMed] [Google Scholar]
- 13. Gibbons GF, Brown AM, Wiggins D, Pease R. The roles of insulin and fatty acids in the regulation of hepatic very‐low‐density lipoprotein assembly. J R Soc Med. 2002;95(Suppl 42):23‐32. [PMC free article] [PubMed] [Google Scholar]
- 14. Davies BS, Beigneux AP, Barnes RH II, et al. GPIHBP1 is responsible for the entry of lipoprotein lipase into capillaries. Cell Metab. 2010;12:42‐52. [DOI] [PMC free article] [PubMed] [Google Scholar]
- 15. Beigneux AP, Davies BS, Bensadoun A, Fong LG, Young SG. GPIHBP1, a GPI‐anchored protein required for the lipolytic processing of triglyceride‐rich lipoproteins. J Lipid Res. 2009;50(Suppl):S57‐S62. [DOI] [PMC free article] [PubMed] [Google Scholar]
- 16. Johansen CT, Kathiresan S, Hegele RA. Genetic determinants of plasma triglycerides. J Lipid Res. 2011;52:189‐206. [DOI] [PMC free article] [PubMed] [Google Scholar]
- 17. Dallinga‐Thie GM, Kroon J, Boren J, Chapman MJ. Triglyceride‐rich lipoproteins and remnants: Targets for therapy? Curr Cardiol Rep. 2016;18:67. [DOI] [PMC free article] [PubMed] [Google Scholar]
- 18. Tuteja S, Duffy D, Dunbar RL, et al. Pharmacokinetic interactions of the microsomal triglyceride transfer protein inhibitor, lomitapide, with drugs commonly used in the management of hypercholesterolemia. Pharmacotherapy. 2014;34:227‐239. [DOI] [PubMed] [Google Scholar]
- 19. Cuchel M, Meagher EA, du Toit Theron H, et al. Efficacy and safety of a microsomal triglyceride transfer protein inhibitor in patients with homozygous familial hypercholesterolaemia: a single‐arm, open‐label, phase 3 study. Lancet (London, England). 2013;381:40‐46. [DOI] [PMC free article] [PubMed] [Google Scholar]
- 20. Magarian GJ, Lucas LM, Colley C. Gemfibrozil‐induced myopathy. Arch Intern Med. 1991;151:1873‐1874. [PubMed] [Google Scholar]
- 21. Dunbar RL, Goel H, Tuteja S, et al. Measuring niacin‐associated skin toxicity (NASTy) stigmata along with symptoms to aid development of niacin mimetics. J Lipid Res. 2017;58:783‐797. [DOI] [PMC free article] [PubMed] [Google Scholar]
- 22. Goldberg RB, Bittner V, Dunbar RL, et al. Effects of extended‐release niacin added to simvastatin/ezetimibe on glucose and insulin values in AIM‐HIGH. Am J Med. 2016;129(753):e713‐e722. [DOI] [PMC free article] [PubMed] [Google Scholar]
- 23. Koster A, Chao YB, Mosior M, et al. Transgenic angiopoietin‐like (angptl)4 overexpression and targeted disruption of angptl4 and angptl3: regulation of triglyceride metabolism. Endocrinology. 2005;146:4943‐4950. [DOI] [PubMed] [Google Scholar]
- 24. Fujimoto K, Koishi R, Shimizugawa T, Ando Y. Angptl3‐null mice show low plasma lipid concentrations by enhanced lipoprotein lipase activity. Exp Anim. 2006;55:27‐34. [DOI] [PubMed] [Google Scholar]
- 25. Shimamura M, Matsuda M, Yasumo H, et al. Angiopoietin‐like protein3 regulates plasma HDL cholesterol through suppression of endothelial lipase. Arterioscler Thromb Vasc Biol. 2007;27:366‐372. [DOI] [PubMed] [Google Scholar]
- 26. Musunuru K, Pirruccello JP, Do R, et al. Exome sequencing, ANGPTL3 mutations, and familial combined hypolipidemia. N Engl J Med. 2010;363:2220‐2227. [DOI] [PMC free article] [PubMed] [Google Scholar]
- 27. Pisciotta L, Favari E, Magnolo L, et al. Characterization of three kindreds with familial combined hypolipidemia caused by loss‐of‐function mutations of ANGPTL3. Circulation. Cardiovascular Genetics. 2012;5:42‐50. [DOI] [PubMed] [Google Scholar]
- 28. Romeo S, Yin W, Kozlitina J, et al. Rare loss‐of‐function mutations in ANGPTL family members contribute to plasma triglyceride levels in humans. J Clin Investig. 2009;119:70‐79. [DOI] [PMC free article] [PubMed] [Google Scholar]
- 29. Minicocci I, Montali A, Robciuc MR, et al. Mutations in the ANGPTL3 gene and familial combined hypolipidemia: a clinical and biochemical characterization. J Clin Endocrinol Metab. 2012;97:E1266‐E1275. [DOI] [PMC free article] [PubMed] [Google Scholar]
- 30. Martin‐Campos JM, Roig R, Mayoral C, et al. Identification of a novel mutation in the ANGPTL3 gene in two families diagnosed of familial hypobetalipoproteinemia without APOB mutation. Clin Chim Acta. 2012;413:552‐555. [DOI] [PubMed] [Google Scholar]
- 31. Zhang R. The ANGPTL3‐4‐8 model, a molecular mechanism for triglyceride trafficking. Open Biol. 2016;6:150272. [DOI] [PMC free article] [PubMed] [Google Scholar]
- 32. Gaudet D, Gipe DA, Pordy R, et al. ANGPTL3 inhibition in homozygous familial hypercholesterolemia. N Engl J Med. 2017;377:296‐297. [DOI] [PubMed] [Google Scholar]
- 33. Dewey FE, Gusarova V, Dunbar RL, et al. Genetic and pharmacologic inactivation of ANGPTL3 and cardiovascular disease. N Engl J Med. 2017;377:211‐221. [DOI] [PMC free article] [PubMed] [Google Scholar]
- 34. Adam RC, Mintah IJ, Alexa‐Braun CA, et al. Angiopoietin‐like protein 3 governs LDL‐cholesterol levels through endothelial lipase‐dependent VLDL clearance. J Lipid Res. 2020;61:1271‐1286. [DOI] [PMC free article] [PubMed] [Google Scholar]
- 35. Raal FJ, S. Rosenson R, Reeskamp LF, et al. Evinacumab for homozygous familial hypercholesterolemia. N Engl J Med. 2020;383:711‐720. [DOI] [PubMed] [Google Scholar]
- 36. Ahmad Z, Banerjee P, Hamon S, et al. Inhibition of angiopoietin‐like protein 3 with a monoclonal antibody reduces triglycerides in hypertriglyceridemia. Circulation. 2019;140:470‐486. [DOI] [PMC free article] [PubMed] [Google Scholar]
- 37. Bradshaw EL, Spilker ME, Zang R, et al. Applications of quantitative systems pharmacology in model‐informed drug discovery: perspective on impact and opportunities. CPT Pharmacometrics Syst Pharmacol. 2019;8:777‐791. [DOI] [PMC free article] [PubMed] [Google Scholar]
- 38. Xie F, Gu J. Computational methods and applications for quantitative systems pharmacology. Quant Biol. 2019;7:3‐16. [Google Scholar]
- 39. Musante CJ, Ramanujan S, Schmidt BJ, Ghobrial OG, Lu J, Heatherington AC. Quantitative systems pharmacology: A case for disease models. Clin Pharmacol Ther. 2017;101:24‐27. [DOI] [PMC free article] [PubMed] [Google Scholar]
- 40. Gadkar K, Budha N, Baruch A, Davis JD, Fielder P, Ramanujan S. A mechanistic systems pharmacology model for prediction of LDL cholesterol lowering by PCSK9 antagonism in human dyslipidemic populations. CPT Pharmacometrics Syst Pharmacol. 2014;3:e149. [DOI] [PMC free article] [PubMed] [Google Scholar]
- 41. Mc Auley MT, Mooney KM. Computationally modeling lipid metabolism and aging: A mini‐review. Comput Struct Biotechnol J. 2015;13:38‐46. [DOI] [PMC free article] [PubMed] [Google Scholar]
- 42. Mc Auley MT, Wilkinson DJ, Jones JJ, Kirkwood TB. A whole‐body mathematical model of cholesterol metabolism and its age‐associated dysregulation. BMC Syst Biol. 2012;6:130. [DOI] [PMC free article] [PubMed] [Google Scholar]
- 43. Lu J, Hubner K, Nanjee MN, Brinton EA, Mazer NA. An in‐silico model of lipoprotein metabolism and kinetics for the evaluation of targets and biomarkers in the reverse cholesterol transport pathway. PLoS Comput Biol. 2014;10:e1003509. [DOI] [PMC free article] [PubMed] [Google Scholar]
- 44. Pratt AC, Wattis JA, Salter AM. Mathematical modelling of hepatic lipid metabolism. Math Biosci. 2015;262:167‐181. [DOI] [PubMed] [Google Scholar]
- 45. Ming JE, Abrams RE, Bartlett DW, et al. A quantitative systems pharmacology platform to investigate the impact of alirocumab and cholesterol‐lowering therapies on lipid profiles and plaque characteristics. Gene Regul Syst Bio. 2017;11:1177625017710941. [DOI] [PMC free article] [PubMed] [Google Scholar]
- 46. Sokolov V, Helmlinger G, Nilsson C, et al. Comparative quantitative systems pharmacology modeling of anti‐PCSK9 therapeutic modalities in hypercholesterolemia. J Lipid Res. 2019;60:1610‐1621. [DOI] [PMC free article] [PubMed] [Google Scholar]
- 47. Toroghi MK, Cluett WR, Mahadevan R. A multi‐scale model for low‐density lipoprotein cholesterol (LDL‐C) regulation in the human body: Application to quantitative systems pharmacology. Comput Chem Eng. 2019;130:106507. [Google Scholar]
- 48. Gibiansky L, Gibiansky E. Target‐mediated drug disposition model: approximations, identifiability of model parameters and applications to the population pharmacokinetic‐pharmacodynamic modeling of biologics. Expert Opinion Drug Metab Toxicol. 2009;5:803‐812. [DOI] [PubMed] [Google Scholar]
- 49. Wishart DS, Feunang YD, Marcu A, et al. HMDB 4.0: the human metabolome database for 2018. Nucleic Acids Res. 2018;46:D608‐D617. [DOI] [PMC free article] [PubMed] [Google Scholar]
- 50. Milo R, Jorgensen P, Moran U, Weber G, Springer M. BioNumbers–the database of key numbers in molecular and cell biology. Nucleic Acids Res. 2010;38:D750‐D753. [DOI] [PMC free article] [PubMed] [Google Scholar]
- 51. Pichery C. Sensitivity analysis. In: Wexler P, ed. Encyclopedia of Toxicology . 3rd ed. Cambridge, Massachusetts, USA: Academic Press; 2014:236‐237. [Google Scholar]
- 52. Robciuc MR, Tahvanainen E, Jauhiainen M, Ehnholm C. Quantitation of serum angiopoietin‐like proteins 3 and 4 in a Finnish population sample. J Lipid Res. 2010;51:824‐831. [DOI] [PMC free article] [PubMed] [Google Scholar]
- 53. Stejskal D, Karpisek M, Humenanska V, Solichova P, Stejskal P. Angiopoietin‐like protein 3: development, analytical characterization, and clinical testing of a new ELISA. Gen Physiol Biophys. 2007;26:230‐233. [PubMed] [Google Scholar]
- 54. Ribba B, Grimm HP, Agoram B, et al. Methodologies for quantitative systems pharmacology (QSP) models: design and estimation. CPT Pharmacometrics Syst Pharmacol. 2017;6:496‐498. [DOI] [PMC free article] [PubMed] [Google Scholar]
- 55. Djebli N, Martinez J, Lohan L, et al. Target‐mediated drug disposition population pharmacokinetics model of alirocumab in healthy volunteers and patients: pooled analysis of randomized phase I/II/III studies. Clin Pharmacokinet. 2017;56:1155‐1171. [DOI] [PMC free article] [PubMed] [Google Scholar]
Associated Data
This section collects any data citations, data availability statements, or supplementary materials included in this article.
Supplementary Materials
Fig S1
Fig S2
Table S1
Table S2
Table S3
Supplementary Material


