

Graphical abstract
Abbreviations: COVID-19, Coronavirus disease 2019
Keywords: COVID-19, Mathematical modeling, Vaccine efficacy, Vaccine coverage, Asymptomatic infection
Highlights
-
•
COVID-19 vaccines with different efficacies are reported to be effective against severe disease.
-
•
Vaccine sterilizing immunity is still being evaluated.
-
•
We investigate COVID-19 vaccine performance as vaccine efficacy and vaccine coverage vary.
-
•
Vaccine performance is driven by the ability of asymptomatic infections transmitting the virus.
-
•
Planned strategy to use different COVID-19 vaccines will optimize hospitalization reductions.
Abstract
Introduction
Different COVID-19 vaccine efficacies are reported, with remarkable effectiveness against severe disease. The so called sterilizing immunity, occurring when vaccinated individuals cannot transmit the virus, is still being evaluated. It is also unclear to what extent people with no symptoms or mild infection transmit the disease, and estimating their contribution to outbreaks is challenging.
Objective
With an uneven roll out of vaccination, the purpose of this study is to investigate the role of mild and asymptomatic infections on COVID-19 vaccine performance as vaccine efficacy and vaccine coverage vary.
Methods
We use an epidemiological SHAR (Susceptible-Hospitalized-Asymptomatic-Recovered) model framework to evaluate the effects of vaccination in different epidemiological scenarios of coverage and efficacy. Two vaccination models, the vaccine protecting against severe disease, and the vaccine , protecting against infection as well as severe disease, are compared to evaluate the reduction of overall infections and hospitalizations.
Results
Vaccine performance is driven by the ability of asymptomatic or mild disease cases transmitting the virus. Vaccines protecting against severe disease but failing to block transmission might not be able to reduce significantly the severe disease burden during the initial stage of a vaccination roll out programme, with an eventual increase on the number of overall infections in a population.
Conclusion
The different COVID-19 vaccines currently in use have features placing them closer to one or the other of these two extreme cases, and , and insights on the importance of asymptomatic infection in a vaccinated population are of a major importance for the future planning of vaccination programmes. Our results give insights on how to best combine the use of the available COVID-19 vaccines, optimizing the reduction of hospitalizations.
Introduction
More than a year has passed since COVID-19 was declared a pandemic by the World Health Organization (WHO). As of beginning of June, 2021, i.e. when this manuscript was submitted, more than 170 million COVID-19 cases worldwide were reported, with around 3.3 million deaths [1]. Number of cases continued to increase and, with eventually substantial global underestimation of SARS-CoV-2 infection, by mid of October 2021 more than 240 million cases and approximately 4.9 million death have been notified by the WHO [2]. COVID-19 symptoms can range from asymptomatic/mild to severe illness, and disease severity and death occurring according to a hierarchy of risks [3], with age and pre-existing health conditions enhancing disease severity. Vaccines against COVID-19 have been developed in record time and are now globally distributed. With different efficacies, those vaccines authorized for emergency use are protecting individuals against severe disease [4], [5], [6], [7]. The extent to which COVID-19 vaccines block infection is still being evaluated [8], [9]. It is also unclear to what extent people with no symptoms or mild infection transmit the disease, and estimating their contribution to outbreaks is challenging.
According to the WHO, asymptomatically infected individuals are much less likely to transmit the virus than those who develop symptoms [10]. However, recent studies have reported that transmission from asymptomatic individuals was estimated to account for more than of all transmission [11], [12]. We use an epidemiological SHAR (Susceptible-Hospitalized-Asymptomatic- Recovered) model framework [13] to evaluate the effects of vaccination in different epidemiological scenarios of coverage and efficacy. Results obtained for two vaccination models, the vaccine protecting against severe disease, and the vaccine , protecting against infection and also severe disease, are compared to the basic SHAR model without vaccination, evaluating the reduction of overall infections and hospitalizations in a population under low or intermediate vaccine coverage.
The different vaccines currently used have features placing them closer to one or the other of these two extreme cases, and , with the ideal case scenario of perfect vaccine efficacy and complete coverage leading always to an extinction of severe cases. This is a conceptual study to evaluate the performance of vaccines and in respect to hospitalization and overall infections reduction. As information on COVID-19 vaccine efficacies are updated frequently, the new reported measures will be included into the modeling framework as needed, once it becomes publicly available [14]. Our results show that in an intermediate scenario of low to medium vaccination coverage and limited vaccine efficacy, vaccine performance will be influenced by the transmission level of mild and asymptomatic cases. If severe disease cases are accounted as the main contributor of disease transmission in a population, the performance of both vaccines, and , is observed to be very similar in respect to reduction of hospitalizations, with a minor advantage for type of vaccine. However, in the case of mild/asymptomatic infections are confirmed to have higher transmission rates than severe/hospitalized cases, will eventually lead to a higher number of hospitalizations than in a scenario with no vaccine roll out. Although preference to is desirable, even with a smaller efficacy, a conscientious strategy to administrate simultaneously each vaccine type is needed to optimize hospitalization reductions, knowing that efficacies are also varying according to vaccination doses schedules.
This paper is structured as follows. The second section contains the description of the proposed modeling framework for COVID-19 dynamics, by means of ordinary differential equations and stochastic processes. The third section describes the analysis and simulation results of the proposed models described in Section 2. The last section concludes this work, with a discussion presenting the complete connection of this research with the current vaccination strategy to control COVID-19 spreading and severe disease reduction.
Methods
Using epidemiological models, we analyze three vaccination scenarios of vaccine efficacy and coverage. For the scenario without vaccination, we use the basic SHAR model, while for the scenario with vaccination we use the models , for vaccine one , protecting against severe disease, and the , for vaccine two , protecting against disease and infection. The performance of the vaccines are evaluated in function of vaccine efficacy, vaccine coverage and the role of mild/asymptomatic on disease transmission.
The basic SHAR model
Applied to COVID-19 transmission, the SHAR model is an extension of the basic SIR (Susceptible-Infected-Recovered) type model, where the infected class is stratified into Hospitalized/severe disease cases and Asymptomatic/mild cases . This model was extended to describe the epidemiological situation of COVID-19 in the Basque Country, validated with empirical data and it is, up to date, used by the local public health managers to monitor the impact of intervention measures, the SHARUCD modeling framework [13], [15], [16], [18], [19]. With infection rate and recovery rate , susceptible S individuals becoming infected can either develop severe disease prone to hospitalization H, with a proportion , or develop a mild infection, potentially asymptomatic A, with a proportion . Recovered individuals R are considered resistant to reinfection. The dynamics for the mean values can be written as ordinary differential equation system
| (1) |
where the ratio is included to differentiate the contribution of asymptomatic/ mild infected individuals to the force of infection as compared to the contribution of the severe detected cases in a population of size N [13], [19].
The SHARV1 model
The model is an extension of the basic SHAR model described above, with population receiving vaccine type, protecting against severe disease but unable to block transmission. With a relative risk and vaccine efficacy k, vaccination is implemented by assuming reduced infectivity (for the vaccinated group) against natural infectivity (for the non-vaccinated group), as measured in vaccine trials (see e.g. [20], [21], [22] for the terminology and analysis in a Bayesian framework).
We distinguish the naive susceptible S individuals prone to natural infection and vaccinated susceptible individuals with a reduced risk of severe disease, but still able to transmit the virus when becoming mild or asymptomatic infected. Here, the hospitalization ratio in this natural infectivity changes with vaccine uptake , whereas the mild/asymptomatic infection rate is assumed to not be efficiently reduced (in the extreme case, no reduction at all).
The dynamical system of the model is given by
| (2) |
with the term in the dynamics of the asymptomatic infected easily simplified , since neither naive susceptible individuals nor vaccinated susceptible individuals with vaccine are protected against infection, i.e. are still able to transmit the disease.
The SHARV2 model
Similarly to the model described above, we now extend the basic SHAR model to obtain the framework for a population receiving vaccine type, protecting against severe disease and infection, i.e. the so called sterilizing immunity with efficacy k. Note that vaccine type could eventually have a smaller or larger efficacy k than a vaccine type, hence we must distinguish vaccine efficacy of as from that of as . For the moment, this difference is not considered since we only evaluate the performance of each vaccine type individually.
For vaccine type, the vaccinated susceptible individuals have a reduced infection rate for both transitions, the transition into the severe/Hospitalized class H as , and for the transition into the mild/Asymptomatic class A as .
The dynamical system of the model is given by
| (3) |
Vaccine performance analysis: a conceptual study
For analytical insights into the behaviour of the models with vaccination compared to the non-vaccination scenario, we consider the dynamics of the disease compartments, here in the case,
| (4) |
including the vaccination coverage c as the fraction of vaccinated susceptible individuals over the total number of susceptible , hence . In this exercise, we assume that the burning out of susceptible individuals is slow as compared to the disease progression. This assumption is justified when COVID-19 is far from herd immunity, with detected cases being small compared to the overall population, as for example in the Basque Country, with population size of million people and less than 200 thousand confirmed cases notified to date. We consider and hence and .
This is not a limiting assumption, since for any point in time we can assume a certain level of susceptibility, taking already naturally recovered into account, and evaluating the momentary increase or decrease of diseased and infected without and with vaccination impact.
In detail, for the state vector we obtain the dynamics where we use
| (5) |
and
| (6) |
for vaccine , but with specific variables y and z all the three models can be analyzed with the same formulation.
The matrix B is explicitly given below (omitting the factor since initially , and note that the infection rate carries in case is significantly lower than N)
| (7) |
along with matrix G as
| (8) |
and hence evaluate in .
Growth factor of disease spreading or disease decline
For the model we have the above expressions of y and z, which we can call and , whereas for the basic SHAR model we would obtain and which simply disappear in the matrix B. Via the eigenvalue/eigenvector analysis of the matrix J, see [13], [15], [19] for the notations, we obtain from the dominant eigenvalue the growth factor of disease spreading or disease decline [15]. As opposed to the plain infection rate for simpler SIR models, the growth rate appears now as a transformed infection rate
| (9) |
that can be used for a first inspection of vaccine effects.
To apply the analysis closer to the present epidemiological scenario of COVID-19, we analyze the models including import as in the force of infection and keep the community spreading below exponential growth [16]. Hence we have the dynamical system given by
| (10) |
with matrix decomposed into eigenvalue matrix and eigenvector matrix T as . From
| (11) |
the time dependent solution is
| (12) |
with as unit matrix, and stationary value with the results given by
| (13) |
The stationary states for the severe/hospitalized cases () and overall infection () as function of vaccine coverage and efficacy for both vaccines are
| (14) |
and
| (15) |
with .
The analysis for the vaccine is done similarly to the analysis for vaccine , obtaining slightly altered vaccination variables (as for the previous case ) and .
The effective infection rate obtained from the growth rates of all three models can be written using the same formulation. For the model we have
| (16) |
while for the model
| (17) |
since . Finally for the basic SHAR model without vaccination, where , we have
| (18) |
as result.
The reduction of the effective infection rate due to the vaccine type is given by
| (19) |
while for we obtain a slightly more complex situation given by
| (20) |
defining an expression . With a similar result as for , the first term is identical but then reduced by an additional term proportional to , which is dependent on the SHAR specific parameters , the proportion of hospitalizations, and , the contribution of asymptomatic/mild infections to the force of infection, namely . This factor can become eventually disadvantageous, especially when cases of asymptomatic infection are accounting for most of the transmission ().
For this reason, a simple comparison of the growth factors without and with vaccine is not sufficient to evaluate the vaccine performance and vaccination roll out impact, especially when a vaccine protects mainly against severe disease, but leaves the infectivity aspect unanswered. Therefore, we performed the analysis for the present snapshot in time for controlled community spreading, which is obtained after lockdown relaxation, i.e. transmission rate below the epidemic threshold, challenged by imported cases, i.e. expected when mobility is allowed, for both vaccine types analogously. Results are given by Eq. (13), with the respective vaccine specific variables and for each vaccine i.
Stochastic systems formulation and models comparison: SHAR, SHARV1 and SHARV2
The deterministic approach described above was obtained via the mean field approximation of the stochastic system and is also used to evaluate the model performance and accuracy to guide the modeling analysis. Similarly as shown for the basic SHAR model in [13], the stochastic versions of the presented models can be given analogously. The stochastic process is given for probabilities of density state vectors as
| (21) |
For the basic SHAR model with import and eventual waning immunity (which matters when e.g. new variants affect natural immunity of the host), densities of the state variables are and , with defining the shift vectors for the transitions, are given by
| (22) |
see e.g. [23], [24], [25] for the notations. For the models with vaccination we have to include a fifth state variable in the state vector. For vaccine , the transitions are
| (23) |
while for vaccine we have the altered transitions
| (24) |
to complete the formal description of the stochastic processes. The stochastic realizations are obtained via the Gillespie algorithm [26], [27].
The models’ outcome are shown in Fig. 1, for a scenario of vaccine efficacy of and vaccine coverage of . The dynamics of hospitalized cases (H) are plotted in red and the dynamics of overall infected cases () are plotted in yellow. Simulation results are shown in Fig. 1 a-b) for the basic SHAR model without vaccination. Results for the model, with vaccine protecting against severe disease only, are shown in Fig. 1 c-d) and for the model, with vaccine protecting against disease and infection, are shown in Fig. 1 e-f).
Fig. 1.

Stochastic models output comparison. For a population size and a small import factor , we plot in red hospitalized cases H and in yellow overall infections using the following parameter set: . Straight black lines give the analytical stationary state results, curvy black lines the mean field approximations of the full systems including varying with eventual approximation of herd immunity. In a-b) results for the SHAR model without vaccination, in c-d) results for the model and in e-f) results for the model with vaccine protecting against disease and infection are shown.
Ten stochastic realizations are plotted. Straight black lines give the analytical stationary state results and curvy black lines the mean field approximation solution of the full systems, including varying with eventual approximation of herd immunity.
For illustration purposes, we compare the results obtained in the epidemiological scenario where asymptomatic infection is assumed to contribute more to the force of infection than severe hospitalized cases (). Taking the SHAR model as a baseline for comparing the expected reduction of hospitalization and overall infections we observe a slight reduction of overall infected and of severe cases for versus a significant reduction for severe cases and hospitalization for .
Results using different assumptions for asymptomatic infection contribution to the overall force of infection ( values) will be discussed in the next section, where we analyze the solution given by the deterministic approach, since large fluctuations observed in the stochastic system make it difficult to observe in Fig. 1 the differences in vaccine performance.
Results and discussion
The analysis of the proposed models described in Section 2 are shown below as function of vaccination coverage and vaccine efficacy. The role of asymptomatic/mild disease cases are varied to evaluate the performance of the vaccines in respect of hospitalization and overall infections reduction.
Reduction of severe cases/hospitalizations and overall infections as function of vaccination coverage and vaccine efficacy
We analyze the impact of the vaccine and vaccine in respect to the reduction of severe/hospitalizations and reduction of overall infections by changing vaccination coverage c at given vaccine efficacy k over time. We assume a scenario of community transmission controlled, i.e, with non-pharmaceutical interventions able to keep the transmission away from an exponential growth, but under the influence of import, while mobility is still allowed [15], [16], [18].
The stationary value for hospitalizations and overall infections are given by Eq. (14) and Eq. (15) respectively. We use different definitions of vaccine impact variables y and z for each model, , for vaccine , for vaccine , and SHAR, with no vaccine, to obtain the uniform description for all models. We obtain for and , and for with given . The original value in the SHAR model without vaccine is given for , no vaccine coverage, hence . Further parameters of the SHAR type models are described in Section 2.
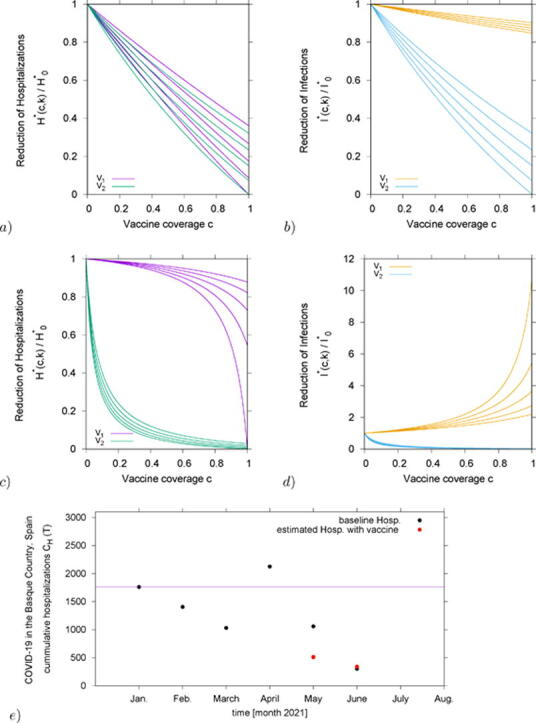
In Fig. 2 we analyze the ratio of hospitalizations in vaccination and non-vaccination scenarios, hence . Results obtained for are shown in purple and for in green. From bottom to top vaccine efficacies are varied as and , as continuous function of vaccine coverage . To investigate the effect of different transmission rates, we vary the infectivity of asymptomatic/mild cases to be smaller () or larger () than the infectivity of severe/hospitalized cases and we discuss the role of asymptomatic infection on vaccine performance.
Fig. 2.

Reduction of hospitalizations for vaccine , in purple and vaccine two , in green, over the non-vaccination scenario of the basic SHAR model with import, . We plot the results for various vaccine efficacies between (lowest curve in each graph) and (highest curves) in steps of , as function of vaccination coverage c. Varying the infectivity of asymptomatic over the infectivity of severe cases, , we have in a) in b) , in c) and in d) .
By assuming a small infectivity of asymptomatic cases relative to severe cases, , we observe a very small difference on the performance of and (see Fig. 2 a)), with both vaccines reducing severe/hospitalizations nearly linearly as function of vaccine coverage. However, when increasing closer to unit, in b) , and beyond, see c) and d) , differences on vaccine performance are observed. Here, only in the limit case of complete coverage and perfect efficacy , both vaccines would reach extinction of hospitalizations.
In detail, for the scenario shown in Fig. 2 b) we have, for vaccine coverage over , some overlapping region of and , where a higher efficacious , which protects against severe disease without blocking transmission completely, can reduce hospitalizations more than a lower efficacious , which protects against disease and infection. For the scenario shown in Fig. 2 c), where mild/asymptomatic cases are transmitting slightly more than severe cases, this effect nearly disappears.
Finally, for the scenario shown in Fig. 2 d), where mild/asymptomatic cases are assumed to transmit approximately more than severe/hospitalized cases, significant reductions in hospitalization are reached very fast with whereas small effects of can be only observed with a very large vaccination coverage. Here, vaccine efficacy below would have about no effect in the population.
We continue with our analysis, now to also evaluate the reduction in the overall infections. Similarly to the analysis above, we show for some intermediate cases of , below unit and above unit, how the overall number of infected change with vaccination coverage. In Fig. 3 a) and Fig. 3 b) we plot the ratio of overall infections with and without vaccination, . In the same way as in Fig. 2, results obtained for are shown in yellow and for are shown in blue, for -values below and above unit, respectively. From bottom to top vaccine efficacies are varied as and , as continuous function of vaccine coverage .
Fig. 3.

Reduction of overall infection , with , for vaccine , in yellow and vaccine , in blue, over the non-vaccination scenario of the basic SHAR model with import, . We plot the results for various vaccine efficacies between (lowest curve in each graph) and (highest curves) in steps of , as function of vaccination coverage c. Varying the infectivity of asymptomatic over the infectivity of severe cases, , we have in a) in b) , in c) and in d) .
COVID-19 vaccines performance: the role of asymptomatic infection in low to medium vaccine coverage scenarios
Estimation of hospitalizations and overall infection reductions are shown in Table 1, Table 2, for and , respectively. Colors highlight the reductions: above in green, above and below in blue, and below in yellow. Negative reductions, i.e. increasing of cases, are shown in red and were observed only for in respect the overall infection cases.
Table 1.
Estimated reduction of hospitalization and overall infection for vaccine , protecting against severe disease but not blocking transmission completely. For different vaccine efficacies, we vary the asymptomatic infection contribution to the overall force of infection. Reduction of hospitalizations and overall infections are shown as percentages for scenarios of low and intermediate vaccination coverage.
 |
Table 2.
Estimated reduction of hospitalization and overall infection for vaccine , the so called sterilizing vaccine. For different vaccine efficacies, we vary the asymptomatic infection contribution to the force of infection. Reduction of hospitalizations and overall infections are shown as percentages for scenarios of low and intermediate vaccination coverage.
 |
Vaccination impact in the Basque Country: data and numerical experiment
In this section, we present the first numerical experiment for this conceptual study. As an exploratory analysis, we evaluate the vaccine impact on severe cases/hospitalizations of COVID-19 in the Basque Country, Spain. Applied to the epidemiological scenario as of June 2021, see Fig. 4a), with vaccination roll out using imperfect vaccines, see Fig. 4b), we consider empirical vaccines efficacy and a proportion of already naturally immunized persons via previous natural COVID-19 infection as recorded by the public health managers.
Fig. 4.

In a) COVID-19 dynamics in the Basque Country From Jan. 1 to June 15, 2021. Positive PCR cases (in yellow), hospitalizations (in red), ICU admission (in purple) and deceased cases (in black) are shown. In b) the vaccination coverage of individuals that have received at least a single dose of a vaccine () and the coverage of individuals that have completed the immunization schedule () in the Basque Country by June 2021. In c) Evaluation of the vaccination impact on hospitalizations in the Basque Country for May and June 2021 (plotted as red dots) in comparison with the official data on hospitalizations in the Basque Country from January to June 2021 (plotted as black dots). Vaccination coverage of full immunization were fixed to and as reported in May and June 2021 respectively.
With a population size of , less than 200 000 infections were reported as of June 15, 2021, i.e. around of the population been already immune prior to vaccination. A pool of default susceptible individuals is considered. Note that this assumption can be modified as new positive cases are detected to be included in the analysis, counting the current immunized population via natural infection or by vaccination at a given time. Vaccination coverage is given by with the recovered at a given time of analysis, when vaccines are administrated in the population independently of the individual previous record of negative or positive PCR test.
Assuming the available reported vaccine coverage in the Basque Country from May to June 2021, the baseline number of hospitalizations is assumed to be the number of cumulative hospitalizations notified in January 2021, immediately after the vaccination roll out started in the Basque Country, see purple line in Fig. 4c). We include the present population status of remaining susceptible after one year of natural infection, and for the sake of simplicity, see Fig. 4b), we consider vaccine efficacy against hospitalization as reported in [8]. This assumption is valid since the majority of the Basque population has received the BioNTech/Pfizer vaccine during the vaccination roll out. Results obtained here refer to the wild type of SARS-CoV-2 variant. Considerations on vaccine performance against new variants of concern (VOCs) and variants of interest (VOIs) are discussed in the Section below.
While Fig. 4a) shows a small decrease of reported severe cases (in red) as vaccination coverage increases, a significant increase of confirmed cases are also observed (yellow), as described in Table 1, for example, for the scenario where asymptomatic cases contribution to the force of infection is considered to be larger than symptomatic cases, once they are identified and isolated. Our modeling results could describe well these observations, with model predictions being very close to the empirical data for a low/intermediate vaccination coverage scenario, see 4c), where the hospitalizations given the momentary coverages and reported vaccine efficacy is plotted as red dots and the official data on hospitalizations in the Basque Country are plotted as black dots. Our results give insights on the role of mild and asymptomatic infections on COVID-19 vaccines performance, indicating that asymptomatic disease cases are contributing significantly with disease transmission in the population.
Model limitations and future refinements
From the present analysis, we obtained valid information of the effects of the vaccination scenarios on severe cases, taking especially into account factors like hospitalization ratio, contribution of infectivity of mild or asymptomatic cases, in their interplay with vaccine efficacies, as measured in vaccine trials, and vaccination coverage. The COVID-19 vaccines currently in use share certain features of different protection levels assumed for this study, however, the modeling framework needs some more refinement to describe more accurately the scenario we are living in.
Note that for this exercise we do not consider the effect of new variants. Contrary to what was observed during the initial roll out of the nationwide vaccination program using vaccine efficacy as referred in [8], protection against infection and transmission was highly affected by the new VOCs in circulation, anticipating that vaccination provide transient immunity, i.e., with elimination of the virus being eventually unlikely with the current vaccines in use. In the face of the new VOCs in circulation, e.g. the delta variant, a significant reduction of vaccine effectiveness against SARS-CoV-2 infections was reported to occur over time, but vaccine effectiveness against hospital admissions for infections with the delta variant was kept high overall. Nevertheless, this reduction is expected to be due to waning immunity with time rather than new variant escaping vaccine protection, since the effectiveness against other (non-delta) variants also wained significantly [29].
This is an ongoing work, with information on COVID-19 vaccine efficacies to be updated frequently and included into the refined modeling framework as needed [14]. Considerations of different variants of concern and variants of interest, as well as the detection rates of mild or asymptomatic infected are important to be considered. Nevertheless, studies like the one described here are timely and of major importance to understand the vaccination coverage needed to achieve herd immunity in different settings.
Model extensions to include known risk groups with different hospitalization ratios as well as information of number of individuals vaccinated with one or another vaccine, number of doses and its coverage might be considered, specially for predictions in empirical studies. Additional features have to be taken into account, such as extra compartments for incidence data, ICU admissions and deceased cases. Considerations of different variants and detection rates of mild or asymptomatic infected are also important.
Disentangling vaccination effects from other changing circumstances like seasonality and rapidly varying non-pharmaceutical interventions, upcoming herd immunity due to natural infections and recoveries etc. is still a challenging task, and final statements on when and how to lift other control measure due to increased vaccination levels and impact are soon needed.
Conclusion
The aim of this study was to evaluate the role of mild/asymptomatic infections on COVID-19 vaccine performance as vaccine efficacy and vaccine coverage vary. A simple SHAR model, where infected individuals are either developing severe disease prone to hospitalization (H) or developing mild/asymptomatic infection (A), with potentially higher mobility and hence more contacts, was extended to investigate reductions of hospitalizations and overall infections during the vaccination roll out. Two limiting vaccine types were evaluated, vaccine one , protecting against severe disease, and vaccine two , protecting against disease and infection.
The different COVID-19 vaccines currently in use have features placing them closer to one or the other of these two extreme cases, and insights on the importance of asymptomatic infection in a vaccinated population are of major importance for the future planning of vaccination programmes. We study the role of mild/asymptomatic infections during the COVID-19 outbreaks and evaluate their impact on vaccine performance as function of vaccine coverage and efficacy.
Our analysis has shown that in a setting where severe disease cases are assumed to be the main contributor to the spreading of COVID-19 the performance of both vaccines, and , are able to reduce significantly the number of hospitalizations. A small advantage on the overall reduction of severe disease cases is observed for . Nevertheless, in a setting where mild/asymptomatic cases are the ones accounted to contribute more to the overall infection rate in the population, we observe, in low to intermediate vaccine coverage, an eventual increase of severe cases (in comparison with the no vaccination scenario) for , which although protects against severe disease, fails to block disease transmission. In this scenario, we observe generating more mild/asymptomatic infections and this effect might contribute to the increase of hospitalizations, specially for non-vaccinated high risk group. While the capacity of asymptomatic to transmit the virus is not well measured, the use of masks and any other non-pharmaceutical interventions are to be considered even for vaccinated individuals, until herd immunity is archived by vaccination and natural infection.
We use the recent results of vaccine efficacies from large scale population surveys and although we have considered simplified assumptions for the remaining levels of susceptibles and the efficacies for mainly one vaccine, results are consistent with the presently available data in the Basque country. There is, nevertheless, still an ample space for further evaluations, including additional stochastic effects as described e.g. in [16], [17], [28]. In this study we consider the available information for the BioNTech/Pfizer vaccine [8], assuming that the variations reported eventually capture many aspects of heterogeneous vaccine coverage and efficacies. It is important to mention that, by the time this study was performed, the largest clinical trial reporting on varying efficacies per dose administrated and distinction of protection against hospitalization and infection refers to data from Israel’s largest health care organization, used to evaluate the effectiveness of the BNT162b2 mRNA vaccine [8]. As of October 2021, new and relevant data on effectiveness against hospitalization, disease and infection, after one or two doses are already available for the ChAdOX1 and other vaccines that are licensed for emergency use in Europe [29], [30].
As a conceptual study, our results give insights on how to best combine the use of the available COVID-19 vaccines, optimizing the reduction of hospitalizations. These results are of major interest, since: i) vaccines are not efficacious, leaving a proportion of the population at risk of acquiring the infections and eventually developing severe disease prone to hospitalization; ii) high vaccine coverage can not be reached immediately in an initial stage of a vaccination roll out programme, and as population immunity grows (by natural infection and vaccination coverage) the challenges of planning vaccine administration decreases, iii) in the case of vaccine waning immunity or even immune escape by new variants, we expect that new vaccine generations will need to be evaluated under the same settings studied here.
CREDIT Author Statement
Maíra Aguiar and Nico Stollenwerk: Conceptualization, Methodology, Numerical Simulations, Writing- Original draft preparation. Joseba Bidaurrazaga Van-Dierdonck and Javier Mar and Joseba: Writing- Reviewing and Editing. All authors have read and agreed to the published version of the manuscript.
Compliance with Ethics Requirements
This article does not contain any studies with human or animal subjects.
Declaration of Competing Interest
The authors declare that they have no known competing financial interests or personal relationships that could have appeared to influence the work reported in this paper.
Acknowledgments
We thank the huge efforts of the whole COVID-19 Basque Modeling Task Force (BMTF), specially to Eduardo Millán and Oliver Ibarrondo, Osakidetza Basque Health Service, for collecting and preparing extended data sets on COVID-19 incidences and vaccination in the Basque Country. We thank Adolfo Morais Ezquerro, Vice Minister of Universities and Research of the Basque Government for starting the BMTF initiative and for fruitful discussions. We thank Bruno Guerrero, Carlo Estadilla and Akhil Srivastav, MTB group members, for preparing the tables in Latex and preparing the figures for the empirical data presented in this manuscript. M. A. has received funding from the European Union’s Horizon 2020 research and innovation programme under the Marie Skłodowska-Curie grant agreement No 792494. This research is also supported by the Basque Government through the “Mathematical Modeling Applied to Health” Project, BERC 2018–2021 program and by Spanish Ministry of Sciences, Innovation and Universities: BCAM Severo Ochoa accreditation SEV-2017–0718.
Footnotes
Peer review under responsibility of Cairo University.
References
- 1.World Health Organization. Coronavirus Disease (COVID-19) Situation Reports. Weekly epidemiological update on COVID-19 - 11 May 2021. Retreived from https://www.who.int/publications/m/item/weekly-epidemiological-update-on-covid-19—8-june-2021.
- 2.World Health Organization. Coronavirus Disease (COVID-19) Situation Reports. Weekly epidemiological update on COVID-19 - 19 October 2021. Retrieved from https://www.who.int/publications/m/item/weekly-epidemiological-update-on-covid-19—19-october-2021.
- 3.Aguiar M., Stollenwerk N. Condition-specific mortality risk can explain differences in COVID-19 case fatality ratios around the globe. Public Health. 2020;188:18–20. doi: 10.1016/j.puhe.2020.08.021. [DOI] [PMC free article] [PubMed] [Google Scholar]
- 4.Voysey M., Clemens S.A.C., Madhi S.A., et al. Safety and efficacy of the ChAdOx1 nCoV-19 vaccine (AZD1222) against SARS-CoV-2: an interim analysis of four randomised controlled trials in Brazil, South Africa, and the UK. The Lancet. 2021;397(10269):99–111. doi: 10.1016/S0140-6736(20)32661-1. [DOI] [PMC free article] [PubMed] [Google Scholar]
- 5.Polack F.P., Thomas S.J., Kitchin N., et al. Safety and Efficacy of the BNT162b2 mRNA Covid-19 Vaccine. N. Engl. J. Med. 2020;383(27):2603–2615. doi: 10.1056/NEJMoa2034577. [DOI] [PMC free article] [PubMed] [Google Scholar]
- 6.Baden L.R., El Sahly H.M., Essink B., et al. Efficacy and Safety of the mRNA-1273 SARS-CoV-2 Vaccine. N. Engl. J. Med. 2021;384(5):403–416. doi: 10.1056/NEJMoa2035389. [DOI] [PMC free article] [PubMed] [Google Scholar]
- 7.Sadoff J., Gray G., Vandebosch A., et al. Safety and Efficacy of Single-Dose Ad26.COV2.S Vaccine against Covid-19. N. Engl. J. Med. 2021;384(23):2187–2201. doi: 10.1056/NEJMoa2101544. [DOI] [PMC free article] [PubMed] [Google Scholar]
- 8.Dagan N., Barda N., Kepten E., et al. BNT162b2 mRNA Covid-19 Vaccine in a Nationwide Mass Vaccination Setting. N. Engl. J. Med. 2021;384(15):1412–1423. doi: 10.1056/NEJMoa2101765. [DOI] [PMC free article] [PubMed] [Google Scholar]
- 9.Hall V.J., Foulkes S., Saei A., et al. COVID-19 vaccine coverage in health-care workers in England and effectiveness of BNT162b2 mRNA vaccine against infection (SIREN): a prospective, multicentre, cohort study. The Lancet. 2021;397(10286):1725–1735. doi: 10.1016/S0140-6736(21)00790-X. [DOI] [PMC free article] [PubMed] [Google Scholar]
- 10.World Health Organization. Transmission of COVID-19 by asymptomatic cases. Retrieved from http://www.emro.who.int/health-topics/corona-virus/transmission-of-covid-19-by-asymptomatic-cases.html.
- 11.Oran D.P., Topol E.J. Prevalence of Asymptomatic SARS-CoV-2 Infection. Ann. Intern. Med. 2020;173(5):362–367. doi: 10.7326/M20-3012. [DOI] [PMC free article] [PubMed] [Google Scholar]
- 12.Johansson M.A., Quandelacy T.M., Kada S., et al. SARS-CoV-2 Transmission From People Without COVID-19 Symptoms. JAMA Network Open. 2021;4(1):e2035057. doi: 10.1001/jamanetworkopen.2020.35057. [DOI] [PMC free article] [PubMed] [Google Scholar]
- 13.Aguiar M., Stollenwerk N. SHAR and effective SIR models: from dengue fever toy models to a COVID-19 fully parametrized SHARUCD framework. Communication in Biomathematical Sciences. 2020;3(1):60–89. doi: 10.5614/cbms.2020.3.1.6. [DOI] [Google Scholar]
- 14.Stollenwerk, N., Mar, J., Van-Dierdonck, J.B., et al. (2021). Modeling COVID-19 vaccine efficacy and coverage towards herd-immunity in the Basque Country, Spain. Preprint in MedRxiv 2021.07.12.21260390. doi: 10.1101/2021.07.12.21260390.
- 15.Aguiar M., Van-Dierdonck J.B., Stollenwerk N. Reproduction ratio and growth rates: Measures for an unfolding pandemic. PLOS ONE. 2020;15(7):e0236620. doi: 10.1371/journal.pone.0236620. [DOI] [PMC free article] [PubMed] [Google Scholar]
- 16.Stollenwerk, N., Van-Dierdonck, J.B., Mar, et al. (2021). The interplay between subcritical fluctuations and import: understanding COVID-19 epidemiology dynamics. Preprint in MedRxiv 2020.12.25.20248840. doi: 10.1101/2020.12.25.20248840.
- 17.Aguiar M., Van-Dierdonck J.B. Critical fluctuations in epidemic models explain COVID-19 post-lockdown dynamics. Scientific Reports. 2021;11(1):13839. doi: 10.1038/s41598-021-93366-7. [DOI] [PMC free article] [PubMed] [Google Scholar]
- 18.The Epidemiological SHARUCD Model Dashboard. https://maira-aguiar.eu/covid19_dashboard/.
- 19.Aguiar M., Ortuondo E.M., Bidaurrazaga Van-Dierdonck J., et al. Modelling COVID 19 in the Basque Country from introduction to control measure response. Scientific Reports. 2020;10(1):17306. doi: 10.1038/s41598-020-74386-1. [DOI] [PMC free article] [PubMed] [Google Scholar]
- 20.Aguiar M., Stollenwerk N. Dengvaxia Efficacy Dependency on Serostatus: A Closer Look at More Recent Data. Clin. Infect. Dis. 2018;66(4):641–642. doi: 10.1093/cid/cix882. [DOI] [PubMed] [Google Scholar]
- 21.Aguiar M., Stollenwerk N. Dengvaxia: age as surrogate for serostatus. Lancet. Infect. Dis. 2018;18(3):245. doi: 10.1016/S1473-3099(17)30752-1. [DOI] [PubMed] [Google Scholar]
- 22.Aguiar M., Stollenwerk N. The Impact of Serotype Cross-Protection on Vaccine Trials: DENVax as a Case Study. Vaccines. 2020;8(4):674. doi: 10.3390/vaccines8040674. [DOI] [PMC free article] [PubMed] [Google Scholar]
- 23.Gang Hu. Stationary solution of master equations in the large-system-size limit. Phys. Rev. A. 1987;36(12):5782–5790. doi: 10.1103/PhysRevA.36.5782. [DOI] [PubMed] [Google Scholar]
- 24.Billings L., Mier-y-Teran-Romero L., Lindley B., et al. Intervention-Based Stochastic Disease Eradication. PLoS ONE. 2013;8(8):e70211. doi: 10.1371/journal.pone.0070211. [DOI] [PMC free article] [PubMed] [Google Scholar]
- 25.Stollenwerk N., Sommer P.F., Kooi B., et al. Hopf and torus bifurcations, torus destruction and chaos in population biology. Ecological Complexity. 2017;30:91–99. doi: 10.1016/j.ecocom.2016.12.009. [DOI] [Google Scholar]
- 26.Gillespie D.T. A general method for numerically simulating the stochastic time evolution of coupled chemical reactions. J. Comput. Phys. 1976;22(4):403–434. doi: 10.1016/0021-9991(76)90041-3. [DOI] [Google Scholar]
- 27.Gillespie D.T. Monte Carlo simulation of random walks with residence time dependent transition probability rates. J. Comput. Phys. 1978;28(3):395–407. doi: 10.1016/0021-9991(78)90060-8. [DOI] [Google Scholar]
- 28.Stollenwerk N., Jansen V. Population Biology and Criticality: From critical birth–death processes to self-organized criticality in mutation pathogen systems. Imperial College Press. 2010 doi: 10.1142/p645. [DOI] [Google Scholar]
- 29.Tartof, S.Y., Slezak, J.M., Fischer, H., et al. Effectiveness of mRNA BNT162b2 COVID-19 vaccine up to 6 months in a large integrated health system in the USA: a retrospective cohort study. The Lancet, 398, 10309, 1407–1416. doi: 10.1016/S0140-6736(21)01358-1. [DOI] [PMC free article] [PubMed]
- 30.Martínez-Baz I., Trobajo-Sanmartín C., Miqueleiz A., et al. Product-specific COVID-19 vaccine effectiveness against secondary infection in close contacts, Navarre, Spain, April to August 2021. Eurosurveillance. 2021;26:39. doi: 10.2807/1560-7917.ES.2021.26.39.2100894. [DOI] [PMC free article] [PubMed] [Google Scholar]