Abstract
Aims: Inflammation and hypertension contribute to the progression of atherosclerotic aneurysm in the aorta. Vascular cell metabolism is regarded to modulate atherogenesis, but the metabolic alterations that occur in atherosclerotic aneurysm remain unknown. The present study aimed to identify metabolic pathways and metabolites in aneurysmal walls and examine their roles in atherogenesis.
Methods: Gene expression using microarray and metabolite levels in the early atherosclerotic lesions and aneurysmal walls obtained from 42 patients undergoing aortic surgery were investigated (early lesion n =11, aneurysm n =35) and capillary electrophoresis–time-of-flight mass spectrometry (early lesion n =14, aneurysm n =38). Using immunohistochemistry, the protein expression and localization of the identified factors were examined (early lesion n =11, non-aneurysmal advanced lesion n =8, aneurysm n =11). The roles of the factors in atherogenesis were analyzed in macrophages derived from human peripheral blood mononuclear cells.
Results: Enrichment analysis using 35 significantly upregulated genes (log2 ratio, >3) revealed the alteration of the kynurenine pathway. Metabolite levels of tryptophan, kynurenine, and quinolinic acid and the kynurenine-to-tryptophan ratio were increased in the aneurysmal walls. Gene and protein expression of kynureninase and kynurenine 3-monooxygenase were upregulated and localized in macrophages in the aneurysmal walls. The silencing of kynureninase in the cultured macrophages enhanced the expression of interleukin-6 and indoleamine 2,3-dioxygenase 1.
Conclusion: Our study suggests the upregulation of the kynurenine pathway in macrophages in aortic atherosclerotic aneurysm. Kynureninase may negatively regulate inflammation via the kynurenine pathway itself in macrophages.
Keywords: Atherosclerosis, Aneurysm, Kynureninase, Kynurenine pathway, Macrophage
Introduction
Worldwide, cardiovascular disease is the leading cause of death. In 2015, there were an estimated 8.9 million deaths due to ischemic heart disease, 6.3 million deaths due to cerebrovascular disease, and 170,000 deaths due to aortic aneurysm globally 1) . Atherosclerosis and its complications are the major pathology underlying these cardiovascular diseases. Atherosclerosis is a gradually progressive, inflammatory disease caused by chronic endogenous or exogenous endothelial injuries, or both, and the accumulation of blood contents.
Aortic atherosclerosis is clinically silent, and most atherosclerotic aneurysms are incidentally found during imaging study and suddenly become symptomatic upon rupture or embolism. An aortic angioscopic study reported widely distributed but silent aortic atherosclerosis with vulnerable morphology, plaque rupture, and mural thrombus formation in patients with stable angina pectoris 2) . The mortality rate of ruptured aneurysms is extremely high, and 30 day mortality was found to occur in 27% or 42% of patients treated with endovascular repair or open repair 3) . Optimal medical therapies and a regular follow-up imaging study to measure the diameter are standard medical management; however, no medical drugs have managed to stabilize aortic aneurysm 4) . Thus, a deeper understanding of the mechanisms underlying aortic atherosclerosis and aneurysm formation is required.
The alteration of vascular cell metabolism is considered to contribute to the development of atherosclerosis and reflect a high-risk condition. Clinical and basic studies have reported the accumulation of 18 F-fluorodeoxyglucose (FDG) in advanced atherosclerotic plaques, as shown by positron emission tomography, which indicates enhanced glucose uptake in the vascular cells 5 , 6) . Recent metabolomic studies have identified metabolites that deepen our understanding of atherogenesis 7) , and we have confirmed increased levels of glycolysis, pentose phosphate pathway, and citric acid cycle metabolites in rabbit macrophage-rich atherosclerotic lesions 8) . The increased levels of FDG uptake and expression of a glycolytic enzyme, hexokinase II, were shown to reflect vascular wall hypoxia and thrombogenicity 9 , 10) . Amino acid metabolites, such as arginine and homoarginine, play significant roles in endothelial anti-thrombosis and vascular tone, and endothelial dysfunction via nitric oxide and reactive oxygen species synthesis, respectively 11) . Although the transcriptomic analysis of abdominal aortic aneurysm identified alterations of inflammatory-, tissue remodeling-, and hypoxia-related genes 12 , 13) , knowledge of the altered metabolic pathways and metabolites in aortic atherosclerotic aneurysm is limited.
The present study aimed to identify metabolic pathways and metabolites in aneurysmal walls and investigate their roles in atherogenesis.
Materials and Methods
Patient Population
The present study examined aortic tissue ( n =52) removed from 42 patients who underwent aortic surgery for aneurysm between April 2013 and November 2015. The risk factors for atherosclerosis and aneurysm, medications, and data of blood cell counts and blood chemistry were collected from the clinical records. The ethics committees of the participating institutions approved the study protocol (2012–013).
Tissue Processing
Tissue samples were taken from aneurysmal lesions and non-aneurysmal anastomotic sites, and each sample was separated for microarray, metabolomic, and histological assays. The samples were immersed in RNA Later (Qiagen, Hilden, Germany) for microarray assay and stored at −80℃ until this assay, were frozen in liquid nitrogen and stored at −80℃ for metabolomic assay, and then were fixed in 4% paraformaldehyde and embedded in paraffin for histological evaluation. Four-micrometer-thick sections were stained with hematoxylin and eosin. The histological specimens were identified according to the AHA atherosclerosis classification 14) . The specimens from the aortic lesions were classified as early atherosclerotic lesions (AHA I to III), non-aneurysmal advanced lesion (AHA V and VI), and aneurysmal lesion (AHA V and VI). Tissues with dense calcified atherosclerotic lesions were excluded from the present study considering their low cellularity.
RNA Microarray Analysis and Quantitative Polymerase Chain Reaction (PCR)
Total RNA was extracted from 52 aortic tissues using TRIzol reagent (Sigma, St. Louis, MO, USA) and was purified using the PureLink RNA Mini kit (Thermo Fisher Scientific, Waltham, MA, USA), following the manufacturer’s instructions. Six samples with an RNA integrity number of less than seven were excluded. The early atherosclerotic lesions ( n =11) and aneurysmal lesions ( n =35) were subjected to transcriptomic examination using Affymetrix GeneChip Human Genome U133 Plus 2.0 array (Affymetrix, Santa Clara, CA, USA). The fluorescent signals were quantified by the Robust Multi-array Average method. To identify altered pathways, enrichment analysis was conducted using lists of differentially expressed genes (log2 ratio, >3.0 and <−3.0; Q value, <0.05) (Enrichr_1GO biological process 2018) 15) .
Single-stranded, complementary DNA was synthesized from the RNA using PrimeScript RT reagent kits (Perfect Real Time, Takara Bio, Kusatsu, Japan) and used for real-time PCR. The gene expression of indoleamine 2,3-dioxygenase (IDO)1, tryptophan 2,3-dioxygenase (TDO2), kynurenine 3-monooxygenase (KMO), kynureninase, 3-hydroxyanthranilate 3,4-dioxygenase, interleukin (IL)-6, IL-10, matrix metalloproteinase (MMP)-2, MMP-9, tissue factor, and β-actin was measured using a LightCycler 96 (Roche Diagnostics GmbH, Mannheim, Germany), SYBR Premix EX Taq II (Perfect Real Time, Takara Bio), and specific primers ( Supplementary Table 1 ) . The gene expression was normalized to that of β-actin in aortic tissue or was expressed as the fold change relative to the control level using the ΔΔCt method in a cell culture experiment.
Supplementary Table 1. Sequences of primer used for qPCR analysis.
| Gene | ||
|---|---|---|
| Homo sapiens, tryptophan 2, 3-dioxygenase 2 | forward | 5’-CAGTGATCCTGAAACTGCTGGTG-3’ |
| reverse | 5’-TGCAAACTCTGGAAGCCTGATG-3’ | |
| Homo sapiens, indoleamine 2, 3-dioxygenase 1 | forward | 5’-TCCTGATTCCTGCAAGCCAG-3’ |
| reverse | 5’-AGTGCCTCCAGTTCCTTTGG-3’ | |
| Homo sapiens, kynureninase | forward | 5’-CAGCACTTTAATATTCCTGCCATCA-3’ |
| reverse | 5’-GCATGTGCTAGATCAAAGCCAAC-3’ | |
| Homo sapiens, kynurenine 3-monooxygenase | forward | 5’-AGATGATCACGCGATTTCAGACC-3’ |
| reverse | 5’-CAATGCCAACGCTGCACA-3’ | |
| Homo sapiens, 3-hydroxyanthranilate 3,4-dioxygenase | forward | 5’-CAGGAGCAGCTCAAAGTCATGTTC-3’ |
| reverse | 5’-ATGACCACATCCCGGTGTTTC-3’ | |
| Homo sapiens, interleukin 6 | forward | 5’-AAGCCAGAGCTGTGCAGATGAGTA-3’ |
| reverse | 5’-TGTCCTGCAGCCACTGGTTC-3’ | |
| Homo sapiens, interleukin 10 | forward | 5’-GAGATGCCTTCAGCAGAGTGAAGA-3’ |
| reverse | 5’-AAGGCTTGGCAACCCAGGTA-3’ | |
| Homo sapiens, matrix metalloproteinase-2 | forward | 5’-CTTCCAAGTCTGGAGCGATGTG-3’ |
| reverse | 5’-ATGAGCCAGGAGTCCGTCCTTA-3’ | |
| Homo sapiens, matrix metalloproteinase-9 | forward | 5’-TGGCACCACCACAACATCAC-3’ |
| reverse | 5’-GCAAAGGCGTCGTCAATCA-3’ | |
| Homo sapiens, tissue factor | forward | 5’-TGACCTCACCGACGAGATTGTGAA-3’ |
| reverse | 5’-TCTGAATTGTTGGCTGTCCGAGGT-3’ | |
| Homo sapiens, human β-actin | forward | 5’-TGGCACCCAGCACAATGAA-3’ |
| reverse | 5’-TAAGTCATAGTCCGCCTAGAAGCA-3’ | |
Metabolomic Profiling of Aortic Tissue using Capillary Electrophoresis–Time-of-Flight Mass Spectrometry (CE-TOFMS)
Metabolomic analysis was conducted using the early atherosclerotic lesions ( n =14) and aneurysmal lesions ( n =38). Metabolite extraction and metabolome analysis were conducted at Human Metabolome Technologies, Inc. (HMT) (Tsuruoka, Japan). Aortic samples were weighed, and then, the tissues (30 mg) were added to 500 µL of methanol, containing 50 µM internal standard and homogenized, using a tissue disruptor. Homogenates were mixed with 200 µL of Milli-Q water and 500 µL of chloroform and then separated by centrifugation at 2,300×g for 5 min at 4℃. The upper aqueous layer (400 µL) was passed through a filter (5 kDa cut-off; Millipore) by centrifugation at 9,100×g for 120 min at 4℃ to remove proteins. The filtrates were lyophilized and suspended in 50 µL of Milli-Q water for metabolomic analysis.
Metabolomic analysis was conducted with the Basic Scan package of HMT using CE-TOFMS based on methods described previously 16) . Briefly, CE-TOFMS analysis was conducted using an Agilent CE capillary electrophoresis system equipped with an Agilent 6210 time-of-flight mass spectrometer, Agilent 1100 isocratic HPLC pump, Agilent G1603A CE-MS adapter kit, and Agilent G1607A CE-ESI-MS sprayer kit (Agilent Technologies, Waldbronn, Germany). The systems were controlled by Agilent G2201AA ChemStation software version B.03.01 for CE (Agilent Technologies) and connected by a fused silica capillary (50 µm i.d. ×80 cm total length) with commercial electrophoresis buffer (H3301-1001 and H3302-1021 for cation and anion analyses, respectively; HMT) as the electrolyte. The spectrometer scanned from m/z 50 to 1,000. Peaks were extracted using MasterHands, automatic integration software (Keio University Tsuruoka Town Campus, Tsuruoka, Japan) to obtain peak information including m/z, peak area, and migration time (MT). Signal peaks corresponding to isotopomers, adduct ions, and other product ions of known metabolites were excluded, and the remaining peaks were annotated according to the HMT metabolite database based on their m/z values with the MTs. The areas of the annotated peaks were then normalized based on internal standard levels and sample volumes to obtain relative levels of each metabolite. Hierarchical clustering analysis and principal component analysis were conducted using HMT’s proprietary software, PeakStat and SampleStat, respectively. Detected metabolites were plotted on metabolic pathway maps using VANTED software.
Histology and Immunohistochemistry
Four-micrometer-thick sections of early atherosclerotic lesions ( n =11), non-aneurysmal advanced lesions ( n =8), and aneurysmal lesions ( n =11) were immunohistochemically stained using antibodies against the smooth muscle cell marker smooth muscle actin (mouse monoclonal, clone 1A4; DAKO, Agilent Technologies, Santa Clara, CA, USA), the macrophage marker CD68 (mouse monoclonal, clone PGM-1; DAKO), the endothelial marker CD31 (mouse monoclonal, clone CJ70A; DAKO), the T-cell marker CD3 (mouse monoclonal, clone F7.2.38; DAKO), the B-cell marker CD20 (mouse monoclonal, clone L26; DAKO), the plasma cell marker CD138 (mouse monoclonal, clone MI15; DAKO), kynureninase (rabbit polyclonal; GenTex, Irvine, CA, USA), and KMO (rabbit polyclonal; Atras Antibodies AB, Stockholm, Sweden). The negative controls included non-immune mouse or rabbit IgG (Jackson ImmunoResearch, Baltimore, MA, USA). The sections were stained with EnVision anti-mouse or rabbit immunoglobulin (DAKO). Horseradish peroxidase activity was visualized using 3,3’-diaminobenzidine containing hydrogen peroxide, and the sections were counterstained with Meyer’s hematoxylin. The microscopic images of immunopositive areas were captured using an image analysis software (cellSens Standard; Olympus, Tokyo, Japan). The areas of the antigens were semi-quantified using a color image analysis system (WinRoof; Mitani, Fukui, Japan). These areas are expressed as ratios of positively stained areas per vascular area, as described by Kuroiwa et al. 17) .
Isolation of Human Peripheral Blood Mononuclear Cells (PBMCs) and Macrophage Differentiation
PBMCs were obtained from healthy volunteers using SepMate TM -50 (StemCell Technologies, Vancouver, Canada), following the manufacturer’s instructions with some modifications. Briefly, Ficoll-Paque TM PLUS (GE Healthcare, Chicago, IL, USA) was filled through the insert in the SepMate TM tube and pipetted onto the tube insert with a 30 mL blood sample diluted 50% in Dulbecco’s phosphate-buffered saline containing 2% fetal bovine serum (Sigma-Aldrich, St. Louis, MO, USA) and 1 mM ethylenediaminetetraacetic acid (Wako, Tokyo, Japan). After centrifugation at 1,200×g for 15 min at room temperature (RT), the plasma layer containing PBMCs was transferred to another new Falcon tube. Then, platelets were removed through further centrifugation at 200×g for 10 min at RT. Following supernatant removal, cell pellets were resuspended in RPMI1640 containing 10% heat-inactivated fetal bovine serum and antibiotics (Zellshield®; Minerva Biolabs, Berlin, Germany), and cells were counted and uniformly seeded into tissue culture plates. Then, a cocktail of recombinant human granulocyte colony-stimulating factor (2 ng/mL; PEPROTECH, Rocky Hill, NJ, USA) and recombinant human macrophage colony-stimulating factor (50 ng/mL; PEPROTECH) was added to the PBMCs and incubated for 7 days for their differentiation into macrophages. After the removal of non-adherent cells, macrophages were washed three times with Dulbecco’s phosphate-buffered saline and used for the following experiments. The institutional review board at the University of Miyazaki approved the present study (Approval No. O-0272).
IFN-γ Stimulation and Kynureninase Inhibition by Small Interfering RNA (siRNA) in Macrophages Derived from PBMCs
Macrophages were stimulated with recombinant human interferon-γ (rhIFN-γ; R&D Systems, Minneapolis, MN, USA) at a final concentration of 10 ng/mL in serum- and antibiotic-free RPMI1640 for 24 h. Macrophages were transfected by incubating human kynureninase siRNA (Silencer® Select, siRNA ID; s17103 and/or s17104; Life Technologies, Carlsbad, CA, USA) or negative control siRNA (Silencer® Select, Negative Control #2 siRNA; Life Technologies) at a final concentration of 37.5 nM under the serum- and antibiotic-free RPMI1640 for 24 h, using Viromer® Blue transfection reagent (Lipocalyx). To examine siRNA-induced cell damage, lactate dehydrogenase (LDH) in the medium was measured using the LDH cytotoxicity assay kit (Nacalai Tesque, Kyoto, Japan). First, 100 µL of the supernatant from each well in which macrophages had been cultured under the indicated conditions was transferred to an optically transparent 96-well plate. A total of 100 µL of substrate solution was added and incubated for 20 min at RT under protection from light to each well of the above plate. Finally, 50 µL of stop solution was added to each well, and the absorbance was measured at 490 nm using a microplate reader. The results are presented as absorbance values and expressed as mean±standard deviation (SD).
IL-6 ELISA
The level of IL-6 in culture medium was measured by Quantikine® ELISA (R&D Systems), following the manufacturer’s instructions.
Statistical Analysis
Data are expressed as median and range or mean ±SD. Differentially expressed genes were calculated using unpaired t -test with Benjamini–Hochberg multiple testing correction for the microarray assay results. Differences between the groups on quantitative PCR, metabolite levels, and the results of cell culture experiment were analyzed using the Mann–Whitney U test. Differences among the groups were analyzed using the Kruskal–Wallis test with Dunn’s multiple comparison test. Q value (adjusted P value using the Benjamini–Hochberg method) of <0.05 and P value of <0.05 were deemed to indicate statistical significance.
Results
Patient Characteristics
Supplementary Table 2 shows the clinical characteristics of the 42 patients with aortic aneurysm. Their mean age was 73 yr, and 76% were male. The aneurysms were located in thoracic aorta ( n =17, 40%) and abdominal aorta ( n =25, 60%). Generally, 95% of the patients had hypertension, 79% had dyslipidemia, and 45% had diabetes or impaired glucose tolerance. In histological sections, plaque disruption with mural thrombus formation was observed in 63% of atherosclerotic aneurysms and 25% of non-aneurysmal advanced atherosclerotic lesions but in no early atherosclerotic lesions.
Supplementary Table2. Clinical characteristics of study patients ( n = 42) .
| n (%) or mean±SD | |
|---|---|
| Age | 72.9±7.8 |
| Male gender | 32 (76%) |
| Body mass index (Kg/m 2 ) | 23.3±9.8 |
| Systolic blood pressure (mmHg) | 131±13 |
| Diastolic blood pressure (mmHg) | 76±12 |
| Aneurysm maximum diameter (mm) | 56.4±2.3 |
| Hypertension | 40 (95) |
| Diabetes mellitus or impaired glucose tolerance | 19 (45) |
| Dyslipidemia | 33 (79) |
| Chronic obstructive pulmonary disease | 4 (10) |
| Smoking | 31 (74) |
| Coronary artery disease | 11 (26) |
| Cerebrovascular disease | 11 (26) |
| Sample location | |
| Thoracic aorta | 17 (40) |
| Abdominal aorta | 25 (60) |
| Complete blood count and blood chemistry | |
| White blood cell (/µL) | 6376±1466 |
| Hemoglobin(g/dL) | 13.1±1.6 |
| Hematocrit (%) | 39.7±4.8 |
| Platelet (×10 4 /µL) | 18.1±5.3 |
| Total Cholesterol (mg/dL) | 179.1±33.4 |
| High density lipoprotein cholesterol (mg/dL) | 44.9±10.2 |
| Low density lipoprotein cholesterol (mg/dL) | 111.5±31.4 |
| Triglyceride (mg/dL) | 122.3±64.3 |
| Fasting blood glucose (mg/dL) | 85.9±0.6 |
| Fasting insulin (µU/mL) | 9.0±10.0 |
| HemoglobinA 1C (%) | 5.8±0.6 |
| Homeostasis model assessment insulin resistance | 2.07±2.87 |
| Creatinine (mg/dL) | 1.03±0.3 |
| C-reactive protein (mg/dL) | 0.20±0.24 |
| Medication | |
| Angiotensin-converting enzyme inhibitors | 5 (12) |
| Angiotensin receptor blockers | 23 (55) |
| β-blocker | 12 (29) |
| Calcium channel blockers | 31 (74) |
| Aspirin | 11 (26) |
| Statins | 25 (60) |
| Anti-diabetics | 4 (10) |
Gene Expression in Early Atherosclerosis and Atherosclerotic Aneurysm
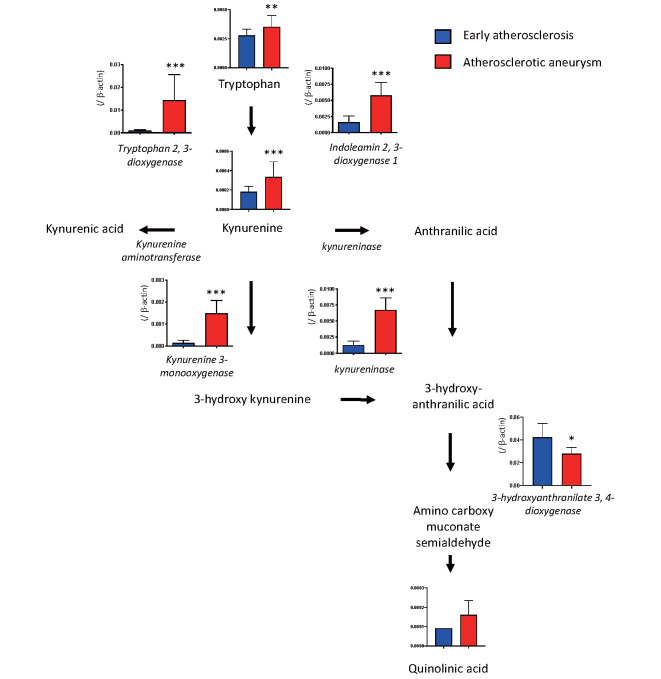
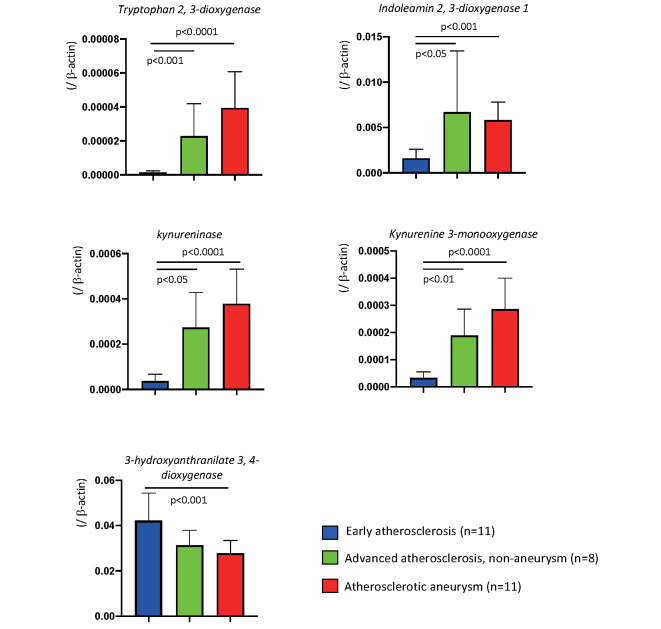
To conduct a comprehensive evaluation of gene expression in the early atherosclerotic and atherosclerotic aneurysmal lesions, we conducted transcriptome analysis with microarray in the aortic lesions. Table 1 shows a list of 35 differentially expressed genes (log2 ratio, >3; Q value, <0.05). Enrichment analysis using the 35 upregulated genes revealed alterations of the kynurenine pathway, cysteine-type endopeptidase activity involved in the apoptotic signaling pathway, extracellular matrix disassembly, and B-cell chemotaxis, among others ( Supplementary Table 3 ) . Table 2 shows a list of the 21 differentially expressed genes (log2 ratio, <−3; Q value, <0.05). Enrichment analysis using the 21 downregulated genes revealed alterations of the regulation of bone resorption, blood pressure, idolealkylamine metabolic pathway, synaptic transmission, and smooth muscle cell differentiation, among others ( Supplementary Table 4 ) . The results suggest enhancement of kynurenine pathway activity in atherosclerotic aneurysm among metabolic pathways. Real-time PCR assay confirmed the overexpression of kynurenine pathway enzymes, namely, IDO1, TDO2, kynureninase, and KMO, and the downregulation of 3-hydroxyanthranilate 3,4-dioxygenase in atherosclerotic aneurysm, compared with the levels in the early atherosclerotic lesions ( Fig.1 ) . The mRNA of IDO1, TDO2, kynureninase, and KMO also overexpressed in non-aneurysmal advanced atherosclerotic lesions, compared with the levels in the early atherosclerotic lesions ( Supplementary Fig.1 ) . There were no genes that were differentially expressed (Q<0.05) between non-diabetics and those with diabetes mellitus/impaired glucose tolerance.
Table 1. Differentially expressed upregulated genes (Log2 ratio > 3, Q<0.05)in aneurysm.
| Probeset_Id | Gene_Symbol | Log2Ratio | Q value |
|---|---|---|---|
| 204580_at | MMP12 | 6.57 | 1.86164E-08 |
| 236028_at | IBSP | 5.85 | 1.07746E-10 |
| 209395_at | CHI3L1 | 5.56 | 4.52479E-07 |
| 203936_s_at | MMP9 | 4.81 | 2.79815E-11 |
| 37892_at | COL11A1 | 4.50 | 1.5779E-14 |
| 223484_at | C15orf48 | 4.34 | 1.75656E-08 |
| 212942_s_at | CEMIP | 4.32 | 8.46489E-13 |
| 212657_s_at | IL1RN | 4.31 | 2.41151E-10 |
| 204475_at | MMP1 | 4.20 | 3.33309E-11 |
| 204259_at | MMP7 | 4.14 | 8.82392E-08 |
| 219434_at | TREM1 | 3.97 | 2.0773E-15 |
| 206134_at | ADAMDEC1 | 3.71 | 1.10951E-06 |
| 204430_s_at | SLC2A5 | 3.66 | 5.77635E-12 |
| 222939_s_at | SLC16A10 | 3.58 | 1.52386E-11 |
| 213909_at | LRRC15 | 3.58 | 8.62686E-12 |
| 205943_at | TDO2 | 3.44 | 2.70123E-13 |
| 210004_at | OLR1 | 3.43 | 2.81577E-05 |
| 206858_s_at | HOXC6 | 3.42 | 0.00037992 |
| 202888_s_at | ANPEP | 3.41 | 8.62166E-17 |
| 205242_at | CXCL13 | 3.40 | 9.46235E-07 |
| 203665_at | HMOX1 | 3.39 | 1.72862E-13 |
| 209351_at | KRT14 | 3.25 | 1.47257E-07 |
| 211643_x_at | IGK ///IGKC | 3.23 | 3.33309E-11 |
| 210845_s_at | PLAUR | 3.18 | 7.53482E-11 |
| 211645_x_at | IGKV1-17///IGKV1-17 | 3.18 | 3.63523E-11 |
| 205568_at | AQP9 | 3.18 | 3.35934E-10 |
| 209875_s_at | SPP1 | 3.17 | 2.38724E-05 |
| 227566_at | LOC102725271///NTM | 3.14 | 6.51337E-08 |
| 211634_x_at | IGHM | 3.14 | 1.32342E-08 |
| 32128_at | CCL18 | 3.09 | 0.003213613 |
| 204638_at | ACP5 | 3.08 | 4.84916E-06 |
| 202859_x_at | CXCL8 | 3.06 | 8.59447E-07 |
| 230748_at | SLC16A6 | 3.05 | 1.87046E-08 |
| 209555_s_at | CD36 | 3.02 | 1.91741E-08 |
| 205306_x_at | KMO | 3.02 | 1.03391E-08 |
Supplementary Table 3. Biological processes associated with the upregulated genes.
| Term | Overlap | p -value | Q-value | Combined Score |
|---|---|---|---|---|
| kynurenine metabolic process (GO: 0070189) | 2/8 | 8.28E-05 | 4.69E-02 | 1342.81 |
| regulation of cysteine-type endopeptidase activity involved in apoptotic signaling pathway (GO: 2001267) | 2/9 | 1.06E-04 | 4.52E-02 | 1161.83 |
| indolalkylamine catabolic process (GO: 0046218) | 2/9 | 1.06E-04 | 4.17E-02 | 1161.83 |
| tryptophan catabolic process (GO: 0006569) | 2/10 | 1.33E-04 | 4.84E-02 | 1020.27 |
| tryptophan metabolic process (GO: 0006568) | 2/10 | 1.33E-04 | 4.51E-02 | 1020.27 |
| intestinal absorption (GO: 0050892) | 2/13 | 2.29E-04 | 7.31E-02 | 736.76 |
| extracellular matrix disassembly (GO: 0022617) | 5/78 | 2.35E-07 | 3.99E-04 | 559.16 |
| B cell chemotaxis (GO: 0035754) | 1/6 | 1.05E-02 | 7.02E-01 | 434.35 |
| intermediate filament bundle assembly (GO: 0045110) | 1/6 | 1.05E-02 | 6.93E-01 | 434.35 |
| sterol import (GO: 0035376) | 1/6 | 1.05E-02 | 6.84E-01 | 434.35 |
| positive regulation of receptor binding (GO: 1900122) | 1/6 | 1.05E-02 | 6.75E-01 | 434.35 |
| cellular response to bacterial lipopeptide (GO: 0071221) | 1/6 | 1.05E-02 | 6.67E-01 | 434.35 |
| cholesterol import (GO: 0070508) | 1/6 | 1.05E-02 | 6.59E-01 | 434.35 |
| positive regulation of keratinocyte migration (GO: 0051549) | 1/6 | 1.05E-02 | 6.51E-01 | 434.35 |
| aromatic amino acid family catabolic process (GO: 0009074) | 2/20 | 5.54E-04 | 1.35E-01 | 428.46 |
Enrichment analysis using upregulated genes (Log2 ratio> 3, Q<0.05)
Table 2. Differentially expressed downregulated genes (Log2 ratio <-3, Q<0.05) in aneurysm.
| Probeset_Id | Gene_Symbol | Log2Ratio | q.value |
|---|---|---|---|
| 229339_at | MYOCD | -3.01 | 1.04239E-09 |
| 206163_at | MAB21L1///MIR548F5 | -3.02 | 2.86195E-05 |
| 237094_at | FAM19A5 | -3.08 | 4.73173E-08 |
| 206339_at | CARTPT | -3.21 | 0.001015519 |
| 210302_s_at | MAB21L2 | -3.22 | 2.66037E-05 |
| 226281_at | DNER | -3.22 | 8.05926E-07 |
| 205358_at | GRIA2 | -3.27 | 7.54217E-11 |
| 219791_s_at | HAND2-AS1 | -3.34 | 9.79795E-07 |
| 213228_at | PDE8B | -3.39 | 5.33939E-09 |
| 228796_at | CPNE4 | -3.44 | 5.30392E-06 |
| 209793_at | GRIA1 | -3.47 | 1.57857E-09 |
| 227209_at | CNTN1 | -3.56 | 1.49466E-09 |
| 210292_s_at | PCDH11X///PCDH11Y | -3.69 | 4.09956E-07 |
| 214961_at | MTUS2 | -3.80 | 8.21645E-11 |
| 1563933_a_at | PLD5 | -3.80 | 2.20896E-12 |
| 231626_at | TPH1 | -3.83 | 2.18209E-15 |
| 219837_s_at | CYTL1 | -4.04 | 2.69301E-08 |
| 239913_at | SLC10A4 | -4.08 | 8.77746E-06 |
| 213745_at | ATRNL1 | -4.12 | 4.89661E-13 |
| 229831_at | CNTN3 | -4.45 | 9.43889E-14 |
| 223869_at | SOST | -4.65 | 1.55716E-08 |
Supplementary Table 4. Biological processes associated with downregulated genes.
| Term | Overlap | p -value | Q-value | Combined Score |
|---|---|---|---|---|
| negative regulation of bone resorption (GO: 0045779) | 1/6 | 6.28E-03 | 1 | 804.72 |
| positive regulation of blood pressure (GO: 0045777) | 1/6 | 6.28E-03 | 1 | 804.72 |
| positive regulation of catecholamine secretion (GO: 0033605) | 1/6 | 6.28E-03 | 1 | 804.72 |
| positive regulation of cardiac muscle tissue development (GO: 0055025) | 1/6 | 6.28E-03 | 1 | 804.72 |
| indolalkylamine metabolic process (GO: 0006586) | 1/6 | 6.28E-03 | 1 | 804.72 |
| synaptic transmission, glutamatergic (GO: 0035249) | 2/21 | 2.18E-04 | 1 | 764.77 |
| regulation of transcription from RNA polymerase II promoter involved in myocardial precursor cell differentiation (GO: 0003256) | 1/7 | 7.33E-03 | 1 | 668.85 |
| regulation of smooth muscle cell differentiation (GO: 0051150) | 1/7 | 7.33E-03 | 1 | 668.85 |
| positive regulation of neurological system process (GO: 0031646) | 1/7 | 7.33E-03 | 1 | 668.85 |
| negative regulation of bone remodeling (GO: 0046851) | 1/8 | 8.37E-03 | 1 | 569.41 |
| regulation of positive chemotaxis (GO: 0050926) | 1/8 | 8.37E-03 | 1 | 569.41 |
| negative regulation of appetite (GO: 0032099) | 1/8 | 8.37E-03 | 1 | 569.41 |
| regulation of cell communication (GO: 0010646) | 2/71 | 2.50E-03 | 1 | 160.76 |
| modulation of chemical synaptic transmission (GO: 0050804) | 2/82 | 3.32E-03 | 1 | 132.62 |
| negative regulation of multicellular organismal process (GO: 0051241) | 2/125 | 7.53E-03 | 1 | 74.50 |
Enrichment analysis using downregulated genes (Log2 ratio > -3, Q<0.05)
Fig.1.
mRNA expression of kynurenine pathway enzymes and relative amounts of metabolites in the early atherosclerotic lesion and atherosclerotic aneurysm (enzymes, n =11 in each; metabolites, early atherosclerotic lesions n =14, atherosclerotic aneurysms n =38; in early lesions, quinolinic acid was detected in one lesion). * p <0.01, ** p <0.001, *** p <0.0001, Mann–Whitney U test
Supplementary Fig.1.
The mRNA expression of kynurenine pathway enzymes in early atherosclerosis, advanced atherosclerosis non-aneurysm, and atherosclerotic aneurysm. Kruskal-Wallis test with Dunn’s multiple comparison tests. Data are expressed as mean and standard deviation.
Metabolic Differences in Early Atherosclerosis and Atherosclerotic Aneurysm
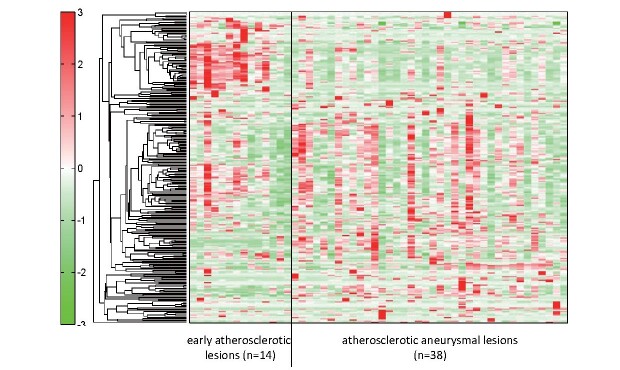
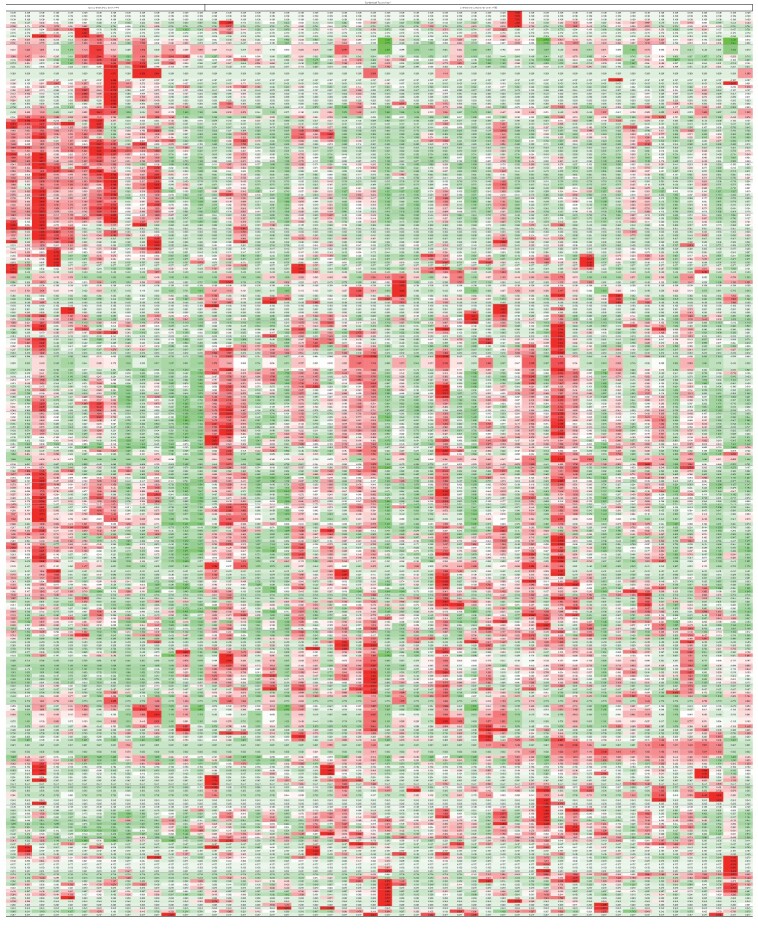
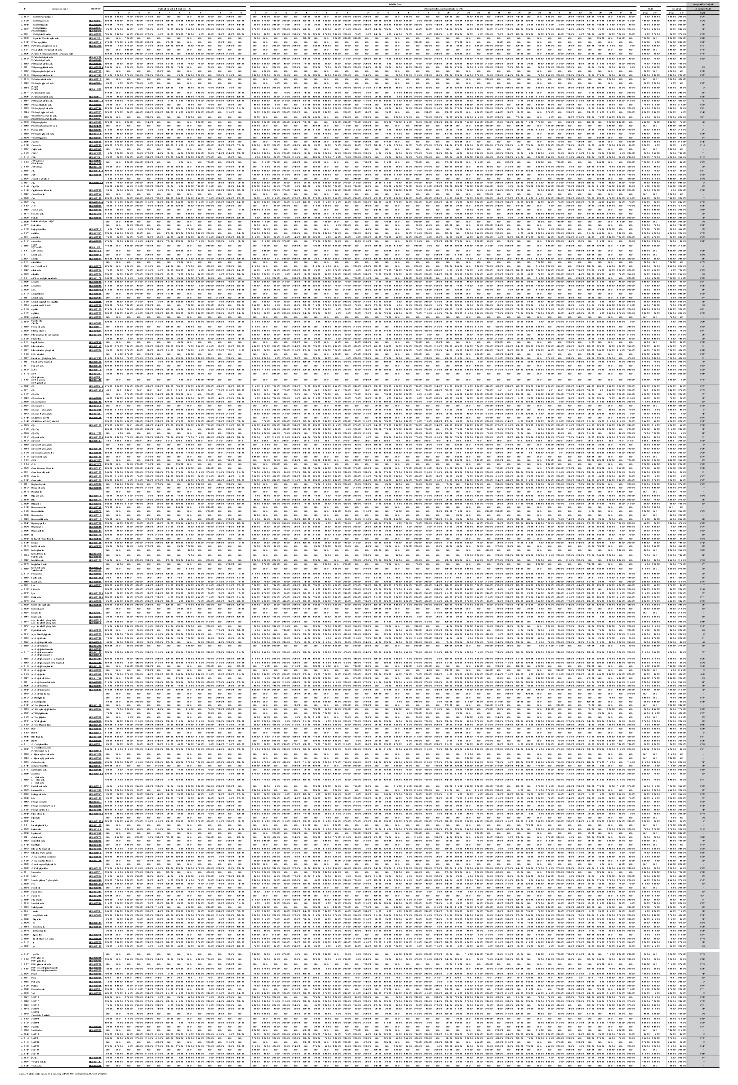
To conduct a comprehensive evaluation of metabolic status in early atherosclerotic and atherosclerotic aneurysmal lesions, we conducted metabolomic analysis with CE-TOFMS in the aortic lesions. This analysis identified 258 metabolites (149 cationic and 109 anionic metabolites) in the aortic tissues. Fig.2 and Supplementary Table 5 show the hierarchical clustering analysis results of metabolites in the early atherosclerotic and aneurysmal lesions. The hierarchical tree indicates the relative distance among the metabolite peaks. The red or green densities indicate high or low concentrations of metabolites, respectively. The hierarchical clustering analysis revealed metabolic differences between early atherosclerotic and atherosclerotic aneurysmal lesions.
Fig.2. Metabolomic analysis of early atherosclerotic lesions and atherosclerotic aneurysms.
Representative heatmap created using hierarchical clustering analysis shows metabolic differences between groups. Supplementary Table 5 shows the original data for each metabolite
Supplementary Table 5.
Hierarchical clustering analysis of early atherosclerotic lesion and atherosclerotic aneurysmal lesion
Supplementary Table 6 shows metabolites whose relative levels were more than 1.5-fold (19 metabolites) or less than one-half (22 metabolites) of the levels in the atherosclerotic aneurysmal lesions and whose levels were detectable as at least one-half of the samples in aneurysmal lesions (for “abundant” metabolites) or early atherosclerotic lesions (for “deficient” metabolites). The abundant metabolites were associated with the kynurenine pathway (kynurenine and quinolinic acid), glycolysis/gluconeogenesis (dihydroxyacetone phosphate and fructose 6-phosphate), and individual pathway. By contrast, the deficient metabolites were associated with purine metabolism (inosine, adenine, adenosine triphosphate, adenosine monophosphate, adenosine diphosphate, and adenosine), glycolysis/gluconeogenesis (3-phosphoglyceric acid, phosphoenolpyruvic acid, and 2,3-diphophoglyceric acid), pentose phosphate pathway (sedoheptulose 7-phosphate and 6-phosphogluconic acid), and individual pathway.
Supplementary Table 6. Altered metabolites in atherosclerotic aneurysmal lesions compared with early atherosclerotic lesions.
| Metabolite | KEGG ID | ratio | pathway |
|---|---|---|---|
| aneurysm/early atherosclerotic lesion > 1.5 (relative mean value) | |||
| Cystine | C00491, C01420 | 6.61 | cysteine and methionine metabolism |
| N 8 -Acetylspermidine | C01029 | 6.50 | |
| N -Acetyllysine | C12989 | 4.48 | |
| Daminozide | C10996 | 2.85 | |
| Ala-Ala | C00993 | ||
| Glycerophosphocholine | C00670 | 2.83 | glycerophospholipid metabolism |
| Quinic acid | C00296 | 2.65 | phenylalanine, tyrosine and tryptophan biosynthesis |
| Putrescine | C00134 | 2.15 | arginine and proline metabolism |
| 4-Methyl-2-oxovaleric acid | C00233 | 2.01 | |
| 3-Methyl-2-oxovaleric acid | C00671, C03465 | ||
| Spermidine | C00315 | 1.93 | polyamine metabolism |
| Glu-Glu | C01425 | 1.87 | |
| Kynurenine | C00328, C01718 | 1.83 | kynurenine metabolism |
| Dihydroxyacetone phosphate | C00111 | 1.80 | glycolysis/gluconeogenesis |
| Fructose 6-phosphate | C05345, C00085 | 1.76 | glycolysis/gluconeogenesis |
| Quinolinic acid | C03722 | 1.75 | kynurenine metabolism |
| Asymmetric dimethylarginine | C03626 | 1.71 | |
| Myristoleic acid | C08322 | 1.64 | |
| Gly-Gly | C02037 | 1.60 | |
| N -Acetylneuraminic acid | C00270 | 1.59 | amino sugar and nucleotide sugar metabolism |
| Mucic acid | C00879, C01807 | 1.58 | ascorbate and aldarate metabolism |
| aneurysm/early athrosclerotic lesion<0.5 (relative mean value) | |||
| Inosine | C00294 | 0.48 | purine metabolism |
| myo -Inositol 2-phosphate | NoID | 0.47 | |
| Sedoheptulose 7-phosphate | C05382 | 0.47 | pentose phosphate pathway |
| 3-Phosphoglyceric acid | C00197 | 0.45 | glycolysis/gluconeogenesis |
| Lidocaine | C07073 | 0.44 | |
| Phosphoenolpyruvic acid | C00074 | 0.43 | glycolysis/gluconeogenesis |
| 2, 3-Diphosphoglyceric acid | C01159 | 0.41 | glycolysis/gluconeogenesis |
| Adenine | C00147 | 0.40 | purine metabolism |
| Adenosine triphosphate | C00002 | 0.39 | purine metabolism |
| Adenosine monophosphate | C00020 | 0.38 | purine metabolism |
| Cytidine | C00475 | 0.38 | pyrimidine metabolism |
| Phosphocreatine | C02305 | 0.38 | arginine and proline metabolism |
| Nicotinamide adenine dinucleotide | C00003 | 0.36 | coenzyme |
| gamma-aminobutyric acid | C00334 | 0.32 | |
| 3-Aminoisobutyric acid | C03284, C05145 | 0.29 | valine, leucine and isoleucine degradation |
| Nicotinamide mononucleotide | C00455 | 0.29 | nicotinate and nicotinamide metabolism |
| Hypotaurine | C00519 | 0.27 | taurineandhypotaurinemetabolism |
| 6-Phosphogluconic acid | C00345 | 0.26 | pentose phosphate pathway |
| Anserine_divalent | C01262 | 0.24 | histidine metabolism |
| Glutathione (GSSG)_divalent | C00127 | 0.20 | glutathione metabolism |
| Adenosine diphosphate | C00008 | 0.18 | purine metabolism |
| Adenosine | C00212 | 0.14 | purine metabolism |
Relative metabolite levels of tryptophan, kynurenine, and quinolinic acid were higher in aneurysmal lesions than those in the early atherosclerotic lesions ( Fig.1 , Supplementary Table 7 ) . Among early atherosclerotic lesions, quinolinic acid was detectable in only one lesion. The kynurenine-to-tryptophan ratio was also higher in aneurysmal lesions (0.025±0.015, n =38) than in the early atherosclerotic lesions (0.016±0.005, n =14; p <0.001).
Supplementary Table 7.
Relative levels of metabolites in early atherosclerotic lesions and atherosclerotic aneurysm
Macrophages Express Kynureninase and KMO in Atherosclerotic Aneurysm
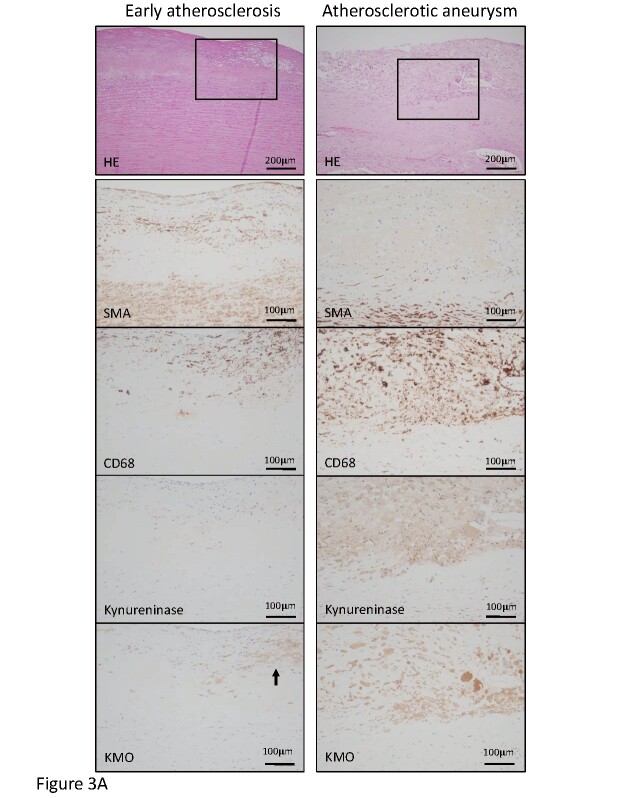
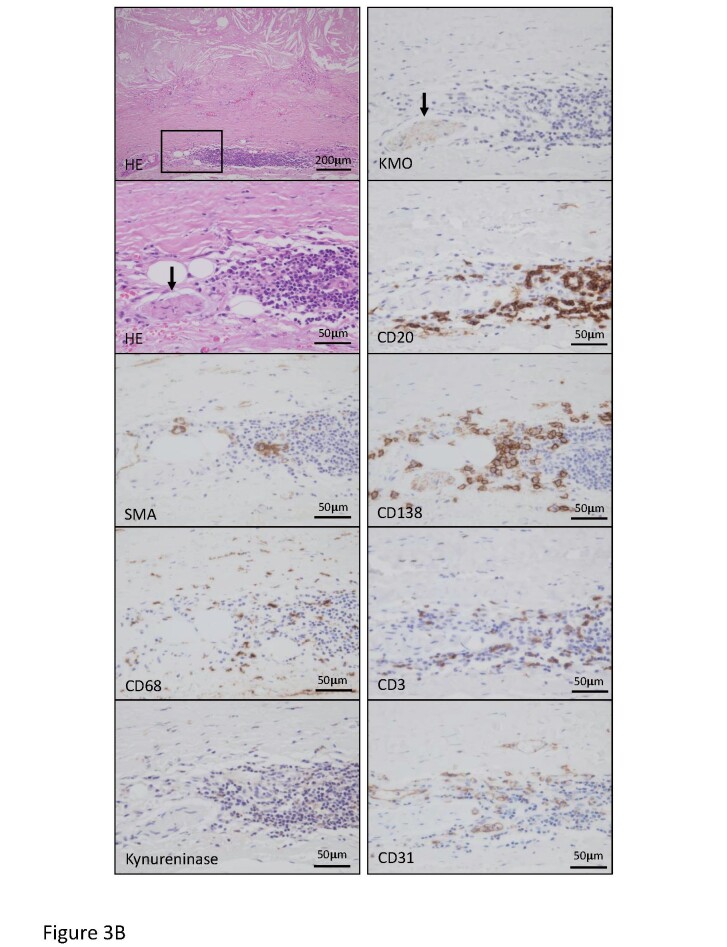
The transcriptomic and metabolomic analyses revealed a significant alteration of the kynurenine pathway in atherosclerotic aneurysmal lesions. We examined the protein expression and localization of kynureninase and KMO in the aortic lesions. Fig.3 , Supplementary Fig.2 , and Table 3 show cellular components and the expression of kynurenine pathway enzymes in early atherosclerotic, non-aneurysmal advanced atherosclerotic, and atherosclerotic aneurysmal lesions. The areas immunopositive for macrophages, T cells, kynureninase, and KMO were larger in the non-aneurysmal advanced atherosclerotic and atherosclerotic aneurysmal lesions than those in the early atherosclerotic lesions. The areas immunopositive for B cells and plasma cells were larger in the atherosclerotic aneurysmal lesions than those in the early atherosclerotic lesions. The area immunopositive for SMCs progressively decreased and was significantly smaller in the atherosclerotic aneurysmal wall than that in the early atherosclerotic aorta ( Table 3 ) . Kynureninase was predominantly expressed in macrophages in non-aneurysmal advanced atherosclerotic lesions and atherosclerotic aneurysm ( Fig.3A , Supplementary Fig.2 ) . KMO was expressed in macrophages in early atherosclerotic intima, non-aneurysmal advanced atherosclerotic lesion, and the aneurysmal wall ( Fig.3A , Supplementary Fig.2 ) and also expressed in adventitial peripheral nerve bundles with lymphoid aggregates in atherosclerotic aneurysm ( Fig.3B ) . The lymphoid aggregates comprised B cells, plasma cells, T cells, macrophages, and capillary vessels ( Fig.3B ) .
Fig.3. Representative histological and immunohistochemical images for cells and kynurenine pathway enzymes in the early atherosclerotic lesion and atherosclerotic aneurysm.
A. Hematoxylin–eosin (HE) staining and immunohistochemistry for smooth muscle cells (SMA), macrophages (CD68), kynureninase, and kynurenine 3-monooxygenase (KMO) in the early atherosclerotic lesion (left column) and atherosclerotic aneurysm (right column). Squares in HE staining indicate areas of high magnification of immunohistochemical images. The left column shows fibrous intimal thickening with the accumulation of foamy macrophages. The intimal macrophages express KMO (arrow) but not kynureninase. The right column shows advanced atherosclerotic plaque formation and medial degeneration and angiogenesis. Macrophages express both kynureninase and KMO.
Supplementary Fig.2.
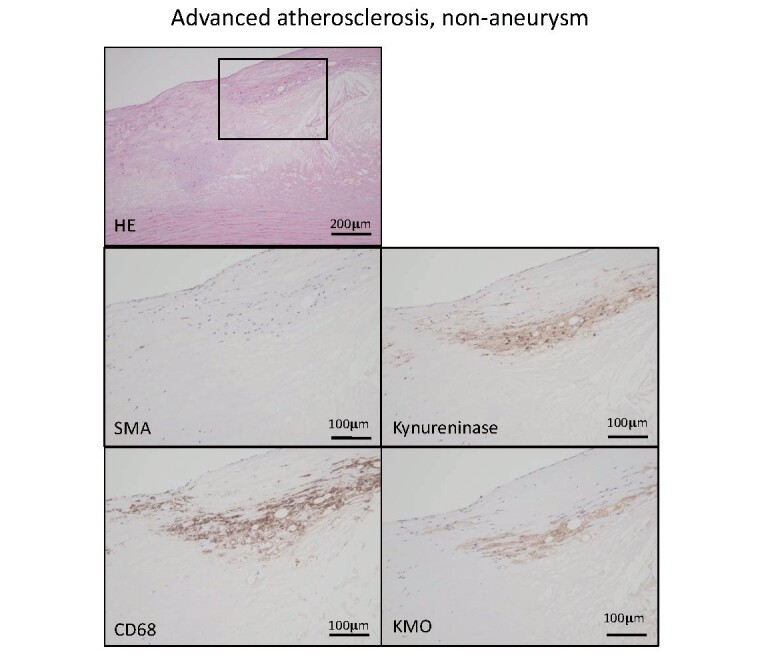
Hematoxylin eosin and immunohistochemistry for smooth muscle actin (SMA), macrophage (CD68), kynureninase, and kynurenine 3-monooxygenase (KMO) in non-aneurysmal advanced atherosclerotic lesion.
Square in HE staining indicates an area of other high-magnification images. Macrophages express kynureninase and KMO.
Table 3. Immunopositive area of cells and kynurenine enzymes in aorta.
| A. early lesion ( n = 11) | B. non-aneurysmal advanced lesion ( n = 8) | C. aneurysmal lesion ( n = 11) | p value | |||
|---|---|---|---|---|---|---|
| A vs. B | A vs. C | B vs. C | ||||
| SMA (smooth muscle cell) | 30.8 (10.8 - 42.4) | 16.2 (12.7 - 25.5) | 8.1 (0.2 - 26.6) | 0.12 | <0.001 | 0.36 |
| CD68 (macrophage) | 0.01 (0 - 0.08) | 1.6 (0.6 - 5.5) | 4.9 (0.3 - 11.9) | <0.01 | <0.0001 | 1 |
| CD3 (T cell) | 0.004 (0 - 0.03) | 0.04 (0.01 - 0.2) | 0.03 (0 - 0.7) | <0.01 | <0.01 | 1 |
| CD20 (B cell) | 0.007 (0 - 0.02) | 0.01 (0.003 - 0.07) | 0.42 (0.001 - 5.1) | 1 | <0.05 | 0.13 |
| CD138 (plasma cell) | 0.004 (0.001 - 0.2) | 0.019 (0.006 - 0.11) | 0.16 (0.01 - 0.53) | 0.12 | <0.001 | 0.29 |
| CD31 (endothelial cell) | 1.2 (0.7 - 3.4) | 0.8 (0.3 - 2.0) | 3.2 (0.9 - 6.3) | 0.87 | <0.05 | <0.01 |
| Kynureninase | 0.004 (0 - 0.19) | 0.4 (0.2 - 3.5) | 1.4 (0.004 - 15.1) | <0.05 | <0.001 | 1 |
| Kynurenine 3-monooxygenase | 0.02 (0 - 0.15) | 0.5 (0.2 - 2.7) | 0.6 (0 - 4.8) | <0.01 | <0.01 | 1 |
Data are expressed as median and range. SMA (smooth muscle actin) Kruskal-Wallis test with Dunn’s multiple comparison test.
Fig.3. Representative histological and immunohistochemical images for cells and kynurenine pathway enzymes in the early atherosclerotic lesion and atherosclerotic aneurysm.
B. HE staining and immunohistochemistry for smooth muscle cells (SMA), macrophages (CD68), kynureninase, KMO, B cells (CD20), plasma cells (CD138), T cells (CD3), and endothelial cells (CD31) in atherosclerotic aneurysm. Square in HE staining indicates an area of other high-magnification images. Advanced atherosclerotic change with medial degeneration and accumulation of lymphoid cells in adventitia. A peripheral nerve bundle expresses KMO (arrows) but not kynureninase and closely localizes with the lymphoid aggregate. Lymphoid aggregate comprises B cells, plasma cells, T cells, and macrophages with capillary vessels.
Upregulation of IDO1 and IL-6 by Kynureninase Inhibition in Cultured Macrophages
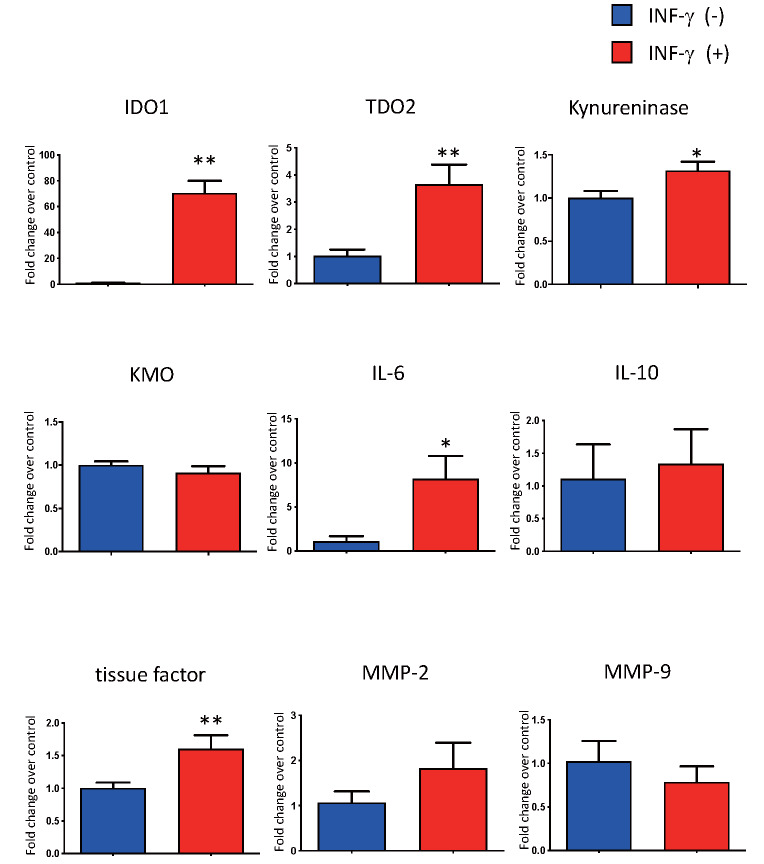
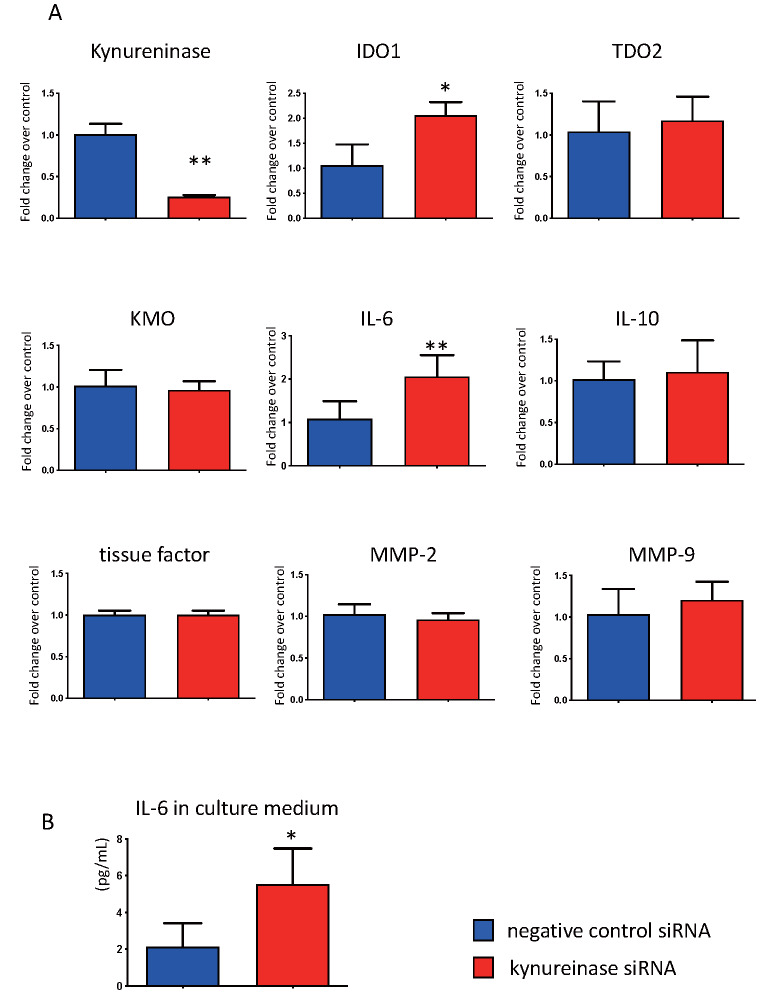
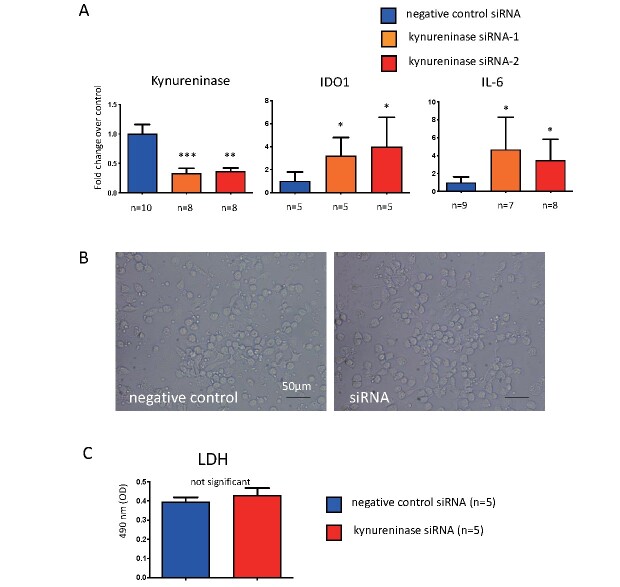
To examine the roles of kynureninase in atherogenesis, we conducted cell culture experiments with macrophages derived from PBMCs. Macrophages differentiated with M-CSF and GM-CSF expressed kynurenine pathway enzymes, namely, TDO2, kynureninase, and KMO. IFN-γ stimulation significantly upregulated the expression of IDO1, TDO2, kynureninase, IL-6, and tissue factor, whereas KMO expression did not alter such expression ( Fig.4 ) . Kynureninase siRNA suppressed the mRNA levels to approximately 25%. The kynureninase inhibition increased the expression of IDO1 and IL-6 but not of TDO2 and KMO, MMP-2, MMP-9, IL-10, and tissue factor ( Fig.5A ) . Kynureninase inhibition also increased the protein expression of IL-6 ( Fig.5B ) . The kynureninase inhibition and increases in the expression of IDO1 and IL-6 were confirmed with two different kynureninase siRNAs in macrophages. The siRNA did not alter the release of LDH from the macrophages ( Supplementary Fig.3 ) .
Fig.4.
Effect of IFN-γ stimulation on the expression of genes encoding kynurenine pathway enzymes, IL-6, IL-10, tissue factor, MMP-2, and MMP-9, in human PBMCs-derived macrophages. * p <0.05, ** p <0.01, n =4 or 5 in each, Mann–Whitney U test
Fig.5. Effect of kynureninase inhibition by siRNA.
(A) The effect of kynureninase inhibition by siRNA for 24 h on the expression of genes encoding kynurenine pathway enzymes, IL-6, IL-10, tissue factor, MMP-2, and MMP-9, in human PBMCs-derived macrophages. (B) The protein levels of IL-6 in culture medium treated with kynureninase siRNA and negative control siRNA for 24 h. * p <0.05, ** p <0.01, n =4 or 5 in each, Mann–Whitney U test
Supplementary Fig.3.
The effect of 24h-siRNA treatment against kynureninase on the expression of mRNA of kynureninase, Indoleamine 2, 3-dioxygenase (IDO)-1 and interleukin (IL)-6, cell morphology and lactate dehydrogenase (LDH) release in human peripheral blood mononuclear cells (PBMCs)-derived macrophages
(A) Significant downregulation of kynureninase mRNA or increase of IDO-1, and IL-6 mRNA in human PBMCs-derived macrophages treated with two different siRNAs against kynureninase. * p <0.05 vs. control, ** p <0.01 vs. control, *** p <0.0001 vs. control, Kruskal-Wallis test with Dunn’s multiple comparison tests.
(B) Microscopic images of human PBMCs-derived macrophages treated with negative control siRNA and kynureninase siRNA (siRNA) for 24 hours. No apparent morphological changes between them.
(C) LDH levels in culture medium of siRNA-treated macrophages. Mann-Whitney U test
Discussion
The transcriptomic and metabolomic assays identified an enhanced activity of the kynurenine pathway in aortic atherosclerotic aneurysm. Kynureninase and KMO were upregulated in the advanced atherosclerotic lesions and localized in macrophages. Kynureninase inhibition in the cultured macrophages enhanced the expression of IDO1 and IL-6.
Kynurenine pathway enzymes and metabolites were shown to be increased in non-aneurysmal advanced atherosclerotic lesions and atherosclerotic aneurysmal wall compared with the levels in early atherosclerosis. Tryptophan, an essential amino acid, is used for protein synthesis or metabolized to bioactive metabolites via the kynurenine and serotonin pathways. Tryptophan is considered to be constitutively metabolized to kynurenine via TDO2 in the liver and brain or metabolized via Th1-cytokine-inducible IDO1 18) . Clinical studies have shown increases in the serum kynurenine level and kynurenine-to-tryptophan ratio in ischemic heart disease 19) and indicated that downstream kynurenine metabolites, anthranilic acid, hydroxyanthranilic acid, hydroxykynurenine, and kynurenic acid ( Fig.1 ) , were associated with an increased risk of acute myocardial infarction 20) . Plasma levels of quinolinic acid were also found to be significantly associated with the intima to media ratio of the carotid artery in patients with end-stage renal disease 21) . These lines of evidence suggested that the kynurenine pathway is upregulated in cardiovascular disease, but the sources of the metabolites were unclear. Jung et al. 22) conducted metabolomic analysis using aortic tissue with or without plaque from thoracic aortic aneurysm and identified increased levels of tryptophan, kynurenine, and kynurenine-to-tryptophan ratio in aorta with atherosclerotic plaques compared with the levels in control aorta. Our data are comparable with those of that study and support the notion that advanced atherosclerotic wall is a source of kynurenine metabolites. However, another metabolomic study using carotid and femoral artery plaques and intimal thickening did not reveal alterations in the levels of kynurenine metabolites 23) . Several studies examined the transcriptome in abdominal aortic aneurysm and showed the upregulation of genes related to the immune system/inflammation, tissue remodeling, and hypoxia 12 , 13 , 24) . However, these studies did not show kynurenine pathway enzymes as being differentially expressed, except for TDO2 in one study 24) . The different study designs and differences in control samples could have caused this discrepancy in results. TDO2 and IDO1 were upregulated in the non-aneurysmal advanced atherosclerotic lesion and aneurysmal wall and unstimulated cultured macrophages expressed TDO2. Therefore, tryptophan could be constitutively and inducibly metabolized to kynurenine via two enzymes in the advanced atherosclerotic lesions.
IDO1 may affect atherogenesis, aneurysmal formation, and atherothrombus formation. Presently, there is conflicting evidence on its effects on atherogenesis. The inhibition or gene deletion of IDO1 promoted inflammation and atherosclerosis in Apoe −/− mice fed a chow diet 25 , 26) . Meanwhile, the gene deletion of IDO1 inhibited inflammation and atherosclerosis in Ldlr −/− mice fed with a chow diet 27) . The gene deletion of IDO1 reduced the formation of angiotensin II-induced abdominal aortic aneurysm in Apoe −/− and Ldlr −/− mice 28 , 29) . Our results support the involvement of the kynurenine pathway in the formation of advanced atherosclerotic lesions in humans. IDO1 was localized in coronary macrophages and was a regulator of the thrombogenic potential of atherosclerotic plaque via the expression of tissue factor, a blood coagulation initiator 30) . As previously reported 30) , IFN-γ stimulation markedly upregulated IDO1 and enhanced tissue factor expression. Meanwhile, the inhibition of a downstream enzyme, kynureninase, did not affect tissue factor expression in macrophages. Hence, IDO1 may contribute to the thrombogenic potential of advanced atherosclerotic lesions. This could affect mural thrombus formation on the aortic advanced atherosclerotic lesions.
Kynureninase was upregulated in the non-aneurysmal advanced atherosclerotic lesion and aneurysmal wall and localized in macrophages. Kynureninase was shown to be differentially expressed in a microarray analysis of carotid atherosclerotic plaque 31) . Kynureninase protein expression was increased in aneurysmal walls, as revealed by western blotting 28) . The distribution of kynureninase and its expression in IFN-γ-stimulated macrophages suggest that IFN-γ is a stimulant of kynureninase expression in macrophages in the advanced atherosclerotic aorta.
The distribution of KMO in early, non-aneurysmal advanced, and aneurysmal lesions suggests its constitutive expression in aortic macrophages, as is also found in murine macrophages 32) . Interestingly, we identified KMO expression in adventitial peripheral nerve bundles with lymphoid aggregates and capillary vessels. The neuronal KMO may play a role in inflammation. The activation of neuronal KMO and IL-1 signaling were required in the development of depression-like behavior in the spared nerve injury model 33) . Immunological and neuroscientific research has identified close interaction and communication between the immune system and the nervous system 34) . Postganglionic fibers innervate the blood vessels and other organs and release predominantly norepinephrine, which can regulate the adaptive immune response. Locally released norepinephrine affects lymphocyte traffic, circulation, and proliferation and modulates cytokine production and the functional activity of different lymphoid cells via their adrenergic receptors 35) . These lines of evidence and our data suggest that an enhanced kynurenine pathway modulates plaque, adventitial inflammation, and immune response via macrophages and peripheral nerves.
The inhibition of kynureninase in the cultured macrophages enhanced the expression of IDO1 and IL-6. Kynureninase metabolizes kynurenine to anthranilic acid and 3-hydroxykynurenine to 3-hydroxyanthranilic acid ( Fig.1 ) . Kynureninase inhibition with the transfection of kynureninase siRNA reduced angiotensin II-induced aneurysmal formation, MMP2 activity, and the concentration of a catabolite of kynureninase, 3-hydroxyanthranilic acid, in Apoe −/− mouse aorta. Additionally, exogenous 3-hydroxyanthranilic acid promoted MMP2 expression in human aortic SMCs and mouse aorta 28) . By contrast, 3-hydroxyanthranilic acid inhibited inflammasome activation and IL-1β secretion by mouse bone marrow-derived macrophages and reduced the atherosclerotic lesion burden in Ldlr −/− mice 36) . Our results appear to be comparable with these latter findings, and kynureninase in macrophages may play protective roles in atherogenesis and aneurysmal formation by inhibiting the kynurenine pathway itself and IL-6 and be not directly involved in matrix remodeling. Kynureninase is expressed in various organs, such as the liver, lung, brain, kidney, skeletal muscle, heart, and pancreas 37) . Therefore, the differences in anti-inflammatory action from the study by Wang et al. 28) may be due to systemic or cellular inhibition of kynureninase and differences in cell types.
Although significant differences were observed in inflammatory cell contents between early and aneurysmal atherosclerotic aorta, the metabolomic analysis showed no significant difference in the level of lactic acid, a marker of glycolysis, in atherosclerotic lesions. The results are not comparable with our previous study that reported increased levels of metabolites of the glycolysis pathway in a rabbit model of atherosclerotic arteries, and their association with vascular and macrophage hypoxia 8) . The metabolites of glycolysis were also reported to decrease in alloxan-induced diabetic atherosclerosis in rabbit 38) ; however, the transcriptomic analysis did not show any significant difference in diabetic status. This could have been influenced by the heterogeneity of patients, medications, and insulin dependence.
The present study had several limitations. First, microarray and metabolomic analyses were conducted only one time point in each patient; therefore, it is possible that the data do not always reflect the chronic, dynamic process of atherogenesis. Second, we did not conduct microarray and metabolomic analyses in the non-aneurysmal advanced atherosclerotic lesion. Instead, we examined mRNA and protein expression of the kynurenine enzymes and found that most of the kynurenine enzymes upregulate before aneurysmal formation. Third, we also did not conduct in vivo experiments on the contributions of kynureninase and KMO to atherogenesis and aneurysmal formation.
Conclusions
In conclusion, our study suggests that the kynurenine pathway is progressively upregulated in macrophages in aortic advanced atherosclerosis and aneurysm. Kynureninase may downregulate inflammation via the kynurenine pathway itself and IL-6 in macrophages.
Acknowledgements
This study was supported in part by Grants-in-Aid for Scientific Research in Japan (No. 19H03445, 16H05163, 16K08670, 20K17121) from the Japan Society for the Promotion of Science, and TaNeDS, Daiichi Sankyo Co., Ltd. We thank Ritsuko Sotomura, Kyoko Ohashi, and Nahoko Udatsu for excellent technical assistance with the immunohistochemistry and in vitro assays and Yoshimasa Ono, Kazuishi Kubota, and Akira Shinagawa for scientific advice. Finally, we thank Edanz (https://en-author-services.edanzgroup.com) for editing the English text of a draft of this manuscript.
Disclosures
Junichi Okutsu, Aiko Fukahori, and Tsuyoshi Hirata are employees of Daiichi Sankyo RD Novare Co., Ltd. Tomohiro Nishizawa is an employee of Daiichi Sankyo Co., Ltd. The other authors declare no conflicts of interest.
References
- 1).Joseph P, Leong D, McKee M, Anand SS, Schwalm JD, Teo K, Mente A, and Yusuf S. Reducing the global burden of cardiovascular disease, Part 1: The Epidemiology and Risk Factors. Circ Res, 2017; 121: 677-694 [DOI] [PubMed] [Google Scholar]
- 2).Kojima K, Kimura S, Hayasaka K, Mizusawa M, Misawa T, Yamakami Y, Sagawa Y, Ohtani H, Hishikari K, Sugiyama T, Hikita H, and Takahashi A. Aortic plaque distribution, and association between aortic plaque and atherosclerotic risk factors: An aortic angioscopy study. J Atheroscler Thromb, 2019; 26: 997-1006 [DOI] [PMC free article] [PubMed] [Google Scholar]
- 3).Luebke T, Brunkwall J. Risk-adjusted meta-analysis of 30-day mortality of endovascular versus open repair for ruptured abdominal aortic aneurysms. Ann Vasc Surg, 2015; 29: 845-863 [DOI] [PubMed] [Google Scholar]
- 4).Lindeman JH, Matsumura JS. Pharmacologic management of aneurysms. Circ Res, 2019; 124: 631-646 [DOI] [PMC free article] [PubMed] [Google Scholar]
- 5).Yun M, Yeh D, Araujo LI, Jang S, Newberg A, and Alavi A. F-18 FDG uptake in the large arteries: a new observation. Clin Nucl Med, 2001; 26: 314-319 [DOI] [PubMed] [Google Scholar]
- 6).Ogawa M, Ishino S, Mukai T, Asano D, Teramoto M, Watanabe H, Kudomi N, Shiomi M, Magata Y, Iida H, and Saji H. (18)F-FDG accumulation in atherosclerotic plaques: immunohistochemical and PET imaging study. J Nucl Med, 2004; 45: 1245-1250 [PubMed] [Google Scholar]
- 7).Omori K, Katakami N, Yamamoto Y, Ninomiya H, Takahara M, Matsuoka TA, Bamba T, Fukusaki E, Shimomura I. Identification of metabolites associated with onset of CAD in diabetic patients using CE-MS analysis: A Pilot Study. J Atheroscler Thromb, 2019; 26: 233-245 [DOI] [PMC free article] [PubMed] [Google Scholar]
- 8).Yamashita A, Zhao Y, Matsuura Y, Yamasaki K, Moriguchi-Goto S, Sugita C, Iwakiri T, Okuyama N, Koshimoto C, Kawai K, Tamaki N, Zhao S, Kuge Y, and Asada Y. Increased metabolite levels of glycolysis and pentose phosphate pathway in rabbit atherosclerotic arteries and hypoxic macrophage. PLoS One, 2014 23; 9: e86426 [DOI] [PMC free article] [PubMed] [Google Scholar]
- 9).Yamashita A, Zhao Y, Zhao S, Matsuura Y, Sugita C, Iwakiri T, Okuyama N, Ohe K, Koshimoto C, Kawai K, Tamaki N, Kuge Y, Asada Y. Arterial (18)F-fluorodeoxyglucose uptake reflects balloon catheter-induced thrombus formation and tissue factor expression via nuclear factor-κB in rabbit atherosclerotic lesions. Circ J, 2013; 77: 2626-2635 [DOI] [PubMed] [Google Scholar]
- 10).Okuyama N, Matsuda S, Yamashita A, Moriguchi-Goto S, Sameshima N, Iwakiri T, Matsuura Y, Sato Y, and Asada Y. Human coronary thrombus formation is associated with degree of plaque disruption and expression of tissue factor and hexokinase II. Circ J, 2015; 79: 2430-2438 [DOI] [PubMed] [Google Scholar]
- 11).Nitz K, Lacy M, and Atzler D. Amino acids and their metabolism in atherosclerosis. Arterioscler Thromb Vasc Biol, 2019; 39: 319-330 [DOI] [PubMed] [Google Scholar]
- 12).Choke E, Cockerill GW, Laing K, Dawson J, Wilson WR, Loftus IM, and Thompson MM. Whole genome-expression profiling reveals a role for immune and inflammatory response in abdominal aortic aneurysm rupture. Eur J Vasc Endovasc Surg, 2009; 37: 305-310 [DOI] [PubMed] [Google Scholar]
- 13).Gäbel G, Northoff BH, Weinzierl I, Ludwig S, Hinterseher I, Wilfert W, Teupser D, Doderer SA, Bergert H, Schönleben F, Lindeman JHN, Holdt LM. Molecular Fingerprint for terminal abdominal aortic aneurysm disease. J Am Heart Assoc, 2017; 6: e006798 [DOI] [PMC free article] [PubMed] [Google Scholar]
- 14).Stary HC, Chandler AB, Dinsmore RE, Fuster V, Glagov S, Insull W Jr, Rosenfeld ME, Schwartz CJ, Wagner WD, Wissler RW. A definition of advanced types of atherosclerotic lesions and a histological classification of atherosclerosis. A report from the committee on vascular lesions of the council on arteriosclerosis, American Heart Association. Circulation, 1995; 92: 1355-1374 [DOI] [PubMed] [Google Scholar]
- 15).Kuleshov MV, Jones MR, Rouillard AD, Fernandez NF, Duan Q, Wang Z, Koplev S, Jenkins SL, Jagodnik KM, Lachmann A, McDermott MG, Monteiro CD, Gundersen GW, and Ma’ayan A. Enrichr: a comprehensive gene set enrichment analysis web server 2016 update. Nucleic Acids Res, 2016; 44: W90-7 [DOI] [PMC free article] [PubMed] [Google Scholar]
- 16).Maekawa K, Sugita C, Yamashita A, Moriguchi-Goto S, Furukoji E, Sakae T, Gi T, Hirai T, and Asada Y. Higher lactate and purine metabolite levels in erythrocyte-rich fresh venous thrombus: Potential markers for early deep vein thrombosis. Thromb Res, 2019; 177: 136-144 [DOI] [PubMed] [Google Scholar]
- 17).Kuroiwa Y, Uchida A, Yamashita A, Miyati T, Maekawa K, Gi T, Noguchi T, Yasuda S, Imamura T, and Asada Y. Coronary high-signal-intensity plaques on T1-weighted magnetic resonance imaging reflect intraplaque hemorrhage. Cardiovasc Pathol, 2019; 40: 24-31 [DOI] [PubMed] [Google Scholar]
- 18).Song P, Ramprasath T, Wang H, and Zou MH. Abnormal kynurenine pathway of tryptophan catabolism in cardiovascular diseases. Cell Mol Life Sci, 2017; 74: 2899-2916 [DOI] [PMC free article] [PubMed] [Google Scholar]
- 19).Wirleitner B, Rudzite V, Neurauter G, Murr C, Kalnins U, Erglis A, Trusinskis K, and Fuchs D. Immune activation and degradation of tryptophan in coronary heart disease. Eur J Clin Invest, 2003; 33: 550-554 [DOI] [PubMed] [Google Scholar]
- 20).Pedersen ER, Tuseth N, Eussen SJ, Ueland PM, Strand E, Svingen GF, Midttun Ø, Meyer K, Mellgren G, Ulvik A, Nordrehaug JE, Nilsen DW, Nygård O. Associations of plasma kynurenines with risk of acute myocardial infarction in patients with stable angina pectoris. Arterioscler Thromb Vasc Biol, 2015; 35: 455-462 [DOI] [PubMed] [Google Scholar]
- 21).Pawlak K, Brzosko S, Mysliwiec M, and Pawlak D. Kynurenine, quinolinic acid--the new factors linked to carotid atherosclerosis in patients with end-stage renal disease. Atherosclerosis, 2009; 204: 561-566 [DOI] [PubMed] [Google Scholar]
- 22).Jung S, Song SW, Lee S, Kim SH, Ann SJ, Cheon EJ, Yi G, Choi EY, Lee SH, Joo HC, Ryu DH, Lee SH, and Hwang GS. Metabolic phenotyping of human atherosclerotic plaques: Metabolic alterations and their biological relevance in plaque-containing aorta. Atherosclerosis, 2018; 269: 21-28 [DOI] [PubMed] [Google Scholar]
- 23).Vorkas PA, Shalhoub J, Isaac G, Want EJ, Nicholson JK, Holmes E, and Davies AH. Metabolic phenotyping of atherosclerotic plaques reveals latent associations between free cholesterol and ceramide metabolism in atherogenesis. J Proteome Res, 2015; 14: 1389-1399 [DOI] [PubMed] [Google Scholar]
- 24).Biros E, Moran CS, Rush CM, Gäbel G, Schreurs C, Lindeman JH, Walker PJ, Nataatmadja M, West M, Holdt LM, Hinterseher I, Pilarsky C, Golledge J. Differential gene expression in the proximal neck of human abdominal aortic aneurysm. Atherosclerosis, 2014; 233: 211-218 [DOI] [PubMed] [Google Scholar]
- 25).Polyzos KA, Ovchinnikova O, Berg M, Baumgartner R, Agardh H, Pirault J, Gisterå A, Assinger A, Laguna-Fernandez A, Bäck M, Hansson GK, Ketelhuth DF. Inhibition of indoleamine 2,3-dioxygenase promotes vascular inflammation and increases atherosclerosis in Apoe-/- mice. Cardiovasc Res, 2015; 106: 295-302 [DOI] [PubMed] [Google Scholar]
- 26).Cole JE, Astola N, Cribbs AP, Goddard ME, Park I, Green P, Davies AH, Williams RO, Feldmann M, and Monaco C. Indoleamine 2,3-dioxygenase-1 is protective in atherosclerosis and its metabolites provide new opportunities for drug development. Proc Natl Acad Sci U S A, 2015 20; 112: 13033-13038 [DOI] [PMC free article] [PubMed] [Google Scholar]
- 27).Metghalchi S, Ponnuswamy P, Simon T, Haddad Y, Laurans L, Clément M, Dalloz M, Romain M, Esposito B, Koropoulis V, Lamas B, Paul JL, Cottin Y, Kotti S, Bruneval P, Callebert J, den Ruijter H, Launay JM, Danchin N, Sokol H, Tedgui A, Taleb S, and Mallat Z. Indoleamine 2,3-Dioxygenase fine-tunes immune homeostasis in atherosclerosis and colitis through repression of Interleukin-10 production. Cell Metab, 2015; 22: 460-471 [DOI] [PubMed] [Google Scholar]
- 28).Wang Q, Ding Y, Song P, Zhu H, Okon I, Ding YN, Chen HZ, Liu DP, and Zou MH. Tryptophan-derived 3-hydroxyanthranilic acid contributes to angiotensin II-induced abdominal aortic aneurysm formation in mice in vivo. Circulation, 2017; 136: 2271-2283 [DOI] [PMC free article] [PubMed] [Google Scholar]
- 29).Metghalchi S, Vandestienne M, Haddad Y, Esposito B, Dairou J, Tedgui A, Mallat Z, Potteaux S, and Taleb S. Indoleamine 2 3-dioxygenase knockout limits angiotensin II-induced aneurysm in low density lipoprotein receptor-deficient mice fed with high fat diet. PLoS One, 2018; 13: e0193737 [DOI] [PMC free article] [PubMed] [Google Scholar]
- 30).Watanabe Y, Koyama S, Yamashita A, Matsuura Y, Nishihira K, Kitamura K, and Asada Y. Indoleamine 2,3-dioxygenase 1 in coronary atherosclerotic plaque enhances tissue factor expression in activated macrophages. Res Pract Thromb Haemost, 2018; 2: 726-735 [DOI] [PMC free article] [PubMed] [Google Scholar]
- 31).Dong J, Song C, Zhang L, Feng X, Feng R, Lu Q, Zhao Z, Bao J, Zhou J, and Jing Z. Identified key genes related to carotid atheroma plaque from gene expression chip. Artif Cells Nanomed Biotechnol, 2017; 45: 1-6 [DOI] [PubMed] [Google Scholar]
- 32).Alberati-Giani D, Ricciardi-Castagnoli P, Köhler C, and Cesura AM. Regulation of the kynurenine metabolic pathway by interferon-gamma in murine cloned macrophages and microglial cells. J Neurochem, 1996; 66: 996-1004 [DOI] [PubMed] [Google Scholar]
- 33).Laumet G, Zhou W, Dantzer R, Edralin JD, Huo X, Budac DP, O'Connor JC, Lee AW, Heijnen CJ, and Kavelaars A. Upregulation of neuronal kynurenine 3-monooxygenase mediates depression-like behavior in a mouse model of neuropathic pain. Brain Behav Immun, 2017; 66: 94-102 [DOI] [PMC free article] [PubMed] [Google Scholar]
- 34).Chavan SS, Pavlov VA, and Tracey KJ. Mechanisms and therapeutic relevance of neuro-immune communication. Immunity, 2017; 46: 927-942 [DOI] [PMC free article] [PubMed] [Google Scholar]
- 35).Elenkov IJ, Wilder RL, Chrousos GP, and Vizi ES. The sympathetic nerve--an integrative interface between two supersystems: the brain and the immune system. Pharmacol Rev, 2000; 52: 595-638 [PubMed] [Google Scholar]
- 36).Berg M, Polyzos KA, Agardh H, Baumgartner R, Forteza MJ, Kareinen I, Gisterå A, Bottcher G, Hurt-Camejo E, Hansson GK, Ketelhuth DFJ. 3-Hydroxyanthralinic acid metabolism controls the hepatic SREBP/lipoprotein axis, inhibits inflammasome activation in macrophages, and decreases atherosclerosis in Ldlr-/- mice. Cardiovasc Res, in press [DOI] [PMC free article] [PubMed] [Google Scholar]
- 37).Alberati-Giani D, Buchli R, Malherbe P, Broger C, Lang G, Köhler C, Lahm HW, and Cesura AM. Isolation and expression of a cDNA clone encoding human kynureninase. Eur J Biochem, 1996; 239: 460-468 [DOI] [PubMed] [Google Scholar]
- 38).Matsuura Y, Yamashita A, Zhao Y, Iwakiri T, Yamasaki K, Sugita C, Koshimoto C, Kitamura K, Kawai K, Tamaki N, Zhao S, Kuge Y, and Asada Y. Altered glucose metabolism and hypoxic response in alloxan-induced diabetic atherosclerosis in rabbits. PLoS One, 2017; 12: e0175976 [DOI] [PMC free article] [PubMed] [Google Scholar]


