

Abstract
This paper is a proposal for an update on the characterisation of cognitive impairments associated with sporadic cerebral small vessel disease (SVD). We pose a series of questions about the nature of SVD-related cognitive impairments and provide answers based on a comprehensive review and meta-analysis of published data from 69 studies. Although SVD is thought primarily to affect executive function and processing speed, we hypothesise that SVD affects all major domains of cognitive ability. We also identify low levels of education as a potentially modifiable risk factor for SVD-related cognitive impairment. Therefore, we propose the use of comprehensive cognitive assessments and the measurement of educational level both in clinics and research settings, and suggest several recommendations for future research.
Keywords: Cerebral small vessel disease, vascular cognitive impairment, cognitive ability, lacunar stroke, vascular dementia, systematic review, meta-analysis
1. Context for the ‘Hypothesis’
The term small vessel disease (SVD) refers to a collection of neuroimaging and neuropathological abnormalities found in the brain’s white and deep grey matter. Visible radiological markers of the disease include white matter hyperintensities (WMH) and lacunes of presumed vascular origin, cerebral microbleeds, visible perivascular spaces and cerebral microinfarcts. These markers likely reflect multiple pathological changes affecting the brain’s small vessels, such as endothelial dysfunction, impaired cerebral blood flow, and reduced vessel pulsatility, although the relationships between these mechanisms are complex and not yet fully understood(1,2). SVD is the primary cause of vascular cognitive impairment (VCI) in older age. The meaning of the term VCI has been refocussed several times in recent years(3–6), but broadly refers to cognitive impairments due to underlying vascular contributions, which can range in severity from subtle sub-clinical decline in cognitive ability, to mild cognitive impairment (MCI) and dementia(7,8). In this review, we use the term ‘impairment’ to denote any reduction in cognitive ability relative to an individual’s typical ability, as opposed to a normative standard, or a diagnostic construct, unless otherwise stated.
Why is SVD-related cognitive impairment important?
As life expectancies across the world continue to rise, so too does the predicted global burden of age-related cognitive impairment, including VCI. In all societies, the economic impact of cognitive impairment is tremendous. Individuals with cognitive impairment use more health care services and require greater support with activities of daily living, either from unpaid family carers, or from paid care services(9,10). In 2002 a review of the costs associated with VCI in Canada estimated the average annual cost per-individual to be between CAD $15,022 (USD equivalent $9,313) for mild VCI, and CAD $34,515 (USD equivalent $21,399) for severe VCI(10). Equally as striking is the personal impact upon individuals experiencing cognitive impairment, who are at greater risk of anxiety, depression, and report having a lower quality of life(11,12). A reduction in the incidence or progression of cognitive impairment, therefore, is a key target for clinical trials of treatments or interventions for SVD. Any intervention that improves cognitive outcomes in SVD has the potential to alleviate the burdens it places on individuals and on our societies, and would be a step towards reducing rates of VCI and multiple major dementias.
What kind of cognitive impairments are associated with SVD?
To accurately assess cognitive ability in SVD and how it might change in response to intervention, researchers must use cognitive tests that are sensitive to the cognitive impairments caused by SVD. However, despite a huge number of studies on the subject, the nature of cognitive impairments in SVD remains poorly characterised. Current consensus statements suggest that the disease primarily affects the domains of processing speed and executive function, but that memory and language abilities remain relatively well preserved(13,14). Processing speed refers to the speed at which a person can understand and respond to information(15). Executive function is a broader concept encompassing skills such as planning, organisation and switching attention, which enable goal-directed behaviours(15). This profile of SVD-related cognitive impairments is frequently reported in the research literature, but the studies underpinning this suggestion are conflicting, and require careful consideration. Firstly, many of the studies examining SVD-related cognitive impairments have small participant samples, so may be insufficiently powered to detect cognitive deficits. Secondly, many of these studies focus on narrowly-defined subtypes of SVD (i.e. genetic SVDs), or on those with a high disease burden who may not represent the full spectrum of sporadic SVDs. We also anticipate that some studies may be influenced by expectations of the cognitive impairments they will observe. Based on the understanding that SVD causes deficits in executive function and processing speed, studies might carry out tests that measure only those abilities and neglect to test for impairments in other abilities such as memory, which are more typically associated with dementia.
To gain an unbiased overview of the nature of cognitive impairments associated with SVD, we carried out a systematic review and meta-analysis of studies reporting cognitive data for cohorts with clinical or radiological evidence of SVD, and control cohorts without SVD (see Figure 1; full details of the Methods and Results are provided in Section 2). As expected, the sample sizes of the SVD cohorts were small, ranging between four and 196 participants (median: 27). Four studies conducted power calculations(52,57,71,85), but only one of these studies included a sample size sufficient to detect differences in cognitive performance between groups, according to their own calculations(57). We carried out seven separate meta-analyses to examine differences in performance between SVD and control groups in seven cognitive domains: executive function, delayed memory, processing speed, language, visuospatial ability, reasoning, and attention. The results of our meta-analyses suggested that individuals with SVD performed more poorly than controls on cognitive tests in each cognitive domain that we examined. Our findings concur with those of a recent meta-analysis of 27 studies by Vasquez and Zakzanis(16), which compared the cognitive abilities of participants with vascular cognitive impairment without dementia and control subjects, finding deficits in a similarly broad range of domains. Contrary to current consensus, our results suggest that the cognitive impairments associated with SVD extend beyond executive function and processing speed, to affect all major domains of cognitive ability.
Figure 1:
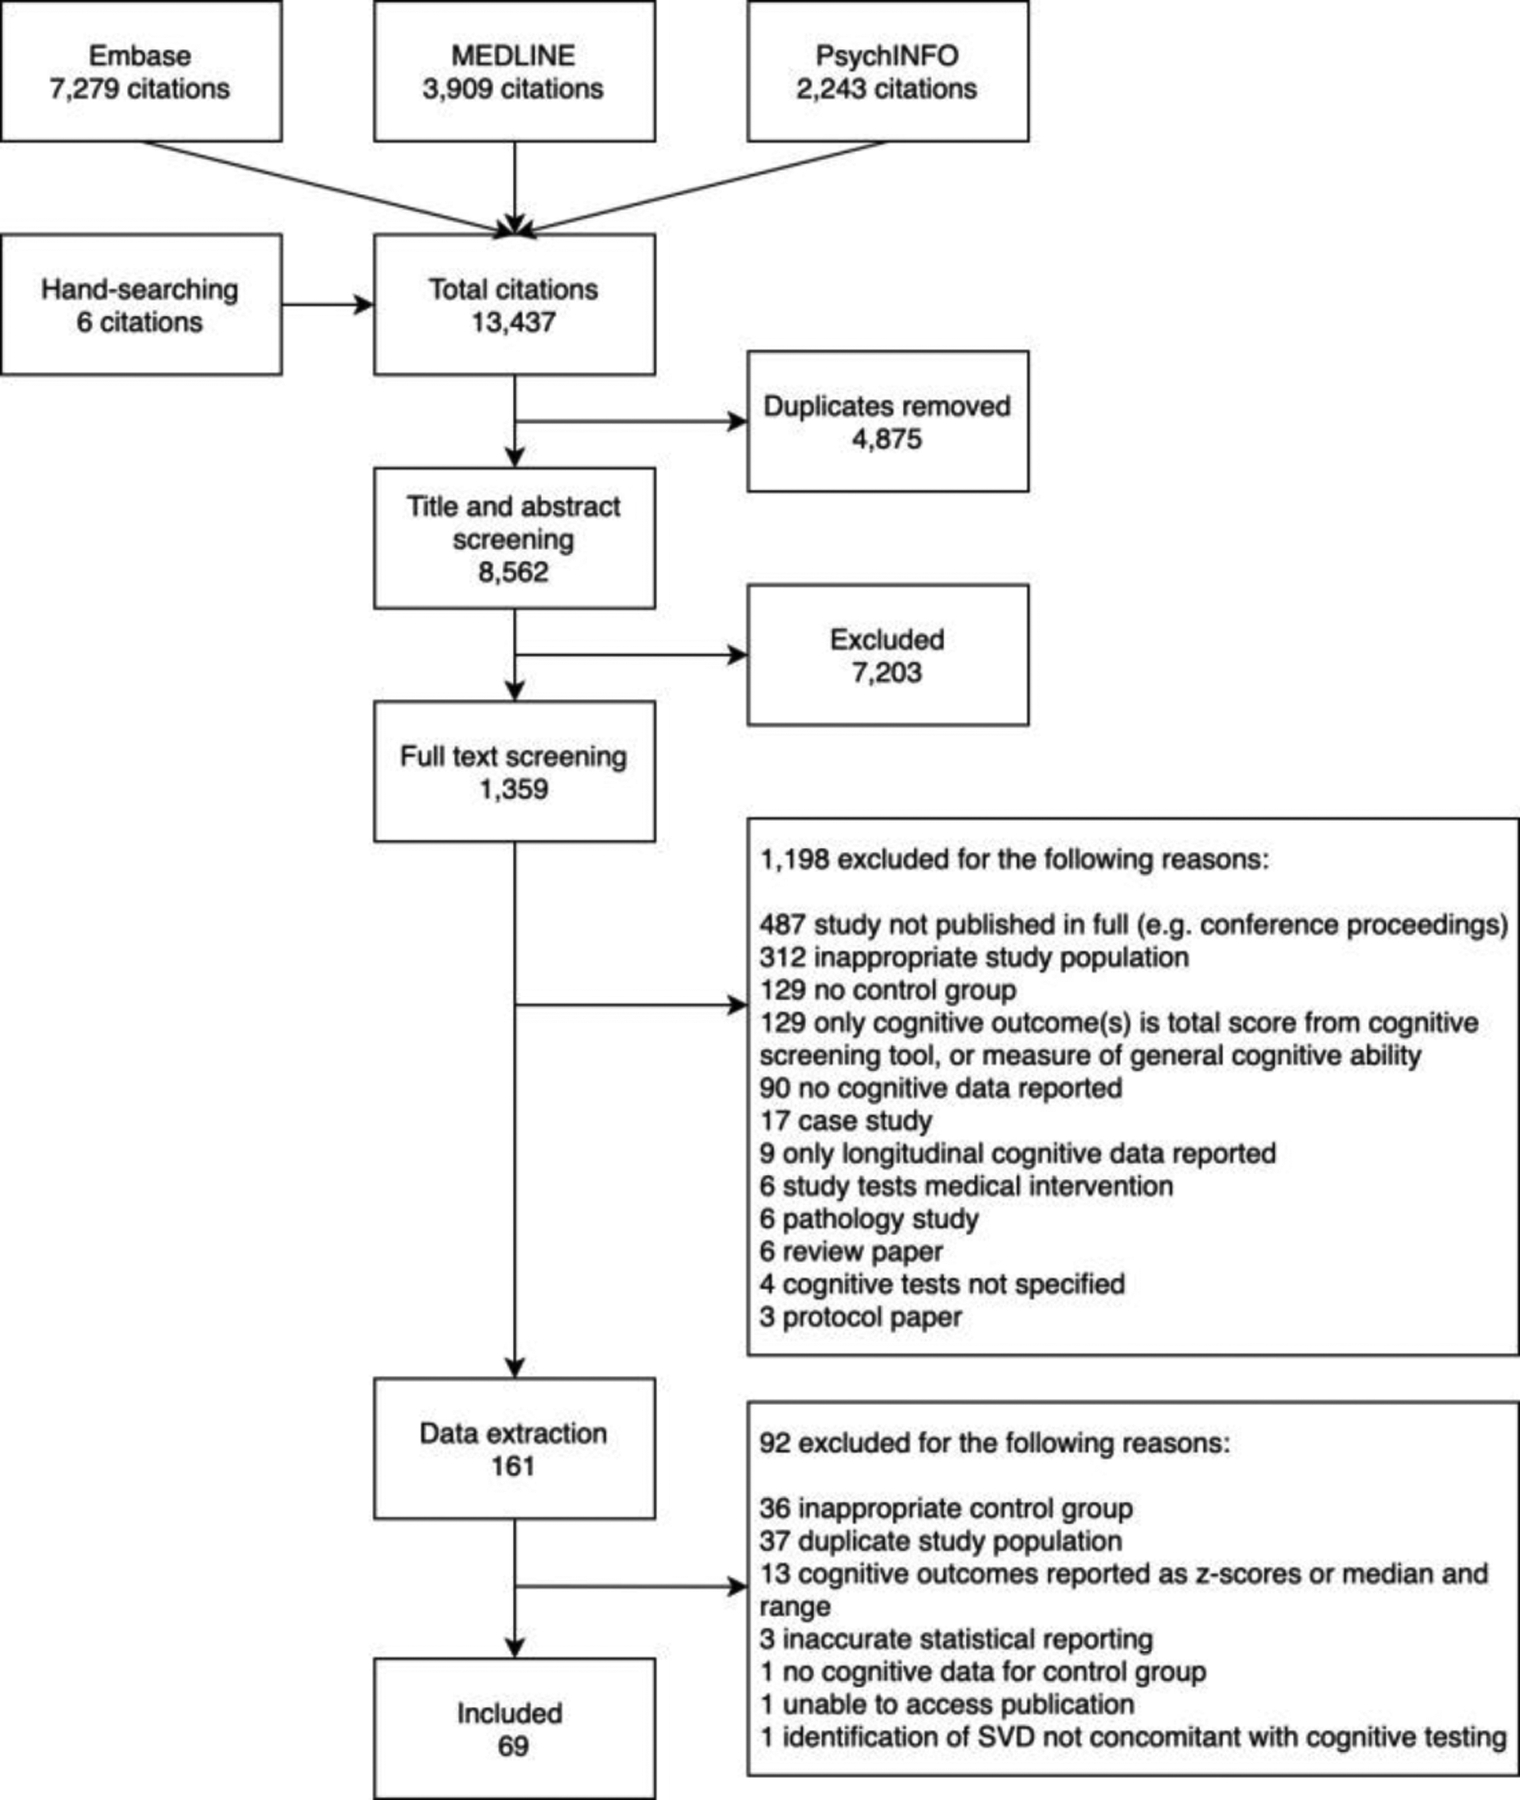
Flow diagram of systematic review screening process
Typically, multiple cognitive abilities are recruited in order to carry out an individual cognitive task. For example, a list learning task is broadly considered to be a test of memory, but performance of the task will also require language abilities in order to comprehend the words on the list, processing speed in order to process the verbal information, and so on. Therefore, deficits in a number of cognitive domains could result in poor performance on this memory task. Many cognitive tasks appear to require speed of information processing for efficient performance, and tests of processing speed are among those most affected by ageing. As a result, it has been suggested that processing speed drives age-related changes in other fluid cognitive abilities(17). Moreover, processing speed has been found to mediate, statistically, the association between brain white matter health and general cognitive ability in older people(18). However, there is currently a more agnostic attitude to the place of processing speed; there is not considered to be definitive evidence about whether processing is the driver of age-related declines in other cognitive abilities, or whether it is just another domain of cognitive ability that declines on average with age(19,20). Whereas the results of our meta-analyses suggest that relative to controls, cohorts with SVD have deficits in all major domains of cognitive ability, it remains to be examined whether these deficits could be the result of the early impairment of certain key domains of cognitive ability, or could be the result of impairment across multiple domains of cognitive ability more generally.
Growing evidence suggests that SVD-related cognitive impairments result from the disruption of white matter tract networks connecting regions of the brain that are critical for cognitive function(21,22). Several cohort studies have suggested that the dysexecutive/slowed information processing profile typically associated with SVD could arise from strategic lesions that disrupt frontal-subcortical white matter projections, such as the anterior thalamic radiation and the forceps minor(23–26). However, visible infarcts represent only a proportion of the structural changes occurring in SVD. Microstructural alterations in WMH extend beyond the visible lesion, into the surrounding, normal-appearing peri-lesional tissue known as the ‘SVD penumbra’(27). Similarly, the impact of visible lesions can extend beyond local tissue, to affect distant brain regions(28). Therefore, SVD-related structural brain changes are diffuse and likely affect white matter networks throughout the whole brain(22,29). One analytic approach that has provided insight into the impact of SVD on the structural connectivity of the brain, is the application of graph theoretic approaches to diffusion tensor (DTI) tractography data. Whereas several studies adopting this approach have found reduced connectivity and efficiency of both local and global white matter networks, associations between these changes and impairments in specific cognitive domains remain unclear(22).
Do cognitive impairments vary according to the clinical presentation of SVD?
In the majority of cases, SVD manifests sub-clinically with few overt symptoms. However, SVD also contributes to, and in some cases is the primary cause of, a spectrum of disorders ranging from stroke, to mild cognitive impairment and multiple major dementias. SVD causes approximately 20% of all strokes, increases the risk of recurrent ischaemic stroke, and associates with poorer functional outcomes post-stroke(30,31). SVD also contributes to approximately 40% of all dementias and increases the odds of developing incident dementia(32,33). Whereas stroke and dementia are often considered separately, they convey mutual risk to one another. For example, stroke doubles the chance of developing dementia(34), and poor cognitive performance increases the risk of stroke(35). Additionally, increasing evidence supports the hypothesis that stroke and dementia share underlying mechanisms(36,37). For example, dysfunction of the blood brain barrier (BBB) has been identified as one of the earliest detectable mechanistic changes in the preclinical stages of dementia, occurring prior to the development and accumulation of typical Alzheimer’s disease (AD) biomarkers such as amyloid beta (Aβ) and phosphorylated tau(38). Arterial stiffness, another pathological hallmark of SVD, has also been associated with the deposition of Aβ and its accumulation over time(39). Vascular pathologies are now considered to contribute substantially to the cognitive deficits observed in most major forms of dementia, including AD. In a recent study examining carriers of APOE4, the primary susceptibility gene for AD, BBB breakdown in the hippocampus and parahippocampal gyrus was associated with poorer cognitive ability independently of Aβ or tau accumulation(40). Whereas these findings have yet to be replicated, they suggest that this gene variant might contribute to AD and its resultant cognitive decline through BBB dysfunction, rather than solely through more traditional AD biomarkers. In 2017 the World Health Organisation highlighted the prevention of stroke via the management of traditional vascular risk factors (e.g. smoking, high blood pressure, high cholesterol, diabetes) as a means of preventing dementia(6). However, despite increasing recognition of cerebrovascular contributions to neurodegenerative disease processes(41), little is known about how cognitive impairments might differ across different SVD presentations. Patients who experience stroke and dementia have differing routes into clinical care, are treated by different specialists, and are recruited into different research studies, often preventing direct comparison of their cognitive symptoms.
We categorised the SVD cohorts in our sample into three groups based on the clinical characterisations and recruitment settings detailed in the original publications. These three groups included: 1) non-clinical SVD cohorts (cohorts who exhibited radiological evidence of SVD, but had no specific clinical or cognitive symptomatology); 2) cohorts who presented with stroke; and 3) cohorts with subjective or objective cognitive impairments or dementia (further detail on cohort categorisation is provided in Section 2). To some extent, our three SVD presentation categories may represent a continuum; individuals with radiological evidence of SVD but no overt clinical symptoms may go on to experience stroke and/or dementia. Additionally, owing to the inter-related nature of stroke and dementia, it is possible that cohorts in these three categories exhibit both vascular and neurodegenerative pathologies. As expected, tests of processing speed, executive function, attention and reasoning were most frequently carried out in cohorts with stroke and tests of delayed memory, visuospatial ability and language were most commonly carried out in cohorts with cognitive impairments (see Supplementary File 1).
The results of meta-regression models investigating differences in cognitive performance of the three SVD presentation groups (relative to controls) indicated differences in the magnitude of cognitive effect sizes between the three groups, such that cohorts with cognitive impairment/dementia performed worse than non-clinical cohorts on tests of executive function, delayed memory and visuospatial ability, and worse than stroke cohorts on tests of delayed memory only. It is possible that the inclusion of samples with cognitive impairments (including MCI and dementia) could be driving the findings that SVD cohorts overall performed more poorly on tests of memory than control cohorts. However, visual inspection of forest plot for memory (Figure 2) suggests that this is unlikely to be the case as almost all cohorts in each presentation group show deficits relative to control cohorts in the domain of memory.
Figure 2: Forest plot of meta-analysis of tests of delayed memory.
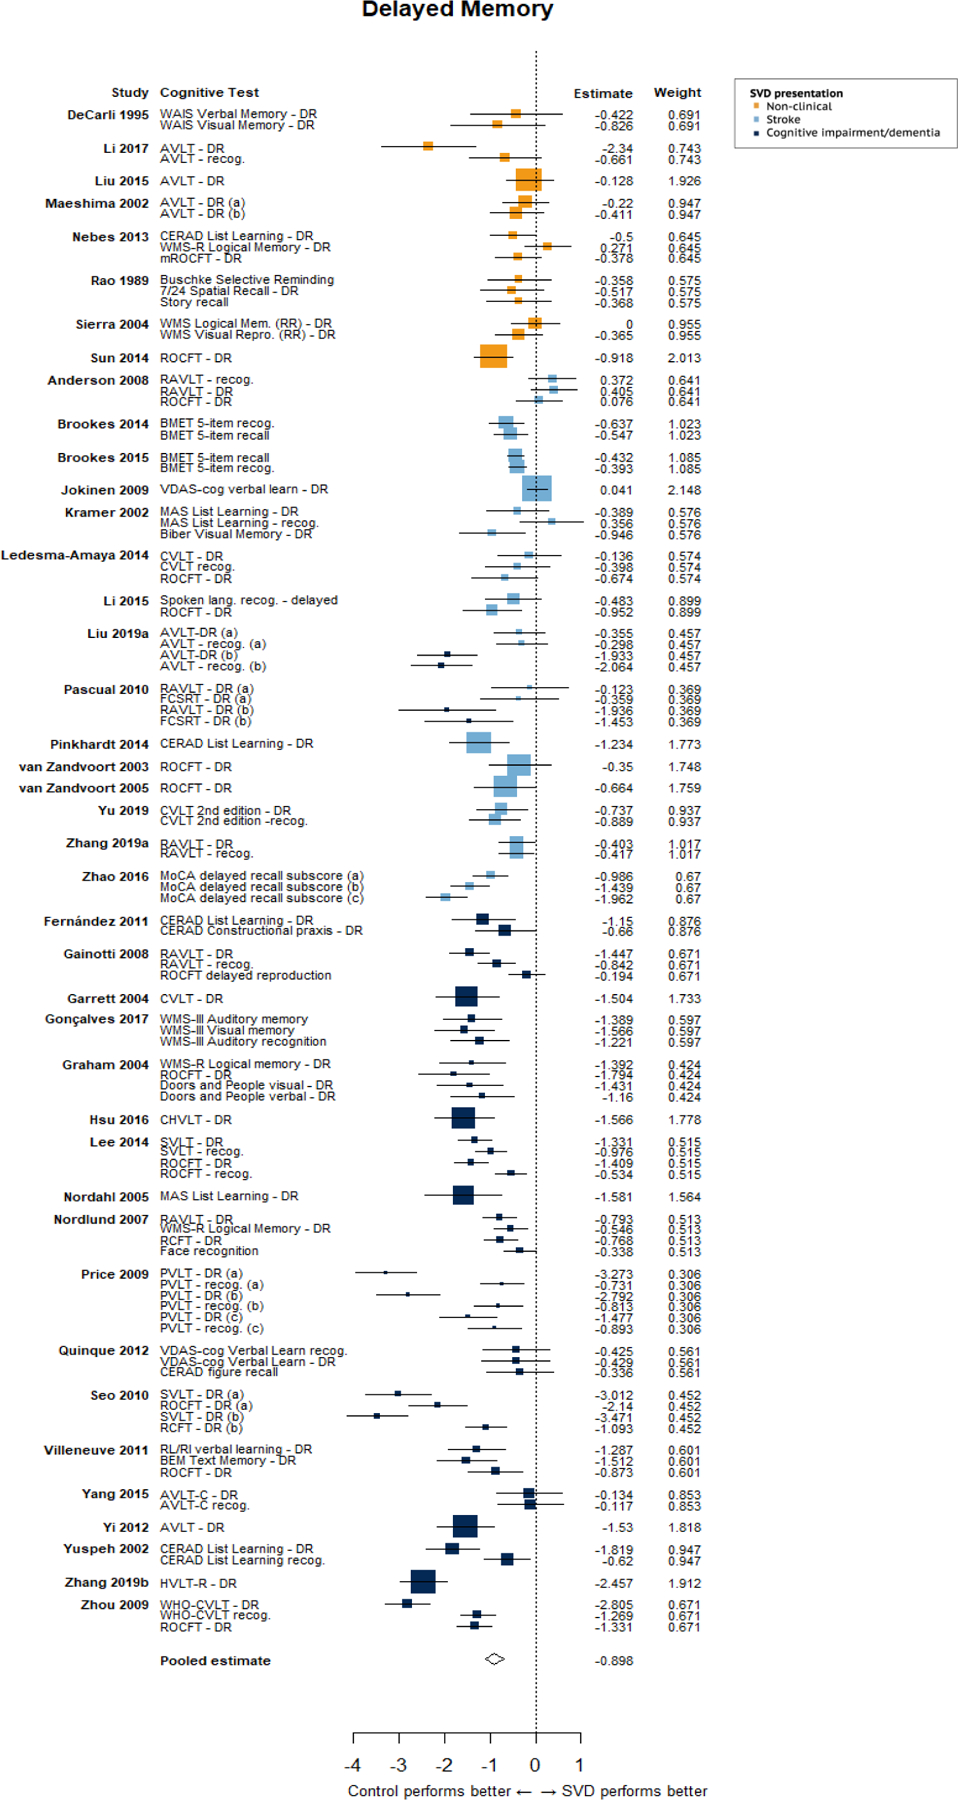
The size of the squares reflects the weight given to the effect size. Letters in brackets indicate different SVD cohorts in a given study.
How do risk factors for SVD affect cognitive impairment?
Age is the primary risk factor for the development and progression of SVD. The prevalence of MRI markers of SVD increase with age and are found in the majority of individuals over the age of 60. In contrast, it is unclear whether biological sex may act as a risk factor for SVD(42,43), although the under recruitment of women in stroke research may limit knowledge(44), and the lack of sex-disaggregated reporting limits the scope of meta-analyses on this topic. Owing to their potential for modification, traditional vascular risk factors (VRFs) such as hypertension, diabetes and hypercholesterolemia have received a great deal of attention, alongside lifestyle factors such as smoking, lack of exercise, poor diet and high salt intake. Each has been associated with increased SVD risk, but trials of risk-lowering interventions have produced mixed results(1). Additionally, a recent meta-analysis of early life risk factors for SVD found lower childhood socioeconomic status, lower childhood IQ and fewer years of education to be associated with increased radiological burden of SVD(45), although these risk factors are related to one another and may convey interdependent effects.
Due to their associations with an increased brain burden of SVD, each of these risk factors has the potential to impact cognitive ability. Therefore, it is important that these factors are accounted for statistically (where appropriate) and considered carefully when interpreting study results. Of the studies included in our meta-analysis, almost all reported data on the age, sex and education of study cohorts, however, reporting of vascular risk data was less complete (see Supplementary File 2). Approximately half of all studies reported history of hypertension or diabetes, and only one third of studies reported smoking status, despite its known association with SVD progression. Vascular risk data was least often reported for cohorts with a cognitive presentation of SVD, which could suggest that these factors are percieved as being less relevant to cohorts with MCI or dementia.
We carried out further meta-regression analyses to investigate whether differences in age, education, or the prevalence of hypertension or diabetes between SVD and control cohorts accounted for the cognitive effects we observed in our meta-analyses. The results of these analyses suggest that differences in years of education between SVD and control groups account for a proportion of the differences in cognitive test scores in the domains of memory, executive function, and visuospatial ability. All other cognitive domains showed a similar direction of effect (albeit non-significant) except processing speed, which could support the suggestion that processing speed might be less amenable to beneficial effects of education than other cognitive abilities(46). These findings highlight education as a (potentially modifiable) risk factor for SVD-related cognitive impairment, emphasising the importance of accounting for education in analyses of cognitive change over time, or comparisons of cognitive ability between groups. An additional factor for consideration that is closely related to educational level, is peak (or premorbid) cognitive ability. In any analysis of cognitive decline, observed levels of cognitive ability will be relative to an individual’s prior abilities(47). Despite this, peak cognitive ability is seldom considered in clinical studies. Of the 69 studies included in our meta-analysis, only seven(52,56,57,64,66,92) estimated peak ability and only two of these studies included this score as a covariate in their analyses(56,92).
Summary of findings and recommendations for future work
Based on 3229 individuals with SVD and 3679 control participants from 69 studies, our meta-analyses demonstrated that SVD-related cognitive impairments affect all major domains of cognitive ability. To accurately assess the full extent of SVD-related cognitive impairments, we recommend the use of comprehensive test batteries that cover a range of cognitive domains, such as that proposed by The National Institute for Neurological Disorders and Stroke (NINDS) and the Canadian Stroke Network (CSN; 48). This test protocol is designed for use with participants with VCI and assesses a broad range of cognitive abilities. The full-length protocol takes 60 minutes to administer, but can be shortened to 30 or 5 minutes, whilst still capturing information from a fairly broad range of cognitive abilities. Widespread use of a standard cognitive testing protocol will also facilitate more accurate cross-comparison or meta-analysis of cognitive data from different studies.
The majority of studies in our meta-analysis had small sample sizes, and very few studies carried out power calculations. In order to make inferences about cognitive impairments in SVD, it is of vital importance that studies are adequately powered to detect cognitive effects. This meta-analysis summarises 69 publications on a broad range of SVD presentations - references 52 to 120 provide a useful database of effect sizes, which can be consulted and used to estimate power calculations in future studies.
The results of our first meta-regression analysis suggested that cohorts with a cognitive presentation of SVD performed more poorly than cohorts with non-clinical presentations of the disease on tests of delayed memory, executive function and visuospatial ability; and more poorly than cohorts with stroke presentations on tests of delayed memory. Our grouping of cohorts into their respective SVD-presentation categories was based on cohort descriptions, recruitment settings and diagnostic criteria, all of which varied considerably between studies. A more effective approach to characterising SVD subtypes, would be to recruit subjects with differing presentations of SVD into the same study, which would facilitate comparison of cognitive and other clinical outcomes.
As we have described, vascular disease and neurodegeneration are interrelated. Where possible, data should be collected that is relevant to both vascular and neurodegenerative disease processes. In terms of cognitive data, this would mean collecting data from a broad range of cognitive domains, as previously recommended. In terms of neuroradiological data, this would mean considering radiological markers of SVD (WMH, ePVS, lacunes, microbleeds, microinfarcts, altered diffusion tensor imaging metrics), and those more commonly associated with neurodegeneration such as cerebral atrophy and hippocampal volume. The collection of vascular risk data is also important. History of hypertension, diabetes, and smoking status are quick to ascertain and should be collected for all individuals with suspected SVD in clinical and research settings. The collection of vascular biomarkers at different stages throughout the development of dementia may also provide an indication of the changing contributions of vascular dysfunction to neurodegenerative disease processes over time. Through a more complete exploration of the risk factors, brain changes and cognitive consequences that are shared between stroke and dementia, more accurate characterisation of SVD subtypes and their precipitating factors might be possible.
Finally, the results of our second set of meta-regression analyses indicated that level of education is associated with the severity of SVD-related cognitive impairments. We strongly recommend that future studies account for educational level or peak cognitive ability when examining cognitive change over time, or comparing of cognitive ability between groups. A range of methods can be used to estimate peak cognitive ability, some of which are free and have been validated in multiple languages(49).
2. Appendix
Methods
We performed this systematic review and meta-analysis in accordance with PRISMA guidelines. The review protocol is registered on the PROSPERO database (ID: CRD42017080215).
Search strategy and study selection criteria
We developed and tested a detailed search strategy (see Supplementary File 3) to identify studies reporting the results of cognitive testing in a cohort with SVD (performed contemporaneous with identification of SVD), and a control cohort with no history of neurological or psychiatric conditions. We searched OVID MEDLINE, Embase and PsycINFO, for human studies published in any language from 1st January 1985, when MRI became more widely available in clinical practice, to 6th October 2019. To identify additional studies, we checked the reference lists of relevant review articles and hand-searched the previous 7 years of Stroke and the Journal of Cerebral Blood Flow and Metabolism. Study inclusion and exclusion criteria, are presented in Supplementary File 4.
Data Extraction
Two authors (OH and EB) independently extracted key information, which included group-level demographic data for the SVD and control groups (age, sex, education); group-level data on vascular risk factors (% cohorts with hypertension, diabetes, hypercholesterolemia, and smoking status), group-level data on WMH burden, and group-level cognitive test scores for SVD and control groups. The vast majority of cognitive data were presented as mean and standard deviation. To avoid introducing additional heterogeneity into the meta-analysis dataset, we did not convert cognitive data presented as median and range to mean and standard deviation - instead these data are summarised in Supplementary File 5. Where individual participant data were presented, we calculated the mean and standard deviation of the variables we extracted. Cognitive data were then categorised into seven domains of cognitive ability: information processing speed, executive function, delayed memory, attention, reasoning, visuospatial ability and language. However, it is important to note that subdomains of cognitive ability are not discrete, and that individual cognitive tests often engage abilities from multiple cognitive domains. To ensure that tests were reliably categorised according to the cognitive domain that they are considered to primarily assess, two authors experienced in neuropsychological testing (OH and AJ) independently categorised cognitive data into the seven domains listed above and resolved disagreements by consensus (see Supplementary File 6 for further information). Studies reported a wide range of memory tests, including tests of long-term, short-term and working memory. To reduce heterogeneity in the dataset we included only tasks featuring a delayed recall/recognition component, as these were the most frequently reported memory tasks. We excluded data for which we could not identify the specific test score (e.g. where authors reported results for a Trail Making task, but did not specify whether the score was for Trail Making A, Trail Making B, or Trail Making A-B). We also excluded data for which we could not discern whether a higher or lower score indicated better performance. Where studies reported multiple scores for one cognitive test (e.g. for the Wisconsin Card Sorting Test: number of perseverative errors, total number of errors, number of categories etc.), we included the score most commonly reported in the meta-analysis dataset. Due to the large number of included studies and the large number of variables used in our analyses (i.e. sociodemographic, cognitive, and vascular risk variables), we did not contact the authors of original publications to obtain missing data.
Statistical Analysis
We calculated a standardised mean difference (SMD) to represent the difference between performance of the SVD and control cohorts on each cognitive test. We multiplied the SMD by −1 for tests on which a lower score indicated better performance. We excluded three studies due to reporting of implausibly large effect sizes, which upon examination appeared to be due to statistical or reporting errors in the original publications. Whilst several larger effect sizes (SMD >3) remain in our meta-analyses, these effect sizes come from small study samples so are unlikely to affect results if omitted.
Meta-analysis models
We ran seven separate random effects meta-analyses to assess the difference in performance between SVD and control groups on cognitive tests in each cognitive domain. We conducted all meta-analyses using the robumeta package(50) in R version 3.6.1(51). robumeta permits the meta-analysis of multiple effect sizes from one study by employing robust variance estimation (RVE) to account for their statistical dependency. This approach maximises the amount of data included from a single study, increasing the statistical power of each meta-analysis. Dependency in our dataset arose from the inclusion of multiple effect sizes from the same study sample, and the inclusion of studies which used the same control group for comparison with multiple SVD groups. Covariance matrices for multiple outcomes arising from a single study are rarely published, therefore, robumeta imputes a user-specified value for the within-study effect size correlation. We were conservative in our choice of within-study effect size correlation - we specified rho as 0.8 and carried out sensitivity analyses in robumeta, which impute rho values at increments of 0.1 to test whether this alters the model results. For all analyses, we weighted effect sizes according to a correlated effects dependence structure within the robumeta package and used small sample size corrections. Small sample corrections, which correct both the residuals and df used in the RVE, increase the accuracy of models including less than 40 studies(50) After correction, if the Satterthwaite df for the model are less than four, the p value is considered unreliable due to the probability of type I error being greater than 0.05. In our analyses, results of models with Satterthwaite df <4 were considered unreliable. We report I2 and τ2 as measures of heterogeneity.
Meta-regression models
We carried out two secondary analyses to examine the following study-level and cohort-level variables:
1). SVD presentation
To test whether the pooled study effect size differed according to SVD presentation, we grouped each SVD cohort into one of three categories according to the characterisation of the cohort and recruitment setting detailed in the original publication (see Supplementary File 7).
a). Stroke presentations
Cohorts in this category most commonly presented to stroke or neurology services with symptoms of lacunar syndrome, with or without evidence of corresponding vascular lesions. Other cohorts in this category had radiologically identified SVD, or subcortical ischaemic vascular disease.
b). Cognitive presentations
Cohorts in this category were identified on the basis of impaired cognitive ability ranging from MCI to VaD. Typically, cohorts presented with cognitive impairment (according to clinical diagnosis, objective cognitive testing, or subjective concern) and either radiological evidence supporting a vascular aetiology, or multiple risk factors for cerebrovascular disease.
c). Non-clinical presentations
Cohorts had radiological evidence of SVD (WMH or lacunes of presumed vascular origin), but no clinical diagnosis. Typically, cohorts were community-dwelling older individuals recruited within a defined geographical region, or via community advertising. Several cohorts in this category presented to clinical services with non-specific symptoms such as dizziness or headache, but received no diagnosis upon examination.
We then entered SVD presentation as an ordinal predictor in the meta-regression model for each cognitive domain, with the cognitive presentation category as the reference group.
3). Differences in the prevalence of vascular risk between the SVD and control cohorts
All extracted cognitive data were unadjusted for demographic or vascular risk factors. Therefore, to test whether differences in age, education, hypertension and diabetes between SVD and control cohorts accounted for study effect sizes, we calculated the difference in age, years of education, % sample with hypertension, and % sample with diabetes (e.g. difference in age = mean age of control cohort – mean age of SVD cohort), and entered these variables as predictors in separate univariate meta-regression models for each cognitive domain.
Quality Assessment
Quality assessment criteria (see Supplementary File 8) were devised according to STROBE guidelines. Two authors (OH and EJ) independently assessed the quality of included publications on a scale ranging from 0–8 and resolved disagreements by consensus. To assess whether the inclusion of lower quality studies affected the results of the meta-analyses, we re-ran meta-analysis models excluding studies with quality scores lower than the median quality score of the meta-analysis sample.
Results
We identified 69 studies for inclusion in the review (see Table 1; references 52–120), which reported data for 89 cohorts with SVD (n=3229), and 71 control cohorts (n=3679; demographic data for the SVD and control cohorts are presented in Table 2). We did not pre-select literature that focused on a certain lesion type, or clinical, cognitive, or behavioural presentation of SVD, therefore, our dataset included SVD cohorts recruited from specialised cerebrovascular clinics, memory clinics, hospital-based stroke, dementia and general neurology services, non-specialist medical centres, a stroke research network, and also included several research cohorts of healthy community-dwelling individuals. Included studies were from 18 countries in six continents, published in four languages.
Table 1:
Characteristics of all included studies
| Study | SVD cohort described as | SVD n |
Control n |
SVD age mean (SD) | SVD % female | SVD years of Education mean (SD) | SVD % Hypertension | SVD % Diabetes | SVD % Ever smoking | Variables on which SVD & Controls are matched (blank cells=no matching, or data unavailable) |
SVD Mean WMH/TIV (SD) Mean Visual rating (SD) |
|---|---|---|---|---|---|---|---|---|---|---|---|
| Anderson [52] | Lacunar syndrome | 30 | 30 | 68.3 (16.8) | 47% | 9.7 (2.12) | 1, 2 | ||||
| Atwi, 2018 [53] | Fazekas ≥ 2 | 18 | 28 | 72 (5) | 56% | 22% | 6% | 1, 2, 3 | 9.2 ml (0.6) | ||
| Bella, 2016 [54] | VCI-ND | 25 | 20 | 67.5 (6.7) | 60% | 7.6 (3.9) | 88% | 28% | 1, 3 | ||
| Boone, 1992 [55] |
|
27 21 6 |
46 † † |
63.6 (9.9) 69.2 (6.8) 72.0 (4.9) |
15.0 (1.9) 14.2 (3.1) 12.8 (1.3) |
3 3 3 |
|||||
| Brookes, 2014 [56] | SVD | 45 | 80 | 69.7 (8.2) | 44% | Highest formal qualification: None: 51% Secondary: 11% Further education.: 27% Degree: 9% Higher degree: 0% Unavailable: 2% |
84% | 21% | 69% | 1, 2 | Modified Fazekas n (%): Fazekas 0: 6 (13%) Fazekas 1: 12 (27%) Fazekas 2: 12 (27%) Fazekas 3: 12 (27) Unavailable: 3 (6%) |
| Brookes, 2015 [57] | SVD | 196 | 303 | 63.5 (9.9) | 32% | 13.7 (3.8) | 75% | 23% | 44% | 1, 2, 4 | |
| DeCarli, 1995 [58] | WMH volume > 0.5% TIV | 5 | 17 | 74 (14) | 0% | 1 | WMH/TIV 0.80 (0.24) | ||||
| Deguchi, 2013 [59] | Lacunar infarction | 76 | 105 | 73.4 (8.9) | 34% | 12.5 (2.3) | 68% | 30% | 13%* | 1, 2 | |
| Fang, 2013 [60] |
|
46 41 49 |
91 † † |
70.9 (6.4) 70.6 (5.2) 72.1 (5.0) |
57% 42% 47% |
8.11 (2.3) 8.24 (1.9) 8.20 (2.3) |
83% 81% 82% |
22% 27% 25% |
20% 22% 25% |
1, 2, 5 1, 2, 5 1, 2, 5 |
|
| Fernández, 2011 [61] | MCI with subcortical vascular damage | 19 | 19 | 72.2 (7.6) |
32% | 3.6 (3.5) | |||||
| Gainotti, 2008 [62] | MCI + multiple subcortical infarcts | 41 | 65 | 71.7 (5.9) | 41% | Reporting unclear | 1, 3 | ||||
| Garrett, 2004 [63] | VCI-ND | 18 | 25 | 78.4 (6.4) | 44% | 13.6 (2.5) | |||||
| Gonçalves 2017 [64] | Subcortical vascular dementia | 16 | 40 | 74.94 (5.4) |
38% | 3.2 (1.8) | 1,2 | ||||
| Graham, 2004 [65] | VaD | 19 | 19 | 71.2 (7.8) | 26% | 11.6 (3.1) | 1, 3 | ||||
| Hassan, 2010 [66] | Symptomatic lacunar infarction | 30 | 12 | 59.1 (9.5) | 40% | Able to read and write: 53% Educated to between primary and university level: 46.7% |
100% | 47% | 53% | 1 | |
| Hsu, 2016 [67] | MCI due to SIVD | 20 | 30 | 68.5 (10.8) | 30% | 7.6 (4.17) | 40% | 25% | 1,2,3 | 23.9 (9.9) Scheltens | |
| Ishii, 2007 [68] |
|
68 38 21 21 |
234 † † † |
74.9 (7.9) 73.0 (6.3) 79.1 (6.9) 80.7 (6.5) |
8.3 (1.5) 8.4 (2.1) 7.3 (2.2) 7.6 (1.7) |
84% 92% 76% 86% |
10% 16% 14% 5% |
||||
| Jokinen, 2009 [69] | SIVD | 89 | 524 | 73.6 (4.9) | 48% | 8.8 (4.2) | 80% | 18% | 15%* | 1, 2 |
WMH severity ratings:
Mild: 0 Moderate: 10 Severe: 79 |
| Kim, 2018 [70] | Subcortical VCI | 61 | 19 | 78.7 (6.3) | 72% | 7.3 (5.1) | 1,2,3 | ||||
| Kramer, 2002 [71] | SIVD | 12 | 27 | 73.7 (6.2) | 15.3 (2.6) | 1, 3 | |||||
| Kuriyama, 2018 [72] |
|
134 62 16 |
68 † † |
69.3 (5.7) 71.5 (6.3) 73.8 (6.6) |
31% 36% 38% |
Reporting unclear | 47% 57% 81% |
12% 15% 6% |
16%* 7%* 13%* |
2 |
PWMH ≥ grade 2 (de Groot classification), n (%):
4 (3%) 17 (27%) 11 (69%) |
| Ledesma-Amaya, 2014 [73] | Lacunar infarction | 16 | 16 | 63 (9.4) | 38% | 7.1 (4) | 13% | 8% | 1,3 | ||
| Lee, 2014 [74] | Subcortical vascular mild cognitive impairment | 67 | 75 | 73.7 (6.7) |
61% | 9.0 (5.2) |
75% | 25% | 2 | 34.9ml (17.8) | |
| Lewine, 1993 [75] |
|
4 6 |
4 6 |
35.2 (11.8) 43.3 (8.4) |
0% 100% |
1 1 |
|||||
| Li, 2001 [76] | Leukoaraiosis | 29 | 25 | 64.9 (6.8) | 7.5 (6.8) | 1, 2, 3 | |||||
| Li, 2012 [77] | Lacunar stroke with ischaemic leukoaraiosis | 20 | 20 | 65.8 (8.4) | 45% | Reporting unclear | 60% | 60% | |||
| Li, 2015 [78] | Symptomatic lacunar infarction | 19 | 23 | 66 (12.0) | 37% | 8.5 (3) | 68% | 37% | 11%* | 3 | |
| Li, 2017 [79] | Leukoaraiosis | 13 | 13 | 63 (6) | 39% | 10.3 (3.3) | 69% | 1, 2, 6 | |||
| Liu, 2008 [80] | Subcortical small vessel infarction | 60 | 52 | 73 (8) | 47% | 27% | 14% | 1, 2, 3 | |||
| Liu, 2015 [81] | WMH | 30 | 30 | 78.2 (5.7) | 8.4 (2) | 23% | 11% | 1, 3 | |||
| Liu 2019a [82] |
|
25 29 |
27 † |
70.5 (3.5) 70.5 (5.8) |
36% 45% |
10.6 (2.6) 9.4 (1.7) |
56% 59% |
40% 37% |
20% 24% |
1, 2, 3 1, 2, 3 |
12.6ml (5.0) 19.8ml (8.8) |
| Liu 2019b [83] |
|
21 20 |
25 † |
64.6 (10.9) 66.5 (7.9) |
52% 50% |
10.5 (3.6) 13.1 (3.8) |
1, 2, 3 1, 2, 3 |
3.2ml (3.0) 3.4ml (4.1) |
|||
| Maeshima, 2002 [84] |
|
21 14 |
63 70 |
49.4 (5.6) 51.4 (6.6) |
62% 57% |
12.5 (2.1) 12.4 (2.1) |
24% 21% |
14% 29% |
1, 2, 3 1, 2, 3 |
||
| Nebes, 2013 [85] | WMH | 26 | 40 | 75.1 (5.8) | 65% | 14.5 (2.7) | 1, 2, 3 | ||||
| Nordahl 2005 [86] | MCI + severe WMH | 11 | 20 | 77.6 (3.6) | 55% | 13.5 (1.5) | 82% | 27% | 1, 3 | WMH/TIV 3.9 (1.3) | |
| Nordlund, 2007 [87] | Vascular MCI | 60 | 60 | 67.0 (7.3) | 63% | 11.2 (3.2) | 1, 2, 3 | ||||
| Oguro, 2000 [88] | PWMH | 18 | 9 | 73.6 (4.2) | 61% | 9.3 (3.2) | Scale unclear | 1, 2, 3 | |||
| Pascual, 2010 [89] |
|
12 12 |
12 (cognitive data for 10 only) † |
80.7 (5.2) 79.5 (4.6) |
50% 50% |
1, 2, 3 1, 2, 3 |
|||||
| Pinkhardt, 2014 [90] | Small vessel cerebrovascular disease | 25 | 19 | 75 (58–91) | 68% |
Fazekas pWMH 2.36;
Fazekas dWMH 2.2 SD not reported |
|||||
| Price, 2009 [91] | Dementia with:
|
73 44 27 |
24 † † |
78.5 (5.7) 81.0 (5.0) 79.4 (4.4) |
82% 66% 81% |
12.6 (2.8) 12.2 (2.8) 11.9 (2.1) |
2, 3 |
Junque score
4.0 (2.8) 12.0 (2.3) 22.3 (4.4) |
|||
| Quinque, 2012 [92] | Early cerebral microangiopathy | 11 | 21 | 61.4 (6.3) | 40% | 13.8 (3.0) |
1, 2, 3, 4 |
8.3 (4.0)
ARWMC |
|||
| Rao, 1989 [93] | Leukoaraiosis | 10 | 40 | 47.1 (7.8) | 90% | 14 (1.9) | 1, 2, 3 | ||||
| Schmidt, 1993 [94] | WMH | 74 | 76 | 61.3 (6.6) | 11.4 (2.6) | 4% | 3 | ||||
| Seo, 2010 [95] |
|
34 (cognitive data for between 30–34 only) 20 (cognitive data for between 15–18 only) |
96 (cognitive data for 63 only) † |
70.6 (6.4) 74.2 (6.1) |
44% 55% |
10.1 (4.8) 7.2 (5.5) |
84% 100% |
29% 30% |
2, 3 | ||
| Sierra, 2004 [96] | Hypertensive with WMH | 23 | 37 | 55.2 (4.2) | 39% | 11.2 (3.7) | 100% | 22% | 1, 2, 3 | ||
| Squarzoni, 2017 [97] | Silent brain infarct | 57 | 187 | 72.1 (3.4) | 56% | 68% | 33% | 1 | |||
| Sudo, 2013 [98] | Vascular MCI | 15 | 11 | 74.1 (8.1) | 60% | 8.9 (4.0) | 1, 2, 3 |
Fazekas rating, n (%)
Fazekas 0: 0 (0%) Fazekas 1: 0 (0%) Fazekas 2: 7 (47%) Fazekas 3: 8 (53%) |
|||
| Sun, 2014 [99] | Mild WMH | 51 | 49 | 65.3 (7.2) | 55% | 10.3 (3.4) | 16% | 10% | 8% | 1, 2, 3 | |
| Tupler, 1992 [100] | dWMH | 48 | 18 | 69.9 (10.1) | 69% | 13.9 (4.2) | |||||
| van Swieten, 1991 [101] | Hypertensive with confluent WMH | 10 | 18 | 67.8 (5.3) | 32% | 100% | 50% | 1, 2 | Normal white matter=20; focal lesions=12; confluent lesions=10 | ||
| van Zandvoort, 2003 [102] | Lacunar infarct in brainstem | 17 | 17 | 60.1 (11.6) |
29% | <6 years primary school: 0% 6 years of education (YoE): 6% 8 YoE: 0% 9 YoE: 47% 10–11 YoE: 23.5% 12–18 YoE: 23.5% >18 YoE: 0% |
1, 2, 3 | ||||
| van Zandvoort, 2005 [103] | Supratentorial lacunar infarct | 26 | 14 | 60.5 (12.3) | 38% | Scale unclear | 1, 3 | ||||
| Villeneuve, 2011 [104] | MCI with confluent WMH | 21 | 27 | 73.4 (5.1) | 48% | 12.4 (5.2) | 1, 2, 3 |
10.0 (3.1)
Wahlund |
|||
| Wolfe, 1990 [105] | Multiple lacunar infarcts | 11 | 11 | 64.6 (6.0) | No information | 10.1 (3.1) | 1, 3 | ||||
| Wong, 2007 [106] | Stroke associated with SVD | 32 | 42 | 72.8 (10.0) | 44% | Scale unclear | 1, 2, 3 | 56.9 ml (8.7) | |||
| Yamauchi, 2000 [107] | Lacunar infarct | 28 | 34 | 69.3 (6.3) | 32% | 8.9 (1.3) | 21% | 11% | 1, 3 |
Anterior WMH 3.6 (3.1)
Posterior 3.6 (2.8) Scale – see publication |
|
| Yang, 2015 [108] | Vascular MCI | 15 | 15 | 61.7 (6.2) | 73% | 9.3 (2.4) | 1, 2, 3 | ||||
| Yang, 2016 [109] | Lacunar infarct | 60 | 30 | 67.0 (7.0) | 42% | 7.2 (2.3) | 58% | 18% | 38%* | 1, 2, 3 | |
| Yi, 2012 [110] | Subcortical vascular MCI | 26 | 28 | 66.7 (9.5) | 58% | 9.9 (4.4) | 1, 2, 3 | ||||
| Yu, 2019 [111] | Extensive SIVD | 29 | 25 | 71.8 (11.0) | 52% | 14.4 (3.2) | 75% | 10% | 58% | 1, 2, 3 | DWMH 2.55 (2.5)cm3 PWMH 29.0 (21.6)cm3 |
| Yuan, 2012 [112] | Leukoaraiosis | 46 | 38 | 72.0 (6.0) | 70% | 8 (4) | 74% | 61% | 1, 2, 3 | ||
| Yuan, 2017 [113] | Leukoaraiosis | 50 | 50 | 71.7 (5.5) | 58% | 7.5 (4.3) | 67% | 50% | 26% | 1, 2, 3 | |
| Yuspeh, 2002 [114] | SVaD | 29 | 38 | 74.1 (8.2) | 35% | 13.2 (4.4) | 1, 2, 3 | ||||
| Zhang 2019a [115] | SVD | 77 | 39 | 70 (11) | 40% | Educational level: Low = 45% Medium = 35% High = 20% |
64% | 16% | 25% | 1, 2 | WMH/TIV 0.014 (0.002) |
| Zhang, 2019b [116] | Amnestic MCI with Fazekas >1 |
30 | 90 | 68.33 (5.3) | 47% | 12.30 (2.6) | 1, 2 | ||||
| Zhao, 2016 [117] |
|
62 60 61 |
55 † † |
73.2 (4.7) 71.9 (4.2) 73.9 (3.8) |
42% 38% 33% |
10.7 (3.2) 10.9 (3.6) 10.5 (3.2) |
76% 75% 78% |
37% 33% 43% |
31%* 23%* 34%* |
||
| Zhou, 2009 [118] | MCI due to SVD | 56 | 80 | 67.3 (6.2) | 36% | 9.6 (3.1) | 2, 3 | ||||
| Zhou, 2014 [119] |
|
79 82 |
77 † |
72.2 (7.1) 74.1 (7.1) |
53% 51% |
9.9 (3.3) 7.4 (3.3) |
63% 73% |
29% 22% |
32%* 42%* |
2 | |
| Zi, 2014 [120] | pWMH | 16 | 16 | 62.0 (4.9) | 56% | 8 (6.3–10.3) | 63% | 19% | 19%* | 1, 2, 3 |
Data are presented as mean (SD) or median (range), unless otherwise stated; CVD: cerebrovascular disease; dWMH: deep white matter hyperintensities; MCI: mild cognitive impairment; pWMH: Periventricular white matter hyperintensities; SIVD: subcortical ischaemic vascular disease; SVaD: subcortical ischaemic vascular dementia; SVD: cerebral small vessel disease; TIV: total intercranial volume; VaD: vascular dementia; VCI: vascular cognitive impairment; VCI-ND: vascular cognitive impairment – no dementia; WMH: white matter hyperintensities. Controls matched for: 1 Age; 2 Sex; 3 Education; 4 Premorbid IQ; 5 Vascular risk factors; 6 history of hypertension. Where cells are blank, no data were available.
Current smoker.
Same control group used as comparison for both/all SVD groups.
Table 2:
Summary of socio-demographic and vascular risk data for SVD and control cohorts
| SVD cohorts | Control cohorts | |||
|---|---|---|---|---|
| cohorts (n=89) | mean (SD or 95% CI) | cohorts (n=71) | mean (SD or 95% CI) | |
| mean age* | 88 | 69.3 (67.8, 70.9) | 70 | 66.4 (64.6, 68.2) |
| % female | 76 | 49.0 (15.9) | 63 | 50.9 (15.0) |
| mean years education* | 67 | 10.3 (9.7, 10.9) | 53 | 10.8 (10.1, 11.6) |
| % hypertension | 48 | 66.7 (23.0) | 34 | 37.8 (20.7) |
| % diabetes | 45 | 25.5 (13.7) | 31 | 17.1 (13.5) |
| % hypercholesterolemia | 5 | 55.1 (20.0) | 4 | 35.1 (12.3) |
| % history of smoking | 28 | 28.3 (16.1) | 16 | 25.6 (16.9) |
Mean age and mean years of education were calculated using random effects meta-analysis in the meta package in R version 3.6.1 (Schwarzer G. “meta: An R package for meta-analysis.” R News 2007, 7(3), 40–45). Only studies that presented group level data for age and years of education as mean and standard deviation were included in these meta-analyses. We did not test for differences in age, sex, level of education, or vascular risk factors between the SVD and control groups as some studies only reported these data for the SVD group, therefore, comparisons would not include all participants contributing cognitive data to the meta-analyses.
Meta-analyses
The pooled estimated effect size for each meta-analysis demonstrated that on average, control cohorts outperformed SVD cohorts on cognitive tasks in every domain examined (see Table 3 and forest plots in Figure 2 and Figures S1 – S6). I2 values, which are an indicator of inconsistency between effect sizes in the meta-analyses, were high in each meta-analysis.
Table 3:
Results of meta-analysis models for each cognitive domain
| Heterogeneity | ||||||||
|---|---|---|---|---|---|---|---|---|
| Studies | Outcomes | Estimate (SE) | 95% CI | Degrees of freedom | Uncorrected p value | τ2 | I2 | |
| Processing Speed | 37 | 88 | −0.885 (0.14) | −1.17, −0.60 | 35.8 | 2.3×10⁻⁷ | 0.6 | 91.4 |
| Executive function | 58 | 188 | −0.936 (0.08) | −1.09, −0.78 | 56.1 | <2×10⁻¹⁶ | 0.4 | 87.6 |
| Delayed memory | 41 | 98 | −0.898 (0.10) | −1.10, −0.69 | 39.6 | 7.2×10⁻¹¹ | 0.5 | 88.0 |
| Attention | 12 | 19 | −0.622 (0.14) | −0.94, −0.31 | 10.6 | 0.001 | 0.2 | 80.8 |
| Reasoning | 16 | 25 | −0.634 (0.14) | −0.93, −0.34 | 14.6 | 4.2×10⁻⁴ | 0.2 | 76.5 |
| Visuospatial ability | 27 | 50 | −0.720 (0.11) | −0.96, −0.48 | 25.3 | 1.3×10⁻⁶ | 0.3 | 77.6 |
| Language | 24 | 42 | −0.808 (0.10) | −1.01, −0.60 | 22.7 | 3.2×10⁻⁸ | 0.3 | 81.2 |
Meta Regression analyses
Our meta-analysis dataset included 26 cohorts with stroke presentations of SVD, 31 cohorts with cognitive impairment or dementia, and 32 cohorts with non-clinical presentations of SVD. There were no differences in years of education, or prevalence of hypertension or diabetes between the three SVD presentation categories, but cohorts with cognitive impairment/dementia were significantly older than those with non-clinical presentations of the disease (p=0.002; see Table 4).
Table 4:
Demographics of SVD cohorts with non-clinical presentations of SVD, stroke, or cognitive impairment/dementia
| Non-clinical | Stroke | Cognitive impairment/dementia | |||||
|---|---|---|---|---|---|---|---|
| % cohorts (n=32) | mean (SD or 95% CI) | % cohorts (n=26) | mean (SD or 95% CI) | % cohorts (n=31) | mean (SD or 95% CI) | Uncorrected p value† | |
| mean age* | 100% | 66.1 (62.8, 69.4) | 96.2% | 69.0 (67.0, 71.1) | 100% | 72.8 (70.9, 74.7) | 0.002a |
| % female | 71.9% | 53.2 (20.8) | 92.3% | 42.0 (8.5) | 93.5% | 51.6 (14.6) | 0.027 |
| mean years education* | 68.8% | 10.6 (9.5, 11.7) | 61.5% | 10.6 (9.4, 11.8) | 93.5% | 9.9 (8.8, 10.9) | 0.515 |
| % hypertension | 62.5% | 60.3 (28.7) | 65.4% | 68.6 (17.6) | 35.5% | 75.1 (16.4) | 0.214 |
| % diabetes | 59.4% | 23.4 (16.4) | 61.5% | 28.6 (12.7) | 32.3% | 24.4 (9.1) | 0.524 |
mean age and mean years of education were calculated using random effects meta-analysis in the meta package in R version 3.6.1. (Schwarzer G. “meta: An R package for meta-analysis.” R News 2007, 7(3), 40–45). Only studies that presented group level data for age and years of education as mean and standard deviation were included in these meta-analyses.
p value refers to comparisons made by one-way ANOVA.
significant difference at p<0.01 between non-clinical and cognitive impairment/dementia groups.
Meta-regression models investigating differences in cognitive effect sizes of the three SVD presentation groups indicated that the effect size for delayed memory was 0.83 standard deviations greater for the stroke cohorts (95% CI: 0.44, 1.21; p<0.001) and 0.85 standard deviations greater for non-clinical cohorts (95% CI: 0.40, 1.29; p=0.001), than cohorts with a cognitive impairment/dementia. We also found that the effect size was 0.49 standard deviations greater in the domain of executive function (95% CI: 0.10, 0.88; p=0.015), and 0.68 standard deviations greater in the domain of visuospatial ability (95% CI: 0.30, 1.01; p=0.002) for the non-clinical cohorts than the cohorts with a cognitive impairment/dementia (see Supplementary File 9 for full results). Including SVD presentation as a predictor in meta-regression models had little effect on study heterogeneity.
Meta-regression models investigating the impact of differences in age, education and the prevalence of vascular risk factors between SVD vs. control groups on cognitive effect sizes, indicated that the difference in cognitive performance between SVD and control groups could be due to lower levels of education in SVD cohorts (see Supplementary File 10 for full results) For every 1 year of difference in education between SVD and control groups, the cognitive effect size decreased (indicating superior performance of the control groups) by an estimated 0.23 standard deviations in the domain of executive function (95% CI: −0.37, −0.09; p=0.004), 0.28 standard deviations in the domain of visuospatial ability (95% CI: −0.46, −0.10; p=0.009), and 0.31 standard deviations in the domain of language (95% CI: −0.46, −0.16; p=0.001). Including education as a predictor in meta-regression models reduced I2 values by approximately 13% in the domain of visuospatial ability and language, suggesting that education may account for some of the variability in cognitive effect sizes in these domains. Overall however, I2 values remained high. This could be due to our use of group-level demographic and vascular risk data, which may limit power to detect interactions between individual-level covariates and cognitive effect sizes. Meta-analytic approaches utilising individual patient data are increasingly popular, but rely upon the availability of patient-level datasets, which in our sample were rare.
The majority of the meta-regression models assessing the influence of age on cognitive effect size produced df <4, suggesting that model results were unreliable. Therefore, we further investigated the potential influence of age by re-running meta-analysis models excluding studies in which SVD and control groups were not matched for age. In these analyses magnitudes of estimated effect sizes were similar to the initial meta-analysis models and all models remained significant. Meta-regression models investigating the impact of hypertension and diabetes on cognitive effects also produced degrees of freedom <4 suggesting that model results were unreliable, likely due to the limited availability of vascular risk data.
Study Quality
The mean study quality score was 4.97 (median 5, range 2–8). The magnitudes estimated effect sizes were comparable to those using the full meta-analysis dataset, and all models remained significant (see Supplementary File 11). I2 values reduced by a small amount in the domains of executive function, visuospatial ability, attention and language, but increased in the other domains.
Supplementary Material
Research in Context.
Systematic review: We conducted systematic searches of MEDLINE, Embase, and PsycINFO. Identified literature contradicts current consensus statements on SVD-related cognitive impairments, which describe impaired information processing speed and executive functions, alongside preserved memory and language skills. Also, little is known about whether cognitive impairments vary between clinical presentations of SVD.
Interpretation: SVD-related cognitive impairments are global, affecting all cognitive domains examined. Global impairments were present regardless of SVD presentation (e.g. stroke, mild cognitive impairment/dementia, or non-clinical cohorts). Our findings also highlight low levels of education as a potentially modifiable risk factor for SVD-related cognitive impairments.
Future directions: Future studies should test a broad range of cognitive domains, account for educational experience, and include multiple presentations of SVD, to examine vascular contributions to cognitive impairments and dementia.
Acknowledgements
We would like to thank Rana Fetit, Noboru Komiyama, Masoud Shirali and Maria Valdéz Hernández, whose assistance with screening non-English texts for inclusion in the review was greatly appreciated. Thanks also Ezgi Tanriver Ayder and Francesca Chappell for their advice on statistical aspects of the meta-analysis. OKLH is funded by the College of Medicine and Veterinary Medicine at the University of Edinburgh, and is supported by the Wellcome Trust through the Translational Neuroscience PhD programme at the University of Edinburgh. JMW is supported by the Row Fogo Charitable Trust, Fondation Leducq (Perivascular Spaces Transatlantic Network of Excellence), and EU Horizon 2020 (SVDs@Target) and the MRC UK Dementia Research Institute at the University of Edinburgh. IJD is partly supported by grants that contribute to the Lothian Birth Cohorts (Age UK [Disconnected Mind grant], Medical Research Council [MR/R024065/1], and national Institutes of Health [1R01AG054628-01A1.)]). AS and TER are supported by funding from the Wellcome Trust 4-year PhD in Translational Neuroscience [108890/Z/15/Z].
Footnotes
Declaration of interests
The authors declare no conflicts of interest.
References
- [1].Wardlaw JM, Smith C, Dichgans M. Small vessel disease: mechanisms and clinical implications. Lancet Neurol. 2019;18(7):684–696. [DOI] [PubMed] [Google Scholar]
- [2].Brown R, Benveniste H, Black SE, et al. Understanding the role of the perivascular space in cerebral small vessel disease. Cardiovasc Res. 2018;114(11):1462–1473. [DOI] [PMC free article] [PubMed] [Google Scholar]
- [3].O’Brien JT, Erkinjuntti T, Reisberg B, et al. Vascular cognitive impairment. Lancet Neurol. 2003;2(2):89–98. [DOI] [PubMed] [Google Scholar]
- [4].Sachdev P, Kalaria R, O’Brien J, et al. Diagnostic criteria for vascular cognitive disorders: A VASCOG statement. Alzheimer Dis Assoc Disord. 2014;28(3):206–18. [DOI] [PMC free article] [PubMed] [Google Scholar]
- [5].Skrobot OA, Black SE, Chen C, et al. Progress toward standardized diagnosis of vascular cognitive impairment: Guidelines from the Vascular Impairment of Cognition Classification Consensus Study. Alzheimer’s Dement. 2018;14(3):280–92. [DOI] [PubMed] [Google Scholar]
- [6].Hachinski V, Einhäupl K, Ganten D, et al. Preventing dementia by preventing stroke: The Berlin Manifesto. Alzheimer’s Dement. 2019;15(7):961–84. [DOI] [PMC free article] [PubMed] [Google Scholar]
- [7].van der Flier WM, Skoog I, Schneider JA, et al. Vascular cognitive impairment. Nat Rev Dis Prim. 2018;4:18003. [DOI] [PubMed] [Google Scholar]
- [8].Gorelick PB, Scuteri A, Black SE, et al. Vascular contributions to cognitive impairment and dementia: A statement for healthcare professionals from the American Heart Association/American Stroke Association. Stroke. 2011;42(9):2672–2713. [DOI] [PMC free article] [PubMed] [Google Scholar]
- [9].Reppermund S, Brodaty H, Crawford JD, et al. Impairment in instrumental activities of daily living with high cognitive demand is an early marker of mild cognitive impairment:The Sydney memory and ageing study. Psychol Med. 2013;43(11):2437–45. [DOI] [PubMed] [Google Scholar]
- [10].Rockwood K, Brown M, Merry H, Sketris I, Fisk J. Societal costs of vascular cognitive impairment in older adults. Stroke. 2002;33(6):1605–9. [DOI] [PubMed] [Google Scholar]
- [11].Hussenoeder FS, Conrad I, Roehr S, et al. Mild cognitive impairment and quality of life in the oldest old: a closer look. Qual Life Res. 2020; 10.1007/s11136-020-02425-5 [DOI] [PMC free article] [PubMed] [Google Scholar]
- [12].Nys GMS, van Zandvoort MJE, van der Worp HB, et al. Early cognitive impairment predicts long-term depressive symptoms and quality of life after stroke. J Neurol Sci. 2006;247(2):149–56. [DOI] [PubMed] [Google Scholar]
- [13].Rosenberg GA, Wallin A, Wardlaw JM, et al. Consensus statement for diagnosis of subcortical small vessel disease. J Cereb Blood Flow Metab. 2016;36(1):6–25. [DOI] [PMC free article] [PubMed] [Google Scholar]
- [14].Peng D, Chen L, Chen X, et al. Clinical practice guideline for cognitive impairment of cerebral small vessel disease. Aging Med. 2019;2(2):64–73. [DOI] [PMC free article] [PubMed] [Google Scholar]
- [15].Lara J, Cooper R, Nissan J, Ginty AT, Khaw KT, Deary IJ, et al. A proposed panel of biomarkers of healthy ageing. BMC Med. 2015;13(1):1–8. [DOI] [PMC free article] [PubMed] [Google Scholar]
- [16].Vasquez BP, Zakzanis KK. The neuropsychological profile of vascular cognitive impairment not demented: A meta-analysis. J Neuropsychol. 2015;9(1):109–136. [DOI] [PubMed] [Google Scholar]
- [17].Salthouse TA. The processing-speed theory of adult age differences in cognition. Psychological Review 1996;103(3):403–428. [DOI] [PubMed] [Google Scholar]
- [18].Penke L, Maniega SM, Bastin ME, et al. Brain white matter integrity as a neural foundation for general intelligence. Molecular Psychiatry. 2012;17:1026–1030. [DOI] [PubMed] [Google Scholar]
- [19].Salthouse TA. Selective review of cognitive ageing. J. Int. Neuropsychol. Soc 2010;16:754–760. [DOI] [PMC free article] [PubMed] [Google Scholar]
- [20].Verhaeghen P The Elements of Cognitive Ageing. Oxford, UK: Oxford University Press; 2014. [Google Scholar]
- [21].Biesbroek JM, Weaver NA, Biessels GJ. Lesion location and cognitive impact of cerebral small vessel disease. Clin. Sci 2017;131, 715–728. [DOI] [PubMed] [Google Scholar]
- [22].ter Telgte A, van Leijsen EMC, Wiegertjes K, Klijn CJM, Tuladhar AM, de Leeuw FE. Cerebral small vessel disease: from a focal to a global perspective. Nature Reviews Neurology. 2018;14(7):387–398. [DOI] [PubMed] [Google Scholar]
- [23].Szirmai I, Vastagh I, Szombathelyi É, Kamondi A. Strategic infarcts of the thalamus in vascular dementia. J. Neurol. Sci 2002;203–204:91–97. [DOI] [PubMed] [Google Scholar]
- [24].O’Brien JT, Wiseman R, Burton EJ, et al. Cognitive associations of subcortical white matter lesions in older people. Ann. N. Y. Acad. Sci 2002;977:436–444. [DOI] [PubMed] [Google Scholar]
- [25].Benisty S, Gouw AA, Porcher R, et al. Location of lacunar infarcts correlates with cognition in a sample of non-disabled subjects with age-related white-matter changes: The LADIS study. J. Neurol. Neurosurg Psychiatry 2009;80:478–483. [DOI] [PubMed] [Google Scholar]
- [26].Benjamin P, Lawrence AJ, Lambert C, et al. Strategic lacunes and their relationship to cognitive impairment in cerebral small vessel disease. NeuroImage Clin. 2014;4:828–837. [DOI] [PMC free article] [PubMed] [Google Scholar]
- [27].Muñoz Maniega S, Meijboom R, Chappell FM, et al. Spatial Gradient of Microstructural Changes in Normal-Appearing White Matter in Tracts Affected by White Matter Hyperintensities in Older Age. Frontiers in Neurology. 2019;10:784. [DOI] [PMC free article] [PubMed] [Google Scholar]
- [28].Duering M, Righart R, Wollenweber FA, Zeitemann V, Gesierich B, Dichgans M. Acute infarcts cause focal thinning in remote cortex via degeneration of connecting fiber tracts. Neurology. 2015;84:1685–92. [DOI] [PMC free article] [PubMed] [Google Scholar]
- [29].Shi Y, Wardlaw JM. Update on cerebral small vessel disease: a dynamic whole-brain disease. BMJ. 2016;1(3):83–92. [DOI] [PMC free article] [PubMed] [Google Scholar]
- [30].Pasi M, Cordonnier C. Clinical Relevance of Cerebral Small Vessel Diseases. Stroke. 2020;51(1):47–53. [DOI] [PubMed] [Google Scholar]
- [31].Georgakis MK, Duering M, Wardlaw JM, Dichgans M. WMH and long-term outcomes in ischemic stroke: A systematic review and meta-analysis. Neurology. 2019;92(12):E1298–E1308. [DOI] [PubMed] [Google Scholar]
- [32].van Uden IWM, van der Holst HM, Tuladhar AM, et al. White matter and hippocampal volume predict the risk of dementia in patients with cerebral small vessel disease: The RUN DMC study. J Alzheimer’s Dis. 2015;49(3):863–73. [DOI] [PubMed] [Google Scholar]
- [33].Zeestraten EA, Lawrence AJ, Lambert C, et al. Change in multimodal MRI markers predicts dementia risk in cerebral small vessel disease. Neurology. 2017. October 31;89(18):1869–76. [DOI] [PMC free article] [PubMed] [Google Scholar]
- [34].Kuźma E, Lourida I, Moore SF, Levine DA, Ukoumunne OC, Llewellyn DJ. Stroke and dementia risk: A systematic review and meta-analysis. Alzheimer’s Dement. 2018;14(11):1416–26. [DOI] [PMC free article] [PubMed] [Google Scholar]
- [35].Sabayan B, Gussekloo J, de Ruijter W, Westendorp RGJ, de Craen AJM. Framingham stroke risk score and cognitive impairment for predicting first-time stroke in the oldest old. Stroke. 2013;44(7):1866–71. [DOI] [PubMed] [Google Scholar]
- [36].Kapasi A, DeCarli C, Schneider JA. Impact of multiple pathologies on the threshold for clinically overt dementia. Acta Neuropathol. 2017;134:171–186. [DOI] [PMC free article] [PubMed] [Google Scholar]
- [37].Sweeney MD, Montagne A, Sagare AP, et al. Vascular dysfunction—The disregarded partner of Alzheimer’s disease. Alzheimer’s and Dementia. 2019;15(1):158–167. [DOI] [PMC free article] [PubMed] [Google Scholar]
- [38].Montagne A, Barnes SR, Sweeney MD, et al. Blood-Brain Barrier Breakdown in the Aging Human Hippocampus. Neuron. 2015;85(2):296–302. [DOI] [PMC free article] [PubMed] [Google Scholar]
- [39].Hughes TM, Kuller LH, Barinas-Mitchell EJ, et al. Arterial stiffness and β-amyloid progression in nondemented elderly adults. JAMA Neurol. 2014;71(5):562–568. [DOI] [PMC free article] [PubMed] [Google Scholar]
- [40].Montagne A, Nation DA, Sagare AP, et al. APOE4 leads to blood–brain barrier dysfunction predicting cognitive decline. Nature. 2020;581:71–6. [DOI] [PMC free article] [PubMed] [Google Scholar]
- [41].Dichgans M, Wardlaw J, Smith E, et al. METACOHORTS for the study of vascular disease and its contribution to cognitive decline and neurodegeneration: An initiative of the Joint Programme for Neurodegenerative Disease Research. Alzheimer’s Dement. 2016;12(12):1235–49. [DOI] [PMC free article] [PubMed] [Google Scholar]
- [42].Staals J, Makin SDJ, Doubal FN, Dennis MS, Wardlaw JM. Stroke subtype, vascular risk factors, and total MRI brain small-vessel disease burden. Neurology. 2014;83(14):1228–34. [DOI] [PMC free article] [PubMed] [Google Scholar]
- [43].Gannon OJ, Robison LS, Custozzo AJ, Zuloaga KL. Sex differences in risk factors for vascular contributions to cognitive impairment & dementia. Neurochem Int. 2019;127:38–55. [DOI] [PubMed] [Google Scholar]
- [44].Carcel C, Woodward M, Balicki G, et al. Trends in recruitment of women and reporting of sex differences in large-scale published randomized controlled trials in stroke. Int J Stroke. 2019;14(9):931–8. [DOI] [PubMed] [Google Scholar]
- [45].Backhouse EV, McHutchison CA, Cvoro V, Shenkin SD, Wardlaw JM. Early life risk factors for cerebrovascular disease: A systematic review and meta-analysis. Neurology. 2017;88(10):976–984. [DOI] [PubMed] [Google Scholar]
- [46].Ritchie SJ, Bates TC, Der G, Starr JM, Deary IJ. Education is associated with higher later life IQ scores, but not with faster cognitive processing speed. Psychol Aging. 2013;28(2):515–521. [DOI] [PubMed] [Google Scholar]
- [47].Dykiert D, Deary IJ. Retrospective validation of WTAR and NART scores as estimators of prior cognitive ability using the lothian birth cohort 1936. Psychol Assess. 2013;25(4):1361–1366. [DOI] [PubMed] [Google Scholar]
- [48].Hachinski V, Iadecola C, Petersen RC, et al. National Institute of Neurological Disorders and Stroke–Canadian stroke network vascular cognitive impairment harmonization standards. Stroke. 2006;37(9):2220–41. [DOI] [PubMed] [Google Scholar]
- [49].Bright P, van der Linde I. Comparison of methods for estimating premorbid intelligence. Neuropsychol Rehabil. 2020;30(1):1–14. [DOI] [PubMed] [Google Scholar]
- [50].Fisher Z, Tipton E. robumeta: An R-package for robust variance estimation in meta-analysis. 2015. http://arxiv.org/abs/1503.02220.
- [51].R Core Team. R: A language and environment for statistical computing. 2019. https://www.r-project.org/.
- [52].Anderson JFI, Saling MM, Srikanth VK, Thrift AG, Donnan GA. Individuals with first-ever clinical presentation of a lacunar infarction syndrome: Is there an increased likelihood of developing mild cognitive impairment in the first 12 months after stroke? J Neuropsychol. 2008;2(Pt 2):373–385. [DOI] [PubMed] [Google Scholar]
- [53].Atwi S, Metcalfe AWS, Robertson AD, Rezmovitz J, Anderson ND, MacIntosh BJ. Attention-related brain activation is altered in older adults with white matter hyperintensities using multi-echo fMRI. Front Neurosci. 2018;12(OCT):1–14. [DOI] [PMC free article] [PubMed] [Google Scholar]
- [54].Bella R, Cantone M, Lanza G, et al. Cholinergic circuitry functioning in patients with vascular cognitive impairment - No dementia. Brain Stimul. 2016;9(2):225–233. [DOI] [PubMed] [Google Scholar]
- [55].Boone KB, Miller BL, Lesser IM, et al. Neuropsychological correlates of white-matter lesions in healthy elderly subjects. A threshold effect. Arch Neurol. 1992;49(5):549–554. [DOI] [PubMed] [Google Scholar]
- [56].Brookes RL, Herbert V, Paul S, Hannesdottir K, Markus HS, Morris RG. Executive dysfunction, awareness deficits and quality of life in patients with cerebral small vessel disease: A structural equation model. Neuropsychology. 2014;28(2):247–253. [DOI] [PubMed] [Google Scholar]
- [57].Brookes RL, Hollocks MJ, Khan U, Morris RG, Markus HS. The Brief Memory and Executive Test (BMET) for detecting vascular cognitive impairment in small vessel disease: A validation study. BMC Med. 2015;13(1):1–8. [DOI] [PMC free article] [PubMed] [Google Scholar]
- [58].DeCarli C, Murphy DGM, Tranh M, et al. The effect of white matter hyperintensity volume on brain structure, cognitive performance, and cerebral metabolism of glucose in 51 healthy adults. Neurology. 1995;45(11):2077–2084. [DOI] [PubMed] [Google Scholar]
- [59].Deguchi K, Kono S, Deguchi S, et al. A novel useful tool of computerized touch panel-type screening test for evaluating cognitive function of chronic ischemic stroke patients. J Stroke Cerebrovasc Dis. 2013;22(7):e197–e206. [DOI] [PubMed] [Google Scholar]
- [60].Fang M, Feng C, Xu Y, Hua T, Jin AP, Liu XY. Microbleeds and silent brain infarctions are differently associated with cognitive dysfunction in patients with advanced periventricular leukoaraiosis. Int J Med Sci. 2013;10(10):1307–1313. [DOI] [PMC free article] [PubMed] [Google Scholar]
- [61].Fernández PJ, Campoy G, García Santos JM, et al. Is there a specific pattern of attention deficit in mild cognitive impairment with subcortical vascular features? Evidence from the attention network test. Dement Geriatr Cogn Disord. 2011;31(4):268–275. [DOI] [PubMed] [Google Scholar]
- [62].Gainotti G, Ferraccioli M, Vita MG, Marra C. Patterns of neuropsychological impairment in MCI patients with small subcortical infarcts or hippocampal atrophy. J Int Neuropsychol Soc. 2008;14(4):611–619. [DOI] [PubMed] [Google Scholar]
- [63].Garrett KD, Browndyke JN, Whelihan W, et al. The neuropsychological profile of vascular cognitive impairment - No dementia: Comparisons to patients at risk for cerebrovascular disease and vascular dementia. Arch Clin Neuropsychol. 2004;19(6):745–757. [DOI] [PubMed] [Google Scholar]
- [64].Gonçalves C, Pinho MS, Cruz V, et al. Portuguese version of Wechsler Memory Scale–3rd edition’s utility with demented elderly adults. Appl Neuropsychol. 2017;24(3):212–225. [DOI] [PubMed] [Google Scholar]
- [65].Graham NL, Emery THJ. Distinctive Cognitive Profiles in Alzheimer’s Disease and Subcortical Vascular Dementia. J Neurol Neurosurg Psychiatry. 2004;75:61–71. [PMC free article] [PubMed] [Google Scholar]
- [66].Hassan MA, Helmy SM, Rabah AM, Ameen AI, Helmy H. Assessment of patients with lacunar infarction: A magnetic resonance spectroscopic and psychometric study. Egypt J Neurol Psychiatry Neurosurg. 2010;47(1):1–10. [Google Scholar]
- [67].Hsu YH, Huang CF, Lo CP, Wang TL, Yang CC, Tu MC. Frontal Assessment Battery as a Useful Tool to Differentiate Mild Cognitive Impairment due to Subcortical Ischemic Vascular Disease from Alzheimer Disease. Dement Geriatr Cogn Disord. 2016;42(5–6):331–341. [DOI] [PubMed] [Google Scholar]
- [68].Ishii H, Meguro K, Yamaguchi S, Ishikawa H, Yamadori A. Prevalence and cognitive performances of vascular cognitive impairment no dementia in Japan: The Osaki-Tajiri Project. Eur J Neurol. 2007;14(6):609–616. [DOI] [PubMed] [Google Scholar]
- [69].Jokinen H, Kalska H, Ylikoski R, et al. MRI-defined subcortical ischemic vascular disease: Baseline clinical and neuropsychological findings. Cerebrovasc Dis. 2009;27(4):336–344. [DOI] [PubMed] [Google Scholar]
- [70].Kim HJ, Park S, Cho H, et al. Assessment of extent and role of tau in subcortical vascular cognitive impairment using 18F-AV1451 positron emission tomography imaging. JAMA Neurol. 2018;75(8):999–1007. [DOI] [PMC free article] [PubMed] [Google Scholar]
- [71].Kramer JH, Reed BR, Mungas D, Weiner MW, Chui HC. Executive dysfunction in subcortical ischaemic vascular disease. J Neurol Neurosurg Psychiatry. 2002;72(2):217–220. [DOI] [PMC free article] [PubMed] [Google Scholar]
- [72].Kuriyama N, Ozaki E, Mizuno T, et al. Association between α-Klotho and Deep White Matter Lesions in the Brain: A Pilot Case Control Study Using Brain MRI. J Alzheimer’s Dis. 2018;61(1):145–155. [DOI] [PubMed] [Google Scholar]
- [73].Ledesma-Amaya LI, Salvador-Cruz J, Rodríguez-Agudelo Y, Valencia-Flores M, Arauz A. Neuropsychological disorders associated with patients with lacunar infarct. Acta Colomb Psicol. 2014;17(2):43–52. [Google Scholar]
- [74].Lee MJ, Seo SW, Na DL, et al. Synergistic effects of ischemia and β-amyloid burden on cognitive decline in patients with subcortical vascular mild cognitive impairment. JAMA Psychiatry. 2014;71(4):412–422. [DOI] [PMC free article] [PubMed] [Google Scholar]
- [75].Lewine R, Hudgins P, Risch SC WE. Lowered attention capacity in young medically healthy men with megnetic resonance imaging brain hyperintensity signals. Neuropsychiatry, Neuropsychol Behav Neurosci. 1993;6(1):38–42. [Google Scholar]
- [76].Li M, Huang B, Li J, Li H. Neuropsychological Characteristics of patients with leukoaraiosis. Chinese J Clin Psychol. 2001;9(3):161–163. [Google Scholar]
- [77].Li C, Ling X, Liu S, et al. Abnormalities of magnetic resonance spectroscopy and diffusion tensor imaging are correlated with executive dysfunction in patients with ischemic leukoaraiosis. J Clin Neurosci. 2012;19(5):718–722. [DOI] [PubMed] [Google Scholar]
- [78].Li H, Zheng X, Yang S, et al. The changes of early cognitive function and cerebral hemodynamics in patients with lacunar cerebral infarction. Chinese J Cerebrovasc Dis. 2015;12(9):468–473. 35. [Google Scholar]
- [79].Li Q, Zhao L, Hu F. Characteristics of cognitive impairment and the resting state functional MRI in patients with leukoaraiosis. Chin Med J (Engl). 2017;97(45):3529–3533. [DOI] [PubMed] [Google Scholar]
- [80].Liu J, Xie R. Recovery of cognitive impairment and its influencing factors in patients after subcortical small vessel disease. China J Cerebrovasc Dis. 2008;5(8):341–345. [Google Scholar]
- [81].Liu W, Hu P, Zhang W, Li X, Wu X, Wang K. The episodic memory monitoring in pateints with white matter lesions. China J Neurol. 2015;48(4):302–306. [Google Scholar]
- [82].Liu X, Chen L, Cheng R, et al. Altered functional connectivity in patients with subcortical ischemic vascular disease: A resting-state fMRI study. Brain Res. 2019a;1715:126–133. [DOI] [PubMed] [Google Scholar]
- [83].Liu R, Wu W, Ye Q, et al. Distinctive and pervasive alterations of functional brain networks in cerebral small vessel disease with and without cognitive impairment. Dement Geriatr Cogn Disord. 2019b;47(1–2):55–67. [DOI] [PubMed] [Google Scholar]
- [84].Maeshima S, Moriwaki H, Ozaki F, Okita R, Yamaga H, Ueyoshi A. Silent cerebral infarction and cognitive function in middle-aged neurologically healthy subjects. Acta Neurol Scand. 2002;105(3):179–184. [DOI] [PubMed] [Google Scholar]
- [85].Nebes RD, Snitz BE, Cohen AD, et al. Cognitive aging in persons with minimal amyloid-β and white matter hyperintensities. Neuropsychologia. 2013;51(11):2202–2209. [DOI] [PMC free article] [PubMed] [Google Scholar]
- [86].Nordahl CW, Ranganatha C, Yonelinasa AP, DeCarli C, Reed BR, Jagust WJ. Different mechanisms of episodic memory failure in mild cognitive impairment. Neuropsychologia. 2005;43(11):1688–1697. [DOI] [PMC free article] [PubMed] [Google Scholar]
- [87].Nordlund A, Rolstad S, Klang O, Lind K, Hansen S, Wallin A. Cognitive Profiles of Mild Cognitive Impairment With and Without Vascular Disease. Neuropsychology. 2007;21(6):706–712. [DOI] [PubMed] [Google Scholar]
- [88].Oguro H, Okada K, Yamaguchi S, Kobayashi S. A six year follow-up study on the influence of silent ischemic brain lesions on cognitive function and brain atrophy in elderly people. Japanese J Geriatr. 2000;37(4):298–303. [DOI] [PubMed] [Google Scholar]
- [89].Pascual B, Prieto E, Arbizu J, Marti-Climent J, Olier J, Masdeu JC. Brain Glucose Metabolism in Vascular White Matter Disease With Dementia. Stroke. 2010;41(12):2889–2893. [DOI] [PubMed] [Google Scholar]
- [90].Pinkhardt EH, Issa H, Gorges M, et al. Do eye movement impairments in patients with small vessel cerebrovascular disease depend on lesion load or on cognitive deficits? A video-oculographic and MRI study. J Neurol. 2014;261(4):791–803. [DOI] [PubMed] [Google Scholar]
- [91].Price CC, Garrett KD, Jefferson AL, et al. Leukoaraiosis severity and list-learning in dementia. Clin Neuropsychol. 2009;23(6):944–961. [DOI] [PMC free article] [PubMed] [Google Scholar]
- [92].Quinque EM, Arélin K, Dukart J, et al. Identifying the neural correlates of executive functions in early cerebral microangiopathy: A combined VBM and DTI study. J Cereb Blood Flow Metab. 2012;32(10):1869–1878. [DOI] [PMC free article] [PubMed] [Google Scholar]
- [93].Rao SM, Mittenberg W, Bernardin L, Haughton V, Leo GJ. Neuropsychological Test Findings in Subjects With Leukoaraiosis. Arch Neurol. 1989;46(1):40–44. [DOI] [PubMed] [Google Scholar]
- [94].Schmidt R, Fazekas F, Offenbacher H, Dusek T, Zach E, Reinhart BGP et al. Neuropsychologic correlates of MRI white matter hyperintensities: a study of 150 normal volunteers. Neurology. 1993;43(12):2490–2494. [DOI] [PubMed] [Google Scholar]
- [95].Seo SW, Ahn J, Yoon U, et al. Cortical thinning in vascular mild cognitive impairment and vascular dementia of subcortical type. J Neuroimaging. 2010;20(1):37–45. [DOI] [PubMed] [Google Scholar]
- [96].Sierra C, De La Sierra A, Salamero M, Sobrino J, Gómez-Angelats E, Coca A. Silent cerebral white matter lesions and cognitive function in middle-aged essential hypertensive patients. Am J Hypertens. 2004;17(6):529–534. [DOI] [PubMed] [Google Scholar]
- [97].Squarzoni P, Tamashiro-Duran J, Duran F, et al. High frequency of silent brain infarcts associated with cognitive deficits in an economically disadvantaged population. Clinics. 2017;72(08):474–480. [DOI] [PMC free article] [PubMed] [Google Scholar]
- [98].Sudo FK, Alves CEO, Alves GS, et al. White matter hyperintensities, executive function and global cognitive performance in vascular mild cognitive impairment. Arq Neuropsiquiatr. 2013;71(7):431–436. [DOI] [PubMed] [Google Scholar]
- [99].Sun X, Liang Y, Wang J, et al. Early frontal structural and functional changes in mild white matter lesions relevant to cognitive decline. J Alzheimer’s Dis. 2014;40(1):123–134. [DOI] [PubMed] [Google Scholar]
- [100].Tupler LA, Logue PE, Fagan SM, Djang WT, Coffey CE. Neuropsychological Importance of Subcortical White Matter Hyperintensity. Arch Neurol. 1992;49(12):1248–1252. [DOI] [PubMed] [Google Scholar]
- [101].van Swieten JC, Geyskes GG, Derix MMA, et al. Hypertension in the elderly is associated with white matter lesions and cognitive decline. Ann Neurol. 1991;30(6):825–830. [DOI] [PubMed] [Google Scholar]
- [102].van Zandvoort MJE, de Haan E, van Gijn J, Kappelle LJ. Cognitive functioning in patients with a small infarct in the brainstem. J Int Neuropsychol Soc. 2003;9(3):490–494. [DOI] [PubMed] [Google Scholar]
- [103].van Zandvoort MJE, van der Grond J, Kappelle LJ, de Haan EHF. Cognitive deficits and changes in neurometabolites after a lacunar infarct. J Neurol. 2005;252(2):183–190. [DOI] [PubMed] [Google Scholar]
- [104].Villeneuve S, Massoud F, Bocti C, Gauthier S, Belleville S. The nature of episodic memory deficits in MCI with and without vascular burden. Neuropsychologia. 2011;49(11):3027–3035. [DOI] [PubMed] [Google Scholar]
- [105].Wolfe N, Linn R, Babikian VL, Knoefel JE, Albert ML. Frontal Systems Impairment Following Multiple Lacunar Infarcts. Arch Neurol. 1990;47:129–132. [DOI] [PubMed] [Google Scholar]
- [106].Wong A, Mok VCT, Tang WK, Lam WWM, Wong KS. Comparing Mattis dementia rating scale - Initiation / perseveration subset and frontal assessment battery in stroke associated with small vessel disease. J Clin Exp Neuropsychol. 2007;29(2):160–169. [DOI] [PubMed] [Google Scholar]
- [107].Yamauchi H, Fukuyama H, Shio H. Corpus callosum atrophy in patients with leukoaraiosis may indicate global cognitive impairment. Stroke. 2000;31(7):1515–1520. [DOI] [PubMed] [Google Scholar]
- [108].Yang J, Li C, Liu C, Yin X, Wang J. Resting-state functional MRI in memory deficit of patients with ischemic white matter lesions and mild cognitive impairment. Chin J Med Imaging Technol. 2015;32(4):512–516. [Google Scholar]
- [109].Yang M, Zhong W, Song Y, Liang X, Li G. Correlation study of middle cerebral artery pulsatity index and cognitive inpairment in lacunar infarction. Chin J Cerebrovasc Dis. 2016;13(12):634–635. [Google Scholar]
- [110].Yi L, Wang J, Jia L, et al. Structural and Functional Changes in Subcortical Vascular Mild Cognitive Impairment: A Combined Voxel-Based Morphometry and Resting-State fMRI Study. PLoS One. 2012;7(9):e44758. [DOI] [PMC free article] [PubMed] [Google Scholar]
- [111].Yu D, Hennebelle M, Sahlas DJ, et al. Soluble Epoxide Hydrolase-Derived Linoleic Acid Oxylipins in Serum Are Associated with Periventricular White Matter Hyperintensities and Vascular Cognitive Impairment. Transl Stroke Res. 2019;10(5):522–533. [DOI] [PubMed] [Google Scholar]
- [112].Yuan J-L, Wang S-K, Peng P, et al. Charateristics of cognitive impairment in patients with leukoaraiosis. Natl Med J China. 2012;92(3):147–151. [PubMed] [Google Scholar]
- [113].Yuan J-L, Wang S-K, Guo X-J, et al. Disconnections of cortico-subcortical pathways related to cognitive impairment in patients with leukoaraiosis: A preliminary diffusion tensor imaging study. Eur Neurol. 2017;78(1–2):41–47. [DOI] [PubMed] [Google Scholar]
- [114].Yuspeh RL, Vanderploeg RD, Crowell TA, Mullan M. Differences in Executive Functioning Between Alzheimer’s Disease and Subcortical Ischemic Vascular Dementia. J Clin Exp Neuropsychol. 2002;24(6):745–754. [DOI] [PubMed] [Google Scholar]
- [115].Zhang CE, Wong SM, Uiterwijk R, et al. Blood–brain barrier leakage in relation to white matter hyperintensity volume and cognition in small vessel disease and normal aging. Brain Imaging Behav. 2019a;13(2):389–395. [DOI] [PMC free article] [PubMed] [Google Scholar]
- [116].Zhang L, Sun WH, Xing M, et al. Medial Temporal Lobe Atrophy is Related to Learning Strategy Changes in Amnestic Mild Cognitive Impairment. J Int Neuropsychol Soc. 2019b;25(7):706–717. [DOI] [PubMed] [Google Scholar]
- [117].Zhao X-L, Liu Y, Deng Q, Li L. Clinical study on the value of combining neuropsychological tests with auditory event-related potential P300 for cognitive assessment in elderly patients with cerebral small vesseal disease. Chin J Contemp Neurol Neurosurg. 2016;16(11):768–773. [Google Scholar]
- [118].Zhou A, Jia J. Different cognitive profiles between mild cognitive impairment due to cerebral small vessel disease and mild cognitive impairment of Alzheimer’s disease origin. J Int Neuropsychol Soc. 2009;15(6):898–905. [DOI] [PubMed] [Google Scholar]
- [119].Zhou X, Wang L, Liu H, Sun Z. Relationship between serum bilirubin, uric acid and cognition impairment in patients with subcortical ischemic vascular disease. Chin J Neurol. 2014;47(5):305–310. [Google Scholar]
- [120].Zi W, Duan D, Zheng J. Cognitive impairments associated with periventricular white matter hyperintensities are mediated by cortical atrophy. Acta Neurol Scand. 2014;130(3):178–187. [DOI] [PubMed] [Google Scholar]
Associated Data
This section collects any data citations, data availability statements, or supplementary materials included in this article.