

This economic evaluation of patients with congenital agammaglobulinemia examines the cost-effectiveness of lifelong immunoglobulin replacement therapy vs hematopoietic stem cell transplant.
Key Points
Question
Is lifelong immunoglobulin replacement therapy (IRT) or hematopoietic stem cell transplant (HSCT) the more cost-effective strategy to treat congenital agammaglobulinemia in the US?
Findings
In this economic analysis of patients with congenital agammaglobulinemia, lifelong IRT was not cost-effective compared with HSCT but decreased premature deaths 37% compared with HSCT without a commensurate increase in quality of life. When the IRT annual price is decreased from $60 145 to less than $29 469, IRT appears to become the more cost-effective strategy.
Meaning
The findings of this study suggest that high IRT pricing undermines its cost utility; bringing US IRT costs closer in line with other high-income countries may render it more cost-effective than HSCT for agammaglobulinemia treatment.
Abstract
Importance
Lifelong immunoglobulin replacement therapy (IRT) is standard-of-care treatment for congenital agammaglobulinemia but accrues high annual costs ($30 000-$90 000 per year) and decrements to quality of life over patients’ life spans. Hematopoietic stem cell transplant (HSCT) offers an alternative 1-time therapy, but has high morbidity and mortality.
Objective
To evaluate the cost utility of IRT vs matched sibling donor (MSD) and matched unrelated donor (MUD) HSCT to treat patients with agammaglobulinemia in the US.
Design, Setting, and Participants
This economic evaluation used Markov analysis to model the base-case scenario of a patient aged 12 months with congenital agammaglobulinemia receiving lifelong IRT vs MSD or MUD HSCT. Costs, probabilities, and quality-of-life measures were derived from the literature. Microsimulations estimated premature deaths for each strategy in a virtual cohort. One-way sensitivity and probabilistic sensitivity analyses evaluated uncertainty around parameter estimates performed from a societal perspective over a 100-year time horizon. The threshold for cost-effective care was set at $100 000 per quality-adjusted life-year (QALY). This study was conducted from 2020 across a 100-year time horizon.
Exposures
Immunoglobulin replacement therapy vs MSD or MUD HSCT for treatment of congenital agammaglobulinemia
Main Outcomes and Measures
The primary outcomes were incremental cost-effectiveness ratio (ICER) expressed in 2020 US dollars per QALY gained and premature deaths associated with each strategy.
Results
In this economic evaluation of patients with congenital agammaglobulinemia, lifelong IRT cost more than HSCT ($1 512 946 compared with $563 776 [MSD] and $637 036 [MUD]) and generated similar QALYs (20.61 vs 17.25 [MSD] and 17.18 [MUD]). Choosing IRT over MSD or MUD HSCT yielded ICERs of $282 166 per QALY gained over MSD and $255 633 per QALY gained over MUD HSCT, exceeding the US willingness-to-pay threshold of $100 000/QALY. However, IRT prevented at least 2488 premature deaths per 10 000 microsimulations compared with HSCT. When annual IRT price was reduced from $60 145 to below $29 469, IRT became the cost-effective strategy. Findings remained robust in sensitivity and probabilistic sensitivity analyses.
Conclusions and Relevance
In the US, IRT is more expensive than HSCT for agammaglobulinemia treatment. The findings of this study suggest that IRT prevents more premature deaths but does not substantially increase quality of life relative to HSCT. Reducing US IRT cost by 51% to a value similar to IRT prices in countries implementing value-based pricing may render it the more cost-effective strategy.
Introduction
Congenital agammaglobulinemia comprises a group of primary antibody deficiencies that share early-stage B cell developmental arrest, absent peripheral B cells, and critically low serum immunoglobulin concentrations.1 X-linked agammaglobulinemia, caused by mutation of the sex-linked gene BTK, accounts for 85% of congenital agammaglobulinemia.2 The other 15% is associated with defects in genes essential to B-cell development, such as biallelic variations of IGHM, IGLL1, CD79A, CD79B, BLNK, and PI3KR1, and heterozygous mutations of LRRC8A, TCF3, and SPI1.1,3,4,5,6,7
Patients with congenital agammaglobulinemia typically become symptomatic by age 6 months—following the waning of maternal antibodies—with recurrent pyogenic infections.8,9,10 Sinopulmonary infections are common and can lead to chronic lung disease.11 Patients can also have gastrointestinal complications, such as gastroenteritis and chronic diarrhea.11 Despite immunoglobulin replacement therapy (IRT), patients with congenital agammaglobulinemia remain susceptible to systemic enteroviral infections including enteroviral meningoencephalitis.12
The mainstay treatment for agammaglobulinemia in high-income countries is lifelong IRT administered as monthly intravenous infusions (intravenous immunoglobulin [IVIG]) or weekly or biweekly subcutaneous infusions (subcutaneous immunoglobulin [SCIG]). Immunoglobulin replacement therapy reduces sinopulmonary infections but does not completely prevent chronic lung disease or systemic enteroviral infections. Hence, overall life spans are reduced compared with the general population.11,12,13 Moreover, lifelong IRT negatively affects quality of life. A study of children with primary antibody deficiencies treated with IRT reported increased emotional, social, and behavioral difficulties that decreased patient and parental quality-of-life ratings.14 Immunoglobulin replacement therapy also poses a societal financial burden. In the US, IRT costs $30 000 to $90 000 annually.4,15,16,17,18
Hematopoietic stem cell transplant (HSCT) offers a single strategy to treat a variety of primary immunodeficiency diseases. Case reports from resource-limited regions suggest HSCT with conditioning can be used to treat X-linked agammaglobulinemia.19,20,21,22 Although feasible, it is unclear how the high up-front cost and health risks of HSCT compare with the cumulative financial burdens and quality-of-life decrements associated with lifelong IRT. In this study, we compared the cost utility of IRT with HSCT for treatment of congenital agammaglobulinemia.
Methods
Markov Model
The study was conducted from the day of each simulated patient's diagnosis with congenital agammaglobulinemia across the lifetime of the patient. A Markov model constructed via TreeAge Pro 2020 (TreeAge Software LLC) was used to represent the base-case scenario of a child aged 12 months with congenital agammaglobulinemia in the US receiving (1) lifelong IRT, (2) matched sibling donor (MSD) HSCT, or (3) matched unrelated donor (MUD) HSCT (eFigure 1 in the Supplement). Patients undergoing lifelong IRT may discontinue IRT but then incur a higher probability of infection and infection-related complications.23,24,25,26 To reflect real-world data, patients receiving IRT continue to have an infection risk.25 Patients undergoing HSCT have an initial mortality risk. Those who survive have 1 of 3 outcomes: (1) unable to engraft donor T cells at which point the patient remains IRT dependent; (2) develop graft vs host disease, which can become chronic and result in IRT dependence; or (3) experience uncomplicated HSCT (eFigure 2 in the Supplement). After HSCT, 20.7% of patients are unable to produce endogenous antibodies and revert to the need for lifelong IRT.27,28 This model enabled comparison of costs and outcomes of lifelong IRT with HSCT using either the ideal (MSD) or most-likely (MUD) donor source. Cohort and microsimulation analyses were performed to measure the cost utility of each strategy as expressed in 2020 US dollars per quality-adjusted life-year (QALY) gained. The difference in the price per QALY gained, also known as the incremental cost-effectiveness ratio (ICER), was used to compare the interventions. A therapy was deemed cost-effective if the ICER decreased to beneath a society’s willingness-to-pay (WTP) cost per QALY threshold, determined by a country’s per capita gross domestic product. A WTP threshold of $100 000 per QALY gained was used as the cutoff for cost-effective interventions in the US.29,30 The model was analyzed from a societal perspective over a 100-year time horizon encompassing the lifetime costs and outcomes generated by each therapy.
All costs, utilities, and probabilities were derived from the literature (Table 1)11,18,23,24,25,26,27,28,31,32,33,34,35,36,37,38,39,40,41,42,43,44,45,46,47,48 and are detailed in the eMethods in the Supplement. All costs were adjusted for inflation and are reported in 2020 US dollars with future costs and QALYs discounted at 3% annually with adjustment from 0% to 7% in sensitivity analysis.49,50 The outcome of each strategy was measured in QALYs via health state utilities. A 1-year cycle length with a half-cycle correction was implemented in the analysis. This study was conducted from 2020 across a 100-year time horizon. Because all data were obtained from published literature, this study does not constitute human subjects research and does not require institutional review board review or exemption according to the US Department of Health and Human Services (45 CFR §46). This study followed the Consolidated Health Economic Evaluation Reporting Standards (CHEERS) reporting guideline for economic evaluation studies.
Table 1. Parameter Values Derived From the Literature and Used in the Markov Model.
| Parameter | Value | Range | Reference |
|---|---|---|---|
| Annual costs (2020 US dollars) | |||
| IRT | $60 145 | $15 000-$90 000 | Luthra et al,24 2014; Zhu et al,18 2019; Modell et al,31 2016 |
| Hospitalization for treatment of infection | $18 522 | $15 744-$93 242 | Menzin et al,32 2014 |
| Outpatient treatment of infection | $2643 | $1733-$11 444 | Menzin et al,32 2014 |
| MSD HSCT | $270 495 | $127 836-$1 246 854 | Ricci et al,33 2020 |
| MUD HSCT | $335 797 | $250 364-$1 312 812 | Ricci et al,33 2020 |
| GVHD | $151 552 | $117 652-$185 452 | Ricci et al,33 2020 |
| Chronic GVHD | $157 767 | $940-$502 378 | Yalniz et al,34 2018 |
| Probabilities | |||
| Annual probability of any infection in patients with agammaglobulinemia not receiving IRT | 40% | 8%-49% | Quartier et al,25 1999; Busse et al,26 2002 |
| Annual probability of any infection in patients with agammaglobulinemia receiving IRT | 8% | 0%-40% | Quartier et al,25 1999 |
| Hospitalization to treat infection in patients with agammaglobulinemia | 50% | 21.5%-89% | Menzin et al,32 2014 |
| Discontinue IRT | 7% | 0%-20% | Samaan et al,23 2014; Luthra et al,24 2014 |
| IRT dependence post-HSCT | 20.7% | 12.5%-50% | Neven et al,27 2009; Heimall et al,28 2017 |
| GVHD following MSD HSCT | 3% in First year; 0% thereafter | 0%-14% | Pai et al,35 2014 |
| GVHD following MUD HSCT | 6% in First year; 0% thereafter | 2%-13% | Pai et al,35 2014 |
| Probability of resolving GVHD in MSD HSCT | 94% | 82%-96% | Pai et al,35 2014 |
| Probability of resolving GVHD in MUD HSCT | 84% | 73%-92% | Pai et al,35 2014 |
| Discontinue GVHD medications | 3.1% | 0%-4.1% | Gresch et al,36 2017 |
| Annual probability of death due to GVHD | 2.5% | 1%-3% | Neven et al,27 2009 |
| Death during initial MSD HSCT hospitalization | 7% | 5.4%-12.8% | Takahashi et al,37 2019 |
| Death during initial MUD HSCT hospitalization | 7% | 5.4%-12.8% | Takahashi et al,37 2019 |
| Probability of death from infection in patients with agammaglobulinemia treated as outpatients | 0.1% | 0%-2.6% | Shillitoe and Gennery,38 2017; Labarere et al,39 2007 |
| Probability of death from infection in hospitalized patients with agammaglobulinemia | 0.18% | 0%-3.7% | Rubin et al,40 2018; Quartier et al,25 1999 |
| Annual probability of death in patients with agammaglobulinemia at baseline | 0.18% | 0%-1% | Lougaris et al,11 2020; Shillitoe and Gennery,38 2017 |
| Annual probability of death in patients with agammaglobulinemia not receiving IRT | 0.23% | 0.18%-1% | Lougaris et al,11 2020 |
| Annual probability of death in long-term HSCT survivors | 1.67% | 0%-2.47% | Bhatia et al,41 2007; Haddad et al,42 2018; Martin et al,43 2010 |
| T-cell engraftment failure following MSD HSCT | 9% | 1%-20% | Heimall et al,28 2017 |
| T-cell engraftment failure following MUD HSCT | 9% | 1%-20% | Heimall et al,28 2017 |
| Utilities, mortality, and discounting | |||
| Utility IRT | 0.77 | 0.7-0.84 | Windegger et al,44 2019 |
| Utility agammaglobulinemia without IRT | 0.44 | 0.42-0.7 | Windegger et al,44 2019; Tengs and Wallace,45 2000 |
| Utility HSCT | 0.47 in first year | 0.08-0.86 | Matza et al,46 2020 |
| 0.93 thereafter | 0.78-1 | ||
| Utility GVHD post-HSCT | 0.39 in first year | 0-0.78 | Matza et al,46 2020 |
| 0.51 (chronic) | 0.13-0.89 | ||
| US mortality table | Age-specific | NA | Arias and Xu,47 2018 |
| Discount rate (costs and utilities) | 3% | 0%-7% | Haacker et al,48 2020 |
Abbreviations: GVHD, graft vs host disease; HSCT, hematopoietic stem cell transplant; IRT, immunoglobulin replacement therapy; MSD, matched sibling donor; MUD, matched unrelated donor; NA, not applicable.
Statistical Analysis
Age-adjusted all-cause mortality was incorporated in the model using age-specific US mortality data.47 The model also represented the increased mortality reported in patients with agammaglobulinemia receiving long-term IRT post-HSCT. Total premature deaths resulting from each strategy were modeled in microsimulation analysis and compared using the χ2 test in RStudio, version 1.4.1106 (R Foundation for Statistical Analysis).
One-way sensitivity and probabilistic uncertainty analyses were performed across reasonable ranges based on the literature with wider variation of parameters with greater uncertainty as reported in Table 1 and outlined in the eMethods in the Supplement. In probabilistic sensitivity analysis (PSA), a triangular modal distribution bounded by the range around the base value, was used. Probabilistic sensitivity analysis was also performed using a β distribution for parameters bounded from 0 to 1 and a γ distribution for costs. The base value was used; the mean (SD) values were obtained from the literature when available or assumed to be 15% of the base value. The age at which patients were diagnosed was also varied in sensitivity analysis from 0.5 to 18 years. Parameters associated with wider ranges in cost utility were examined in more detail in 1-way and 2-way sensitivity analyses. Parameters associated with wider ranges in cost utility were examined in more detail.
Results
Cohort Analysis
To treat a virtual cohort of patients aged 12 months with congenital agammaglobulinemia, we selected the best base-case costs and outcome parameter values over a 100-year time horizon. The total medical cost associated with treating a patient with agammaglobulinemia with IRT was $1 512 946 (Table 2). The costs to treat the same patient were considerably less with MSD HSCT ($563 776) or MUD HSCT ($637 036). Quality-adjusted life-years were similar with lifelong IRT (20.61 QALYs), childhood MSD HSCT (17.25 QALYs), and childhood MUD HSCT (17.18 QALYs). The ICERs for choosing IRT were $282 166 per QALY gained over MSD HSCT and $255 633 per QALY gained over MUD HSCT—values considerably higher than the WTP threshold of $100 000 per QALY gained. Thus, in the US, lifelong IRT is not a cost-effective therapy for congenital agammaglobulinemia.
Table 2. Summary of Cohort Analysis Results Comparing the Cost Utility of IRT With HSCT.
| Strategy | Cost, $ | Incremental cost, $ | QALY | Incremental QALY | Cost-effectiveness ($/QALY) | ICER ($/QALY) |
|---|---|---|---|---|---|---|
| IRT | 1 512 946 | NA | 20.61 | NA | 73 408 | NA |
| MSD HSCT | 563 776 | 949 170 | 17.25 | 3.36 | 32 683 | 282 166 |
| MUD HSCT | 637 036 | 875 910 | 17.18 | 3.43 | 37 080 | 255 633 |
Abbreviations: HSCT, hematopoietic stem cell transplant; ICER, incremental cost-effectiveness ratio compared with IRT; IRT, immunoglobulin replacement therapy; MSD, matched sibling donor; MUD, matched unrelated donor; NA, not applicable; QALY, quality-adjusted life-year.
Sensitivity Analysis
Cohort analyses use single fixed-parameter values to estimate costs and outcomes of each therapeutic strategy. To account for parameter value uncertainty, we used PSA to generate 10 000 Markov iterations per treatment strategy. Each iteration simultaneously varied study parameter values across defined ranges. The mean (SD) IRT iterations cost $1 310 645 ($512 604) and generated 18.86 (6.19) QALYs (eFigure 3A in the Supplement). Treatment with MSD and MUD HSCT were overall less expensive (mean [SD] MSD: $923 640 [$308 004]; MUD: $1 020 414 [$298 895]) and rivaled IRT’s utility (MSD: 18.86 [6.19] QALYs; MUD: 17.23 [5.17] QALYs) (eFigure 3A in the Supplement). Immunoglobulin replacement therapy was cost-effective in few iterations (19.2%) when the WTP threshold was $100 000. Immunoglobulin replacement therapy became cost-effective in most (>50%) iterations only when the WTP threshold was artificially set at $297 500/QALY (Figure 1). This value is 4.6 times greater than the 2020 US per capita gross domestic product of $65 298 per year.51 In contrast, MSD and MUD HSCT iterations were most often cost-effective at lower WTP thresholds. Varying PSA parameter values with β and γ distributions, rather than triangular distributions, did not change the results (eTable in the Supplement).
Figure 1. Cost Utility Acceptability Curve.

Cost utility acceptability curve evaluating the percent of cost-effective iterations and various willingness-to-pay thresholds. Individual points at each willingness-to-pay threshold are connected to show trends. Vertical dashed lines indicate a standard US willingness-to-pay threshold of $100 000, and willingness-to-pay thresholds in which immunoglobulin replacement therapy becomes more cost-effective than matched unrelated donor (MUD) or matched sibling donor (MSD), respectively. K indicates thousands of dollars; QALY, quality-adjusted life-year.
To identify parameters associated with the widest ranges in cost utility, in 1-way sensitivity analyses, we varied parameters across predetermined ranges, one by one, to identify conditions that could make IRT the most cost-effective therapy. Resulting tornado plots revealed that only IRT annual cost and HSCT cost for both MSD HSCT (Figure 2) and MUD HSCT (eFigure 4 in the Supplement) could alter cost utility rankings. Decreasing the US IRT pricing from its current most likely cost of $60 145 per year to below $29 469 per year made it the dominant strategy and decreased the US IRT ICER below the WTP threshold of $100 000/QALY (Figure 3A). Notably, $29 469 per year is still above the reported annual IRT costs in high-income nations implementing value-based pricing. For instance, typical IRT costs in the UK, Canada, and Australia are estimated to be less than $20 000 per year.52,53,54 Thus, decreasing the IRT cost would immediately make lifelong IRT the dominant treatment strategy for congenital agammaglobulinemia in the US. In 2-way sensitivity analyses that vary HSCT and IRT costs in tandem, IRT is the dominant strategy when less than $22 500 per year regardless of HSCT costs. When IRT costs are greater than $84 000 per year, HSCT is always dominant (Figure 3B). Because the most likely price of IRT in the US is $60 145 per year, IRT is preferred when MSD HSCT costs more than $860 000 and MUD HSCT costs more than $830 000. The best estimates of HSCT cost are far below these values (MSD HSCT: $270 495 and MUD HSCT: $335 797).33
Figure 2. One-way Sensitivity Analyses of Immunoglobulin Replacement Therapy (IRT) Compared With Matched Sibling Donor (MSD) Hematopoietic Stem Cell Transplantation (HSCT).
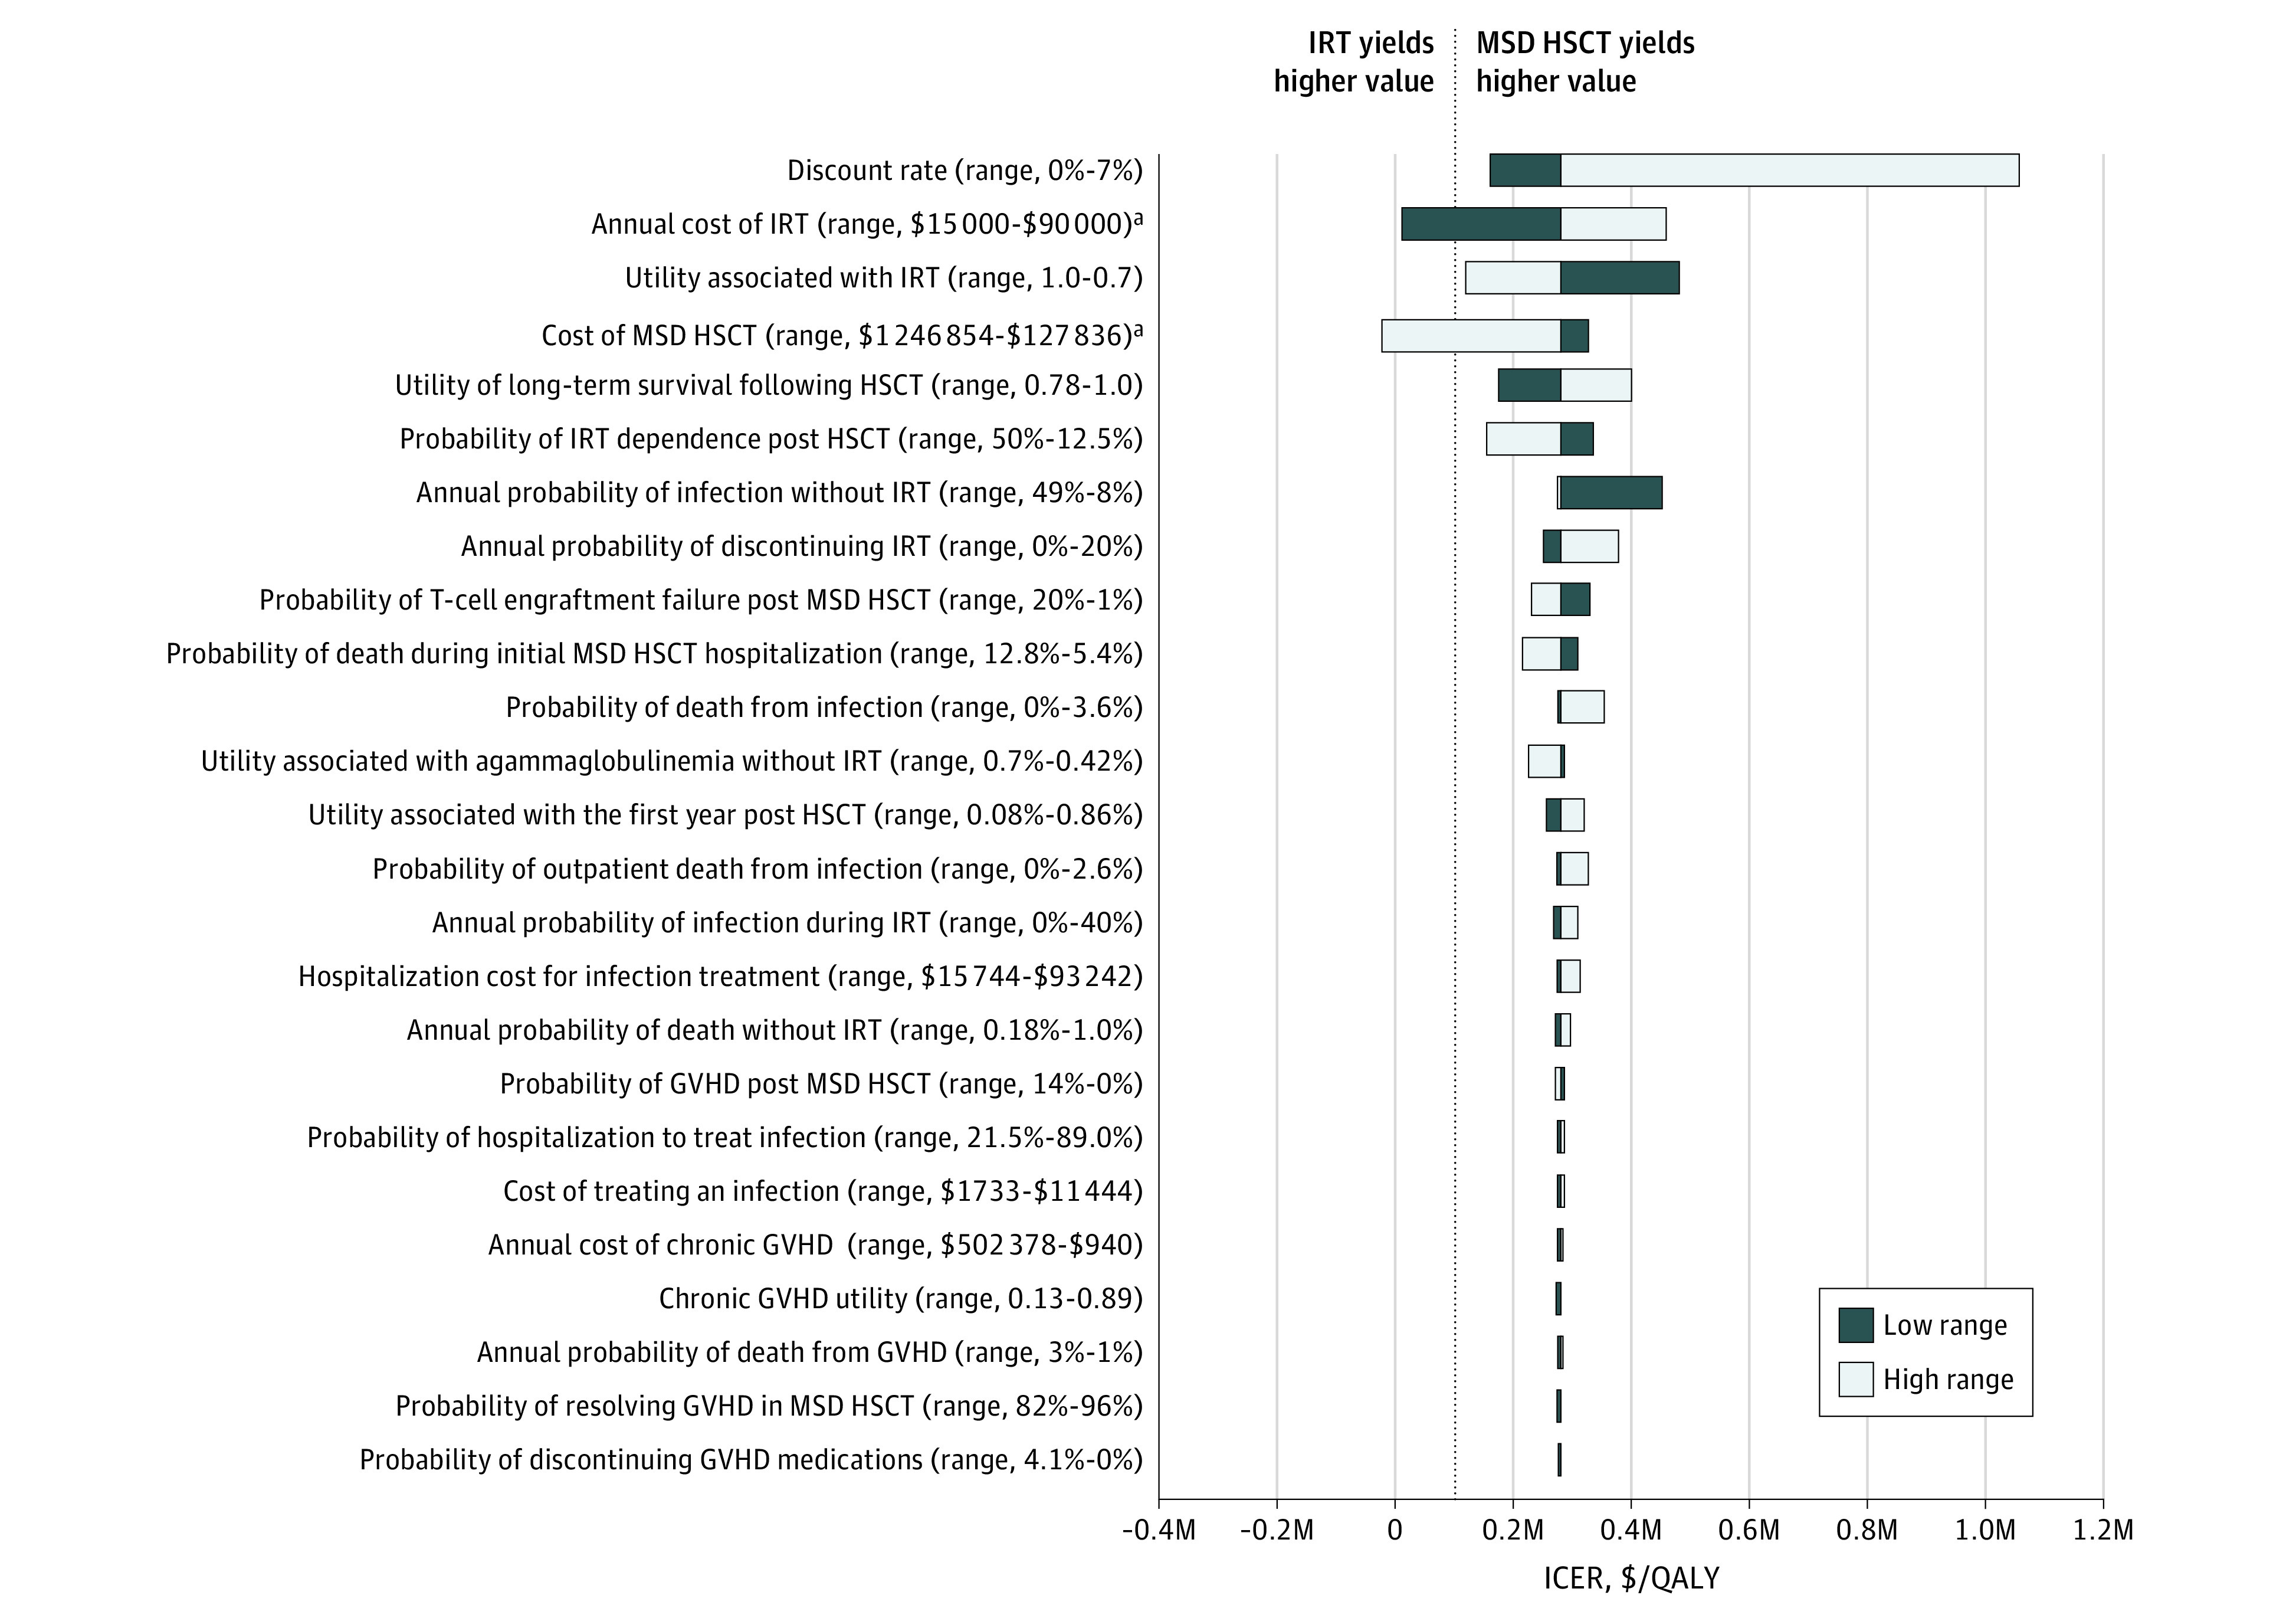
One-way sensitivity analyses evaluating the association between individual parameter values and the incremental cost-effectiveness ratio (ICER) of IRT compared with MSD HSCT. Incremental cost-effectiveness ratios are indicated for high (white bars) and low (black bars) parameter ranges. The ICER of the base-case scenario is marked by the black vertical line (expected value [EV] = $282 166 for IRT vs MSD HSCT). The black dashed line marks where the ICER of IRT vs MSD HSCT crosses the willingness-to-pay (WTP) threshold of $100 000 per quality-adjusted life-year (QALY). The parameters of annual probability of death in long-term HSCT survivors and annual probability of death in patients with agammaglobulinemia at baseline are not depicted because, across the predefined ranges, the incremental effectiveness was 0, leading the ICER to approach infinity. These parameters did not shift cost-effectiveness rankings. GVHD indicates graft vs host disease; and M, millions of dollars.
aParameters that shifted cost-utility rankings.
Figure 3. Sensitivity Analyses of Immunoglobulin Replacement Therapy (IRT) vs Hematopoietic Stem Cell Transplant (HSCT) Costs.
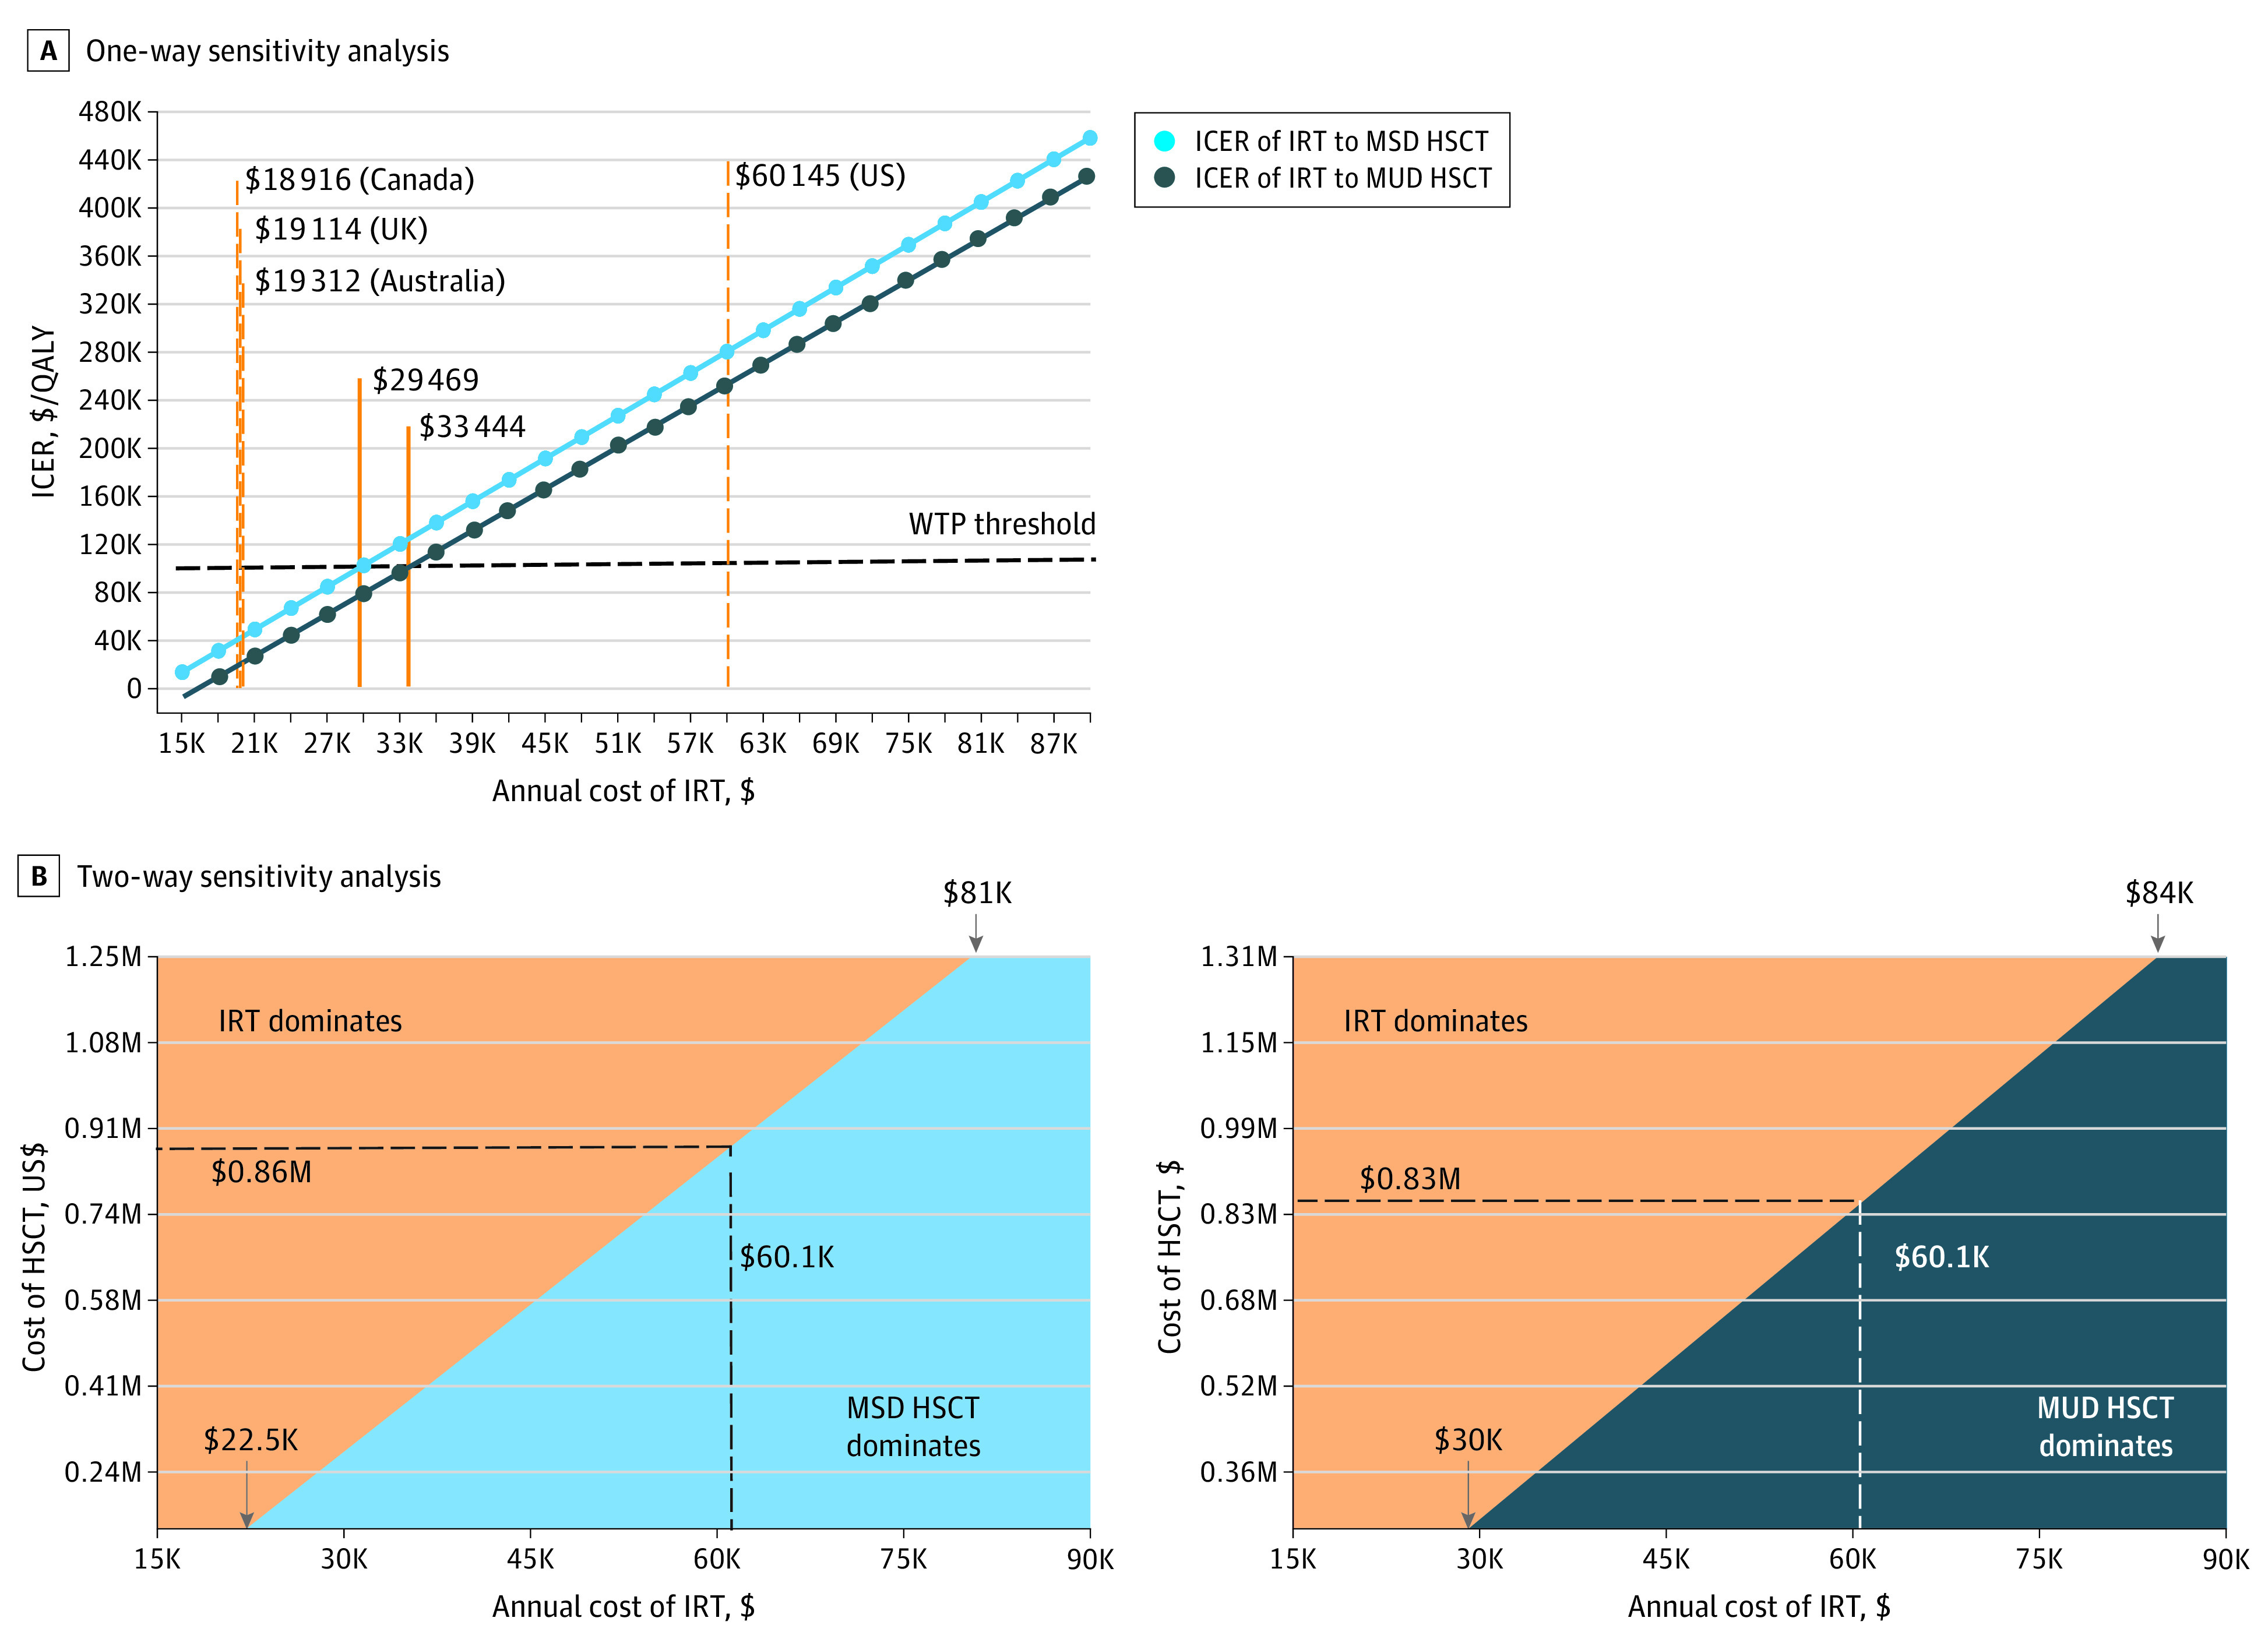
A, One-way sensitivity analysis of IRT annual cost vs the incremental cost-effectiveness ratio (ICER) of IRT compared with matched sibling donor (MSD) and matched unrelated donor (MUD) HSCT. The willingness-to-pay (WTP) threshold is $100 000. Gold vertical dashed lines indicate the IRT annual costs in the US compared with other countries. The solid gold lines indicate annual IRT cost at which the ICERs of IRT to MSD HSCT and MUD HSCT exceed the WTP threshold. B, Two-way sensitivity analyses show prices at which IRT is more cost-effective than MSD HSCT or MUD HSCT. The black dashed line depicts the current, most likely IRT annual cost and the corresponding minimum HSCT cost for IRT to be the more cost-effective therapy. Downward arrows at bottom left mark IRT prices at which IRT is always more cost-effective. Downward arrows at top right mark prices at which IRT is always dominated by MSD HSCT and MUD HSCT. K indicates thousands of dollars; M, millions of dollars; and QALY, quality-adjusted life-year.
Although changing the discount rate cannot make IRT the more cost-effective strategy, our results were clearly affected by discounting. Because HSCT-related events are frontloaded, we suspected discounting preferentially affects IRT costs and benefits that steadily accrue over life spans. To explore unequal effects, we compared the original PSA using standard 3% discounting (eFigure 3A in the Supplement) with an undiscounted PSA (eFigure 3B in the Supplement). Without discounting, mean (SD) costs increased preferentially for HSCT relative to IRT ($3 143 417 [$733 990] vs MSD: $1 319 677 [$376 905] or MUD: $1 420 394 [$368 303]); the QALYs generated also preferentially increased for IRT (41.4 [4.77] QALYs vs MSD: 35.15 [6.21] QALYs or MUD: 35.22 [6.23] QALYs). Despite gains, undiscounted ICERs between IRT and MSD ($291 798) or MUD ($278 806) HSCT remained well above the US WTP threshold of $100 000. Hence, with or without discounting, in the US, HSCT is currently a more cost-effective therapy for congenital agammaglobulinemia than IRT.
Microsimulation Analysis
Although cohort analysis and PSA are adept at estimating costs and outcomes across populations, clinicians and families are focused on single patients and care most about highly meaningful outcomes, such as premature deaths. We performed 10 000 microsimulations per therapy, with each representing a single virtual patient’s treatment course. For each microsimulation, parameter values were randomly selected across defined distributions and costs and outcomes were tracked. There were significantly fewer premature deaths in the 10 000 simulations undergoing IRT (mean [SD], 4165 [4930] deaths) compared with those undergoing MSD HSCT (6653 [4719] deaths) or MUD HSCT (6697 [4707] deaths) (P < .001 compared with IRT by χ2 test). Thus, IRT prevented at least 2488 premature deaths per 10 000 microsimulations compared with IRT. Consequently, the mean (SD) life span was 61.2 (26.5) years for patients receiving lifelong IRT, 47.0 (29.3) years for patients undergoing MSD HSCT, and 46.7 (29.5) years for those undergoing MUD HSCT. When evaluating the cost utility of agammaglobulinemia treatment strategies, IRT was more beneficial in 44.7% but was more expensive in 62.5% of the iterations (eFigure 5 in the Supplement). In 31.6% of the iterations, IRT was dominated by HSCT (cost more and less beneficial). In total, these results suggest that IRT can prolong the lives of patients with congenital agammaglobulinemia, but in the US, the expense of each added year is considerable. In contrast, HSCT offers patients higher potential utility states than IRT (0.93 vs 0.77) (Table 1) but shorter life spans.
Discussion
Advanced diagnostic testing and the wide availability of IRT have substantially reduced infection-related morbidity and mortality for patients with agammaglobulinemia.10 Concurrently, transplant outcomes for primary immunodeficiency diseases continue to improve and offer the possibility of durable immune reconstitution from a 1-time treatment.55 To our knowledge, this study is the first to compare the cost utility of IRT and HSCT as long-term treatments for congenital agammaglobulinemia. In our hypothetical model, IRT generated QALYs similar to HSCT, but these gains were associated with higher costs. Our findings were supported using PSA and microsimulation analysis. HSCT—regardless of donor source—also results in approximately 1.6 times as many premature deaths as IRT but is associated with higher long-term utilities. Even accounting for increased mortality, HSCT generates similar QALYs and its comparative thrift makes it more cost-effective in the US. For patient families who prioritize utility over life span, HSCT should be considered as a treatment for congenital agammaglobulinemia and may be an especially attractive option for younger patients with an available MSD.
The cost utility of HSCT appears to be most affected by 2 parameters: annual IRT cost and HSCT cost. At first glance, HSCT cost seems dwarfed by a crude calculation of a lifetime of IRT ($60 145 × approximately 60 years’ estimated life span = $3.6 million). Closer inspection reveals that discounting preferentially lowers IRT costs and benefits because most charges and positive health outcomes accrue decades in the future. Discounting is used in cost-effectiveness analyses to reflect humans’ positive time preference. Specifically, we want health gains to be immediate and expenses to be delayed.56 Hematopoietic stem cell transplant is more attuned than IRT to our innate inclination toward potentially definitive therapies. In our sensitivity analyses, we set the discount rates for costs and QALYs to 0% to investigate time preference outcomes. Without discounting, IRT costs and QALYs were far greater but the ICER remained well above the WTP of $100 000 (eFigure 3B in the Supplement). Working against discounting pressures is the accelerating cost of IRT in the US. The maximum Medicare reimbursements for IRT increased 25.3% from 2010 to 2020 compared with the inflation rate of 18.7%.56,57 Because these costs may not and need not continue to increase as fast in the future, we chose to tether annual IRT cost increases with inflation.
Regarding factors associated with high IRT cost in the US, multiple studies have compared hospital-based IVIG infusions with home-based SCIG infusions and found the latter to be associated with significant cost savings.58,59,60,61 The calculated cost of immunoglobulin administration used in our model was based on the proportions and costs of home-based IVIG, outpatient hospital-based IVIG, and SCIG.24 Nevertheless, switching treatment in all patients to home-based care only decreases the annual expense from $60 145 to $47 159. This value is still well above the $29 469 annual cost needed to make IRT a cost-effective intervention based on a WTP threshold of $100 000/QALY. It is the purchase of immunoglobulin products, not administration charges or infusion setting, that is the major factor involved in the IRT price in the US.62,63,64 Although SCIG and IVIG therapies were cost comparable in the past, SCIG product price has recently increased substantially. In 2018, SCIG products were 1.2 to 1.6 times higher per gram than IVIG and were recommended by manufacturers to be given at 1.3 to 1.4 times higher doses.64 Furthermore, efforts to improve IRT utility have primarily involved increasing dosing and/or changing to subcutaneous infusions.65,66 Hence, any utility improvements achieved through these means will be offset by increased costs associated with consuming more and/or higher-priced infusion products. Thus, given current market conditions, adjusting formulation or changing infusion route cannot achieve meaningful price reduction. A different approach to make IRT more cost-effective in the US would be adoption of regulatory frameworks that set IRT costs based on cost-utility thresholds. Value-based pricing of medications is used in the UK, Australia, Canada, and Sweden before the initial launch of a drug.67,68 By estimating the value (cost per QALY) of an intervention, prices can be set fairly and within the cost-utility threshold. This practice is reflected in the much lower IRT costs in these countries, which span from $18 000 to $19 500.52,53,54
Strengths and Limitations
There are several limitations to our study. Our simulation was based on a simplified model of a complex disease and assumes treatments will yield a finite number of outcomes. Although all health care costs were included, additional societal costs, such as time lost from work due to illness and transportation costs, were not modeled in our analysis. Probabilities were assumed to be constant across patient lifetimes and individual clinical comorbidities could not be modeled. Despite extensive literature review and broad sensitivity analyses, we could not account for the full array of therapy-associated benefits or long-term complications. For example, because IRT only replaces immunoglobulin G, patients remain at increased risk for infections mitigated by the presence of immunoglobulin A, including upper respiratory and gastrointestinal infections.38 Patients receiving IRT can also still develop chronic lung disease, which substantially affects long-term outcomes.9,13 Conversely, long-term complications of HSCT, such as infertility, that affect quality of life, were not modeled individually, but were instead bundled into post-HSCT reduced health state utilities. Another HSCT complication is long-term IRT dependence after transplantation. Because these patients incur all the risks and costs of both treatment strategies, we were initially concerned that uncertainty in this parameter could unduly affect cost-utility rankings. Ultimately, widely varying IRT dependence—from 0% to as high as 50%—did not alter HSCT’s relative cost utility. Another limitation is that our mortality estimate for post-HSCT long-term survivors was based on patients undergoing HSCT before 2010, because more recent data were unavailable. With HSCT outcomes subsequently improved, it is possible our study underestimates current HSCT benefits. In addition, our model assumes universal access to IRT. In reality, IRT access barriers are reported by 16% of international centers treating X-linked agammaglobulinemia.4 For 10% to 20% of surveyed US patients with X-linked agammaglobulinemia, excessive costs have prevented medical evaluation and/or therapies, including IRT.10 Although we did not directly model IRT access, we accounted for IRT discontinuation, estimated to be 7%, and varying this from a range of 0% to 20% (encompassing patients who potentially stopped IRT owing to poor access) in 1-way sensitivity analysis did not alter our findings.23,24
Conclusions
To our knowledge, this study is the first to evaluate the cost utility of HSCT for treatment of congenital agammaglobulinemia. Our model suggests that IRT yields significantly lower mortality and similar utilities to HSCT. Yet, the high cost of IRT products in the US undermines its cost utility, especially compared with countries implementing value-based pricing. We believe that IRT should remain available to treat patients with agammaglobulinemia in the US but regulatory efforts should focus on reducing its price. Currently, IRT is an especially good option for older patients and those without suitable donor sources. In the future, gene-based, autologous therapies for agammaglobulinemia may permanently restore normal B-cell development and endogenous antibody production without incurring comorbidities associated with allogenic transplant. Although these procedures would likely be expensive, the current high price of lifelong IRT provides considerable market space for innovation. Until additional treatment options become available, our findings suggest that reducing IRT cost in the US is an immediately actionable intervention that would make IRT the more cost-effective strategy compared with HSCT.
eMethods. Detailed Methods
eReferences
eTable. Summary of PSA Results Using β and γ Distributions Comparing the Cost-utility of IRT With HSCT
eFigure 1. Markov Model
eFigure 2. Markov State Transition Diagram
eFigure 3. Probabilistic Sensitivity Analysis
eFigure 4. Tornado Diagram Depicting One-way Sensitivity Analyses of IRT Compared to MUD HSCT
eFigure 5. Cost-utility Plane of Microsimulation Analysis
References
- 1.Durandy A, Kracker S, Fischer A. Primary antibody deficiencies. Nat Rev Immunol. 2013;13(7):519-533. doi: 10.1038/nri3466 [DOI] [PubMed] [Google Scholar]
- 2.Vetrie D, Vorechovský I, Sideras P, et al. The gene involved in X-linked agammaglobulinaemia is a member of the SRC family of protein-tyrosine kinases. Nature. 1993;361(6409):226-233. doi: 10.1038/361226a0 [DOI] [PubMed] [Google Scholar]
- 3.Sullivan KE, Stiehm ER. Stiehm’s Immune Deficiencies Inborn Errors of Immunity. 2nd ed. Academic Press; 2020. [Google Scholar]
- 4.El-Sayed ZA, Abramova I, Aldave JC, et al. X-Linked agammaglobulinemia (XLA): phenotype, diagnosis, and therapeutic challenges around the world. World Allergy Organ J. 2019;12(3):100018. doi: 10.1016/j.waojou.2019.100018 [DOI] [PMC free article] [PubMed] [Google Scholar]
- 5.Sawada A, Takihara Y, Kim JY, et al. A congenital mutation of the novel gene LRRC8 causes agammaglobulinemia in humans. J Clin Invest. 2003;112(11):1707-1713. doi: 10.1172/JCI18937 [DOI] [PMC free article] [PubMed] [Google Scholar]
- 6.Boisson B, Wang Y-D, Bosompem A, et al. A recurrent dominant negative E47 mutation causes agammaglobulinemia and BCR− B cells. J Clin Invest. 2013;123(11):4781-4785. doi: 10.1172/JCI71927 [DOI] [PMC free article] [PubMed] [Google Scholar]
- 7.Le Coz C, Nguyen DN, Su C, et al. Constrained chromatin accessibility in PU.1-mutated agammaglobulinemia patients. J Exp Med. 2021;218(7):e20201750. doi: 10.1084/jem.20201750 [DOI] [PMC free article] [PubMed] [Google Scholar]
- 8.Conley ME, Howard V. Clinical findings leading to the diagnosis of X-linked agammaglobulinemia. J Pediatr. 2002;141(4):566-571. doi: 10.1067/mpd.2002.127711 [DOI] [PubMed] [Google Scholar]
- 9.Fekrvand S, Yazdani R, Olbrich P, et al. Evaluation of respiratory complications in patients with X-linked and autosomal recessive agammaglobulinemia. Pediatr Allergy Immunol. 2020;31(4):405-417. doi: 10.1111/pai.13228 [DOI] [PubMed] [Google Scholar]
- 10.Winkelstein JA, Marino MC, Lederman HM, et al. X-Linked agammaglobulinemia: report on a United States registry of 201 patients. Medicine (Baltimore). 2006;85(4):193-202. doi: 10.1097/01.md.0000229482.27398.ad [DOI] [PubMed] [Google Scholar]
- 11.Lougaris V, Soresina A, Baronio M, et al. Long-term follow-up of 168 patients with X-linked agammaglobulinemia reveals increased morbidity and mortality. J Allergy Clin Immunol. 2020;146(2):429-437. doi: 10.1016/j.jaci.2020.03.001 [DOI] [PubMed] [Google Scholar]
- 12.Bearden D, Collett M, Quan PL, Costa-Carvalho BT, Sullivan KE. Enteroviruses in X-linked agammaglobulinemia: update on epidemiology and therapy. J Allergy Clin Immunol Pract. 2016;4(6):1059-1065. doi: 10.1016/j.jaip.2015.12.015 [DOI] [PubMed] [Google Scholar]
- 13.Quinti I, Soresina A, Guerra A, et al. ; IPINet Investigators . Effectiveness of immunoglobulin replacement therapy on clinical outcome in patients with primary antibody deficiencies: results from a multicenter prospective cohort study. J Clin Immunol. 2011;31(3):315-322. doi: 10.1007/s10875-011-9511-0 [DOI] [PubMed] [Google Scholar]
- 14.Titman P, Allwood Z, Gilmour C, et al. Quality of life in children with primary antibody deficiency. J Clin Immunol. 2014;34(7):844-852. doi: 10.1007/s10875-014-0072-x [DOI] [PMC free article] [PubMed] [Google Scholar]
- 15.Vaughan LJ. Managing cost of care and healthcare utilization in patients using immunoglobulin agents. Am J Manag Care. 2019;25(6)(suppl):S105-S111. [PubMed] [Google Scholar]
- 16.Jindal AK, Pilania RK, Rawat A, Singh S. Primary immunodeficiency disorders in India—a situational review. Front Immunol. 2017;8:714. doi: 10.3389/fimmu.2017.00714 [DOI] [PMC free article] [PubMed] [Google Scholar]
- 17.Vellaichamy Swaminathan V, Uppuluri R, Patel S, et al. Treosulfan-based reduced toxicity hematopoietic stem cell transplantation in X-linked agammaglobulinemia: a cost-effective alternative to long-term immunoglobulin replacement in developing countries. Pediatr Transplant. 2020;24(1):e13625. doi: 10.1111/petr.13625 [DOI] [PubMed] [Google Scholar]
- 18.Zhu J, Ayer G, Kirkham HS, et al. Outcome evaluation of a subcutaneous immunoglobulin clinical management program. J Res Pharm Pract. 2019;8(2):52-63. doi: 10.4103/jrpp.JRPP_18_36 [DOI] [PMC free article] [PubMed] [Google Scholar]
- 19.Ikegame K, Imai K, Yamashita M, et al. Allogeneic stem cell transplantation for X-linked agammaglobulinemia using reduced intensity conditioning as a model of the reconstitution of humoral immunity. J Hematol Oncol. 2016;9:9. doi: 10.1186/s13045-016-0240-y [DOI] [PMC free article] [PubMed] [Google Scholar]
- 20.Abu-Arja RF, Chernin LR, Abusin G, et al. Successful hematopoietic cell transplantation in a patient with X-linked agammaglobulinemia and acute myeloid leukemia. Pediatr Blood Cancer. 2015;62(9):1674-1676. doi: 10.1002/pbc.25554 [DOI] [PMC free article] [PubMed] [Google Scholar]
- 21.van Zelm MC, Pumar M, Shuttleworth P, et al. Functional antibody responses following allogeneic stem cell transplantation for TP53 mutant pre-B-ALL in a patient with X-linked agammaglobulinemia. Front Immunol. 2019;10:895. doi: 10.3389/fimmu.2019.00895 [DOI] [PMC free article] [PubMed] [Google Scholar]
- 22.Howard V, Myers LA, Williams DA, et al. Stem cell transplants for patients with X-linked agammaglobulinemia. Clin Immunol. 2003;107(2):98-102. doi: 10.1016/S1521-6616(03)00045-7 [DOI] [PubMed] [Google Scholar]
- 23.Samaan K, Levasseur MC, Decaluwe H, et al. SCIg vs. IVIg: let’s give patients the choice! J Clin Immunol. 2014;34(6):611-614. doi: 10.1007/s10875-014-0057-9 [DOI] [PubMed] [Google Scholar]
- 24.Luthra R, Quimbo R, Iyer R, Luo M. An analysis of intravenous immunoglobin site of care: home versus outpatient hospital. Am J Pharm Benefits. 2014;6:e41-e49. [Google Scholar]
- 25.Quartier P, Debré M, De Blic J, et al. Early and prolonged intravenous immunoglobulin replacement therapy in childhood agammaglobulinemia: a retrospective survey of 31 patients. J Pediatr. 1999;134(5):589-596. doi: 10.1016/S0022-3476(99)70246-5 [DOI] [PubMed] [Google Scholar]
- 26.Busse PJ, Razvi S, Cunningham-Rundles C. Efficacy of intravenous immunoglobulin in the prevention of pneumonia in patients with common variable immunodeficiency. J Allergy Clin Immunol. 2002;109(6):1001-1004. doi: 10.1067/mai.2002.124999 [DOI] [PubMed] [Google Scholar]
- 27.Neven B, Leroy S, Decaluwe H, et al. Long-term outcome after hematopoietic stem cell transplantation of a single-center cohort of 90 patients with severe combined immunodeficiency. Blood. 2009;113(17):4114-4124. doi: 10.1182/blood-2008-09-177923 [DOI] [PubMed] [Google Scholar]
- 28.Heimall J, Logan BR, Cowan MJ, et al. Immune reconstitution and survival of 100 SCID patients post-hematopoietic cell transplant: a PIDTC natural history study. Blood. 2017;130(25):2718-2727. doi: 10.1182/blood-2017-05-781849 [DOI] [PMC free article] [PubMed] [Google Scholar]
- 29.Neumann PJ, Cohen JT, Weinstein MC. Updating cost-effectiveness—the curious resilience of the $50,000-per-QALY threshold. N Engl J Med. 2014;371(9):796-797. doi: 10.1056/NEJMp1405158 [DOI] [PubMed] [Google Scholar]
- 30.WHO . Cost–effectiveness thresholds: pros and cons. WHO. doi: 10.2471/BLT.15.164418 [DOI] [PMC free article] [PubMed]
- 31.Modell V, Quinn J, Orange J, Notarangelo LD, Modell F. Primary immunodeficiencies worldwide: an updated overview from the Jeffrey Modell Centers Global Network. Immunol Res. 2016;64(3):736-753. doi: 10.1007/s12026-016-8784-z [DOI] [PubMed] [Google Scholar]
- 32.Menzin J, Sussman M, Munsell M, Zbrozek A. Economic impact of infections among patients with primary immunodeficiency disease receiving IVIG therapy. Clinicoecon Outcomes Res. 2014;6:297-302. doi: 10.2147/CEOR.S63200 [DOI] [PMC free article] [PubMed] [Google Scholar]
- 33.Ricci A, Jin Z, Broglie L, et al. Healthcare utilization and financial impact of acute-graft-versus host disease among children undergoing allogeneic hematopoietic cell transplantation. Bone Marrow Transplant. 2020;55(2):384-392. doi: 10.1038/s41409-019-0688-9 [DOI] [PubMed] [Google Scholar]
- 34.Yalniz FF, Murad MH, Lee SJ, et al. Steroid refractory chronic graft-versus-host disease: cost-effectiveness analysis. Biol Blood Marrow Transplant. 2018;24(9):1920-1927. doi: 10.1016/j.bbmt.2018.03.008 [DOI] [PMC free article] [PubMed] [Google Scholar]
- 35.Pai S-Y, Logan BR, Griffith LM, et al. Transplantation outcomes for severe combined immunodeficiency, 2000-2009. N Engl J Med. 2014;371(5):434-446. doi: 10.1056/NEJMoa1401177 [DOI] [PMC free article] [PubMed] [Google Scholar]
- 36.Gresch B, Kirsch M, Fierz K, et al. Medication nonadherence to immunosuppressants after adult allogeneic haematopoietic stem cell transplantation: a multicentre cross-sectional study. Bone Marrow Transplant. 2017;52(2):304-306. doi: 10.1038/bmt.2016.262 [DOI] [PubMed] [Google Scholar]
- 37.Takahashi T, Pereda MA, Bala N, Nagarajan S. In-hospital mortality of hematopoietic stem cell transplantation among children with nonmalignancies: a nationwide study in the United States from 2000 to 2012. Pediatr Blood Cancer. 2019;66(6):e27626. doi: 10.1002/pbc.27626 [DOI] [PubMed] [Google Scholar]
- 38.Shillitoe B, Gennery A. X-Linked Agammaglobulinaemia: outcomes in the modern era. Clin Immunol. 2017;183:54-62. doi: 10.1016/j.clim.2017.07.008 [DOI] [PubMed] [Google Scholar]
- 39.Labarere J, Stone RA, Obrosky DS, et al. Comparison of outcomes for low-risk outpatients and inpatients with pneumonia: a propensity-adjusted analysis. Chest. 2007;131(2):480-488. doi: 10.1378/chest.06-1393 [DOI] [PubMed] [Google Scholar]
- 40.Rubin Z, Pappalardo A, Schwartz A, Antoon JW. Prevalence and outcomes of primary immunodeficiency in hospitalized children in the United States. J Allergy Clin Immunol Pract. 2018;6(5):1705-1710.e1. doi: 10.1016/j.jaip.2017.12.002 [DOI] [PubMed] [Google Scholar]
- 41.Bhatia S, Francisco L, Carter A, et al. Late mortality after allogeneic hematopoietic cell transplantation and functional status of long-term survivors: report from the Bone Marrow Transplant Survivor Study. Blood. 2007;110(10):3784-3792. doi: 10.1182/blood-2007-03-082933 [DOI] [PMC free article] [PubMed] [Google Scholar]
- 42.Haddad E, Logan BR, Griffith LM, et al. SCID genotype and 6-month posttransplant CD4 count predict survival and immune recovery. Blood. 2018;132(17):1737-1749. doi: 10.1182/blood-2018-03-840702 [DOI] [PMC free article] [PubMed] [Google Scholar]
- 43.Martin PJ, Counts GW Jr, Appelbaum FR, et al. Life expectancy in patients surviving more than 5 years after hematopoietic cell transplantation. J Clin Oncol. 2010;28(6):1011-1016. doi: 10.1200/JCO.2009.25.6693 [DOI] [PMC free article] [PubMed] [Google Scholar]
- 44.Windegger TM, Nghiem S, Nguyen KH, Fung YL, Scuffham PA. Cost-utility analysis comparing hospital-based intravenous immunoglobulin with home-based subcutaneous immunoglobulin in patients with secondary immunodeficiency. Vox Sang. 2019;114(3):237-246. doi: 10.1111/vox.12760 [DOI] [PubMed] [Google Scholar]
- 45.Tengs TO, Wallace A. One thousand health-related quality-of-life estimates. Med Care. 2000;38(6):583-637. doi: 10.1097/00005650-200006000-00004 [DOI] [PubMed] [Google Scholar]
- 46.Matza LS, Paramore LC, Stewart KD, Karn H, Jobanputra M, Dietz AC. Health state utilities associated with treatment for transfusion-dependent β-thalassemia. Eur J Health Econ. 2020;21(3):397-407. doi: 10.1007/s10198-019-01136-0 [DOI] [PMC free article] [PubMed] [Google Scholar]
- 47.Arias E, Xu J. United States life tables, 2015. Natl Vital Stat Rep. 2018;67(7):1-64. [PubMed] [Google Scholar]
- 48.Haacker M, Hallett TB, Atun R. On discount rates for economic evaluations in global health. Health Policy Plan. 2020;35(1):107-114. [DOI] [PubMed] [Google Scholar]
- 49.Salomon JA, Vos T, Hogan DR, et al. Common values in assessing health outcomes from disease and injury: disability weights measurement study for the Global Burden of Disease Study 2010. Lancet. 2012;380(9859):2129-2143. doi: 10.1016/S0140-6736(12)61680-8 [DOI] [PMC free article] [PubMed] [Google Scholar]
- 50.US Bureau of Labor Statistics. inflation calculator CPI. Accessed January 3, 2021. https://www.bls.gov/data/inflation_calculator.htm
- 52.The World Bank. GDP per capita (current US$). Accessed April 15, 2016. https://data.worldbank.org/indicator/NY.GDP.PCAP.CD
- 53.Shillitoe B, Hollingsworth R, Foster M, et al. Immunoglobulin use in immune deficiency in the UK: a report of the UKPID and National Immunoglobulin databases. Clin Med (Lond). 2018;18(5):364-370. doi: 10.7861/clinmedicine.18-5-364 [DOI] [PMC free article] [PubMed] [Google Scholar]
- 54.Windegger TM, Nghiem S, Nguyen K-H, Fung YL, Scuffham PA. Primary immunodeficiency disease: a cost-utility analysis comparing intravenous vs subcutaneous immunoglobulin replacement therapy in Australia. Blood Transfus. 2019;1-10. doi: 10.2450/2019.0083-19 [DOI] [PMC free article] [PubMed] [Google Scholar]
- 55.Membe SK, Ho C, Cimon K, Morrison A, Kanani A, Roifman CM. Economic assessment of different modalities of immunoglobulin replacement therapy. Immunol Allergy Clin North Am. 2008;28(4):861-874, x. doi: 10.1016/j.iac.2008.06.008 [DOI] [PubMed] [Google Scholar]
- 56.Thakar MS, Logan B, Buckley RH, et al. Transplantation outcomes for children with severe combined immune deficiency (SCID) have improved over time: a 36-year summary report by the Primary Immune Deficiency Treatment Consortium (PIDTC). Biol Blood Marrow Transplant. 2020;26(3, suppl):S18-S19. doi: 10.1016/j.bbmt.2019.12.083 [DOI] [Google Scholar]
- 57.O’Mahony JF, Newall AT, van Rosmalen J. Dealing with time in health economic evaluation: methodological issues and recommendations for practice. Pharmacoeconomics. 2015;33(12):1255-1268. doi: 10.1007/s40273-015-0309-4 [DOI] [PMC free article] [PubMed] [Google Scholar]
- 58.Centers for Medicare & Medicaid Services. ASP drug pricing files. December 9, 2015. Accessed July 5, 2021. https://www.cms.gov/Medicare/Medicare-Fee-for-Service-Part-B-Drugs/McrPartBDrugAvgSalesPrice/2015ASPFiles
- 59.Ducruet T, Levasseur MC, Des Roches A, Kafal A, Dicaire R, Haddad E. Pharmacoeconomic advantages of subcutaneous versus intravenous immunoglobulin treatment in a Canadian pediatric center. J Allergy Clin Immunol. 2013;131(2):585-7.e1, 3. doi: 10.1016/j.jaci.2012.08.022 [DOI] [PubMed] [Google Scholar]
- 60.Perraudin C, Bourdin A, Spertini F, Berger J, Bugnon O. Switching patients to home-based subcutaneous immunoglobulin: an economic evaluation of an interprofessional drug therapy management program. J Clin Immunol. 2016;36(5):502-510. doi: 10.1007/s10875-016-0288-z [DOI] [PubMed] [Google Scholar]
- 61.Polinski JM, Kowal MK, Gagnon M, Brennan TA, Shrank WH. Home infusion: Safe, clinically effective, patient preferred, and cost saving. Healthc (Amst). 2017;5(1-2):68-80. doi: 10.1016/j.hjdsi.2016.04.004 [DOI] [PubMed] [Google Scholar]
- 62.Fu LW, Song C, Isaranuwatchai W, Betschel S. Home-based subcutaneous immunoglobulin therapy vs hospital-based intravenous immunoglobulin therapy: A prospective economic analysis. Ann Allergy Asthma Immunol. 2018;120(2):195-199. doi: 10.1016/j.anai.2017.11.002 [DOI] [PubMed] [Google Scholar]
- 63.Abolhassani H, Sadaghiani MS, Aghamohammadi A, Ochs HD, Rezaei N. Home-based subcutaneous immunoglobulin versus hospital-based intravenous immunoglobulin in treatment of primary antibody deficiencies: systematic review and meta analysis. J Clin Immunol. 2012;32(6):1180-1192. doi: 10.1007/s10875-012-9720-1 [DOI] [PubMed] [Google Scholar]
- 64.Beauté J, Levy P, Millet V, et al. ; French PID study group CEREDIH . Economic evaluation of immunoglobulin replacement in patients with primary antibody deficiencies. Clin Exp Immunol. 2010;160(2):240-245. doi: 10.1111/j.1365-2249.2009.04079.x [DOI] [PMC free article] [PubMed] [Google Scholar]
- 65.Runken MC, Noone JM, Blanchette CM, Zacherle E, Howden R. Differences in patient demographics and healthcare costs of patients with PIDD receiving intravenous or subcutaneous immunoglobulin therapies in the United States. Am Health Drug Benefits. 2019;12(6):294-304. [PMC free article] [PubMed] [Google Scholar]
- 66.Orange JS, Grossman WJ, Navickis RJ, Wilkes MM. Impact of trough IgG on pneumonia incidence in primary immunodeficiency: a meta-analysis of clinical studies. Clin Immunol. 2010;137(1):21-30. doi: 10.1016/j.clim.2010.06.012 [DOI] [PubMed] [Google Scholar]
- 67.Anterasian C, Duong R, Gruenemeier P, Ernst C, Kitsen J, Geng B. Quality of life differences for primary immunodeficiency patients on home SCIG versus IVIG. J Clin Immunol. 2019;39(8):814-822. doi: 10.1007/s10875-019-00705-5 [DOI] [PMC free article] [PubMed] [Google Scholar]
- 68.Hay JW. Now is the time for transparency in value-based healthcare decision modeling. Value Health. 2019;22(5):564-569. doi: 10.1016/j.jval.2019.01.009 [DOI] [PubMed] [Google Scholar]
- 69.Hughes DA. Value-based pricing: incentive for innovation or zero net benefit? Pharmacoeconomics. 2011;29(9):731-735. doi: 10.2165/11592570-000000000-00000 [DOI] [PubMed] [Google Scholar]
Associated Data
This section collects any data citations, data availability statements, or supplementary materials included in this article.
Supplementary Materials
eMethods. Detailed Methods
eReferences
eTable. Summary of PSA Results Using β and γ Distributions Comparing the Cost-utility of IRT With HSCT
eFigure 1. Markov Model
eFigure 2. Markov State Transition Diagram
eFigure 3. Probabilistic Sensitivity Analysis
eFigure 4. Tornado Diagram Depicting One-way Sensitivity Analyses of IRT Compared to MUD HSCT
eFigure 5. Cost-utility Plane of Microsimulation Analysis