

ABSTRACT
Oncogenic gammaherpesviruses express viral products during latent and lytic infection that block the innate immune response. Previously, we found that Kaposi’s sarcoma herpesvirus (KSHV/human herpesvirus-8) viral microRNAs (miRNAs) downregulate cholesterol biogenesis, and we hypothesized that this prevents the production of 25-hydroxycholesterol (25HC), a cholesterol derivative. 25HC blocks KSHV de novo infection of primary endothelial cells at a postentry step and decreases viral gene expression of LANA (latency-associated nuclear antigen) and RTA. Herein we expanded on this observation by determining transcriptomic changes associated with 25HC treatment of primary endothelial cells using RNA sequencing (RNA-Seq). We found that 25HC treatment inhibited KSHV gene expression and induced interferon-stimulated genes (ISGs) and several inflammatory cytokines (interleukin 8 [IL-8], IL-1α). Some 25HC-induced genes were partially responsible for the broadly antiviral effect of 25HC against several viruses. Additionally, we found that 25HC inhibited infection of primary B cells by a related oncogenic virus, Epstein-Barr virus (EBV/human herpesvirus-4) by suppressing key viral genes such as LMP-1 and inducing apoptosis. RNA-Seq analysis revealed that IL-1 and IL-8 pathways were induced by 25HC in both primary endothelial cells and B cells. We also found that the gene encoding cholesterol 25-hydroxylase (CH25H), which converts cholesterol to 25HC, can be induced by type I interferon (IFN) in human B cell-enriched peripheral blood mononuclear cells (PBMCs). We propose a model wherein viral miRNAs target the cholesterol pathway to prevent 25HC production and subsequent induction of antiviral ISGs. Together, these results answer some important questions about a widely acting antiviral (25HC), with implications for multiple viral and bacterial infections.
KEYWORDS: EBV, KSHV, cholesterol, innate immunity
INTRODUCTION
Kaposi’s sarcoma herpesvirus (KSHV) is the etiologic agent of lymphoproliferative disorders such as Kaposi’s sarcoma (KS), primary effusion lymphoma (PEL), and multicentric Castleman disease (MCD) (1). We previously discovered that a key enzyme in the mevalonate/cholesterol biosynthesis pathway was the most repressed protein by KSHV microRNAs (miRNAs) (2). KSHV viral miRNAs downregulated several enzymes in the mevalonate pathway to repress cholesterol production (3). We also reported how 25HC is antiviral against KSHV de novo infection of primary endothelial cells (3). These findings led to a model wherein KSHV miRNAs repress cholesterol synthesis to combat 25HC’s antiviral effects.
Interferons (IFNs) are part of the innate immune response, constituting the first line of defense against many invading pathogens. Type I IFNs (interferon alpha/beta [IFN-α/-β]) signal through the IFN-α receptor to activate signaling pathways and downstream transcription factors. This results in increased gene expression of hundreds of interferon-stimulated genes (ISGs) for host defense, inflammation, signaling, transcription, and immunomodulation (4, 5). Type II IFN (IFN-γ) binds to the IFN-γ receptor and activates parallel pathways. Type III interferons (IFN-λ) have overlapping pathways with type I IFN but with different kinetics and potency. The nuclear factor κB (NF-κB) transcription factor, which regulates gene expression for inflammation and cell survival, can be activated by interferons for a concerted response against pathogens (6). Several ISGs have NF-κB binding sites, demonstrating cross talk among these pathways.
Cholesterol-25-hydroxylase (CH25H) (7), a gene coding for an enzyme that converts cholesterol to 25HC, is an ISG. 25HC is the only oxysterol with increased secretion after murine cytomegalovirus (mCMV) infection or induction with IFN-α (8), IFN-β (7), and IFN-γ (7, 8). 25HC has also been characterized as a broad-spectrum antiviral that inhibits HIV-1 (8), hepatitis C virus (HCV) (9–12), mCMV (7), Zika virus (7), Ebola virus (8), coronaviruses (13, 14), and murine gammaherpesvirus 68 (MHV68) (8). 25HC blocks viruses at one or more steps in their viral life cycle. 25HC directly modifies cell membranes to block viral entry (HIV-1, vesicular stomatitis virus [VSV]) (8), impedes viral gene expression (3, 7), activates integrated stress responses to suppress protein synthesis (15) and decreases cholesterol in membranes through oxysterol-binding protein 1 (OSBP) (16). 25HC also decreases the association between OSBP and the vesicle-associated membrane protein-associated protein A (VAP-A), in human rotavirus (HRV) infection (17). More recently, Abrams et al. (18) also reported on 25HC’s antibacterial activity against Listeria infection through its effect on plasma membrane cholesterol.
In addition to its antimicrobial effect, evidence suggests that 25HC modulates inflammation in macrophages (19) and epithelial cells (20). In contrast, there is data indicating that CH25H expression is required to suppress proinflammatory IL-1β levels in macrophages (21, 22). While these findings may seem contrary, it is important to note that interferons have a duality of function: antimicrobial response (with inflammation as part of its repertoire) and suppression of immune response to prevent uncontrolled inflammation (cytokine storm).
In this work, we sought to address how 25HC inhibits KSHV and EBV infection. We approached this by performing RNA sequencing (RNA-Seq) on de novo infected human umbilical vein endothelial cells (HUVECs) treated with 25HC. While previous reports have performed transcriptomic (microarray [12, 19]) and proteomic (23) profiling to characterize the effects of 25HC, this is the first to utilize deep sequencing of RNA from primary cells in the context of infection. We also determined whether CH25H is interferon inducible in peripheral blood mononuclear cells (PBMCs), as CH25H was shown to be an ISG in murine bone marrow-derived macrophages, but not interferon inducible in human endothelial (3) and hepatic cells (11). Last, we tested whether 25HC has an antiviral effect against Epstein-Barr virus (EBV), an oncogenic herpesvirus related to KSHV.
RESULTS
Differential gene expression and pathway analyses reveal induction of inflammatory pathways after 25HC treatment.
Previously, we discovered that pretreatment of HUVECs with 25HC prior to KSHV de novo infection results in a postentry block to infection (3). We also observed that IL-6 was upregulated by 25HC treatment in HUVECs (3). To understand how 25HC inhibits KSHV infection, we examined global gene expression changes induced by 25HC in HUVECs, with or without KSHV infection. We pretreated HUVECs with 25HC or vehicle control and then infected the cells with KSHV (four conditions: with or without 25HC and with or without KSHV infection) (Fig. 1A). At 2 days postinfection (dpi), we harvested RNA and performed total RNA-Seq to determine differentially expressed mRNAs and noncoding RNAs.
FIG 1.

25HC suppressed viral transcription during KSHV de novo infection in primary endothelial cells. (A) Experimental outline of 25HC treatment and KSHV de novo infection of human umbilical vein endothelial cells (HUVECs). (B) Volcano plot showing repressed KSHV differentially expressed genes (DEGs) in HUVECs at 2 dpi with or without 25HC (+/−25HC) (n = 4). DEGs with log2 fold change (FC) of >1.5 and P value (pval) of <0.01 are indicated in red dots to the left of the vertical dotted line and above the horizontal dotted line. This plot was generated using the EnhancedVolcano package from Bioconductor using viral DEGs (see Table S1 in the supplemental material) as input. (C) Heat map of viral transcript reads (average of four biological replicates) normalized to transcripts per million (TPM) with and without 25HC at 2 dpi. Viral transcripts are classified as immediate early (IE), early, delayed early, and late transcripts. Latency transcripts are annotated with the dark red bars on the right.
Expression changes in KSHV genes caused by 25HC in HUVEC de novo infection at 2 dpi. Download Table S1, DOCX file, 0.03 MB (29.3KB, docx) .
This is a work of the U.S. Government and is not subject to copyright protection in the United States. Foreign copyrights may apply.
We previously demonstrated that KSHV LANA and RTA transcripts were suppressed at 2 dpi in HUVECs pretreated with 25HC prior to de novo infection (3). Here we extended that analysis to all KSHV transcripts and observed a global suppression of KSHV viral transcripts (Fig. 1B and C; see also Table S1 in the supplemental material), with greater downregulation for lytic genes (e.g., ORF50/RTA, K8, ORF8, ORF9, ORF10, ORF43, ORF24) compared to latency genes (Fig. 1B, blue dots, LANA/ORF73, ORF72, K13/ORF71, K12, K2/viral IL-6 [vIL-6]). There was also suppression of viral genes known to be expressed in the first 2 dpi (24) with 25HC treatment (Fig. 1B, ORF35, ORF39, ORF47, among others). This RNA-Seq data identified genome-wide suppression of KSHV gene expression by 25HC treatment in HUVECs (3).
To explore host and viral gene expression changes due to 25HC, we examined the top 500 most variably expressed genes (Fig. 2A) and observed four main clusters of genes: (i) genes induced during infection but suppressed by 25HC (teal outline, “Virus-Induced”); (ii) genes induced by 25HC (purple outline, “25HC-Induced”); (iii) a subset of “25HC-Induced” genes with lower induction in KSHV-infected cells (orange outline, “25HC-Induced in Infection”); (iv) genes repressed by 25HC (green outline, “25HC-Suppressed”). The “Virus-Induced” genes, comprised of both KSHV viral genes and host genes, are upregulated during infection and are downregulated in the +KSHV +25HC treatment. This downregulation of viral genes is consistent with the analysis seen in Fig. 1B. Meanwhile, some of the “Virus-Induced” host genes may have proviral roles (i.e., host-dependent genes), with the virus subverting them to establish latent infection. Indeed, several of these host genes (Table S2) overlapped with a small interfering RNA (siRNA) screen for host-dependent factors of dengue virus (25). SPP1 (secreted phosphoprotein 1/osteopontin), was upregulated in KSHV-infected dermal microvascular endothelial cells (26). In conclusion, we identified a group of genes that were upregulated by infection, but this upregulation was counteracted by 25HC treatment.
FIG 2.
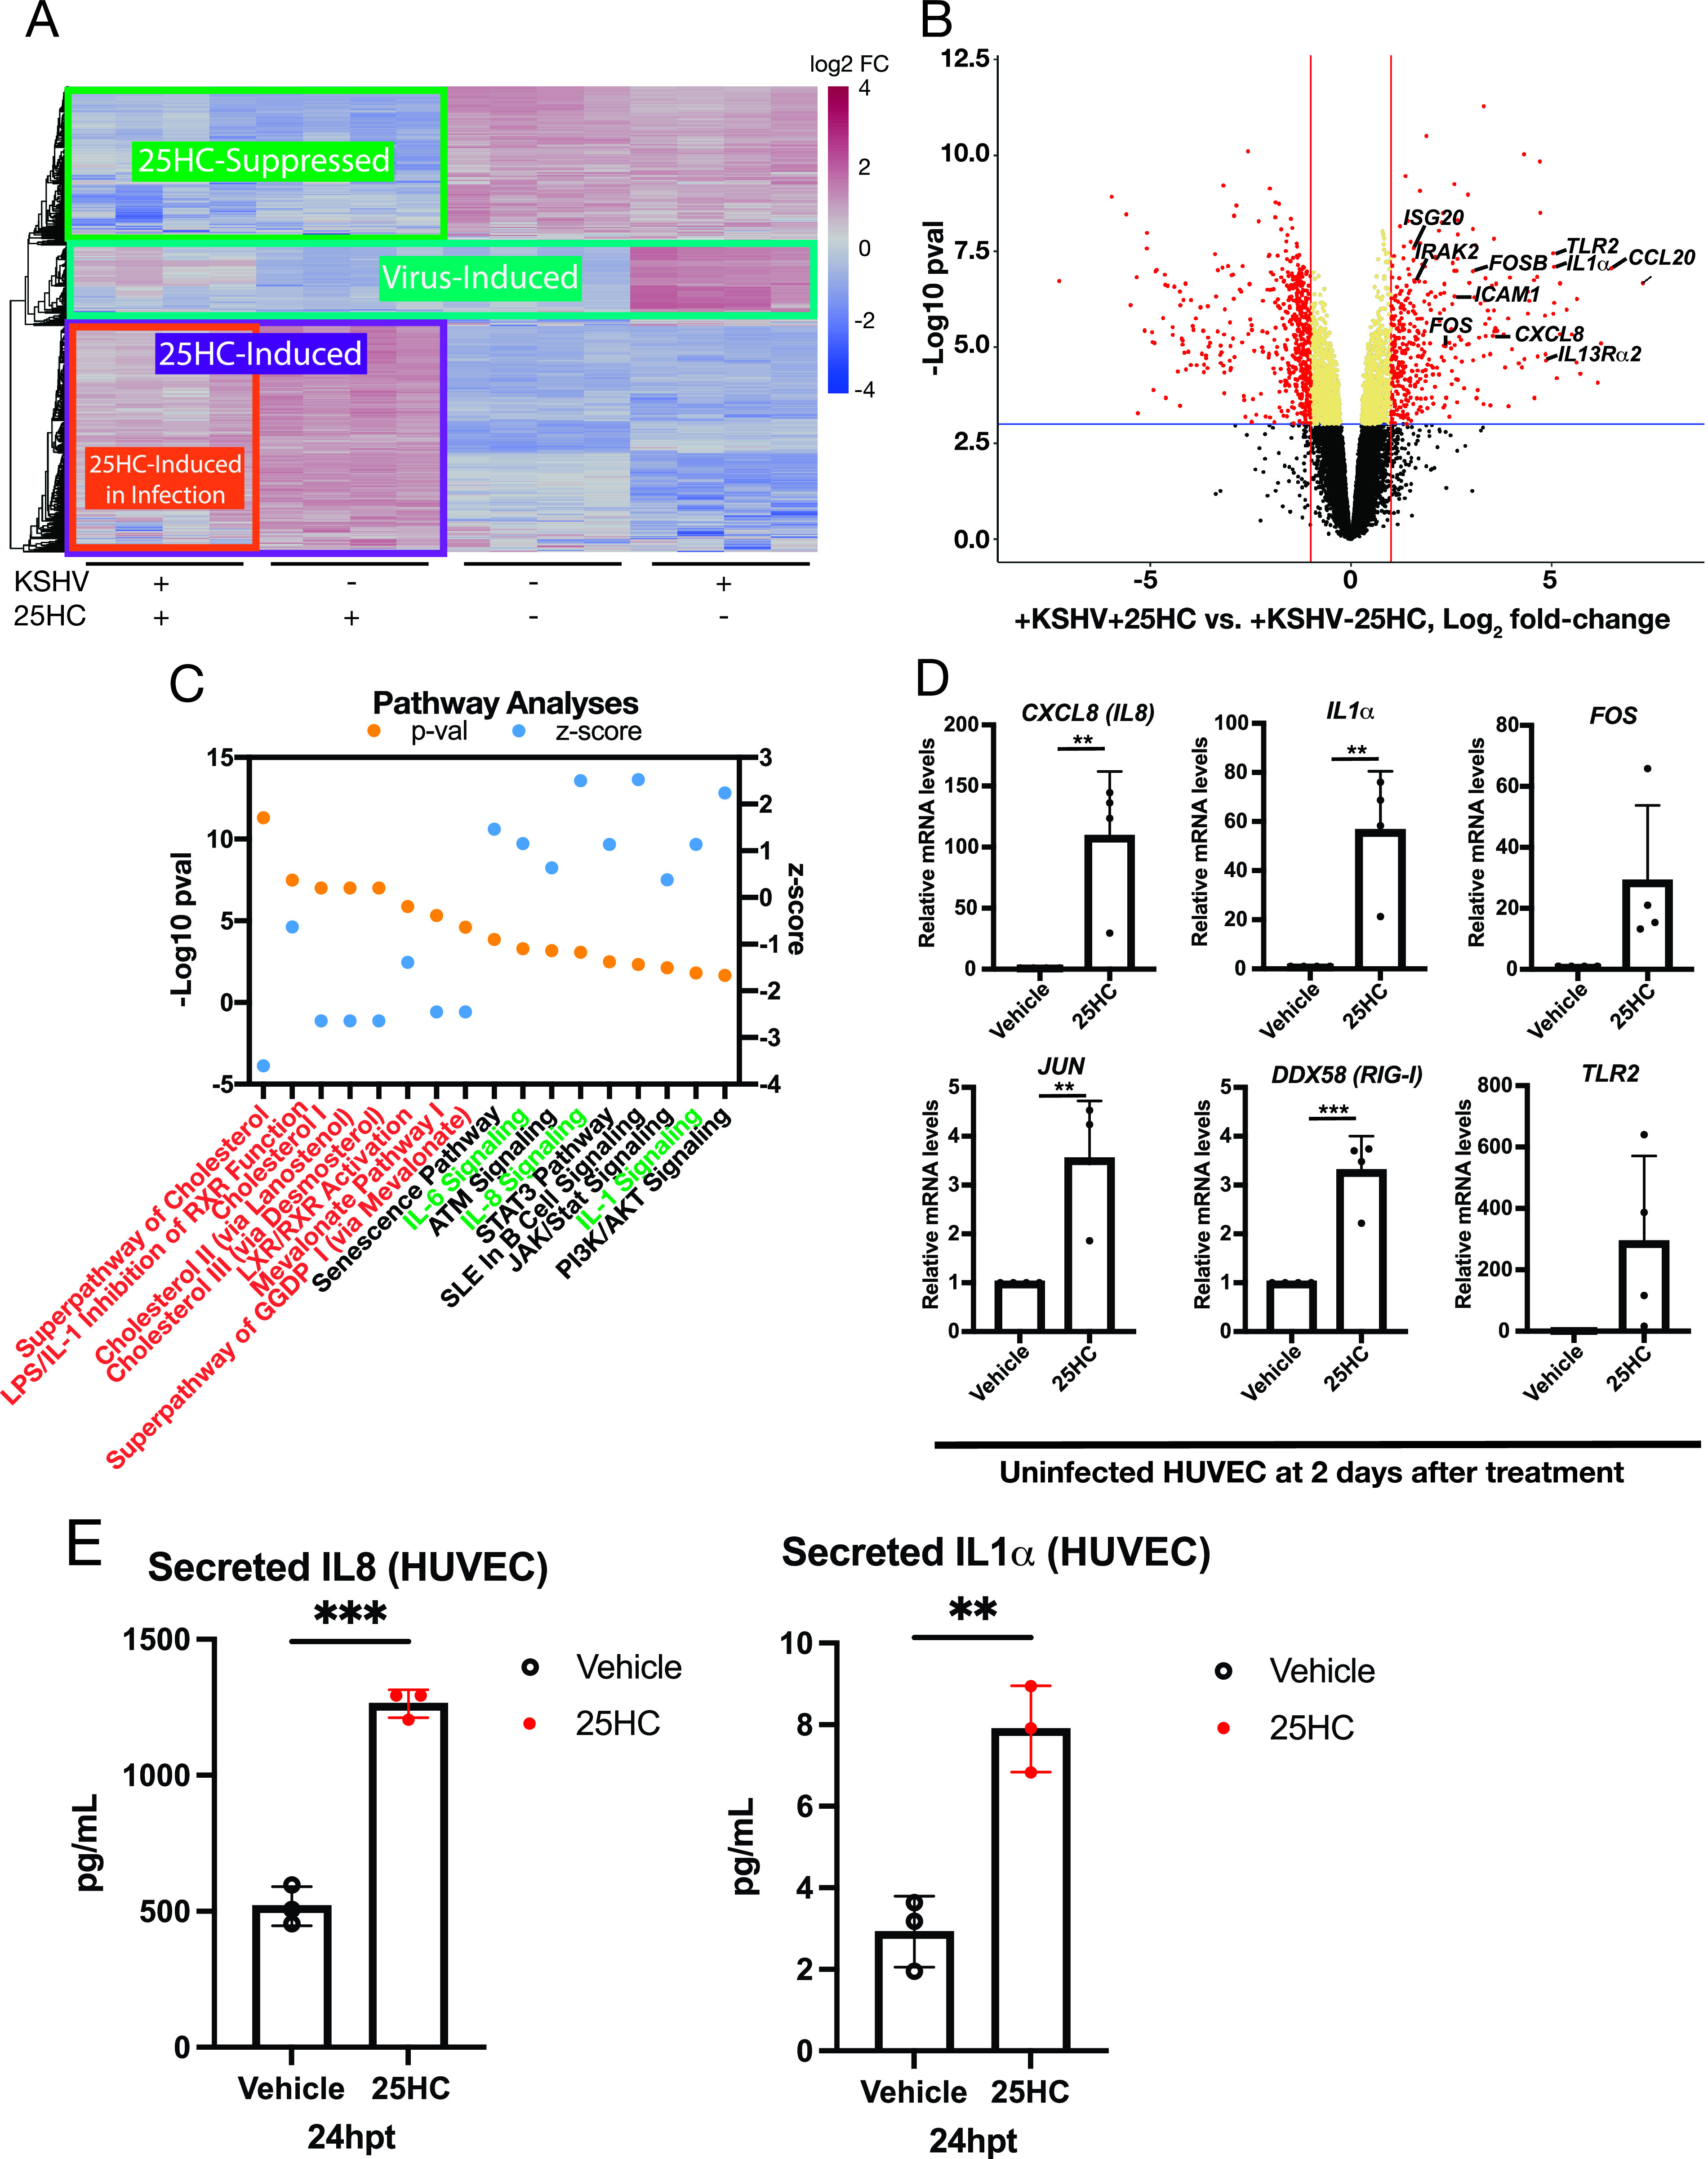
25HC induced an inflammatory response. (A) Heat map of top 500 genes by variance, with each column representing a biological replicate with the designated infection and treatment. (B) Volcano plot of host DEGs in infected HUVECs with (+) or without (−) 25HC. (C) Ingenuity Pathway Analysis (Qiagen) of differential gene expression in infected HUVECs with or without 25HC with corresponding Z-score and P value of cholesterol-related pathways (orange text) and inflammatory pathways (green text). (D) Validation of uninfected RNA samples for gene expression changes by qPCR relative to Vehicle control samples (n = 4). Unpaired t test was performed. (E) Quantitation of secreted cytokines in the supernatant after 25HC treatment of HUVECs (n = 3). Statistical analysis using an unpaired t test was performed, and P values are indicated as follows: *, P ≤ 0.05; **, P ≤ 0.01; ***, P ≤ 0.001. hpt, hours posttreatment.
Virus-induced host genes that are suppressed by 25HC treatment in HUVEC and overlap with an siRNA screen for host-dependent factors of dengue virus (25). Download Table S2, DOCX file, 0.01 MB (14.6KB, docx) .
This is a work of the U.S. Government and is not subject to copyright protection in the United States. Foreign copyrights may apply.
The “25HC-Induced in Infection” subset of 25HC-induced genes were highly induced with 25HC in uninfected HUVECs (−KSHV + 25HC, Fig. 2A, orange outline), but the induction by 25HC was dampened during KSHV infection (+KSHV + 25HC). We hypothesized that some of these host genes may represent potential antiviral genes that are inhibited during KSHV infection. Several immunity genes are upregulated by 25HC and either lose their function or result in deregulated expression in CH25H knockout mice (19). We observed innate immunity genes that are upregulated by 25HC in the context of infection in a volcano plot (Fig. 2B).
To further characterize these 25HC-induced antiviral genes, we used two unbiased, systematic, and parallel methods to investigate pathways that were enriched for 25HC-induced genes. First, we performed pathway enrichment analysis of the 25HC-upregulated gene list (Fig. 2A, “25HC-Induced” purple outline). We found that several “25HC-Induced” genes were enriched for specific pathways (Table 1), with the top three KEGG (Kyoto Encyclopedia of Genes and Genomes) pathways being (i) cytokine-cytokine receptor interaction, (ii) rheumatoid arthritis, and (iii) pathways in cancer. Genes common to these top three pathways are CXCL8 (IL8), IL1A (IL1α), FOS (c-Fos) and VEGF-A (vascular endothelial growth factor A). The first three are cytokines involved in inflammation, while c-FOS is a component of the AP-1 transcription factor complex, which has been found to mediate 25HC function in amplifying inflammatory signals (19). Based on these analyses, 25HC upregulates some pathways related to the inflammatory response, consistent with our previous report showing that IL-6 was upregulated by 25HC (3).
TABLE 1.
Pathway enrichment analysis using WebGestalt for 25HC-upregulated genesa

aPathway enrichment analysis using WebGestalt for 25HC-upregulated genes (corresponding to the purple box, “25HC-Induced” in Fig. 1B) in 25HC-treated human umbilical vein endothelial cells.
For our second pathway enrichment analysis, we determined which pathways are upregulated by 25HC in the context of KSHV infection. We utilized the Ingenuity Pathway Analysis to investigate all differentially expressed genes (DEGs) in infected HUVECs with or without 25HC (Fig. 2C). This analysis yields an activated Z-score to determine the correlation between experimental (HUVEC) and published data to predict the directionality of affected enriched pathways (27). Metabolic pathways related to cholesterol biogenesis and mevalonate pathway were downregulated (Fig. 2C, orange text), including those of LXR (liver X receptor) and RXR (retinoid X receptor) pathways (28). These results are consistent with previous findings that 25HC negatively regulates cholesterol levels (29). Positive Z-scores indicated upregulation of inflammatory pathways such as IL-6, chemokine C-X-C motif ligand 8 (CXCL8)/IL-8, and IL-1 signaling (Fig. 2C, green text). 25HC induced phosphatidylinositol 3-kinase (PI3K)/AKT signaling, a pathway activated in KSHV-infected PEL cell lines (30). In summary, pathways producing inflammatory cytokines are upregulated by 25HC, both by 25HC alone and during KSHV infection in the presence of 25HC.
Interestingly, the miR-146a cluster was upregulated in the +KSHV +25HC condition (orange outline, Fig. 2A) but downregulated in the +KSHV −25HC condition. miR-146a is a modulator of the inflammatory response via negative feedback of NF-κB signaling (31). The upregulation of miR-146a cluster suggests a negative-feedback loop to avoid overinduction of inflammatory responses, such as CXCL8 (IL-8) expression (32).
On the basis of the differential expression patterns and pathway analyses, we prioritized several host candidate genes that may contribute to the 25HC antiviral effect: CXCL8 (IL-8), IL1A (IL-1α), DDX58 (RIG-I), FOSB JUN, and TLR2. Quantitative reverse transcription-PCR (RT-qPCR) results on 25HC-treated uninfected HUVEC RNA samples (Fig. 2D) confirmed these RNA-Seq results. 25HC led to strong induction of CXCL8 (IL-8, ∼100-fold), IL1α (∼50-fold), and TLR2. Baseline TLR2 expression was low in control HUVECs but increased by at least seven to nine threshold cycles in 25HC-treated HUVECs. We also determined whether the induction of these cytokine genes (CXCL8, IL1A) resulted in increased secretion in the supernatant. We measured secreted cytokines in the supernatant and found that secreted IL-8 and IL-1α increased ∼2.5-fold and ∼3-fold from 25HC-treated HUVECs, respectively (Fig. 2E). Thus, we confirmed the activation of these genes by 25HC.
Functional validation of 25HC-induced antiviral candidate genes.
To confirm that the candidate genes contributed to the antiviral effect of 25HC, we performed siRNA knockdown assays. If a candidate gene’s function and increased expression with 25HC contributes to the inhibition of KSHV infection by 25HC, then depletion of that gene product would result in recovery of viral infection (i.e., increase in viral gene expression), despite 25HC pretreatment.
siRNA knockdown assays were performed 1 day prior to infection to deplete candidate gene expression by the time of 25HC exposure (Fig. 3A and B). We confirmed mRNA knockdown via RT-qPCR (Fig. 3B). We also confirmed that siRNA depletion of IL-8 and IL-1α transcripts resulted in reduced secretion of these cytokines (see Fig. S1A to S1C in the supplemental material). Though the reduction of secreted IL-1α was mild with only siIL-1α (siRNA targeted against IL1A), a greater fold reduction (up to threefold) in secreted IL-1α was observed (Fig. S1C) when cells were treated with 25HC, and conditioned medium was assayed at day 3. When cells are treated with 25HC after siRNA depletion of IL-1α, a greater fold reduction (up to threefold) in secreted IL-1α is observed in siIL1α-nucleofected HUVECs (Fig. S1C), especially after 2 days of 25HC treatment (day 3, Fig. S1C), presumably with an accumulation of IL-1α in the supernatant. Compared to control samples (siRNA nontargeting control without 25HC [siNTC/−25HC]), cells with siNTC and 25HC (siNTC/+25HC) demonstrated a statistically significant reduction in KSHV LANA transcript levels (Fig. 3C). As expected, the control infection conditions without any siRNAs also showed a reduction of viral transcripts when treated with 25HC (Fig. 3C, control KSHV infection +25HC), like our previous report (3). Nucleofection of pooled siRNAs against single candidate genes led to a trend toward a higher, albeit nonsignificant, upregulation in LANA (Fig. 3C, comparing siNTC/+25HC versus siIL8/+25HC; see also Fig. S1D) or no effect on LANA (Fig. S1D) or RTA (Fig. S1E). Thus, the depletion of a single gene in the pathway is not sufficient to allow the recovery of viral infection in the presence of 25HC.
FIG 3.

IL-8, IL-1α, and FOSB contribute to 25HC antiviral activity against KSHV de novo infection. (A) Schematic diagram of experiment with siRNA depletion, treatment (with or without 25HC), and KSHV de novo infection of HUVECs. (B) Knockdown by siRNA of candidate target genes on the day of infection. A statistical test using one-way analysis of variance (ANOVA) and post hoc test with Bonferroni correction was performed. (C) Viral gene expression of LANA after siRNA depletion of candidate target genes (n = 4 to 6) and with control samples (infection only, n = 5). One-way ANOVA and post hoc t test with Bonferroni correction were performed, and P values are indicated as follows: *, P ≤ 0.05; **, P ≤ 0.01; ***, P ≤ 0.001; ****, P < 0.0001.
Single knockdown of candidate genes in HUVEC. Bead-based quantitation of secreted IL-8 in HUVEC supernatant at 24 h postnucleofection of siIL8 (A). Paired t test was performed. Immunoassay was also performed for secreted IL-1α at indicated time points (B) after siIL1α depletion with or without 25HC treatment (C). Paired t test was performed. RT-qPCR of HUVEC (n = 3 to 5) at 2 dpi after KSHV de novo infection and siRNA depletion of single gene targets to measure viral transcripts (D) LANA and (E) RTA. One-way ANOVA and posthoc t test with Bonferroni correction was performed, P values are indicated as follows: *, P ≤ 0.05; **, P ≤ 0.01; ***, P ≤ 0.001. Download FIG S1, EPS file, 2.0 MB (2MB, eps) .
This is a work of the U.S. Government and is not subject to copyright protection in the United States. Foreign copyrights may apply.
We next tested combinatorial knockdown of multiple genes induced by 25HC. Since we observed a trend with repression of siIL8, we combined the knockdown of IL8 with other 25HC-induced genes. Depletion of both CXCL8 (IL-8) and IL1A resulted in a statistically significant increase in LANA for the condition without 25HC (siIL8/siIL1α/−25HC) compared to the siNTC/−25HC condition (Fig. 3C). This suggested that the expression of both IL-8 and IL-1α is detrimental to the virus, even in the absence of 25HC. Interestingly, we found that depleting both IL-8 and IL-1α in 25HC-pretreated HUVECs (siIL8/siIL1α/+25HC) resulted in recovery of LANA expression levels compared to siNTC/+25HC (Fig. 3C). This means IL-8 and IL-1α both contribute toward the 25HC-induced antiviral response against KSHV de novo infection. The depletion of both IL-8 (siIL8/+25HC) and FOSB (siFOSB/+25HC) slightly increased LANA levels, but this did not reach statistical significance (Fig. 3C). These results suggest that IL-8 and IL-1α are induced by 25HC and play a significant role in the antiviral effect of 25HC.
Comparison of differentially expressed genes in HUVECs to other data sets demonstrate that some 25HC-induced genes are antiviral genes against other viruses.
To determine whether 25HC-induced genes in our KSHV data set are antiviral against other viruses, we compared DEGs induced by 25HC in the absence of infection (log2 fold change greater than 2 and P value less than 0.05) to antiviral gene sets culled from ISG (4) and siRNA (25) screens (Table 2). Common genes that were antiviral against two viruses were enriched in pathways from 25HC-induced genes (Table 3), with the top hit as the IL-1 signaling pathway. This suggests that the 25HC-induced genes in primary endothelial cells were antiviral in other viral infections and may contribute to the 25HC antiviral mechanism.
TABLE 2.
Antiviral genes that are upregulated in 25HC-treated human umbilical vein endothelial cells (HUVECs), interferon-stimulated gene (ISG) screen (antiviral against hepatitis C virus and HIV-1), and antiviral (against dengue virus) screen
| 25HC-induced gene |
Upregulated |
||
|---|---|---|---|
| HCV | HIV-1 | DENV | |
| MYLK | + | ||
| RASD1 | + | ||
| AKAP12 | + | ||
| ISG20 | + | + | |
| NID2 | + | ||
| GEM | + | + | |
| ATF3 | + | + | |
| RRAGD | + | ||
| LTK | + | ||
| PMAIP1 | + | + | |
| MX1 | + | + | |
| TMEM200A | + | ||
| DUSP5 | + | ||
| NFIL3 | + | + | + |
| FER1L6 | + | ||
| SLC7A11 | + | ||
| TYMP | + | + | |
| CCL20 | + | ||
| SQSTM1 | + | ||
| MXD1 | + | ||
| KCNN2 | + | ||
| ICAM1 | + | ||
| LAMA1 | + | ||
| RRAD | + | ||
| CA13 | + | ||
| PTPRH | + | ||
| PCSK6 | + | ||
| MAFF | + | + | |
| ALDH1L2 | + | ||
| PPP1R15A | + | ||
| RP11-680A11.5 | + | ||
| SLC7A5 | + | ||
| F3 | + | ||
| RP13-631K18.2 | + | ||
| RP11-443P15.2 | + | ||
| BAALC | + | ||
| TNIP3 | + | ||
| ADAM12 | + | ||
| EPSTI1 | + | + | + |
| FOS | + | ||
| KCNF1 | + | ||
| PAPPA2 | + | ||
| STXBP5-AS1 | + | ||
| CHAC1 | + | ||
| BIRC3 | + | ||
| RCAN1 | + | ||
| RAB3IL1 | + | ||
| SLC6A9 | + | ||
| DUSP8 | + | ||
| OASL | + | + | |
| RPLP0P2 | + | ||
| ANK2 | + | ||
| FAM132B | + | ||
| NEK10 | + | ||
| ANO1 | + | ||
| IFIT1 | + | ||
| RELB | + | ||
| ATP6V0D2 | + | ||
| BEX2 | + | ||
| CX3CL1 | + | ||
| CXCL2 | + | ||
| SLC6A4 | + | ||
| VCAN | + | ||
| C12orf39 | + | ||
| NR4A3 | + | ||
| GNG2 | + | ||
| UNC13A | + | ||
TABLE 3.
Enriched pathways for 25HC-induced genes that are broadly antiviral

25HC inhibited EBV infection.
Our findings of an antiviral role of 25HC in KSHV infection was also reported for MHV68 infection (3, 8). We wanted to determine whether 25HC was antiviral against a related oncogenic virus, EBV. To measure this antiviral activity, we tested whether 25HC can: (i) reduce the number of infected, transformed cells, (ii) induce apoptosis, and (iii) downregulate viral transcripts during EBV de novo infection of lymphocytes. These are important parameters in EBV-infected cells that undergo reprogramming and transformation to form lymphoblastoid cell lines (LCLs) in vitro.
On the basis of viability assays (Fig. S2A), we determined that 2.5 μM 25HC is the maximum concentration wherein B cell viability is maintained. B cells were enriched from peripheral blood mononuclear cells (PBMCs) by depleting T cells and then treated with 25HC (or vehicle control) for 2 h (Fig. 4A). We next infected this B cell-enriched PBMC population with EBV (strain 2089 based on B95.8 [33]) and let the infection proceed for 5 days (prelatent phase [34]). We maintained 25HC in the culture and harvested cells at 5, 9, and 13 days postinfection (dpi) (Fig. 4A).
FIG 4.

25HC is antiviral against EBV de novo infection. (A) Schematic diagram of experimental outline showing B cell enrichment of PBMCs and pretreatment (pre-tx) with 25HC, followed by EBV infection. Flow cytometry (Flow cyto), RNA sampling, and addition of 25HC are seen at the indicated time points. (B) Flow cytometry of pretreated and infected B cell-enriched PBMCs to measure cell viability (left) and apoptosis rate (right). Unpaired t test was performed for each time point. (C) Flow cytometry of B cell-enriched PBMCs treated with 25HC after EBV infection and measured for cell viability (left) and apoptosis (right). Unpaired t test was performed for each time point. P values are as follows: *, P ≤ 0.05; **, P ≤ 0.01; ***, P ≤ 0.001.
(A) Cell Titer Glo assay for dose escalation of 25HC in uninfected B cell-enriched PBMC (n = 2). (B) Comparison of EBV gene expression of LCL to Raji cell line. (C) Based on annexin V and 7-AAD staining, cells in the “LCL” and “PBMC” gates were designated healthy or apoptotic subsets. These subsets were quantified as a percentage of total cells in the designated gates. Percentages are averages from three biological replicates of postinfection treated PBMCs. Unpaired t test was performed for each subgroup with P values are as follows: *, P ≤ 0.05; **, P ≤ 0.01; ***, P ≤ 0.001. (D) Histogram of representative flow cytometry data from LCLs (red) derived from pretreated PBMCs (blue). (E) Comparison of GFP (+) PBMCs in pretreated cells at 5 dpi. Unpaired t test was performed (*, P ≤ 0.05). (F) Effect of 25HC on type I (e.g., 5S), type II (e.g., 7SL), and type III (e.g., U6) pol III host transcripts, as measured using RT-qPCR. Statistical analysis using unpaired t test was performed (*, P ≤ 0.05). (G) RT-qPCR for candidate target genes of uninfected B cells after overnight incubation with 25HC. Statistical analysis using unpaired t test did not show any significant differences. Download FIG S2, EPS file, 2.3 MB (2.3MB, eps) .
This is a work of the U.S. Government and is not subject to copyright protection in the United States. Foreign copyrights may apply.
Normally, unstimulated and uninfected primary B cells from PBMCs do not proliferate and will die off after a few days. However, EBV infection can immortalize a subset of B cells by activating oncogenes such as c-myc, which results in the proliferation of infected cells (35). As LCLs became established, there would be a short burst of increased proliferation by 4 dpi during the prelatent phase, followed by a decrease in the doubling rate by 6 dpi (36, 37). We wanted to determine whether 25HC affects the proliferation of infected cells by measuring live cells using flow cytometry. As expected, the vehicle control sample with EBV infection showed hyperproliferation, a hallmark of transformation, from 5 dpi to 9 dpi, which then plateaued from 9 dpi to 13 dpi (Fig. 4B, left panel, black lines). We confirmed that the LCLs exhibited a latency III profile by droplet digital PCR (Fig. S2B). However, we found that the live cell count of 25HC-pretreated cells declined as early as 5 dpi (red lines compared to black lines, Fig. 4B, left panel), with a sharp decrease by the end of 2 weeks.
To determine whether the decline in cell count was due to apoptosis, we used annexin V as a marker of apoptosis. EBV itself typically leads to apoptosis in newly infected cells that are undergoing reprogramming in the first week after infection (37). The vehicle-treated cells exhibited some degree of apoptosis from 5 dpi to 9 dpi (Fig. 4B, right panel, black lines), but this plateaued or decreased from 9 dpi to 13 dpi. The 25HC-pretreated samples, on the other hand, had higher rates of apoptotic cells at 5 dpi compared to vehicle controls (Fig. 4B, right panel, red lines for 25HC; Fig. 5A), with increasing rates of apoptosis from 9 dpi to 13 dpi. Taken together, these data suggest that EBV-infected B cells with prior exposure to 25HC are unable to proliferate and become increasingly apoptotic during prelatency.
FIG 5.

25HC blocks EBV-driven transformation in B cell-enriched PBMCs. (A) Scatterplot of flow cytometry analysis of PBMCs with annexin V and 7-AAD staining after EBV infection and pretreatment with either vehicle (left) or 25HC (right). (B) Scatterplot and gating strategy of PBMCs infected with EBV. (C) Based on annexin V and 7AAD staining, cells in the “LCL” and “PBMC” gates were designated healthy or apoptotic subsets. These subsets were quantified as a percentage of total cells in the designated gates. Percentages are averages from three biological replicates of pretreated PBMCs. Statistical analysis using an unpaired t test was performed for each subgroup, P values are as follows: *, P ≤ 0.05; **, P ≤ 0.01; ***, P ≤ 0.001.
Moving from experiments pretreating with 25HC before infection, we next examined the induction of apoptosis in B cell-enriched PBMCs treated with 25HC after EBV infection. To test this, we infected B cell-enriched PBMCs and allowed the infection to proceed through the prelatent phase. At 5 dpi, we added 25HC or vehicle control together with fresh media. We assayed the cells at 9 dpi and 13 dpi and found that the postinfection 25HC-treated infected PBMCs had fewer live cells compared to vehicle controls (Fig. 4C, left panel, red lines for 25HC), but the decline is not as rapid as 25HC-pretreated cells (Fig. 4B, left panel, red lines for 25HC). However, the apoptosis rate (slope of apoptosis graph) from 9 dpi to 13 dpi of postinfection 25HC-treated cells was as steep as pretreated cells (Fig. 4C versus Fig. 4B, right panels, red lines for 25HC). This result suggested that 25HC can still induce apoptosis even when treatment is added after the initiation of EBV infection. At 13 dpi, the 25HC-pretreated sample had about threefold more apoptotic LCLs compared to vehicle control (Fig. 5C, gray section, 25HC [16.16%] versus vehicle [5.32%]). Similarly, the postinfection 25HC-treated sample had threefold more apoptotic LCLs compared to vehicle control (Fig. S2C, 25HC [14.58%] versus vehicle [4.66%]). On the basis of these results, we conclude that 25HC still induced apoptosis in PBMCs treated after EBV infection, with a lesser antiproliferative effect.
EBV-infected, transformed B cells increase in size and granularity (38), forming distinct populations compared to B cell-enriched PBMCs (Fig. 5B, LCL gate versus PBMC gate). Since this EBV strain expresses the green fluorescent protein (GFP) reporter, we measured infection rates using the GFP signal. Indeed, cells within LCL gate were all GFP positive (Fig. S2D, left panel), confirming the LCL formation. Two weeks postinfection, LCLs dominated the live cells in culture (Fig. 5C, orange, vehicle) as previously reported by Pich et al. (36). With 25HC pretreatment, however, not only is the total LCL cell count reduced (Fig. 5B, right panel, LCL [8.10%]), but the LCLs as a percentage of total cells were also reduced (Fig. 5C, orange, 25HC). In the B cell-enriched PBMC population for the vehicle-treated sample (Fig. S2D, left panel, blue histogram), there was one predominant peak with no GFP signal. On the other hand, in the 25HC-pretreated B cell-enriched PBMC population (Fig. S2D, right panel), there was a tail that extends to the right, signifying some GFP-positive (GFP+) signal. When measuring this GFP+ PBMC population, the 25HC-treated sample has more GFP+ cells for PBMCs outside the LCL gate, compared to its matched vehicle control (Fig. S2E). These observations suggest that exposure to 25HC prior to and after EBV infection may not only induce apoptosis but also delay or block the reprogramming and transformation of EBV-infected B cells. Further experiments are needed to characterize this subpopulation, including immunophenotyping of these cells.
25HC treatment downregulated a subset of EBV latency III genes.
To understand how 25HC inhibits EBV de novo infection, we examined global gene expression changes induced by 25HC in B cells, with or without EBV infection. Again, we utilized total RNA-Seq with ribosomal depletion to identify changes in mRNA and noncoding RNA expression in the virus and host at 10 to 12 dpi (Fig. 4A and B, cells purified by MACSExpress). In contrast to KSHV infection +25HC treatment, we found that five out of eight EBV latency III viral genes were downregulated with 25HC treatment (Fig. 6A and Table 4). Noncoding EBER1, EBER2, and long noncoding RNA (lncRNA) RPMS1 were highly downregulated (Fig. 6A to C). Likewise, LMP-1, EBNA-LP, LMP-2B, BGLF2, and BFRF1 were also significantly suppressed (Fig. 6A to C and Table 4).
FIG 6.

25HC selectively suppressed some viral transcripts in EBV de novo infection. (A) Volcano plot showing repressed EBV differentially expressed genes (DEGs) in MACSExpress purified B cells at 10 to 12 dpi with or without 25HC (n = 4). DEGs with log2 fold change of >1.5 and P value of <0.01 are indicated in red dots to the left of the vertical dotted line and above the horizontal dotted line. (B) Heat map of EBV viral transcript reads (average of four biological replicates) normalized to transcripts per million (TPM) with and without 25HC at 10 to 12 dpi. (C) Histogram of Integrated Genome Viewer showing total viral reads at indicated loci in the EBV genome. (D) Validation of viral transcript levels using RT-qPCR. Statistical analysis using unpaired t test was performed, and P values are indicated as follows: *, P ≤ 0.05; **, P ≤ 0.01; ***, P ≤ 0.001.
TABLE 4.
EBV viral DEGs in purified B cells after EBV de novo infection with or without 25HC10 to 12 dpi (n = 4)
| Gene_ID | Log2 fold change | Adjusted P value |
|---|---|---|
| EBER2 | −3.05 | 1.02E−15 |
| EBNA-LP | −2.82 | 4.38E−02 |
| LMP-1 | −2.78 | 5.75E−03 |
| EBER1 | −2.06 | 3.47E−06 |
| RPMS1 | −1.72 | 3.50E−03 |
| BFRF1 | −1.61 | 2.52E−01 |
| LMP-2B | −1.58 | 1.90E−04 |
| BGLF2 | −1.52 | 1.06E−01 |
To validate our EBV RNA-Seq data set, we also assayed the effects of 25HC on EBV viral gene expression by RT-qPCR at 10 to 12 dpi. We confirmed lower expression of EBER1, EBER2, and LMP-1 in the 25HC-treated samples, but EBNA2 (protein-coding, RNA polymerase II [pol II] transcript), BMRF1, and BCRF1/vIL10 expression were unaffected (Fig. 6D). Recently, Pich et al. have reported that EBNA2 is the only essential viral gene for B cell immortalization to induce proliferation during the EBV prelatent phase (36). Our results may be showing that EBNA2 sustains the survival of EBV-infected B cells, but EBNA2 is not sufficient to prevent apoptosis (Fig. 4) and blockade of transformation (Fig. 5) induced by 25HC.
25HC targets LMP-1 and its antiapoptotic function.
LMP-1 (latent membrane protein 1) functions as the main oncogenic protein of EBV and is critical for EBV-mediated B cell transformation. LMP-1 mimics the constitutively active form of CD40 and activates NF-κB, Jun N-terminal protein kinase (JNK), and p38 pathways (39). We therefore wanted to determine what host genes downstream of LMP-1 expression contributes to the observed apoptosis in 25HC-treated B cells. Similar to the HUVEC data set, we performed analyses of RNA sequencing data and identified DEGs in the host (Fig. 7B). Interestingly, we found that EGR1 (early growth response gene-1), a transcription factor that is induced by EBV via NF-κB activation (40), is one of the downregulated DEGs. EGR1 has previously been shown to enhance drug resistance in cancer cells in an LMP-1-dependent manner by inducing antiapoptotic protein, Bfl-1 (40). BCL2A1, which encodes Bfl-1, is also downregulated in our data set.
FIG 7.

25HC targets LMP-1-related host gene expression and upregulates cytokine pathways in the context of EBV de novo infection. (A) Heat map of top 500 host genes by variance in purified B cells during EBV de novo infection with or without 25HC at 10 to 12 dpi (n = 4). (B) Volcano plot of host DEGs in the context of EBV de novo infection of purified B cells with or without 25HC at 10 to 12 dpi. (C) Ingenuity Pathway Analysis of host DEGs (cholesterol and mevalonate-related genes [orange text]; cytokine and inflammation pathways [green text]). (D) Validation of candidate host transcript levels using RT-qPCR. Statistical analysis using unpaired t test was performed, and P values are indicated as follows: *, P ≤ 0.05; **, P ≤ 0.01; ***, P ≤ 0.001.
On the other hand, LMP-1 is known to downregulate DUSP6 (dual-specificity phosphatase 6) (41), which is a negative regulator of mitogen-activated protein kinases (MAPKs) that are implicated in many cellular processes and are constitutively activated in LCLs. In our data set, we found that DUSP6 was upregulated ∼12-fold in 25HC-treated LCLs (Fig. 7B). Restoration of DUSP6 expression has been shown to induce cell apoptosis in LCLs (41) accompanied by shrinking of LCL clumps, which we also observe in our 25HC-treated LCLs.
EBV viral noncoding RNAs and type I host pol III RNAs are suppressed by 25HC.
EBER1 and EBER2 are pol III transcribed noncoding viral RNAs massively expressed during EBV infection of B cells, and there is evidence that they induce growth and enhance colony formation (42). EBV infection has been shown to induce pol III transcription of host transcripts under the type I and type II promoters (43), but not type III. Since 25HC downregulates both EBV small RNAs (EBERs), we performed RT-qPCR for representative host pol III transcripts (Fig. S2F): 5S (type I promoter), 7SL (type II promoter), and U6 (type III promoter) to determine whether 25HC affects pol III transcription in the context of EBV infection. We found that 25HC significantly downregulated 5S (type I promoter) but not 7SL and U6. This suggests that 25HC affects only a subset of pol III transcription.
25HC targets similar pathways in EBV-infected B cells as KSHV-infected HUVECs.
We wanted to determine whether the same candidate target genes from the HUVEC data set were also significantly induced in the B cell data set. We found that while some ISGs of interest were not identified as DEGs in the RNA-Seq data (did not meet adjusted P value cutoff), their mRNA levels were still significantly upregulated when assayed via RT-qPCR (i.e., IL8, Jun, FOS, DDX58/RIG-I, TLR2) (Fig. 7D). However, the uninfected B cells did not show any significantly upregulated mRNA levels upon 25HC treatment (Fig. S2G). We cannot, however, rule out the possibility that this is due to the shorter treatment period for purified B cells (overnight versus 2 days for HUVECs), which were harvested earlier since B cells undergo cell death in vitro without further stimulation.
Looking at a heat map of B cell host genes, we observed that within virus-induced gene groups (Fig. 7A, orange columns in +EBV+25HC and +EBV−25HC), there are a few gene clusters that are blue in +EBV+25HC and orange in +EBV−25HC. These would represent 25HC-repressed genes and may be host-dependent factors. On the other hand, in the virus-repressed gene groups (Fig. 7A, blue columns in +EBV +25HC and +EBV−25HC), there are a few orange clusters in +EBV+25HC. These were 25HC-induced genes, with some of them being detrimental to EBV infection. While the changes are less uniform across the biological replicates, these may be reflecting donor-dependent differences of the primary B cells.
We also performed an Ingenuity Pathway Analysis (IPA) of DEGs in the context of EBV infection (Fig. 7C). As expected, we found that cholesterol- and mevalonate-related pathways are downregulated by 25HC (negative Z-score), similar to the HUVEC data set. Interestingly, we also observed the same pathways with positive Z-scores (i.e., activated), such as IL-8 signaling, IL-1 and IL-6 signaling, in the B cell data set. While IL-1α mRNA was not significantly induced by 25HC when assayed by RT-qPCR, IPA identified IL-1 pathway components that are DEGs: IL1R1 (encodes receptors of IL-1α and IL-1β) and genes for serine/threonine kinases MAPK10, PRKACB, and PRKAR2B. This suggests that 25HC activates similar pathways in both endothelial and B cell types, potentially reflecting the broad antiviral activity of 25HC.
In conclusion, 25HC impaired EBV-driven proliferation and induced apoptosis, most likely through suppression of LMP-1 expression. 25HC is more potent when B cells are pretreated prior to EBV infection. Also, 25HC caused downregulation of several noncoding viral transcripts by an unknown mechanism. Last, 25HC upregulates similar innate immune pathways in B cells as in HUVECs, although the individual genes upregulated may be different.
CH25H is interferon inducible in human B cell-enriched PBMCs.
Cholesterol is converted into 25HC by cholesterol 25-hydroxylase (CH25H). We reported that gene expression of CH25H is not interferon inducible in HUVECs (3), but CH25H expression was induced by interferon treatment in murine bone marrow-derived macrophages (7, 44). Another group has also reported that CH25H in human hepatic cells is not interferon inducible (11). This suggests that CH25H and 25HC might represent a key downstream effector of interferon signaling in some cell types while demonstrating antiviral activity in a wider range of cell types.
Due to tropism of KSHV and EBV for human B cells, we wanted to determine whether CH25H is upregulated by interferons in human B cell-enriched PBMCs. We added either IFN-α, IFN-β, or IFN-γ to PBMCs from healthy donors and collected RNA samples 15 min, 30 min, and 2 h after treatment to measure changes in CH25H mRNA levels. As positive controls, ISGs ISG15 and IRF1 were confirmed to be upregulated by qPCR (Fig. S3A and S3B), although values did not reach statistical significance compared to the value for the vehicle control, possibly because these are relatively early time points. ISG15 was induced by ∼60-fold by IFN-α and IFN-β but showed a modest response to IFN-γ (∼2-fold induction). One donor (donor 2) had a reduced response to all IFNs compared to the other donors. Since Smith et al. (45) reported that EBV infection of lymphocytes upregulated IRF1-regulated genes, we tested whether these PBMCs were EBV infected via RT-qPCR. All three sets of B cells enriched from PBMCs had undetectable EBV transcripts (Table S3), compared to positive controls Raji and Akata+ cell lines. This discounts the likelihood that the ISG responses were altered by preexisting EBV infection in the B cell-enriched PBMCs from the three donors.
Control experiment to confirm interferon induction of PBMCs from three different donors by measuring (A) ISG15 and (B) IRF1 gene expression assayed with RT-qPCR. Shown here are P values for unpaired t tests. Download FIG S3, EPS file, 2.0 MB (2MB, eps) .
This is a work of the U.S. Government and is not subject to copyright protection in the United States. Foreign copyrights may apply.
EBV transcripts in B cell-enriched PBMC for interferon induction experiment Table S3, DOCX file, 0.01 MB (14.6KB, docx) .
This is a work of the U.S. Government and is not subject to copyright protection in the United States. Foreign copyrights may apply.
Comparing IFN-treated samples to vehicle-treated ones, CH25H mRNA was found increased over multiple time points (Fig. 8A for IFN-α and 8B IFN-β relative to vehicle control). For donor 2, CH25H was initially shown to be upregulated twofold at 15 min and then started to decrease from that time point. We demonstrated that CH25H is inducible by type I interferons, but not type II interferon, IFN-γ, in human B cell-enriched PBMCs. These data are consistent with the hypothesis that CH25H is indeed part of the innate immune response to viruses, but its responsiveness to IFN is cell type dependent.
FIG 8.

CH25H is induced in PBMCs by type I interferons. (A and B) Time course experiment of CH25H gene expression in PBMCs relative to vehicle control (VehCtrl) samples after IFN-α (A) and IFN-β (B) treatment and assayed with RT- qPCR. (C and D) Corresponding time course experiment of ATF3 gene expression in PBMC after IFN-α (C) and IFN-β (D) treatment and assayed with RT-qPCR. (E) Schematic diagram of antiviral activity of 25HC and proposed modulators of CH25H expression.
Gold et al. reported previously that ATF3 (activating transcription factor 3) negatively regulates CH25H by binding to the CH25H promoter in murine bone marrow-derived macrophages (46). To test whether ATF3 increased in expression when CH25H decreased in human B cell-enriched PBMCs, we measured ATF3 transcript levels with RT-qPCR. ATF3 was induced at 2 h after IFN type I treatment (Fig. 8C and D), and this correlated with CH25H levels that plateaued or decreased at this time point (Fig. 8A and B). The negative correlation of CH25H with ATF3 expression (Fig. 8E) hints at a tightly regulated immune response that when unchecked, may result in uncontrolled inflammation (19).
DISCUSSION
In this current work, we report observations that suggest some potential mechanisms of 25HC’s antiviral effect in KSHV and EBV de novo infected primary cells using RNA sequencing. In KSHV, 25HC treatment correlated with global suppression of viral transcripts and downregulation of some putative host-dependent factors. Aside from inflammatory genes, components of the AP-1 transcription factor were also upregulated in primary endothelial cells. This is in agreement with Gold et al. (19) when they demonstrated that 25HC treatment of bone marrow-derived macrophages induced AP-1 components (Fos, Fosb, Fosl1, Jun). Other genes that were induced in both our HUVEC data and previous bone marrow-derived macrophage data include ATF3, a known suppressor of CH25H (Fig. 8E; see also Fig. S4 in the supplemental material) (46), and MAFF (MAF BZIP transcription factor F).
Comparison of changes in mevalonate gene expression in the HUVEC RNA-Seq data with HeLa proteomics data, both with 25HC treatment (23). Downregulated in both HUVEC (RNA) and HeLa (protein) is shown in red. Downregulated in HeLa (protein) and upregulated in HUVEC (RNA) is shown in blue. Download FIG S4, EPS file, 1.8 MB (1.8MB, eps) .
This is a work of the U.S. Government and is not subject to copyright protection in the United States. Foreign copyrights may apply.
In a proteomics study on HeLa cells treated with 25HC, Civra et al. (23) reported the induction of SQSTM1 (sequestosome 1) protein, an adapter protein of the NF-κB pathway which can induce IL-8 when overexpressed in epithelial cells (47). SQSTM1 is similarly upregulated in our data on HUVECs. Overall, we found concordance in the HeLa proteomics data and our RNA sequencing data, except for fatty acid synthase (FASN) (Fig. S4).
We confirmed that inflammatory genes are important targets of 25HC because combinatorial repression of these target genes decreased the 25HC antiviral effect in KSHV infections, with recovery of viral transcription. Even without 25HC, concurrent repression of CXCL8 (IL-8), IL1A (IL-1α), and FOSB showed increased viral LANA gene expression. This suggests that these host gene targets work in parallel to suppress viral infection. With 25HC treatment, concurrent depletion of IL-8 and IL-1α resulted in recovery of LANA viral gene expression. This further supports the hypothesis that these target genes contribute to the antiviral activity of 25HC.
Our current work also demonstrated how 25HC is antiviral against de novo EBV infection of B cells. Of note, we were able to observe the same phenotype using different methods of purifying B cells from buffy coat: using the MACSExpress method (to generate the RNA-Seq data during revision of this paper) or with the extended Ficoll purification method. This 25HC antiviral effect can be seen even when treatment is performed after infection. 25HC increased the apoptosis rate in EBV-infected cells, which were subsequently unable to form LCLs. 25HC may also be blocking the transformation into LCLs due to a greater percentage of PBMCs remaining compared to LCLs in 25HC-treated samples.
We also performed RNA sequencing of purified B cells after EBV de novo infection and 25HC treatment. In contrast to the KSHV data set, we found that a subset of EBV latency III genes were downregulated, including noncoding viral transcripts EBER1 and EBER2. While the role of EBERs during early infection is controversial (48), EBERs have been observed to block apoptosis induced by IFN-α (49).
RPMS1 is another viral noncoding RNA that is suppressed by 25HC (Fig. 6A and Table 4). The locus for this long noncoding RNA is within the EBV BamHI-A rightward transcript (BART) region, which also encodes the EBV BART miRNAs. RPMS1 contributes to transformation in vitro and tumorigenesis in vivo (50). It would be interesting to follow up on how the downregulation of RPMS1 by 25HC contributes to the latter’s antiviral effect.
More importantly, LMP-1 was also downregulated, and we observed some expression changes in LMP-1-related host genes that can explain the increased apoptosis rate in 25HC-treated B cells. DUSP6 is usually downregulated by LMP-1 to prevent apoptosis, and we found DUSP6 highly upregulated in our data set. Looking at activated pathways in EBV-infected B cells treated with 25HC, we found similar pathways that are upregulated (IL-8, IL-1, IL-6 signaling pathways) by 25HC in the KSHV HUVEC data set.
25HC can be further metabolized to 7α,25-dihydroxycholesterol (7α25HC) by a hydroxylase encoded by CYP7B1 (51, 52). 7α25HC is a chemokine that is the ligand for EBI2 (EBV-induced molecule 2), which acts as a homing signal for activated B cells to facilitate interaction with their cognate T cells (53). While exogenous 7α25HC can also induce candidate genes in HUVECs (Fig. S5), we were unable to detect CYP7B1 protein by immunoblotting in HUVECs and HDLECs (human dermal lymphatic endothelial cells) (Fig. S5B), and its transcript was not expressed in our HUVEC data set (GSE165328).
Effect of 7α25HC treatment in HUVEC. (A) RT-qPCR to measure gene expression of some candidate target genes in HUVEC after addition of exogenous 7α25HC (from Cayman Chemical [C] or from Sigma [S]), normalized to the values for vehicle control (n = 3 to 5). Results of t tests are shown here (*, P value of ≤0.05). (B) Immunoblotting for CYP7B1 protein expression in 30 μg total cell lysates of primary endothelial cells HUVEC (n = 3) and HDLEC compared to positive controls HEK293 and THP1. Download FIG S5, EPS file, 2.1 MB (2.1MB, eps) .
This is a work of the U.S. Government and is not subject to copyright protection in the United States. Foreign copyrights may apply.
Since 25HC blocks viral entry in some viruses, there is speculation that 25HC may affect lipid rafts on the cell membrane. For example, inhibiting lipid rafts by cholesterol depletion negatively affects KSHV entry and egress (54, 55) (reviewed in reference 56). However, Abrams et al. (18) showed that accessible cholesterol (not cholesterol in lipid rafts) decreases with increasing amounts of exogenous 25HC during Listeria infection. This implies that 25HC depletes the free cholesterol on the membrane, resulting in an entry block. Recently, Wang et al. demonstrated how 25HC depletes accessible cholesterol via activation of acyl coenzyme A (acyl-CoA):cholesterol acyltrasferase (ACAT) in the context of severe acute respiratory syndrome coronavirus 2 (SARS-CoV-2) (14). Overall, these demonstrate that rather than lipid rafts, it is the accessible cholesterol on the plasma membrane that is important in 25HC’s activity of blocking virus entry.
In this current work, we demonstrated that CH25H is type I interferon inducible in human B cell-enriched PBMCs. This regulation is cell type dependent. Our PBMC data are similar, but not the same as what was shown in murine bone marrow-derived macrophages (BMDMs): Blanc et al. (7) showed that CH25H can be induced by IFN-β and IFN-γ, while Liu et al. (8) showed that CH25H is upregulated by IFN-α and IFN-γ. Taken together, these results suggest that CH25H can be induced by various factors in a cell-type-dependent fashion.
Our mechanistic studies demonstrated that 25HC blocked KSHV and EBV infection by upregulation of genes in the inflammatory pathways while suppressing viral transcription. We also showed that 25HC induced apoptosis during EBV infection. Additionally, we determined that CH25H is an ISG in the context of B cell-enriched PBMCs and that some 25HC-induced genes are broadly antiviral. These results may explain how 25HC inhibits a wide range of viral infections, including gammaherpesviruses, HIV-1, Zika virus (57, 58), and coronaviruses (13, 14).
MATERIALS AND METHODS
EBV virus stock and EBV infection of B cell-enriched PBMCs.
EBV virus production was performed using a producer clone of EBV strain 2089 (bacterial artificial chromosome harboring GFP and EBV strain B95.8, a kind gift from Jeff Cohen, NIAID, NIH, USA). Virus stocks were titrated on Raji cells as previously reported and used at a multiplicity of infection (MOI) of 0.1 green Raji units for infecting primary B lymphocytes with an optimal virus dose (38). Buffy coats from three different donors were purified through a Ficoll cushion (GE Healthcare). Rosetting was performed with sheep blood (Thermo Fisher Scientific), and PBMCs were again purified through a Ficoll cushion. Last, PBMCs were treated with red blood cell (RBC) lysis buffer (BioLegend) and washed three times with phosphate-buffered saline (PBS) (Gibco). B cells sent for RNA sequencing were purified from buffy coats using MACSExpress Whole Blood B cell isolation kit (Miltenyi Biotec) following the manufacturer’s protocol. For virus infection, PBMCs were cultivated with each virus stock for 18 h. After replacement with fresh medium, the infected cells were seeded at an initial density of 5 × 10⁵ cells per ml. Cyclosporine (1 μg/ml; Abcam) was added for the duration of the experiment to suppress T cell activation.
Flow cytometry analysis.
PBMC cell suspensions were stained with 7-aminoactinomycin D (7-AAD) (BD Biosciences) and annexin V (BioLegend) and then measured with FACSCalibur (BD Biosciences). Data were analyzed using FlowJo software (BD Biosciences), using gating strategies as previously reported (38).
Interferon induction of PBMCs.
Buffy coats from three different donors were purified through a Ficoll cushion. PBMCs were treated with RBC lysis buffer and washed three times with PBS. PBMCs were treated with interferon alpha (Invitrogen; final concentration, 1,000 U/ml), interferon beta (Peprotech; final concentration, 5 ng/ml), interferon gamma (Roche; final concentration, 5 ng/ml) or vehicle control (PBS with bovine serum albumin [BSA] carrier).
Cell culture, reagents, nucleofection, and KSHV infection.
Human umbilical vein endothelial cells (HUVECs) were obtained from Lonza and passaged in EGM2 medium (Lonza) for up to 5 passages, with passages 3 to 5 used for experiments. 25HC (H1015; Sigma) and 7a25HC (Cayman Chemical, Sigma) were reconstituted in ethanol at 5 mM and stored in single-use aliquots at −20°C for no more than 4 weeks. ON-TARGETplus nontargeting control siRNA and ON-TARGETplus SMARTpool siRNA targeting IL8, IL1α, and FOSB were obtained from Dharmacon/Horizon Discovery. We observed that lipofection reagents (Dharmafect-I, Lipofectamine 2000) abrogate the 25HC antiviral effect during KSHV de novo infection. Instead, we performed nucleofection of siRNAs into HUVEC using the Amaxa 4D-Nucleofector (Lonza) with the P5 Primary Cell kit (catalog no. V4XP-5024) and the CA-167 program following the manufacturer’s instructions. Cells from one cuvette were split into three wells (one for vehicle control, one for 25HC, and one to check knockdown at 24 h postnucleofection) in a 12-well plate. HUVEC de novo infections were carried out using BCBL1 supernatant (concentrated with Vivaflow or by ultracentrifugation) after 2 h of pretreatment with 5 μM 25HC or ethanol (vehicle control), diluted in EGM2 medium at a multiplicity of infection (MOI) of 40, as determined by LANA copy number. Polybrene was added at 8 μg/ml. Uninfected samples were included as negative controls. After 5 to 6 h of incubation, cells were washed and overlaid fresh media with or without 25HC 5 μM. RNA was harvested at 2 dpi and extracted using RNeasy kit (Qiagen) or Direct-zol kit (Zymo) with DNase treatment.
Quantitation of mRNAs and proteins.
Quantitative reverse transcription-PCR (RT-qPCR) was performed using 200 to 500 ng RNA and random primers with an Applied Biosystems high-capacity cDNA reverse transcription kit. SYBR green assays (FastStart universal SYBR green master mix; Roche or Thunderbird SYBR qPCR master mix, Toyobo) and TaqMan assays (TaqMan Universal PCR master mix, no AmpErase UNG; Applied Biosystems) were performed using the ABI StepOnePlus real-time PCR system (Applied Biosystems). Relative mRNA levels were computed using the threshold cycle (ΔΔCT) method with genes coding for RPS13 (HUVECs) or GUSB (PBMCs) as reference genes. Droplet digital PCR (Bio-Rad) was performed using EvaGreen assay at nonsaturated levels. EBV primers were previously described (59). Data were analyzed using QuantaSoft (Bio-Rad), with EBV viral levels normalized to hypoxanthine phosphoribosyltransferase (HPRT1). Antibody against CYP7B1 (ab138497; Abcam) (1:1,000 dilution) was used for immunoblotting with the Odyssey system (Li-Cor) as previously described (3).
RNA-Seq experimental design.
Four biological replicates of HUVEC de novo infections described above were submitted for total RNA sequencing. Sixteen RNA samples were depleted for rRNA and pooled for sequencing on four lanes on HiSeq4000 with Illumina Hiseq3000-4000 chemistry. All the samples have excellent yields above 146 million reads. Alignment was performed with reference human hg38 genome and gencode v24 transcripts using STAR software. Quantification was carried out with RSEM using transcriptome bam file created by star and gencode v24 transcriptome as an index for RSEM.
Analysis of RNA-Seq data.
Differential expression analysis was performed using the NIH Integrated Data Analysis Platform (NIDAP). Briefly, read counts were processed by Limma package with quantile normalization and visualized by R. Differentially expressed genes (DEGs) are selected in two criteria: P value of 0.001 and absolute log2 fold change of >2 for human DEGs and P value of <0.01 and absolute fold change of >1.5 for viral DEGs. Wilcoxon rank sum approach was also employed to account for the variability between infections: read counts from RSEM for each gene were normalized to TPM (transcripts per million reads), and expression fold change was calculated for each replicate. Ranks were calculated by summing up ranks of fold changes (higher the upregulation, higher the rank) of each replicate. Rank sums were converted to Z-scores, and genes with absolute Z-score of >1.96 were selected as differentially expressed genes. For pathway enrichment analysis, Ingenuity Pathway Analysis (IPA) (Qiagen) was used. For the overrepresentation analysis with KEGG, DEGs are added to WebGestalt (60). For the viral DEGs, the package DESeq2 (61) was used to carry out statistical analysis of differential expression between samples. The volcano plot for virus genes from the DESeq2 output was generated using EnhancedVolcanoplot package (62), and a heat map was generated for the TPM values of viral genes using ComplexHeatmap package (63).The BAM files were converted to bigwig files using bamCoverage from deeptools package (64) with the bin size set at 1 and the effective genome size of 3100809451 was used that contains both human genome and the EBV viral genome, the coverage was calculated using bins per million mapped reads (BPM). The bigwig files generated were visualized in IGV (Integrative Genomics Viewer) (65).
Quantitation of secreted cytokines.
One day after siRNA nucleofection, HUVEC conditioned medium was collected and frozen. For 25HC induction studies, conditioned media were collected at indicated time points and stored at −20°C. LEGENDplex custom assay kit (Biolegend) was used for bead-based quantitation of CXCL8/IL-8 and IL-1α following the manufacturer’s protocol. Flow cytometry was performed on a CytoFLEX S machine (Beckman), and data were analyzed using FlowJo (BD).
Data analysis and statistics.
Most graphs contain plots with each data point represented and also include the means and standard deviations (SD). For testing of significance, t tests were used, with asterisks indicating various P values (*, P < 0.05; **, P < 0.01; ***, P < 0.001; ****, P < 0.0001).
Data availability.
RNA sequencing data for viral and human expression are accessible at Gene Expression Omnibus (GEO): GSE165328.
ACKNOWLEDGMENTS
We thank Laurie Krug, Insun Kook, and Sarah Dremel for critical review of this paper. We also acknowledge Vishal Kopalde and Thomas (Josh) Meyer of CCBR/NCI for their help with the RNA sequencing pipeline analysis.
This work was supported by the Intramural Research Program of the Center for Cancer Research, National Cancer Institute, National Institutes of Health (award 1ZIABC011176).
Footnotes
Citation Serquiña AKP, Tagawa T, Oh D, Mahesh G, Ziegelbauer JM. 2021. 25-Hydroxycholesterol inhibits Kaposi’s sarcoma herpesvirus and Epstein-Barr virus infections and activates inflammatory cytokine responses. mBio 12:e02907-21. https://doi.org/10.1128/mBio.02907-21.
Contributor Information
Joseph M. Ziegelbauer, Email: ziegelbauerjm@mail.nih.gov.
Stacy M. Horner, Duke University Medical Center
REFERENCES
- 1.Yarchoan R, Uldrick TS. 2018. HIV-associated cancers and related diseases. N Engl J Med 378:2145. doi: 10.1056/NEJMc1804812. [DOI] [PubMed] [Google Scholar]
- 2.Gallaher AM, Das S, Xiao Z, Andresson T, Kieffer-Kwon P, Happel C, Ziegelbauer J. 2013. Proteomic screening of human targets of viral microRNAs reveals functions associated with immune evasion and angiogenesis. PLoS Pathog 9:e1003584. doi: 10.1371/journal.ppat.1003584. [DOI] [PMC free article] [PubMed] [Google Scholar]
- 3.Serquiña AKP, Kambach DM, Sarker O, Ziegelbauer JM. 2017. Viral microRNAs repress the cholesterol pathway, and 25-hydroxycholesterol inhibits infection. mBio 8:e00576-17. doi: 10.1128/mBio.00576-17. [DOI] [PMC free article] [PubMed] [Google Scholar]
- 4.Schoggins JW, Wilson SJ, Panis M, Murphy MY, Jones CT, Bieniasz P, Rice CM. 2011. A diverse range of gene products are effectors of the type I interferon antiviral response. Nature 472:481–485. doi: 10.1038/nature09907. [DOI] [PMC free article] [PubMed] [Google Scholar]
- 5.de Veer MJ, Holko M, Frevel M, Walker E, Der S, Paranjape JM, Silverman RH, Williams BR. 2001. Functional classification of interferon-stimulated genes identified using microarrays. J Leukoc Biol 69:912–920. [PubMed] [Google Scholar]
- 6.Pfeffer LM. 2011. The role of nuclear factor kappaB in the interferon response. J Interferon Cytokine Res 31:553–559. doi: 10.1089/jir.2011.0028. [DOI] [PMC free article] [PubMed] [Google Scholar]
- 7.Blanc M, Hsieh WY, Robertson KA, Kropp KA, Forster T, Shui G, Lacaze P, Watterson S, Griffiths SJ, Spann NJ, Meljon A, Talbot S, Krishnan K, Covey DF, Wenk MR, Craigon M, Ruzsics Z, Haas J, Angulo A, Griffiths WJ, Glass CK, Wang Y, Ghazal P. 2013. The transcription factor STAT-1 couples macrophage synthesis of 25-hydroxycholesterol to the interferon antiviral response. Immunity 38:106–118. doi: 10.1016/j.immuni.2012.11.004. [DOI] [PMC free article] [PubMed] [Google Scholar]
- 8.Liu SY, Aliyari R, Chikere K, Li G, Marsden MD, Smith JK, Pernet O, Guo H, Nusbaum R, Zack JA, Freiberg AN, Su L, Lee B, Cheng G. 2013. Interferon-inducible cholesterol-25-hydroxylase broadly inhibits viral entry by production of 25-hydroxycholesterol. Immunity 38:92–105. doi: 10.1016/j.immuni.2012.11.005. [DOI] [PMC free article] [PubMed] [Google Scholar]
- 9.Anggakusuma Romero-Brey I, Berger C, Colpitts CC, Boldanova T, Engelmann M, Todt D, Perin PM, Behrendt P, Vondran FW, Xu S, Goffinet C, Schang LM, Heim MH, Bartenschlager R, Pietschmann T, Steinmann E. 2015. Interferon-inducible cholesterol-25-hydroxylase restricts hepatitis C virus replication through blockage of membranous web formation. Hepatology 62:702–714. doi: 10.1002/hep.27913. [DOI] [PubMed] [Google Scholar]
- 10.Chen Y, Wang S, Yi Z, Tian H, Aliyari R, Li Y, Chen G, Liu P, Zhong J, Chen X, Du P, Su L, Qin FX, Deng H, Cheng G. 2014. Interferon-inducible cholesterol-25-hydroxylase inhibits hepatitis C virus replication via distinct mechanisms. Sci Rep 4:7242. doi: 10.1038/srep07242. [DOI] [PMC free article] [PubMed] [Google Scholar]
- 11.Xiang Y, Tang JJ, Tao W, Cao X, Song BL, Zhong J. 2015. Identification of cholesterol 25-hydroxylase as a novel host restriction factor and a part of the primary innate immune responses against hepatitis C virus infection. J Virol 89:6805–6816. doi: 10.1128/JVI.00587-15. [DOI] [PMC free article] [PubMed] [Google Scholar]
- 12.Pezacki JP, Sagan SM, Tonary AM, Rouleau Y, Bélanger S, Supekova L, Su AI. 2009. Transcriptional profiling of the effects of 25-hydroxycholesterol on human hepatocyte metabolism and the antiviral state it conveys against the hepatitis C virus. BMC Chem Biol 9:2. doi: 10.1186/1472-6769-9-2. [DOI] [PMC free article] [PubMed] [Google Scholar]
- 13.Zhang Y, Song Z, Wang M, Lan M, Zhang K, Jiang P, Li Y, Bai J, Wang X. 2019. Cholesterol 25-hydroxylase negatively regulates porcine intestinal coronavirus replication by the production of 25-hydroxycholesterol. Vet Microbiol 231:129–138. doi: 10.1016/j.vetmic.2019.03.004. [DOI] [PMC free article] [PubMed] [Google Scholar]
- 14.Wang S, Li W, Hui H, Tiwari SK, Zhang Q, Croker BA, Rawlings S, Smith D, Carlin AF, Rana TM. 2020. Cholesterol 25-hydroxylase inhibits SARS-CoV-2 and other coronaviruses by depleting membrane cholesterol. EMBO J 39:e106057. doi: 10.15252/embj.2020106057. [DOI] [PMC free article] [PubMed] [Google Scholar]
- 15.Shibata N, Carlin AF, Spann NJ, Saijo K, Morello CS, McDonald JG, Romanoski CE, Maurya MR, Kaikkonen MU, Lam MT, Crotti A, Reichart D, Fox JN, Quehenberger O, Raetz CR, Sullards MC, Murphy RC, Merrill AH, Jr, Brown HA, Dennis EA, Fahy E, Subramaniam S, Cavener DR, Spector DH, Russell DW, Glass CK. 2013. 25-Hydroxycholesterol activates the integrated stress response to reprogram transcription and translation in macrophages. J Biol Chem 288:35812–35823. doi: 10.1074/jbc.M113.519637. [DOI] [PMC free article] [PubMed] [Google Scholar]
- 16.Arita M. 2014. Phosphatidylinositol-4 kinase III beta and oxysterol-binding protein accumulate unesterified cholesterol on poliovirus-induced membrane structure. Microbiol Immunol 58:239–256. doi: 10.1111/1348-0421.12144. [DOI] [PubMed] [Google Scholar]
- 17.Civra A, Francese R, Gamba P, Testa G, Cagno V, Poli G, Lembo D. 2018. 25-Hydroxycholesterol and 27-hydroxycholesterol inhibit human rotavirus infection by sequestering viral particles into late endosomes. Redox Biol 19:318–330. doi: 10.1016/j.redox.2018.09.003. [DOI] [PMC free article] [PubMed] [Google Scholar]
- 18.Abrams ME, Johnson KA, Perelman SS, Zhang LS, Endapally S, Mar KB, Thompson BM, McDonald JG, Schoggins JW, Radhakrishnan A, Alto NM. 2020. Oxysterols provide innate immunity to bacterial infection by mobilizing cell surface accessible cholesterol. Nat Microbiol 5:929–942. doi: 10.1038/s41564-020-0701-5. [DOI] [PMC free article] [PubMed] [Google Scholar]
- 19.Gold ES, Diercks AH, Podolsky I, Podyminogin RL, Askovich PS, Treuting PM, Aderem A. 2014. 25-Hydroxycholesterol acts as an amplifier of inflammatory signaling. Proc Natl Acad Sci USA 111:10666–10671. doi: 10.1073/pnas.1404271111. [DOI] [PMC free article] [PubMed] [Google Scholar]
- 20.Koarai A, Yanagisawa S, Sugiura H, Ichikawa T, Kikuchi T, Furukawa K, Akamatsu K, Hirano T, Nakanishi M, Matsunaga K, Minakata Y, Ichinose M. 2012. 25-Hydroxycholesterol enhances cytokine release and Toll-like receptor 3 response in airway epithelial cells. Respir Res 13:63. doi: 10.1186/1465-9921-13-63. [DOI] [PMC free article] [PubMed] [Google Scholar]
- 21.Reboldi A, Dang EV, McDonald JG, Liang G, Russell DW, Cyster JG. 2014. Inflammation. 25-Hydroxycholesterol suppresses interleukin-1-driven inflammation downstream of type I interferon. Science 345:679–684. doi: 10.1126/science.1254790. [DOI] [PMC free article] [PubMed] [Google Scholar]
- 22.Dang EV, McDonald JG, Russell DW, Cyster JG. 2017. Oxysterol restraint of cholesterol synthesis prevents AIM2 inflammasome activation. Cell 171:1057–1071.e11. doi: 10.1016/j.cell.2017.09.029. [DOI] [PMC free article] [PubMed] [Google Scholar]
- 23.Civra A, Colzani M, Cagno V, Francese R, Leoni V, Aldini G, Lembo D, Poli G. 2020. Modulation of cell proteome by 25-hydroxycholesterol and 27-hydroxycholesterol: a link between cholesterol metabolism and antiviral defense. Free Radic Biol Med 149:30–36. doi: 10.1016/j.freeradbiomed.2019.08.031. [DOI] [PMC free article] [PubMed] [Google Scholar]
- 24.Arias C, Weisburd B, Stern-Ginossar N, Mercier A, Madrid AS, Bellare P, Holdorf M, Weissman JS, Ganem D. 2014. KSHV 2.0: a comprehensive annotation of the Kaposi’s sarcoma-associated herpesvirus genome using next-generation sequencing reveals novel genomic and functional features. PLoS Pathog 10:e1003847. doi: 10.1371/journal.ppat.1003847. [DOI] [PMC free article] [PubMed] [Google Scholar]
- 25.Savidis G, McDougall WM, Meraner P, Perreira JM, Portmann JM, Trincucci G, John SP, Aker AM, Renzette N, Robbins DR, Guo Z, Green S, Kowalik TF, Brass AL. 2016. Identification of Zika virus and dengue virus dependency factors using functional genomics. Cell Rep 16:232–246. doi: 10.1016/j.celrep.2016.06.028. [DOI] [PubMed] [Google Scholar]
- 26.Raggo C, Ruhl R, McAllister S, Koon H, Dezube BJ, Früh K, Moses AV. 2005. Novel cellular genes essential for transformation of endothelial cells by Kaposi’s sarcoma-associated herpesvirus. Cancer Res 65:5084–5095. doi: 10.1158/0008-5472.CAN-04-2822. [DOI] [PubMed] [Google Scholar]
- 27.Kramer A, Green J, Pollard J, Jr, Tugendreich S. 2014. Causal analysis approaches in Ingenuity Pathway Analysis. Bioinformatics 30:523–530. doi: 10.1093/bioinformatics/btt703. [DOI] [PMC free article] [PubMed] [Google Scholar]
- 28.Repa JJ, Liang G, Ou J, Bashmakov Y, Lobaccaro JM, Shimomura I, Shan B, Brown MS, Goldstein JL, Mangelsdorf DJ. 2000. Regulation of mouse sterol regulatory element-binding protein-1c gene (SREBP-1c) by oxysterol receptors, LXRalpha and LXRbeta. Genes Dev 14:2819–2830. doi: 10.1101/gad.844900. [DOI] [PMC free article] [PubMed] [Google Scholar]
- 29.Adams CM, Reitz J, De Brabander JK, Feramisco JD, Li L, Brown MS, Goldstein JL. 2004. Cholesterol and 25-hydroxycholesterol inhibit activation of SREBPs by different mechanisms, both involving SCAP and Insigs. J Biol Chem 279:52772–52780. doi: 10.1074/jbc.M410302200. [DOI] [PubMed] [Google Scholar]
- 30.Bhatt AP, Jacobs SR, Freemerman AJ, Makowski L, Rathmell JC, Dittmer DP, Damania B. 2012. Dysregulation of fatty acid synthesis and glycolysis in non-Hodgkin lymphoma. Proc Natl Acad Sci USA 109:11818–11823. doi: 10.1073/pnas.1205995109. [DOI] [PMC free article] [PubMed] [Google Scholar]
- 31.Paik JH, Jang JY, Jeon YK, Kim WY, Kim TM, Heo DS, Kim CW. 2011. MicroRNA-146a downregulates NFκB activity via targeting TRAF6 and functions as a tumor suppressor having strong prognostic implications in NK/T cell lymphoma. Clin Cancer Res 17:4761–4771. doi: 10.1158/1078-0432.CCR-11-0494. [DOI] [PubMed] [Google Scholar]
- 32.Amrouche L, Desbuissons G, Rabant M, Sauvaget V, Nguyen C, Benon A, Barre P, Rabate C, Lebreton X, Gallazzini M, Legendre C, Terzi F, Anglicheau D. 2017. MicroRNA-146a in human and experimental ischemic AKI: CXCL8-dependent mechanism of action. J Am Soc Nephrol 28:479–493. doi: 10.1681/ASN.2016010045. [DOI] [PMC free article] [PubMed] [Google Scholar]
- 33.Delecluse HJ, Pich D, Hilsendegen T, Baum C, Hammerschmidt W. 1999. A first-generation packaging cell line for Epstein-Barr virus-derived vectors. Proc Natl Acad Sci USA 96:5188–5193. doi: 10.1073/pnas.96.9.5188. [DOI] [PMC free article] [PubMed] [Google Scholar]
- 34.Kalla M, Hammerschmidt W. 2012. Human B cells on their route to latent infection – early but transient expression of lytic genes of Epstein-Barr virus. Eur J Cell Biol 91:65–69. doi: 10.1016/j.ejcb.2011.01.014. [DOI] [PubMed] [Google Scholar]
- 35.Thorley-Lawson DA. 2015. EBV persistence—introducing the virus. Curr Top Microbiol Immunol 390:151–209. doi: 10.1007/978-3-319-22822-8_8. [DOI] [PMC free article] [PubMed] [Google Scholar]
- 36.Pich D, Mrozek-Gorska P, Bouvet M, Sugimoto A, Akidil E, Grundhoff A, Hamperl S, Ling PD, Hammerschmidt W. 2019. First days in the life of naive human B lymphocytes infected with Epstein-Barr virus. mBio 10:e01723-19. doi: 10.1128/mBio.01723-19. [DOI] [PMC free article] [PubMed] [Google Scholar]
- 37.Mrozek-Gorska P, Buschle A, Pich D, Schwarzmayr T, Fechtner R, Scialdone A, Hammerschmidt W. 2019. Epstein-Barr virus reprograms human B lymphocytes immediately in the prelatent phase of infection. Proc Natl Acad Sci USA 116:16046–16055. doi: 10.1073/pnas.1901314116. [DOI] [PMC free article] [PubMed] [Google Scholar]
- 38.Steinbrück L, Gustems M, Medele S, Schulz TF, Lutter D, Hammerschmidt W. 2015. K1 and K15 of Kaposi’s sarcoma-associated herpesvirus are partial functional homologues of latent membrane protein 2A of Epstein-Barr virus. J Virol 89:7248–7261. doi: 10.1128/JVI.00839-15. [DOI] [PMC free article] [PubMed] [Google Scholar]
- 39.Uchida J, Yasui T, Takaoka-Shichijo Y, Muraoka M, Kulwichit W, Raab-Traub N, Kikutani H. 1999. Mimicry of CD40 signals by Epstein-Barr virus LMP1 in B lymphocyte responses. Science 286:300–303. doi: 10.1126/science.286.5438.300. [DOI] [PubMed] [Google Scholar]
- 40.Kim JH, Kim WS, Kang JH, Lim HY, Ko YH, Park C. 2007. Egr-1, a new downstream molecule of Epstein-Barr virus latent membrane protein 1. FEBS Lett 581:623–628. doi: 10.1016/j.febslet.2007.01.020. [DOI] [PubMed] [Google Scholar]
- 41.Lin KM, Lin SJ, Lin JH, Lin PY, Teng PL, Wu HE, Yeh TH, Wang YP, Chen MR, Tsai CH. 2020. Dysregulation of dual-specificity phosphatases by Epstein-Barr virus LMP1 and its impact on lymphoblastoid cell line survival. J Virol 94:e01837-19. doi: 10.1128/JVI.01837-19. [DOI] [PMC free article] [PubMed] [Google Scholar]
- 42.Kang MS, Kieff E. 2015. Epstein-Barr virus latent genes. Exp Mol Med 47:e131. doi: 10.1038/emm.2014.84. [DOI] [PMC free article] [PubMed] [Google Scholar]
- 43.Felton-Edkins ZA, Kondrashov A, Karali D, Fairley JA, Dawson CW, Arrand JR, Young LS, White RJ. 2006. Epstein-Barr virus induces cellular transcription factors to allow active expression of EBER genes by RNA polymerase III. J Biol Chem 281:33871–33880. doi: 10.1074/jbc.M600468200. [DOI] [PubMed] [Google Scholar]
- 44.Lu H, Talbot S, Robertson KA, Watterson S, Forster T, Roy D, Ghazal P. 2015. Rapid proteasomal elimination of 3-hydroxy-3-methylglutaryl-CoA reductase by interferon-gamma in primary macrophages requires endogenous 25-hydroxycholesterol synthesis. Steroids 99:219–229. doi: 10.1016/j.steroids.2015.02.022. [DOI] [PMC free article] [PubMed] [Google Scholar]
- 45.Smith N, Tierney R, Wei W, Vockerodt M, Murray PG, Woodman CB, Rowe M. 2013. Induction of interferon-stimulated genes on the IL-4 response axis by Epstein-Barr virus infected human B cells; relevance to cellular transformation. PLoS One 8:e64868. doi: 10.1371/journal.pone.0064868. [DOI] [PMC free article] [PubMed] [Google Scholar]
- 46.Gold ES, Ramsey SA, Sartain MJ, Selinummi J, Podolsky I, Rodriguez DJ, Moritz RL, Aderem A. 2012. ATF3 protects against atherosclerosis by suppressing 25-hydroxycholesterol-induced lipid body formation. J Exp Med 209:807–817. doi: 10.1084/jem.20111202. [DOI] [PMC free article] [PubMed] [Google Scholar]
- 47.Korhonen E, Piippo N, Hytti M, Hyttinen JMT, Kaarniranta K, Kauppinen A. 2019. SQSTM1/p62 regulates the production of IL-8 and MCP-1 in IL-1β-stimulated human retinal pigment epithelial cells. Cytokine 116:70–77. doi: 10.1016/j.cyto.2018.12.015. [DOI] [PubMed] [Google Scholar]
- 48.Skalsky RL, Cullen BR. 2015. EBV noncoding RNAs. Curr Top Microbiol Immunol 391:181–217. doi: 10.1007/978-3-319-22834-1_6. [DOI] [PMC free article] [PubMed] [Google Scholar]
- 49.Nanbo A, Inoue K, Adachi-Takasawa K, Takada K. 2002. Epstein-Barr virus RNA confers resistance to interferon-alpha-induced apoptosis in Burkitt’s lymphoma. EMBO J 21:954–965. doi: 10.1093/emboj/21.5.954. [DOI] [PMC free article] [PubMed] [Google Scholar]
- 50.Li A, Zhang XS, Jiang JH, Wang HH, Liu XQ, Pan ZG, Zeng YX. 2005. Transcriptional expression of RPMS1 in nasopharyngeal carcinoma and its oncogenic potential. Cell Cycle 4:304–309. [PubMed] [Google Scholar]
- 51.Stiles AR, McDonald JG, Bauman DR, Russell DW. 2009. CYP7B1: one cytochrome P450, two human genetic diseases, and multiple physiological functions. J Biol Chem 284:28485–28489. doi: 10.1074/jbc.R109.042168. [DOI] [PMC free article] [PubMed] [Google Scholar]
- 52.Russell DW. 2003. The enzymes, regulation, and genetics of bile acid synthesis. Annu Rev Biochem 72:137–174. doi: 10.1146/annurev.biochem.72.121801.161712. [DOI] [PubMed] [Google Scholar]
- 53.Cyster JG, Dang EV, Reboldi A, Yi T. 2014. 25-Hydroxycholesterols in innate and adaptive immunity. Nat Rev Immunol 14:731–743. doi: 10.1038/nri3755. [DOI] [PubMed] [Google Scholar]
- 54.Raghu H, Sharma-Walia N, Veettil MV, Sadagopan S, Caballero A, Sivakumar R, Varga L, Bottero V, Chandran B. 2007. Lipid rafts of primary endothelial cells are essential for Kaposi’s sarcoma-associated herpesvirus/human herpesvirus 8-induced phosphatidylinositol 3-kinase and RhoA-GTPases critical for microtubule dynamics and nuclear delivery of viral DNA but dispensable for binding and entry. J Virol 81:7941–7959. doi: 10.1128/JVI.02848-06. [DOI] [PMC free article] [PubMed] [Google Scholar]
- 55.Wang X, Zhu N, Li W, Zhu F, Wang Y, Yuan Y. 2015. Mono-ubiquitylated ORF45 mediates association of KSHV particles with internal lipid rafts for viral assembly and egress. PLoS Pathog 11:e1005332. doi: 10.1371/journal.ppat.1005332. [DOI] [PMC free article] [PubMed] [Google Scholar]
- 56.Lange PT, Lagunoff M, Tarakanova VL. 2019. Chewing the fat: the conserved ability of DNA viruses to hijack cellular lipid metabolism. Viruses 11:119. doi: 10.3390/v11020119. [DOI] [PMC free article] [PubMed] [Google Scholar]
- 57.Magoro T, Dandekar A, Jennelle LT, Bajaj R, Lipkowitz G, Angelucci AR, Bessong PO, Hahn YS. 2019. IL-1beta/TNF-alpha/IL-6 inflammatory cytokines promote STAT1-dependent induction of CH25H in Zika virus-infected human macrophages. J Biol Chem 294:14591–14602. doi: 10.1074/jbc.RA119.007555. [DOI] [PMC free article] [PubMed] [Google Scholar]
- 58.Li C, Deng YQ, Wang S, Ma F, Aliyari R, Huang XY, Zhang NN, Watanabe M, Dong HL, Liu P, Li XF, Ye Q, Tian M, Hong S, Fan J, Zhao H, Li L, Vishlaghi N, Buth JE, Au C, Liu Y, Lu N, Du P, Qin FX, Zhang B, Gong D, Dai X, Sun R, Novitch BG, Xu Z, Qin CF, Cheng G. 2017. 25-Hydroxycholesterol protects host against Zika virus infection and its associated microcephaly in a mouse model. Immunity 46:446–456. doi: 10.1016/j.immuni.2017.02.012. [DOI] [PMC free article] [PubMed] [Google Scholar]
- 59.Jochum S, Ruiss R, Moosmann A, Hammerschmidt W, Zeidler R. 2012. RNAs in Epstein-Barr virions control early steps of infection. Proc Natl Acad Sci USA 109:E1396–E1404. doi: 10.1073/pnas.1115906109. [DOI] [PMC free article] [PubMed] [Google Scholar]
- 60.Wang J, Duncan D, Shi Z, Zhang B. 2013. WEB-based GEne SeT AnaLysis Toolkit (WebGestalt): update 2013. Nucleic Acids Res 41:W77–W83. doi: 10.1093/nar/gkt439. [DOI] [PMC free article] [PubMed] [Google Scholar]
- 61.Love MI, Huber W, Anders S. 2014. Moderated estimation of fold change and dispersion for RNA-seq data with DESeq2. Genome Biol 15:550. doi: 10.1186/s13059-014-0550-8. [DOI] [PMC free article] [PubMed] [Google Scholar]
- 62.Blighe K, Rana S, Lewis M. 2021. EnhancedVolcano: publication-ready volcano plots with enhanced coloring and labeling. R package version 1.10.0.
- 63.Gu Z, Eils R, Schlesner M. 2016. Complex heatmaps reveal patterns and correlations in multidimensional genomic data. Bioinformatics 32:2847–2849. doi: 10.1093/bioinformatics/btw313. [DOI] [PubMed] [Google Scholar]
- 64.Ramirez F, Ryan DP, Gruning B, Bhardwaj V, Kilpert F, Richter AS, Heyne S, Dundar F, Manke T. 2016. deepTools2: a next generation web server for deep-sequencing data analysis. Nucleic Acids Res 44:W160–W165. doi: 10.1093/nar/gkw257. [DOI] [PMC free article] [PubMed] [Google Scholar]
- 65.Robinson JT, Thorvaldsdottir H, Winckler W, Guttman M, Lander ES, Getz G, Mesirov JP. 2011. Integrative genomics viewer. Nat Biotechnol 29:24–26. doi: 10.1038/nbt.1754. [DOI] [PMC free article] [PubMed] [Google Scholar]
Associated Data
This section collects any data citations, data availability statements, or supplementary materials included in this article.
Supplementary Materials
Expression changes in KSHV genes caused by 25HC in HUVEC de novo infection at 2 dpi. Download Table S1, DOCX file, 0.03 MB (29.3KB, docx) .
This is a work of the U.S. Government and is not subject to copyright protection in the United States. Foreign copyrights may apply.
Virus-induced host genes that are suppressed by 25HC treatment in HUVEC and overlap with an siRNA screen for host-dependent factors of dengue virus (25). Download Table S2, DOCX file, 0.01 MB (14.6KB, docx) .
This is a work of the U.S. Government and is not subject to copyright protection in the United States. Foreign copyrights may apply.
Single knockdown of candidate genes in HUVEC. Bead-based quantitation of secreted IL-8 in HUVEC supernatant at 24 h postnucleofection of siIL8 (A). Paired t test was performed. Immunoassay was also performed for secreted IL-1α at indicated time points (B) after siIL1α depletion with or without 25HC treatment (C). Paired t test was performed. RT-qPCR of HUVEC (n = 3 to 5) at 2 dpi after KSHV de novo infection and siRNA depletion of single gene targets to measure viral transcripts (D) LANA and (E) RTA. One-way ANOVA and posthoc t test with Bonferroni correction was performed, P values are indicated as follows: *, P ≤ 0.05; **, P ≤ 0.01; ***, P ≤ 0.001. Download FIG S1, EPS file, 2.0 MB (2MB, eps) .
This is a work of the U.S. Government and is not subject to copyright protection in the United States. Foreign copyrights may apply.
(A) Cell Titer Glo assay for dose escalation of 25HC in uninfected B cell-enriched PBMC (n = 2). (B) Comparison of EBV gene expression of LCL to Raji cell line. (C) Based on annexin V and 7-AAD staining, cells in the “LCL” and “PBMC” gates were designated healthy or apoptotic subsets. These subsets were quantified as a percentage of total cells in the designated gates. Percentages are averages from three biological replicates of postinfection treated PBMCs. Unpaired t test was performed for each subgroup with P values are as follows: *, P ≤ 0.05; **, P ≤ 0.01; ***, P ≤ 0.001. (D) Histogram of representative flow cytometry data from LCLs (red) derived from pretreated PBMCs (blue). (E) Comparison of GFP (+) PBMCs in pretreated cells at 5 dpi. Unpaired t test was performed (*, P ≤ 0.05). (F) Effect of 25HC on type I (e.g., 5S), type II (e.g., 7SL), and type III (e.g., U6) pol III host transcripts, as measured using RT-qPCR. Statistical analysis using unpaired t test was performed (*, P ≤ 0.05). (G) RT-qPCR for candidate target genes of uninfected B cells after overnight incubation with 25HC. Statistical analysis using unpaired t test did not show any significant differences. Download FIG S2, EPS file, 2.3 MB (2.3MB, eps) .
This is a work of the U.S. Government and is not subject to copyright protection in the United States. Foreign copyrights may apply.
Control experiment to confirm interferon induction of PBMCs from three different donors by measuring (A) ISG15 and (B) IRF1 gene expression assayed with RT-qPCR. Shown here are P values for unpaired t tests. Download FIG S3, EPS file, 2.0 MB (2MB, eps) .
This is a work of the U.S. Government and is not subject to copyright protection in the United States. Foreign copyrights may apply.
EBV transcripts in B cell-enriched PBMC for interferon induction experiment Table S3, DOCX file, 0.01 MB (14.6KB, docx) .
This is a work of the U.S. Government and is not subject to copyright protection in the United States. Foreign copyrights may apply.
Comparison of changes in mevalonate gene expression in the HUVEC RNA-Seq data with HeLa proteomics data, both with 25HC treatment (23). Downregulated in both HUVEC (RNA) and HeLa (protein) is shown in red. Downregulated in HeLa (protein) and upregulated in HUVEC (RNA) is shown in blue. Download FIG S4, EPS file, 1.8 MB (1.8MB, eps) .
This is a work of the U.S. Government and is not subject to copyright protection in the United States. Foreign copyrights may apply.
Effect of 7α25HC treatment in HUVEC. (A) RT-qPCR to measure gene expression of some candidate target genes in HUVEC after addition of exogenous 7α25HC (from Cayman Chemical [C] or from Sigma [S]), normalized to the values for vehicle control (n = 3 to 5). Results of t tests are shown here (*, P value of ≤0.05). (B) Immunoblotting for CYP7B1 protein expression in 30 μg total cell lysates of primary endothelial cells HUVEC (n = 3) and HDLEC compared to positive controls HEK293 and THP1. Download FIG S5, EPS file, 2.1 MB (2.1MB, eps) .
This is a work of the U.S. Government and is not subject to copyright protection in the United States. Foreign copyrights may apply.
Data Availability Statement
RNA sequencing data for viral and human expression are accessible at Gene Expression Omnibus (GEO): GSE165328.