

Abstract
“Stem-like” TCF1+ CD8+ T cells (TSL) are necessary for long-term maintenance of T cell responses and the efficacy of immunotherapy but, as tumors contain signals that should drive T-cell terminal-differentiation, how these cells are maintained in tumors remains unclear. In this study, we found that a small number of TCF1+ tumor-specific CD8+ T cells were present in lung tumors throughout their development. Yet, most intratumoral T cells differentiated as tumors progressed, corresponding with an immunologic shift in the tumor microenvironment (TME) from “hot” (T cell-inflamed) to “cold” (non-T cell-inflamed). By contrast, most tumor-specific CD8+ T cells in tumor-draining lymph nodes (dLNs) had functions and gene expression signatures similar to TSL from chronic LCMV infection, and this population was stable over time, despite the changes in the TME. dLN T cells were the developmental precursors of, and were clonally related to, their more differentiated intratumoral counterparts. Our data support the hypothesis that dLN T cells are the developmental precursors of the TCF1+ T cells in tumors which are maintained by continuous migration. Finally, CD8+ T cells similar to TSL were also present in LNs from lung adenocarcinoma patients, suggesting a similar model may be relevant in human disease. Thus, we propose that the dLN TSL reservoir has a critical function in sustaining antitumor T cells during tumor development and protecting them from the terminal differentiation that occurs in the TME.
One sentence summary
Tumor-specific CD8+ T cells in stable tumor-draining lymph node reservoir are clonally and developmentally related to those in tumors.
Introduction:
Non-small cell lung cancer (NSCLC) is amongst the deadliest cancers (2), but immune checkpoint inhibitors (ICIs), like anti-PD-1 and anti-PD-L1, have provided durable responses in ~20% of treated NSCLC patients (3). Several parameters correlate positively with response, including the presence of an immunologically “hot” tumor microenvironment (TME; contains infiltrating CD3+ T cells, also called T-cell inflamed), infiltration of PD-1+ CD8+ T cells, PD-L1 immunostaining on tumor and immune cells, and increased tumor mutational burden/neoantigens (4–7). These observations are in line with the idea that PD-1 blockade potentiates the function of “exhausted” PD-1+ tumor-infiltrating CD8+ T cells in hot tumors (8). By contrast, patients with immunologically “cold” tumors (also called “immune excluded” or “non-T-cell inflamed”) respond poorly to immunotherapy, and the status of their anti-tumor CD8+ T cell response is uncertain (4–7). As response rates to immunotherapy are low, particularly for patients with cold tumors, a better understanding of the CD8+ T cell biology associated with hot and cold tumors is essential.
CD8+ T cell exhaustion is a progressive process of terminal differentiation (9–12). Exhausted T cells (TEX) can be characterized by the loss of proliferative potential and effector functions (ability to produce TNFα and IFNγ), as well as increased expression of several inhibitory receptors (e.g., PD-1 and Tim3) and transcription factors (e.g., Blimp-1, Tox, and Eomes) (9, 12–30). TEX cells are derived from less differentiated precursors, including PD-1mid CXCR5+ SLAMF6+ TCF1+ “stem-like” T (TSL) cells (12, 21, 24, 31–40). TCF1+ TSL cells have at least two functions in chronic immune responses: maintaining the ongoing T cell response and mediating therapeutic responses to PD-1 blockade (24, 31, 33, 34, 41). Expression of TCF1 is necessary for both functions (12, 34), and thus, provides an important tool for identifying TSL cells.
TCF1+ CD8+ T cells are present in tumors, and their presence correlates with better outcomes following immunotherapy (10, 12, 21, 24, 31, 33, 34, 37, 40–43). Yet, tumors are rich in signals that promote the exhaustion of CD8+ T cells, like persistent antigen exposure (15, 44). This raises a fundamental question: how are intratumoral TCF1+ CD8+ T cells maintained over the months-to-years of natural tumor development? Moreover, because TCF1 expression is required for maintenance of T cell populations, do immunologically cold tumors result from a loss of intratumoral TCF1+ CD8+ T cells.
The KP (Kraslox-stop-lox (lsl)-G12D/+;p53flox/flox) model is a genetically engineered mouse (GEM) model of cancer that faithfully recapitulates the histological, transcriptomic, epigenomic, and genetic features of a developing human lung adenocarcinoma and has played a fundamental role in our understanding of how human lung cancer develops (45–48). Tumors in the KP model can be programmed to express neoantigens, which allows for the investigation of tumor-specific T cell responses in developing tumors (49–59). Early neoantigen-expressing KP lung tumors are infiltrated by tumor-specific CD8+ T cells and have an immunologically hot TME. However, as tumors develop, they take on an immunologically cold TME, with T cells being excluded from the tumor parenchyma and restricted to tertiary lymphoid structures (TLS) (49, 60). Thus, the KP model provided us with an opportunity to investigate the differences between T cells from hot and cold tumor microenvironments, and to assess the mechanisms for how tumor-specific CD8+ T cells are maintained over the course of tumor growth.
Results:
Tumor-specific TCF1+CD8+ T cells are present throughout disease progression
To study tumor-specific CD8+ T cell responses in neoantigen-expressing lung tumors, we infected KP-NINJA mice (KP × R26-NINJA × CCSP-rtTA Tg) intratracheally (i.t.) with adeno- or lentiviruses expressing Cre alone (Ad5mSPC-Cre or lenti-Cre) (Figure 1A)(59, 61). In this model, Cre-expression in infected lung epithelial cells activates Kras G12D and eliminates Trp53. Expression of the neoantigens in tumor cells (GP33–43 and 66–77 from the LCMV glycoprotein) is initiated by doxycycline and tamoxifen (Dox/Tam) treatment starting 7–10 days post infection (Figure 1B). Cre-exposed cells remain neoantigen negative until Dox/Tam administration, allowing for temporal dissociation of tumor initiation and neoantigen induction. Tumors develop progressively after initiation with tumor-specific CD8+ T cells detectable as early as 8 weeks p.i. and large, macroscopically visible lung tumors by 16–20 weeks p.i. (62).
Figure 1: Tumor-specific TCF1+CD8+ T cells are present throughout disease progression in autochthonous KP-NINJA lung tumors.
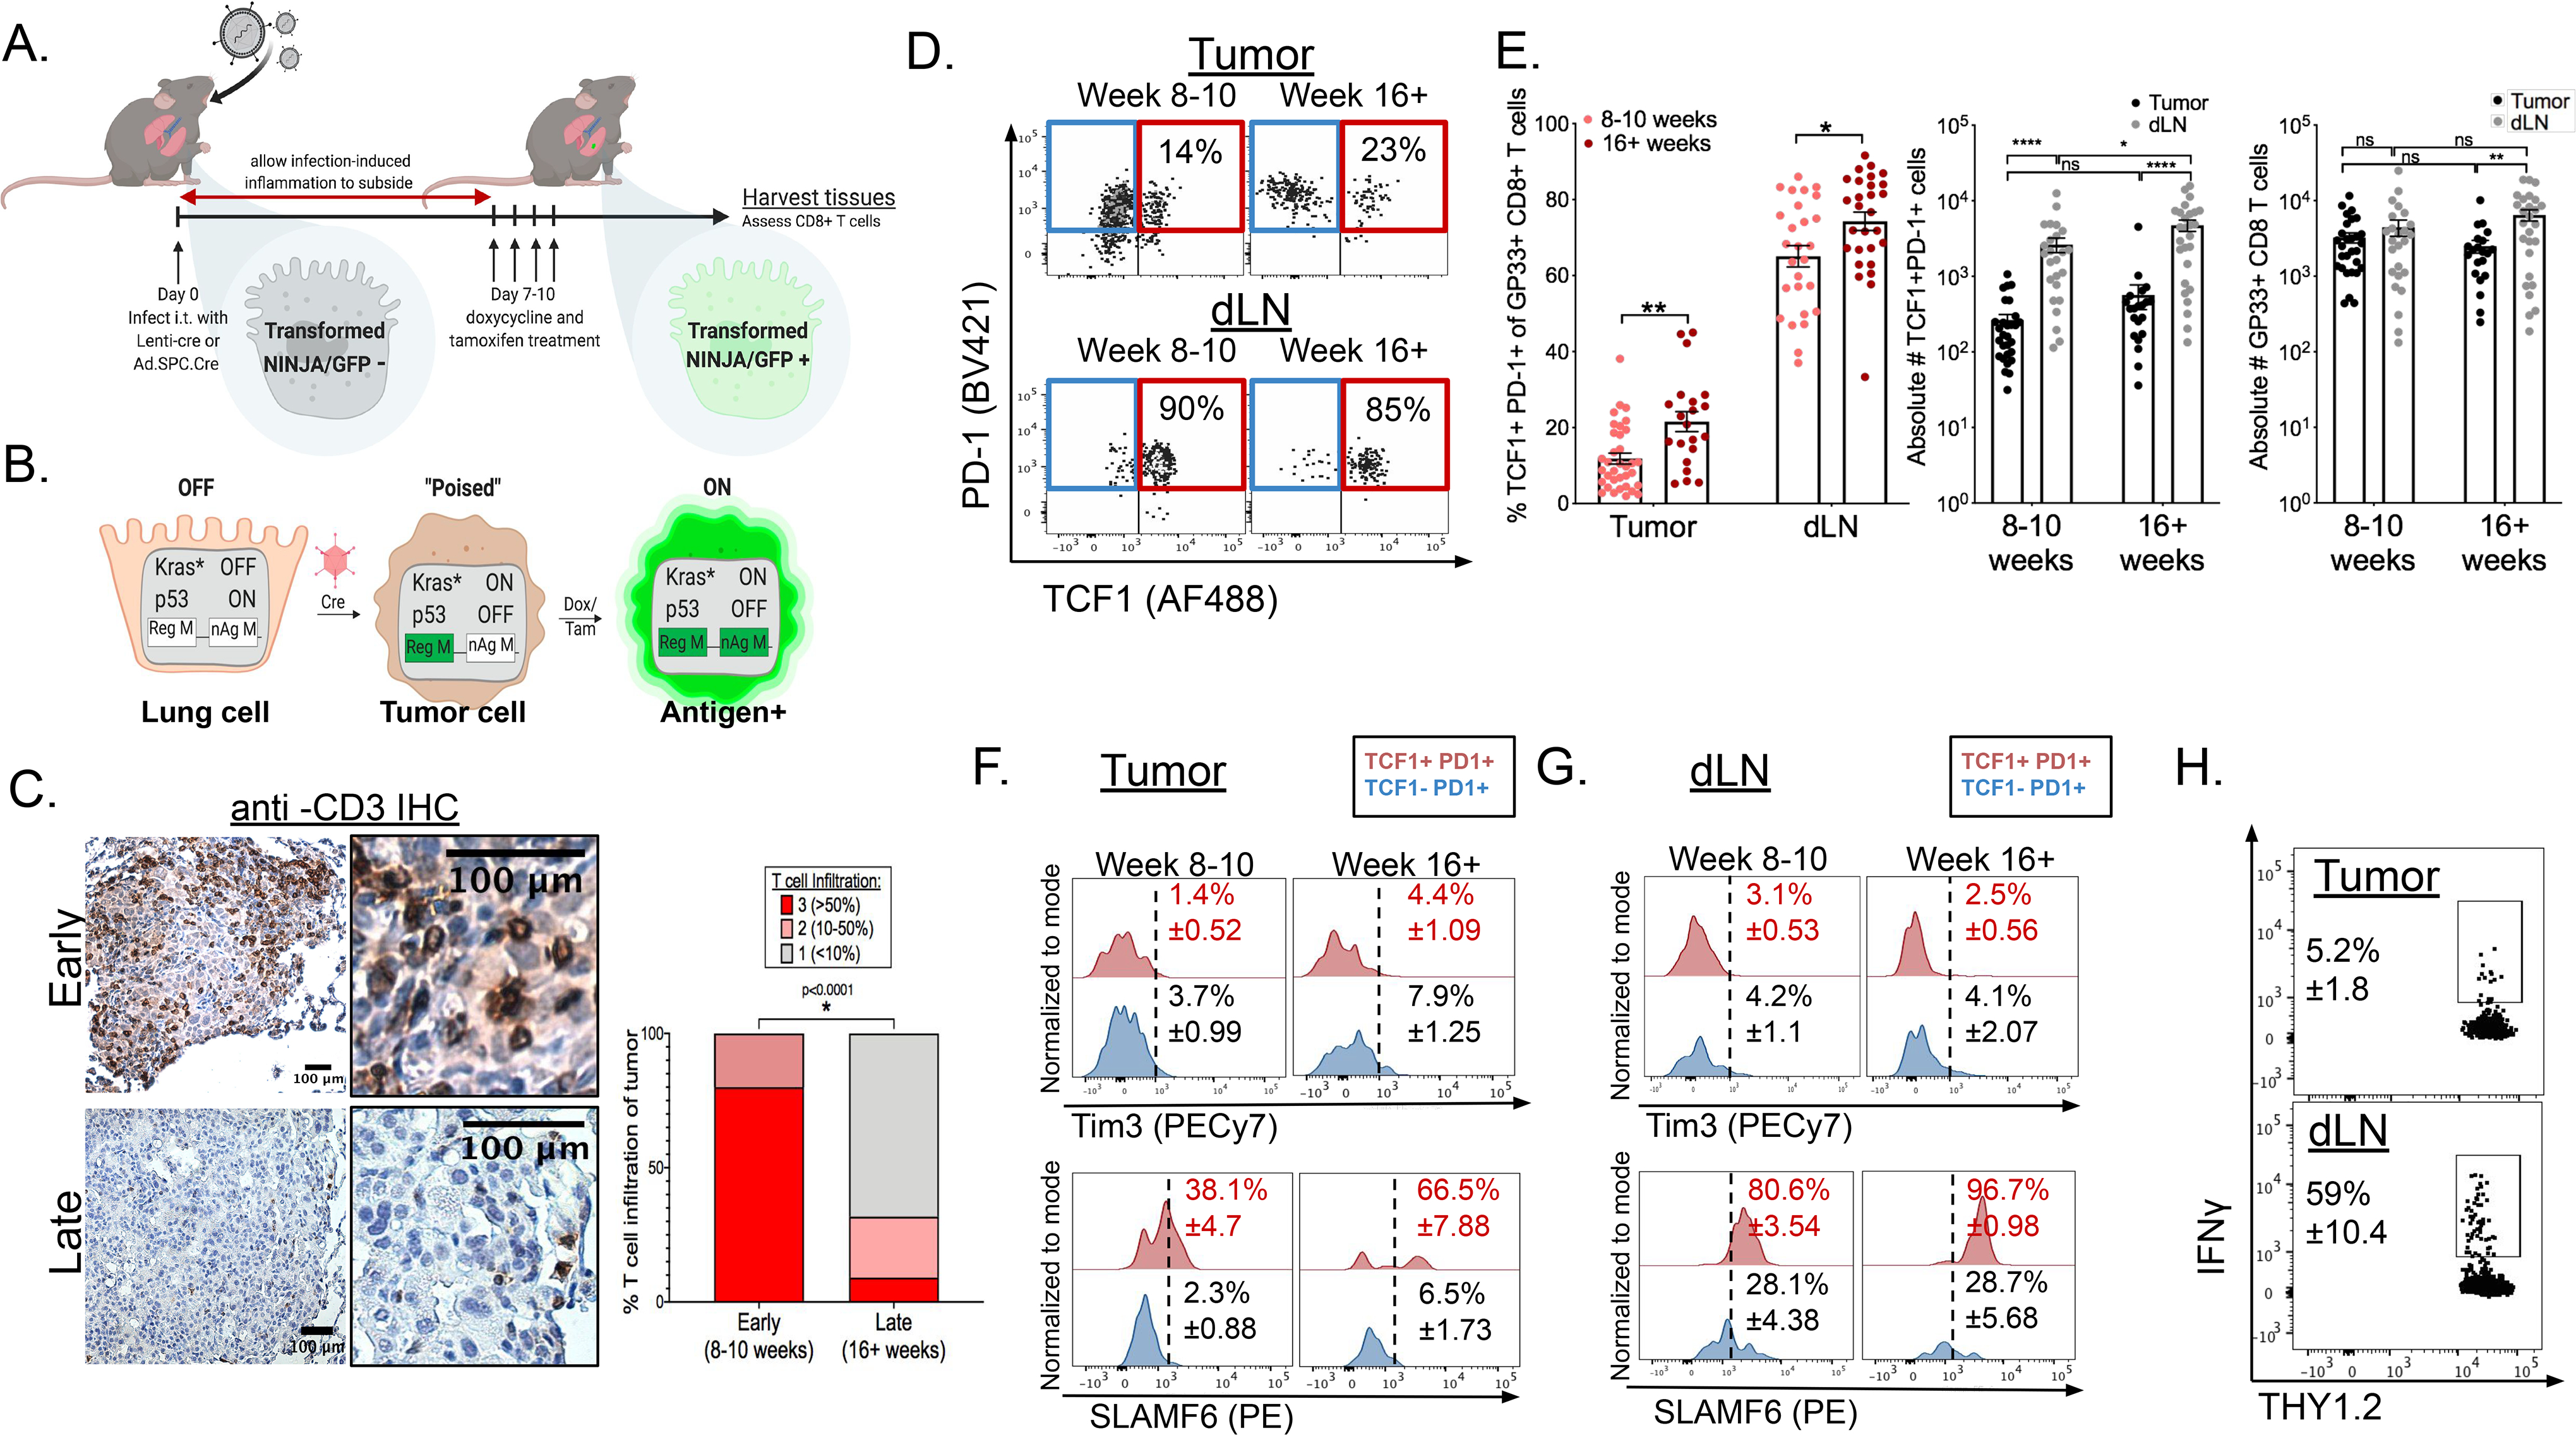
(A) Experimental setup of KP-NINJA tumor induction in which doxycycline and tamoxifen treatment is administered on days 7–10 after initial infection. (B) Schematic detailing the genetic recombination events in KP-NINJA system. (C) De-identified, anti-CD3 immunohistochemistry stained KP-NINJA tumor-bearing lungs were scored blindly for level of T cell infiltration (3=>50%;2=10–50%;1=<10%). Scores were compared between early (8–10 weeks post infection; n=10) and late (16+ weeks post infection; n=22) tumors. p=<0.0001 by unpaired t-test. (D) Representative flow cytometry dot plots displaying extracellular expression of PD-1 and intracellular expression of TCF1 on tissue GP33-specific CD8+ T cells from the tumors (top) and dLNs (bottom) at early (8–10 weeks) and late (16+ weeks) time points after infection, cells pre-gated on singlets and THY1.2+CD8+i.v.CD45−GP33-loaded MHCI tetramer+ as shown in Figure S1A. (E) Left panel: Percent TCF1+PD-1+CD8+ T cells of total GP33-specific CD8+ T cells (**p=0.0008 tumor; *p=0.0160 dLN). Center panel: Absolute numbers of TCF1+PD-1+CD8+ T cells (*p=0.0415; ****p=<0.0001), and absolute number of total GP33-specific (GP33 loaded MHC I tetramer+) CD8+ T cells (**p=0.0041) in tumors (black) and dLNs (gray). Mean number of TSL= 264 ± 48 in tumor vs. 2,630 ± 573 in dLN 8–10 weeks p.i. and 567 ± 204 in tumor vs. 4,730 ± 807 in dLN at 16+ weeks p.i. (F-G) Representative histograms displaying extracellular Tim3 expression (top) and SLAMF6 expression (bottom) of TCF1−PD-1+ vs. TCF1+PD-1+ tumor-specific CD8+ T cells at early (8–10 weeks) and late (16+ weeks) after infection in tumors (F) and dLNs (G). Data from 8 (early) and 5 (late) independent experiments: n=29 tumors at 8–10 weeks p.i.;n=21 tumors at 16+ weeks p.i.; n=25 dLN at 8–10 weeks p.i.;n=27 dLN at 16+ weeks p.i. Statistics based on two-tailed, unpaired t-test. Mean and SEM reported in text. (H) Representative dot plots showing ex vivo IFNγ production of tumor (top) and dLN (bottom) cells following GP33–41 peptide re-stimulation, pre-gated on intravascular CD45- singlets, CD45.1−THY1.2+ CD8+. Data normalized to the frequency of GP33-loaded Tetramer+ CD8+ T cells in lung tissue or dLN. Representative of 2 independent experiments; n=7 **p=0.005.
Previous studies have shown a shift from hot to cold tumors between early and late tumors (49, 60). To confirm this, we quantified T-cell infiltration by CD3 immunohistochemical (IHC) staining in 8 and 16–20 week tumors. Tumors in the KP-NINJA model underwent a transition from an immunologically hot to an immunologically cold TME (Figure 1C). This shift was not due to loss of tumor antigens, as cell lines made from 20 week tumors expressed neoantigens had inducible expression of MHC class I and PD-L1 and elicited GP33- and GP66-specific CD8+ and CD4 T cell responses (respectively) after transplant (62). Thus, we hypothesized that the shift from the hot to cold TME might reflect a global exhaustion of tumor-specific CD8+ T cells in animals at late timepoints.
To test our hypothesis, we analyzed the expression of TCF1 and PD-1 on lung-tissue tumor-specific CD8+ T cells from early (8–10 weeks) and late (16+ weeks) tumor-bearing KP-NINJA mice (Figure 1D, Figure S1B). Surprisingly, at both time points studied, there was a population of TCF1+PD-1+ CD8+ T cells in tumors (Figure 1E left) whose number did not change substantially as tumors progressed (Figure 1E center, Figure S1C). Despite this, there was a significant increase in the fraction of terminally differentiated Tim3+ TCF1− PD-1+ CD8+ T cells within the tumor between early and late time points (3.7% early to 7.9%) (Figure 1F top, S1E). A portion of TCF1+ PD-1+ CD8+ T cells in tumors also expressed the TSL marker SLAMF6 at both early (~38%) and late time points (~67%). In contrast, significantly fewer intratumoral TCF1− PD-1+ CD8+ T cells were SLAMF6+ (~2% early to ~7% late) (Figure 1F bottom, S1F). Similar results were seen when tumors were programmed to express neoantigens with lentiviruses containing the neoantigens in NINJA, demonstrating that T cell differentiation was independent of the method used for neoantigen programing (Figure 1D, S1D). Together, these data suggest that the cold tumor phenotype in advanced KP tumors might not be due to the loss of TCF1+ CD8+ T cells.
The presence of tumor-specific TCF1+PD-1+ CD8+ T cells throughout tumor development was intriguing because it suggested that mechanisms exist for the maintenance of this population within tumors. We reasoned this could be due to local maintenance of TCF1+ cells and/or migration from a distal site. Thus, we assessed dLNs from KP-NINJA mice for TCF1+PD-1+ CD8+ T cells, and identified that ~65(± 2.8)% and ~74(± 2.4)% of the tumor-specific CD8+ T cells in the dLN were TCF1+ and PD-1+ at 8–10 and 16+ weeks post tumor initiation, respectively (Figure 1D–E). This amounted to ~10-fold more TCF1+PD-1+ GP33-specific CD8+ T cells in dLNs compared to tumors (Figure 1E center). Phenotypically, this population in the dLN appeared fairly stable over time and remained largely Tim3− throughout tumor development (Figure 1G top, S1E). Furthermore, the vast majority of TCF1+PD-1+ CD8+ T cells in early (80.6 ± 3.54%) and late (96.7 ± 0.98%) dLNs were SLAMF6+ (Figure 1G bottom, S1F). Functionally, while a portion of T cells from tumors produced IFNγ after GP33–41 peptide re-stimulation ex vivo (5.2 ± 1.8%), the T cells from dLN appeared to have an enhanced functional capacity, as 10-fold more proportion were IFNγ+ after re-stimulation (59 ± 10.4%) (Figure 1H). Together these data demonstrated that most tumor-specific CD8+ T cells in the dLN were TCF1+ and SLAMF6+, and that a significant fraction of these cells had functional capacity. All other tissues surveyed including spleen, thymus, bone marrow, inguinal and mesenteric lymph nodes, did not contain an appreciable population of GP33-specific TCF+PD-1+ CD8+ T cells (Figure S1G–H).
TCF1+CD8+ T cells are enriched in dLNs in an orthotopic lung tumor model
To validate our results in a second tumor model, we established an orthotopic lung tumor transplant model with a cell line (KPN1) derived from an advanced tumor in a KP-NINJA mouse (20 week p.i.) (62). Analysis of GP33-specific CD8+ T cells in dLN and tumors at days 10 and 20 post-transplant (p.t.) showed that TCF1+PD-1+ T cells were present in the lungs at both time points, but that there was also a significant population of TCF1+PD-1+ T cells in the dLN (Figure S2). Moreover, their frequency and number were greater in the dLN. Thus, using a second model, we confirmed that the dLN was a site with significant enrichment of tumor-specific TCF1+ PD-1+ CD8+ TSL cells.
Heterogeneous tumor-specific CD8+ T cells include populations of TSL and TEX similar to those present in chronic LCMV infection
To understand the differentiation of tumor-specific CD8+ T cells at early and late timepoints, we FACS sorted endogenous GP33-specific CD8+ T cells from the dLNs and lung tissues (i.v.CD45-) of KP-NINJA mice 8 (early) and 17 weeks p.i. (late) and performed single cell RNA sequencing (RNAseq) with paired V(D)J sequencing of the T cell receptor (TCRseq; Figure 2A). The lineage of exhausted CD8+ T cells has been well described in the context of chronic LCMV infection and one strength of the KP-NINJA model is that endogenous GP33-specific CD8+ T cells recognize the same antigenic peptides as those present in acute (Armstrong) and chronic (Clone 13) LCMV (59). We also FACS sorted endogenous GP33-specific CD8+ T cells from spleens of C57BL/6 mice 28 days after infection with LCMV Clone 13 or LCMV Armstrong, and performed single cell RNAseq and TCRseq. We then directly compared the transcriptomes of the sorted anti-tumor and anti-viral T cells.
Figure 2: Tumor-specific TCF1+PD1+ CD8+ T cells in tumor and dLN resemble TSL cells in chronic LCMV.
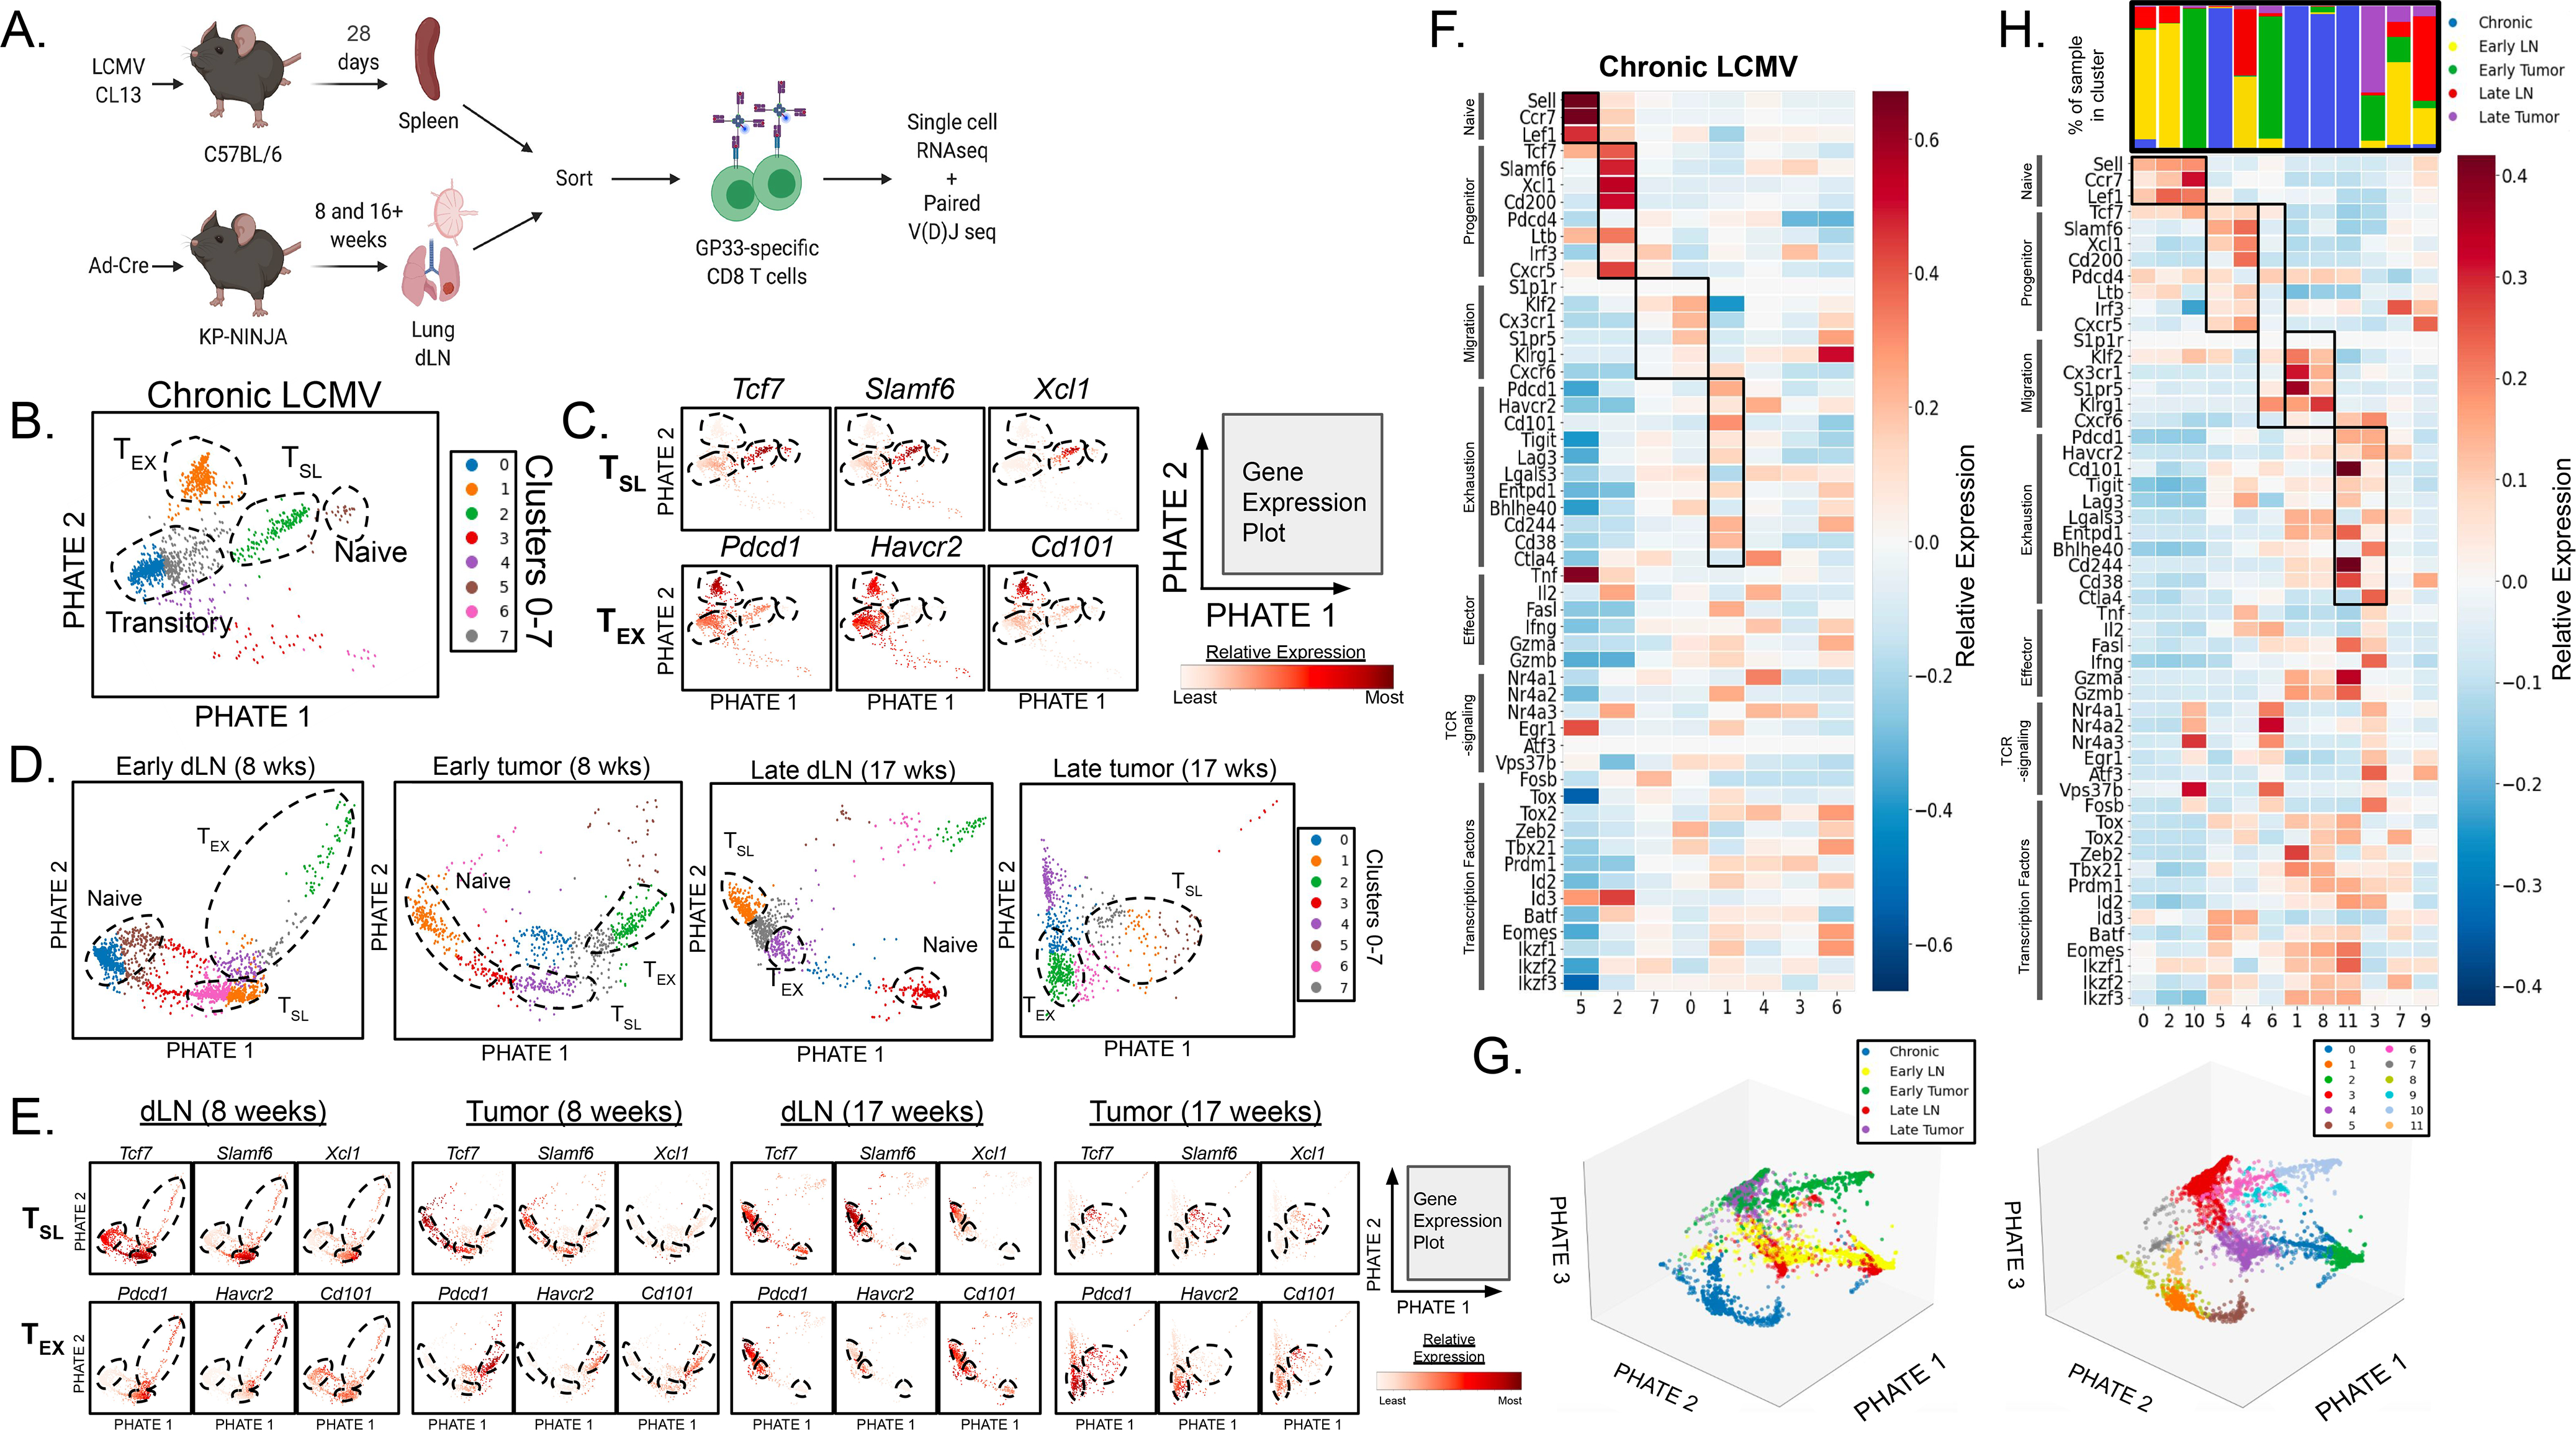
(A) Experimental protocol schematic. (B) Single-cell RNAseq data from GP33-specific CD8+ T cells in chronic LCMV Clone 13 infection were analyzed. 1,185 cells analyzed and 11,595 genes detected. (C) Naïve-, TSL-, and TEX-like populations (dotted lines) were identified based on the expression profiles of key genes associated with naïve, stem-like precursor, and terminally exhausted CD8+ T cells. (D) Individual data sets were visualized with PHATE maps displaying arbitrary clusters (1–7) and (E) CD8+ T cell populations were similarly identified among GP33-loaded MHC I tetramer+CD8+ T cells in the dLN and tumor from early (8 weeks p.i.) and late (17 weeks p.i.) KP-NINJA tumor-bearing mice. (F) Heat map of scRNAseq data from chronic LCMV-Clone 13 showing gene expression of naïve related, progenitor-related, migration-related, exhaustion-related, as well as key effector cell-associated genes, genes associated with intracellular TCR signaling, and key transcription factors. (G) 3-dimensional PHATE map of GP33-specific CD8+ T cells from chronic LCMV infection, early dLN, late dLN, early tumor, and late tumor were combined (left) and divided into 12 (0–11) clusters (right; refer to Figure S3G–H). (H) Heat map from combined analysis of all samples with distribution of samples for each clusters shown above. Gene expression of naïve related, progenitor-related, migration-related genes, exhaustion-related, as well as key effector cell-associated genes, genes associated with intracellular TCR signaling, and key transcription factors are included. For early dLN, 1,742 cells were analyzed and 12,116 genes were detected. For late dLN, 876 cells were analyzed and 11,595 genes were detected. For early tumor, 806 cells were analyzed and 11,749 genes were detected. For late tumor, 731 cells were analyzed and 11,150 genes were detected. Single cell RNA-sequencing data is representative of n=3 pooled samples.
We analyzed our single cell RNAseq data from chronic LCMV infection to identify clusters that fit the previous descriptions for naïve, “precursor-exhausted” TSL, “transitory”/migratory effector T cells, and terminally exhausted TEX cells (10–12, 21, 24, 31, 34, 35, 40, 43, 63, 64). Unbiased clustering analysis on the GP33-specific CD8+ T cells from chronic infection revealed clusters (Figure 2B), and each cluster was analyzed based on the expression of select genes previously associated with T cell subsets in chronic LCMV (naïve related, progenitor-related, migration-related, and exhaustion-related). Genes encoding T-cell effector molecules, transcription factors associated with CD8+ T cell differentiation, and genes associated with TCR-signaling were also included (Figure 2C, S3A) (9, 11, 12, 26–29, 31, 33, 35, 39, 43, 65–71). Based on patterns of gene expression, we identified clusters that best represented naïve (5), TSL (2), migratory (7, 0), and TEX (1) cell populations (Figure 2B and F). Beyond expression of the selected genes, unbiased PHATE embedding recapitulated the expected lineage relationships between the clusters, suggesting progressive differentiation from TSL to migratory or TEX cells.
We next analyzed the individual samples from tumors and dLNs (Figure 2D–E, S3B–E). Unbiased cluster analysis of the individual samples suggested that each contained several populations, including a cluster of cells with a strong naïve T cell signature, which we hypothesized were contaminating CD8+ T cells in our GP33-specific T cell sorts. Using TCRseq data, we confirmed that the naïve T cell clusters were comprised entirely of T cells with unique TCR sequences (i.e., singlets), while the non-naïve T cell clusters contained T cells with TCRs that were “shared” with other T cells in the sample (Figure S3F). Analysis of the dLN T cells suggested relatively uniform expression of progenitor-, migration-, and exhaustion-related genes and genes for effector molecules and transcription factors across most cells (Figure 2D–E, S3B and D). By contrast there was more heterogeneity in expression of these genes amongst T cells in the tumor samples. Analysis of additional genes from progenitor-related, migration-related, exhaustion-related, effector molecules, transcription factors, TCR signaling, and naïve-related categories was also performed (Figure S3A–E).
To compare TSL and TEX T cell subsets between the tumors, LNs, and chronic LCMV samples, we co-embedded all five data sets (early and late dLNs and tumors and chronic infection) and visualized their co-embedding with PHATE (Figure 2G and S3G–H) (72). We identified 12 clusters, and based on their expression the signature panel genes, we identified clusters of naïve (0, 2, 10), TSL (5, 4, 6), migratory (8, 1) and TEX (11, 3) cells (Figure 2H).
The 3 TSL clusters included one that was predominantly made up of cells from chronic infection (5) and one that predominantly had cells from the two dLN samples (4). These clusters had similar gene expression patterns, although there were notable differences in Cd200 and Pdcd4 (Figure 2H). Interestingly, Cluster 6 was predominantly made up of cells from early tumors and had low expression of most of progenitor-related signature genes, with the exception of Tcf7. These data suggested that TCF1+ SLAMF6+ tumor-specific CD8+ T cells in dLNs were closer in gene expression to TSL cells from chronic infection than their TCF1+ counterparts in tumors. The placement of these clusters in a 3-dimensional PHATE embedding confirmed the close proximity between TSL from chronic infection (cluster 5, brown) and TSL in dLNs (cluster 4, purple) (Figure 2G, S3H).
The 2 TEX clusters were predominantly made up of cells from chronic infection (11) and early/late tumors (3) (Figure 2G–H). Clusters 11 and 3 shared high expression of many of the exhaustion signature genes, suggesting that the TCF1− PD-1hi Tim3+ tumor-specific CD8+ T cells from tumors were similar to TEX cells in chronic LCMV infection. However, TEX from tumors (cluster 3) had higher expression of effector molecule transcripts (Ifng, Tnfa, Il2) compared to TEX from Chronic LCMV (Cluster 11). The 2 migratory cell clusters were dominated by cells from chronic infection (1 and 8), confirming that few tumor-specific CD8+ T cells in the dLN or tumor had this distinct gene expression pattern. Notably, cluster 6 (which we classified as a TSL cluster, based on high Tcf7 expression) had increased expression of many of the migration signature genes, which might suggest that cluster 6 is the closest equivalent to this population in our tumor models. Altogether, these data showed that the tumor-specific CD8+ T cell population was a heterogeneous mixture of cells ranging from TSL to TEX, and suggested that terminal differentiation may be spatially regulated.
dLN TSL cells are distinct from memory CD8+ T cells
TSL cells share some characteristics with memory T cells (Tmem), so we aimed to directly test whether the TSL populations identified in dLNs were distinct from classical Tmem. We compared the transcriptomes of GP33+ CD8+ T cells from early and late dLNs to GP33+ CD8+ T cells sorted from the spleens of mice 28 days after acute LCMV infection (Figure S3I–K). The clusters encoding the CD8+ T cells from acute infection did not overlap with the clusters encoding the dLN T cells (Figure S3I). Moreover, CCL5 and Ly6c2 were among the top differentially expressed genes in cells between acute LCMV and early dLN (Figure S3J). These genes have been associated with the maintenance (73) and homing (74) of Tmem cells, respectively. By contrast, memory T cells had low expression of progenitor- and exhaustion-related genes (Figure S3K). Together, these data confirm that tumor-specific TSL cells in dLNs were transcriptionally distinct from canonical Tmem that are formed after acute infection.
Progressive differentiation of CD8+ T cells occurs over time in tumors but not dLNs
To visualize whether CD8+ T cell differentiation was regulated at the spatial or temporal level, we co-embedded expression data from GP33-specific CD8+ T cells in tumors or dLNs at early or late time points in pairs and visualized their similarities and differences using PHATE. Single cell visualization methods attempt to embed relationships between cells in a low dimension. While some single cell visualization methods only capture local similarities or differences between cells (such as UMAP or tSNE), others capture both local and global distances (Diffusion Maps and PHATE). Since PHATE captures both local and global distances, this approach is able to accurately visualize transitions between cell states along potentially sparsely sampled paths, thus PHATE is ideal for developmental processes that occur along a continuous distribution of differentiation. In each PHATE co-embedding (Figure 3Ai–Di), we identified where prototypical naïve (Ccr7+ Sell+ Lef+), TSL (Tcf7+ Xcl1+ Slamf6+), and TEX (Pdcd1+ Havcr2+ Cd101+) cells would lie on the embedding maps (identified with colored markers; see Figure S4 for gene expression details). This allowed for easier visualization of the transitions between these differentiation states. For an unbiased analysis of transitions on our PHATE embeddings we performed pseudotime analyses and leveraged scVelo (75), tools optimized to infer trajectories of differentiation using transcriptional splicing kinetics from expression data. Cells were pseudo-colored in each PHATE embedding based on their pseudotime values from 0 to 1 (Figure 3Aii–Dii), and associated histograms showed relative cell distribution frequency as a function of pseudotime (Figure 3Aiii–Diii). A pseudo-temporal ordering of cells from scVelo on the co-embedded tumor samples was extracted and a developmental trajectory was estimated from TSL to TEX (Figure 3Aiv–Div). These unbiased analyses supported the idea that in each embedding, the direction of differentiation trended from naïve to TSL to TEX. This allowed us to determine how tumor-specific CD8+ T cell differentiation was regulated by assessing the relative locations of the cells from each sample on the PHATE embeddings.
Figure 3: Progressive CD8+ T cell differentiation occurs in tumors but not dLNs over the course of disease.
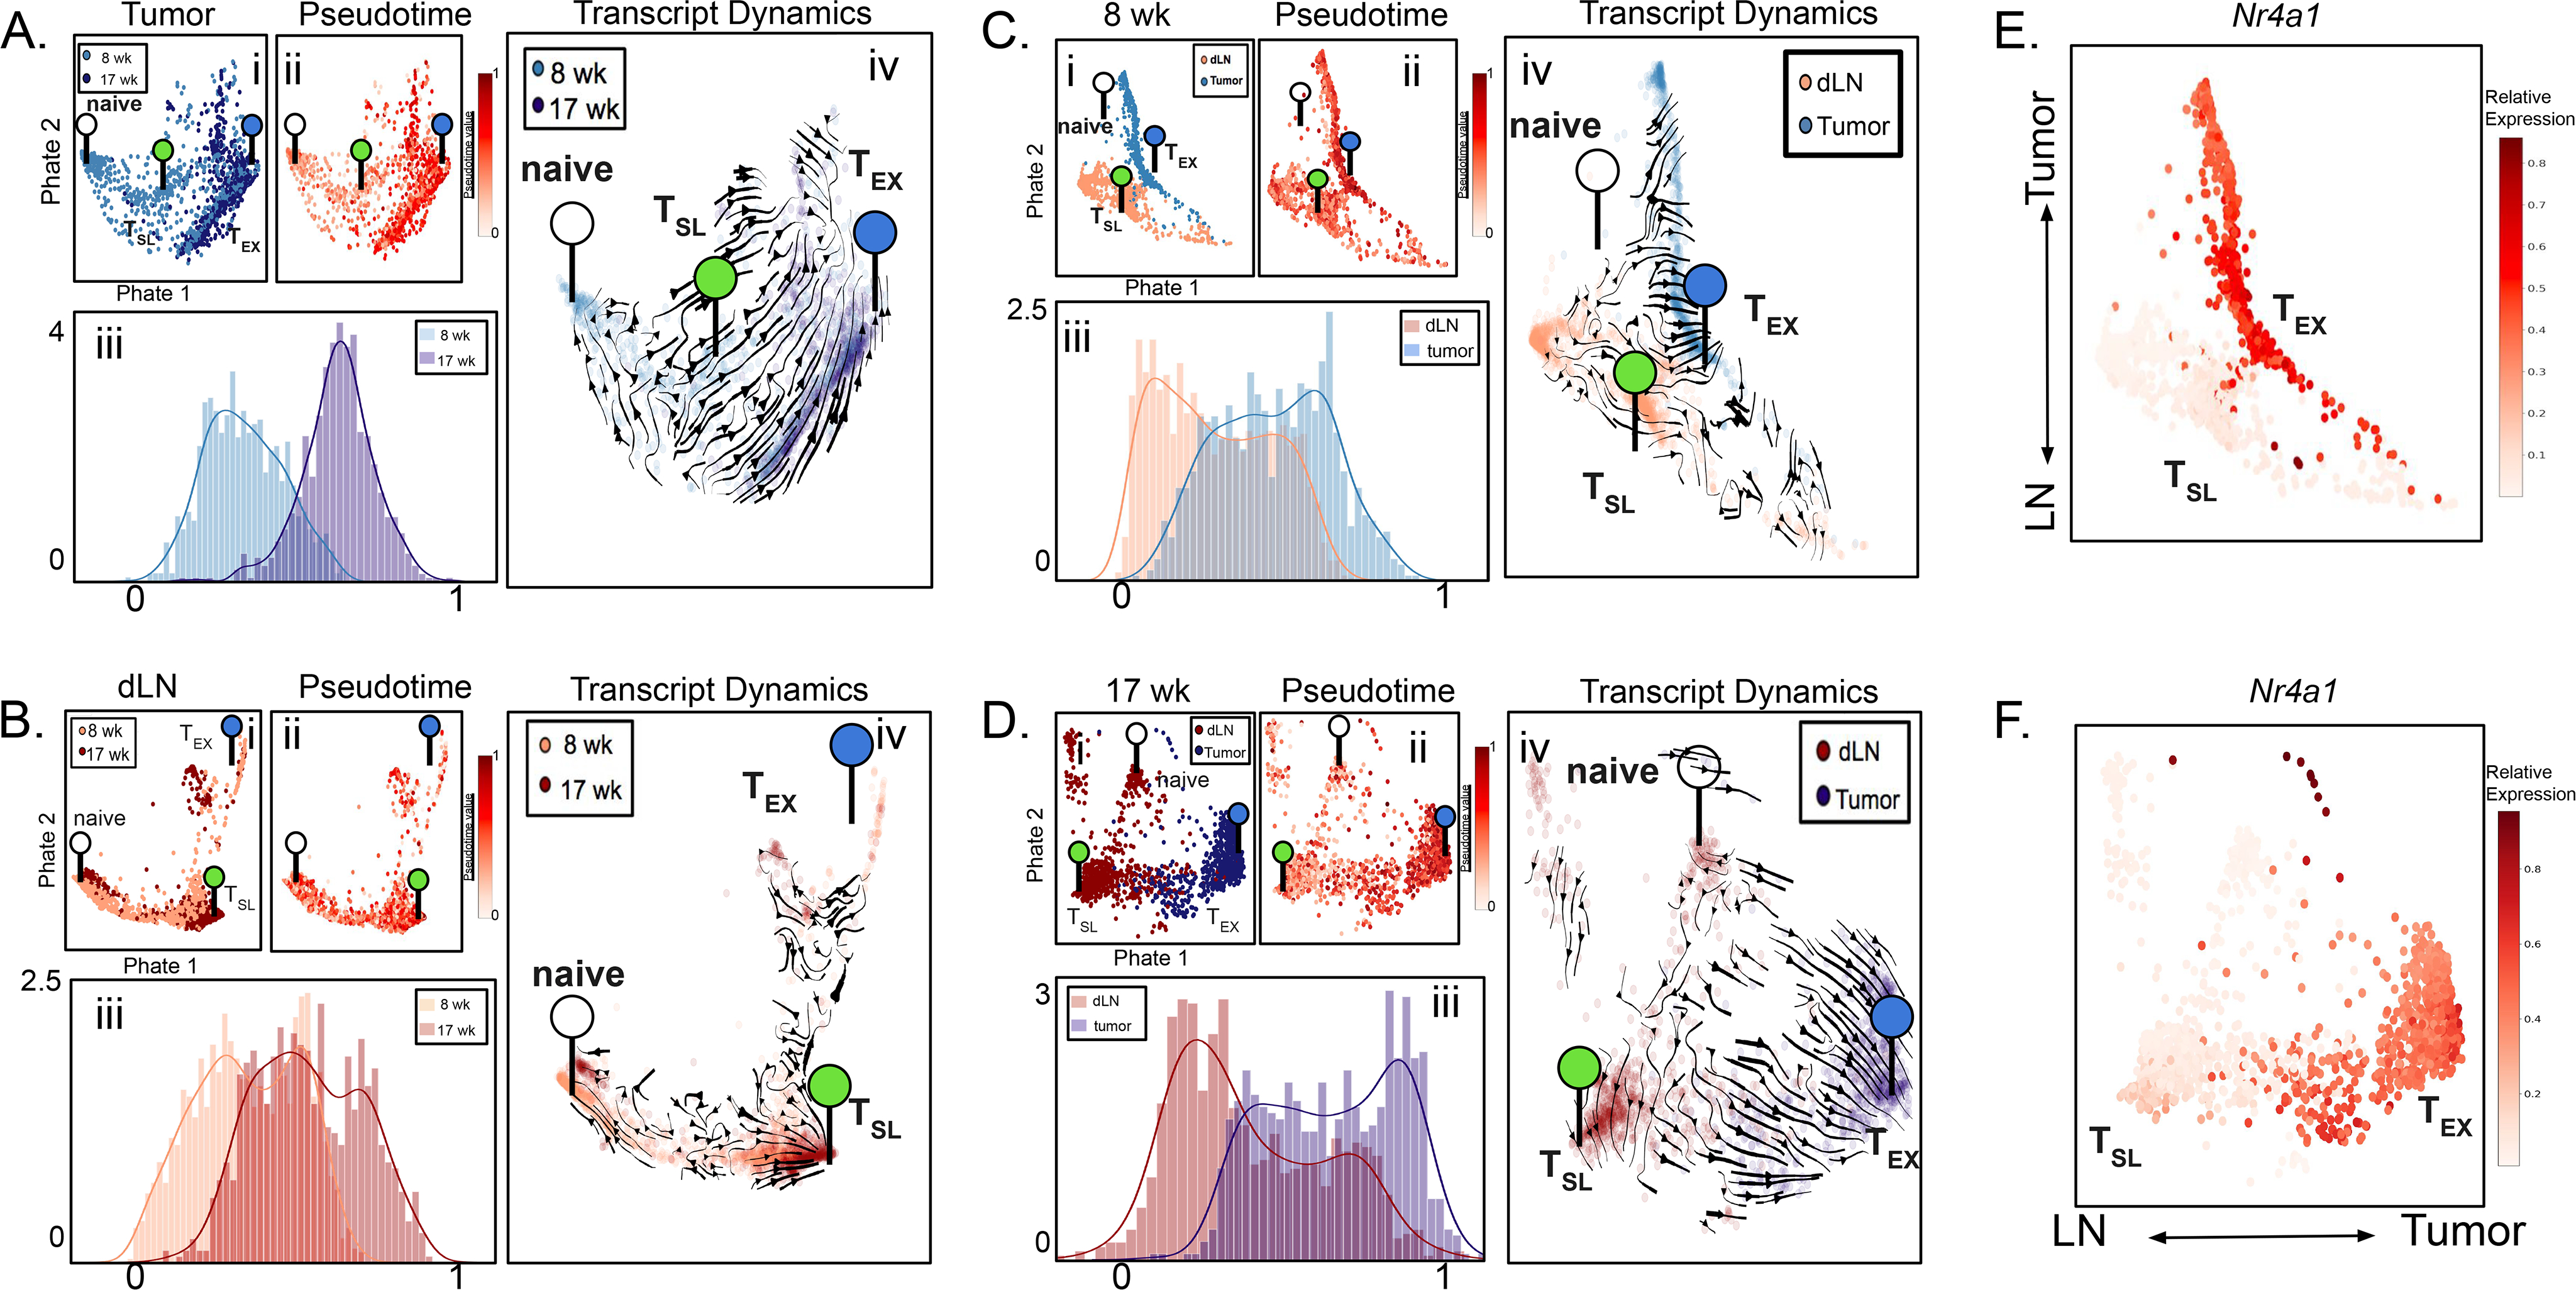
(A-D) Single-cell transcriptomics of tumor-specific CD8+ T cells from early (8 weeks p.i.) tumors and late (17 weeks p.i.) tumors (A), early dLNs and late dLNs (B), late dLNs and late tumors (C), and early dLNs and early tumors (D) from KP-NINJA mice were co-embedded and expression profiles were visualized by PHATE maps (i). Pseudotime analysis was also visualized by PHATE maps (ii) as well as histograms (iii). Transcript dynamics (iv) between each co-embedded sample pair are illustrated by the direction of arrowheads. The location of transcriptional signatures for the major cell states identified (Naïve (white), TSL (green), and TEX (blue)) are indicated by markers on pseudotime visualizations. (E-F) The gene expression profile for Nr4a1 visualized by PHATE map on the dLN and tumor co-embeddings at early (E) and late (F) time points.
Figures 3A–B show temporal regulation of T cell differentiation in tumors and dLNs, respectively. In the tumor PHATE embedding, we observed distinct naïve and TEX cells, but we had difficulty identifying prototypical TSL cells, consistent with the idea that these cells might not be located in the tumors in our model (Figure 3A and S4A). The preponderance of TEX-like cells were from late tumors, while early tumors contained a mixture of less and more differentiated CD8+ T cells. Thus, as tumors developed, we observed a progression of the tumor-specific T cell population towards a more terminally differentiated state. This corresponded with an overall shift in the TME from T-cell inflamed to non-T cell inflamed between early and late tumors (Figure 1H). In dLNs, we identified distinct naïve and TSL cells but had more difficulty discerning a prototypical TEX population (Figure 3B, S4B). In contrast to tumors, the distribution of cells from early and late dLNs was largely overlapping. Similarly, scVelo analyses confirmed that there was no consistent direction of differentiation between cells from early and late dLNs (Figure 3Biv). T cells from dLNs at early and late time points also showed similar distributions across pseudotime (Figure 3Biii). The similarity between early and late dLN samples was notable as they were isolated from animals at different stages of tumor development and their stability stood in sharp contrast to the change observed in T cells in the TME. Together these data demonstrate that over the course of tumor development most tumor-specific CD8+ T cells in dLNs remained in a stable, less-differentiated state while the T cells in tumors became progressively more terminally differentiated.
A continuum of differentiation defines the transition of tumor-specific CD8+ T cells from dLNs to tumor
We analyzed how spatial location (dLN vs. tumor) impacted tumor-specific CD8+ T cell differentiation (Figure 3C–D). In both early and late mice, we observed distinct naïve, TSL, and TEX cells at both time points, and pseudotime and scVelo analysis supported a continuous differentiation trajectory from the prototypical TSL to the prototypical TEX cells. At both time points, there was a clear segregation of cells from dLNs and tumors, with the less-differentiated T cells being predominantly from dLN and more-differentiated T cells being predominantly from tumors. Between extremes there was a smooth transition of cells from both sites, and a strong velocity pattern originating from the dLN to the tumor. The transcriptional dynamics suggest a putative movement of differentiation within the dLN toward the more differentiated state observed in tumors, perhaps driven by migration of the cells from dLN to tumor. Pseudotime analysis supported this conclusion, as dLN and tumor T cells were enriched at early and late pseudotime, respectively (0 vs 1, respectively), with more even distribution between (Figure 3C–D ii–iii). This provided a means to visualize how the expression of naïve-related, progenitor-related, migration-related, exhaustion-related, effector molecule and transcription factor genes changed as cells differentiated in early and late tumor bearing mice (Figures S4E–F). Along the progression of pseudotime (0 to 1) there were decreases in progenitor-related genes and increases in migration-related, exhaustion-related, and effector molecule genes. Moreover, analysis of genes associated with TCR signaling, such as Nr4a1, Nr4a2, Nr4a3, Egr1, Atf3, Vps37b, and Fosb, also showed a clear increase across pseudotime (Figures S4E–F).
TCR signals are thought to drive terminal differentiation in CD8+ T cells responses (15, 25, 27, 33, 44, 54, 76–79). To better visualize which T cells were receiving TCR signals, we pseudocolored 8 week and 17 week PHATE co-embeddings based on Nr4a1 (Nur77) expression, a commonly used metric for TCR signaling (Figure 3G–H) (80). Strikingly, Nr4a1 was increased on the more differentiated cells (in tumors), while the TSL cells had Nr4a1 expression levels similar to naïve T cells. These results were consistent with our earlier analysis of TSL and TEX clusters from dLNs and tumor (Figure S3B–E, note TCR signaling genes), and suggest spatial regulation of TCR signals.
The dLN maintains a reservoir of tumor-specific TSL cells
Despite the above trajectory analysis suggesting that dLN CD8+ T cells were differentiating into CD8+ T cells in tumors, it remained possible that the T cells in the tumors were unrelated to those in the dLNs. To assess the lineage relationships between dLN and tumor T cells, we identified T-cell clones with unique and shared TCR sequences (Figure S3F). We then assessed whether there were shared clones (2 or more cells with the same TCRA and TCRB pair) between early dLNs and tumors and late dLNs and tumors. There was a significant amount of clonal overlap between the GP33-specific CD8+ T cells in dLNs and tumors at both early and late time points (Figure 4A–B). Moreover, there was a good correlation between the frequencies of individual clones in the dLN and tumor. The clonal diversity of shared TCR sequences in tumors did not change much over time (Simpsons D= 0.028 early vs. 0.024 late) while in contrast, TCR clonal diversity in the early dLN decreased from week 8 to week 17 (Simpsons D = 0.009 early vs 0.037 late). Additionally, Morisita-Horn indices show a high level of similarity between dLN and tumor at each time point, but very little similarity between tissues from different time points (Figure 4B). Analysis of the top 3 clones in dLN and tumor showed that they were spread across the differentiation trajectory and were present in multiple differentiation states and locations (Figure 4C). Moreover, these clonal cells increased in pseudotime value, and peaked in the tumors.
Figure 4: Clonal dominance is maintained throughout disease between dLN and tumors.
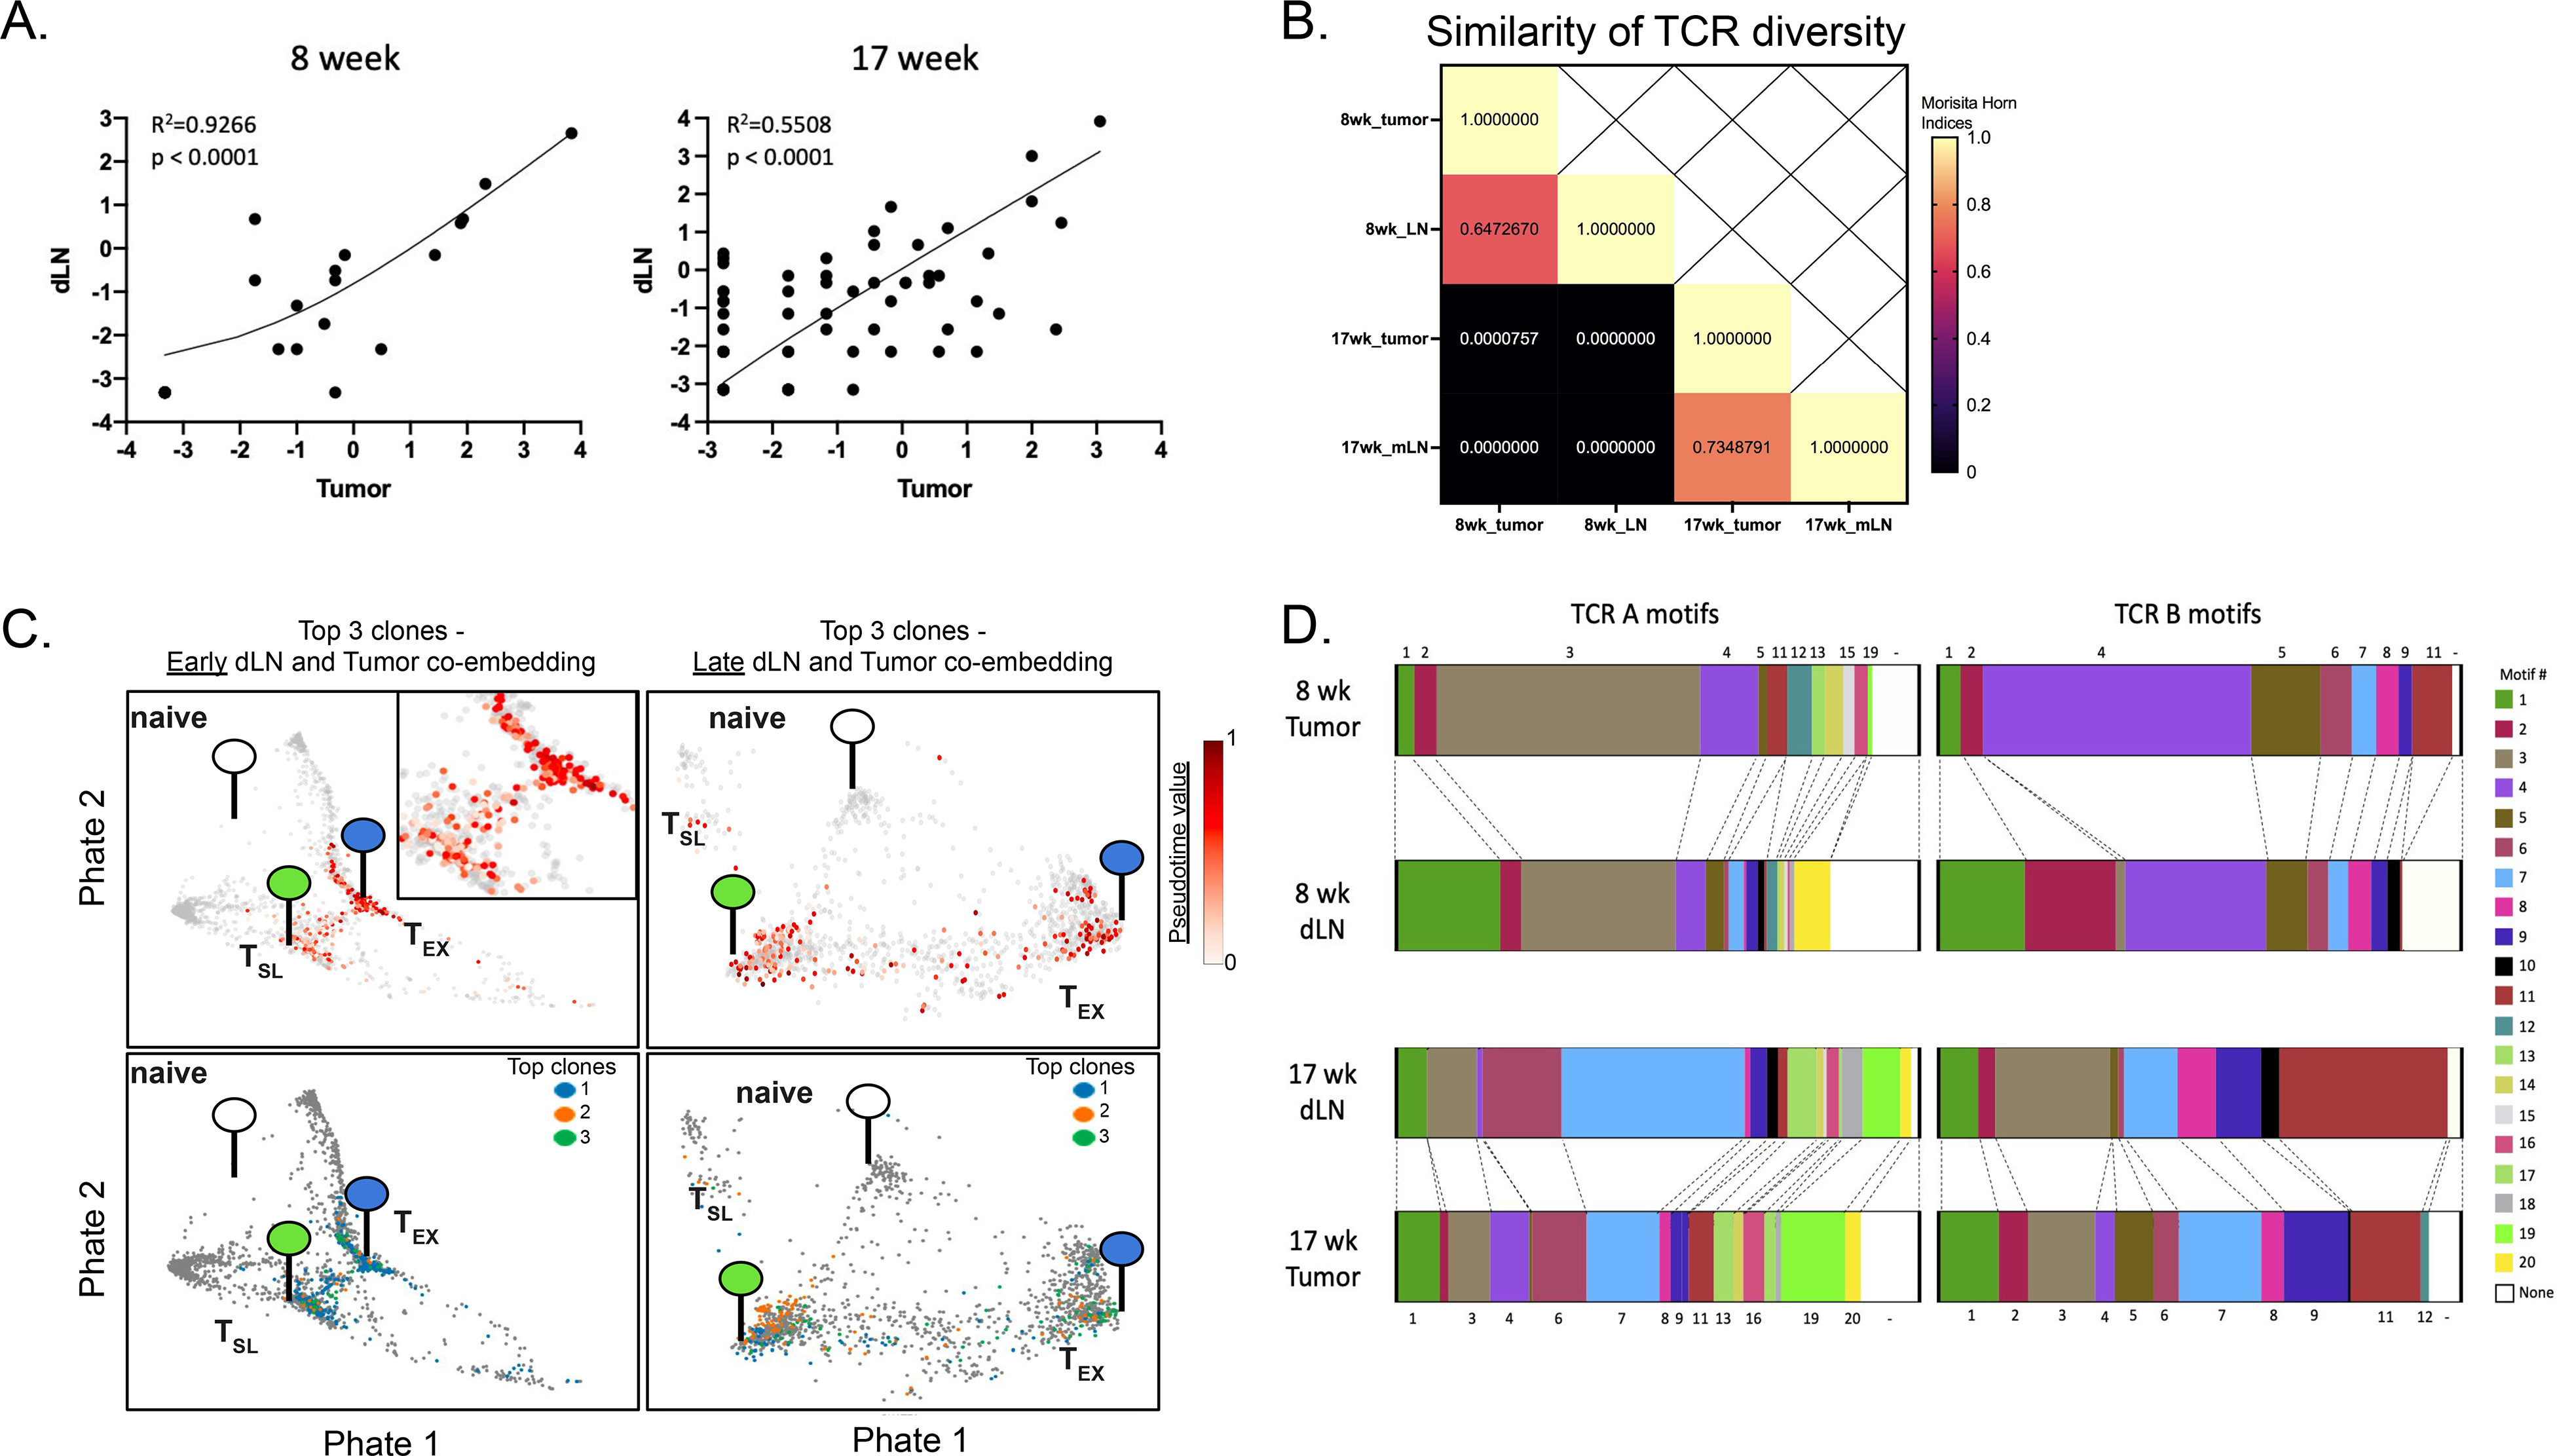
(A) Paired single cell TCR-sequencing from tumor-specific CD8+ T cells (i.v.CD45−CD8+GP33-loaded MHC I tetramer+) in early (8 weeks p.i.; left) and late (17 weeks p.i.; right) dLNs and tumors was used to identify the correlation between CD8+ T cell clones shared between tissues. Abundance of each shared clone (≥2 cells/sample with shared sequence) is reported as a percent of total shared clones between tissues at either timepoint and displayed on log2 axes (R2=0.9226 and 0.5508 at early and late timepoints, respectively). (B) The Morisita-Horn overlap index was calculated between early dLN (1,098 shared TCR sequences/clones; 1,734 cells with shared TCR sequence; Simpson’s Index = 0.009194539), early tumor (448 clones; 767 cells with shared TCR sequence; Simpson’s index = 0.02845659), late dLN (346 clones; 886 cells with shared TCR sequence; Simpson’s Index = 0.03669475), and late tumor (216 clones; 675 cells with shared TCR sequence; Simpson’s Index = 0.02416547) samples in order to compare overlap of TCR sequences. (C) Differentiation status of top 3 shared clones from tumor-specific CD8+ T cells in dLN and tumor at early (top left; with area of interest enlarged in top right corner) and late (top right) time points were determined by pseudotime analysis and visualized by PHATE. Distribution of each of the three clones are shown below at early (bottom left) and late (bottom right) time points, with each top clone differently colored. The location of transcriptional signatures for the major cell states identified (Naïve (white), TSL (green), and TEX (blue)) are indicated by markers on pseudotime visualizations. (D) TCRA and TCRB motifs were determined from single-cell TCR-sequencing of tumor specific CD8+ T cells and motifs shared between tissues at either time point are shown.
The stability of their transcriptional state and the enrichment of early and late dLN T cells amongst the less-differentiated TSL cells raised the question of whether the clones of tumor-specific CD8+ T cells in the dLN were maintained over the course of tumor development. Analysis of T cells in the mediastinal LN (tumor-draining) requires sacrifice of animals, so we were unable to directly compare T cell clones between the early and late time points. Thus, we used algorithms that define common TCR motifs for polyclonal populations responding to a common antigen, and analyzed GP33-specific CD8+ T cells from early and late dLNs and tumors (Figure 4D, Table S1). We identified 20 TCRA motifs and 12 TCRB motifs in total (Table S1), and found good concordance between the presence of TCR motifs in dLNs and tumors of the same mice. These data strongly support the hypothesis that most tumor-specific CD8+ T cells in dLNs (and perhaps tumors) are maintained over the course of tumor development.
Migration from the dLN maintains TCF1 expression by the intratumoral T cell pool
Our data supported two non-mutually exclusive models for the maintenance of T cells in tumors: (1) tumor-specific TCF1+ CD8+ T cells in tumors could be a self-sustaining population that continued to propagate and differentiate to maintain the T cell response in tumors, or (2) maintenance of TCF1+ T cells in tumors could be due to continual migration of small numbers of tumor-specific TSL from the dLN. Migration of TSL from tissues other than the dLN is unlikely as populations of GP33-specific TSL were absent from all other tissues examined (spleen, thymus, bone marrow, inguinal and mesenteric lymph nodes) (Figure S1G–H).
To test the latter hypothesis, we treated KP-NINJA tumor-bearing mice with FTY720 to block lymphocyte migration. Tumors were initiated in KP-NINJA mice via intratracheal infection with 2.5×10⁷ PFU Ad5mSPC-Cre and administration of doxycycline and tamoxifen as described previously (62), and then treated with FTY720, or vehicle, from 6–9 weeks post-infection (Figure 5A). After 3 weeks of FTY720 treatment, the frequency and number of GP33-specific TCF1+ CD8+ T cells in the tumor tissue, but not TCF1− CD8+ T cells (Figure 5I–J), was decreased compared to vehicle-treated controls (Figure 5B–D). This represented a ~4-fold drop in the number of these cells (from 1216 ± 258 to 335 ± 78). By contrast, the number of TCF1+ CD8+ T cells in the dLN was not impacted by FTY720 treatment, suggesting that the observed decrease was likely due to the impact of blocking migration and not a direct impact of FTY720 on TCF1+ CD8+ T cells. The observed 4-fold drop in TCF1+ CD8+ T cells in tumors was more sharp than the 2-fold decrease in the number of total GP33-specific CD8+ T cells over the same time period in tumors (from 10488 ± 2003 to 5506 ± 1392), suggesting that the TCF1+ T cell population was more impacted by the migration blockade (Figure 5E–F). Similar decreases were observed in the GP33− CD8+T cell populations in the tumor (Figure 5G–H). Thus, these results are consistent with the hypothesis that the migration of tumor-specific TSL cells from dLNs is necessary to sustain the TCF1 expression of anti-tumor T cells in tumors.
Figure 5: A reservoir of tumor-specific CD8+ TSL cells in dLN maintains the anti-tumor immune response.
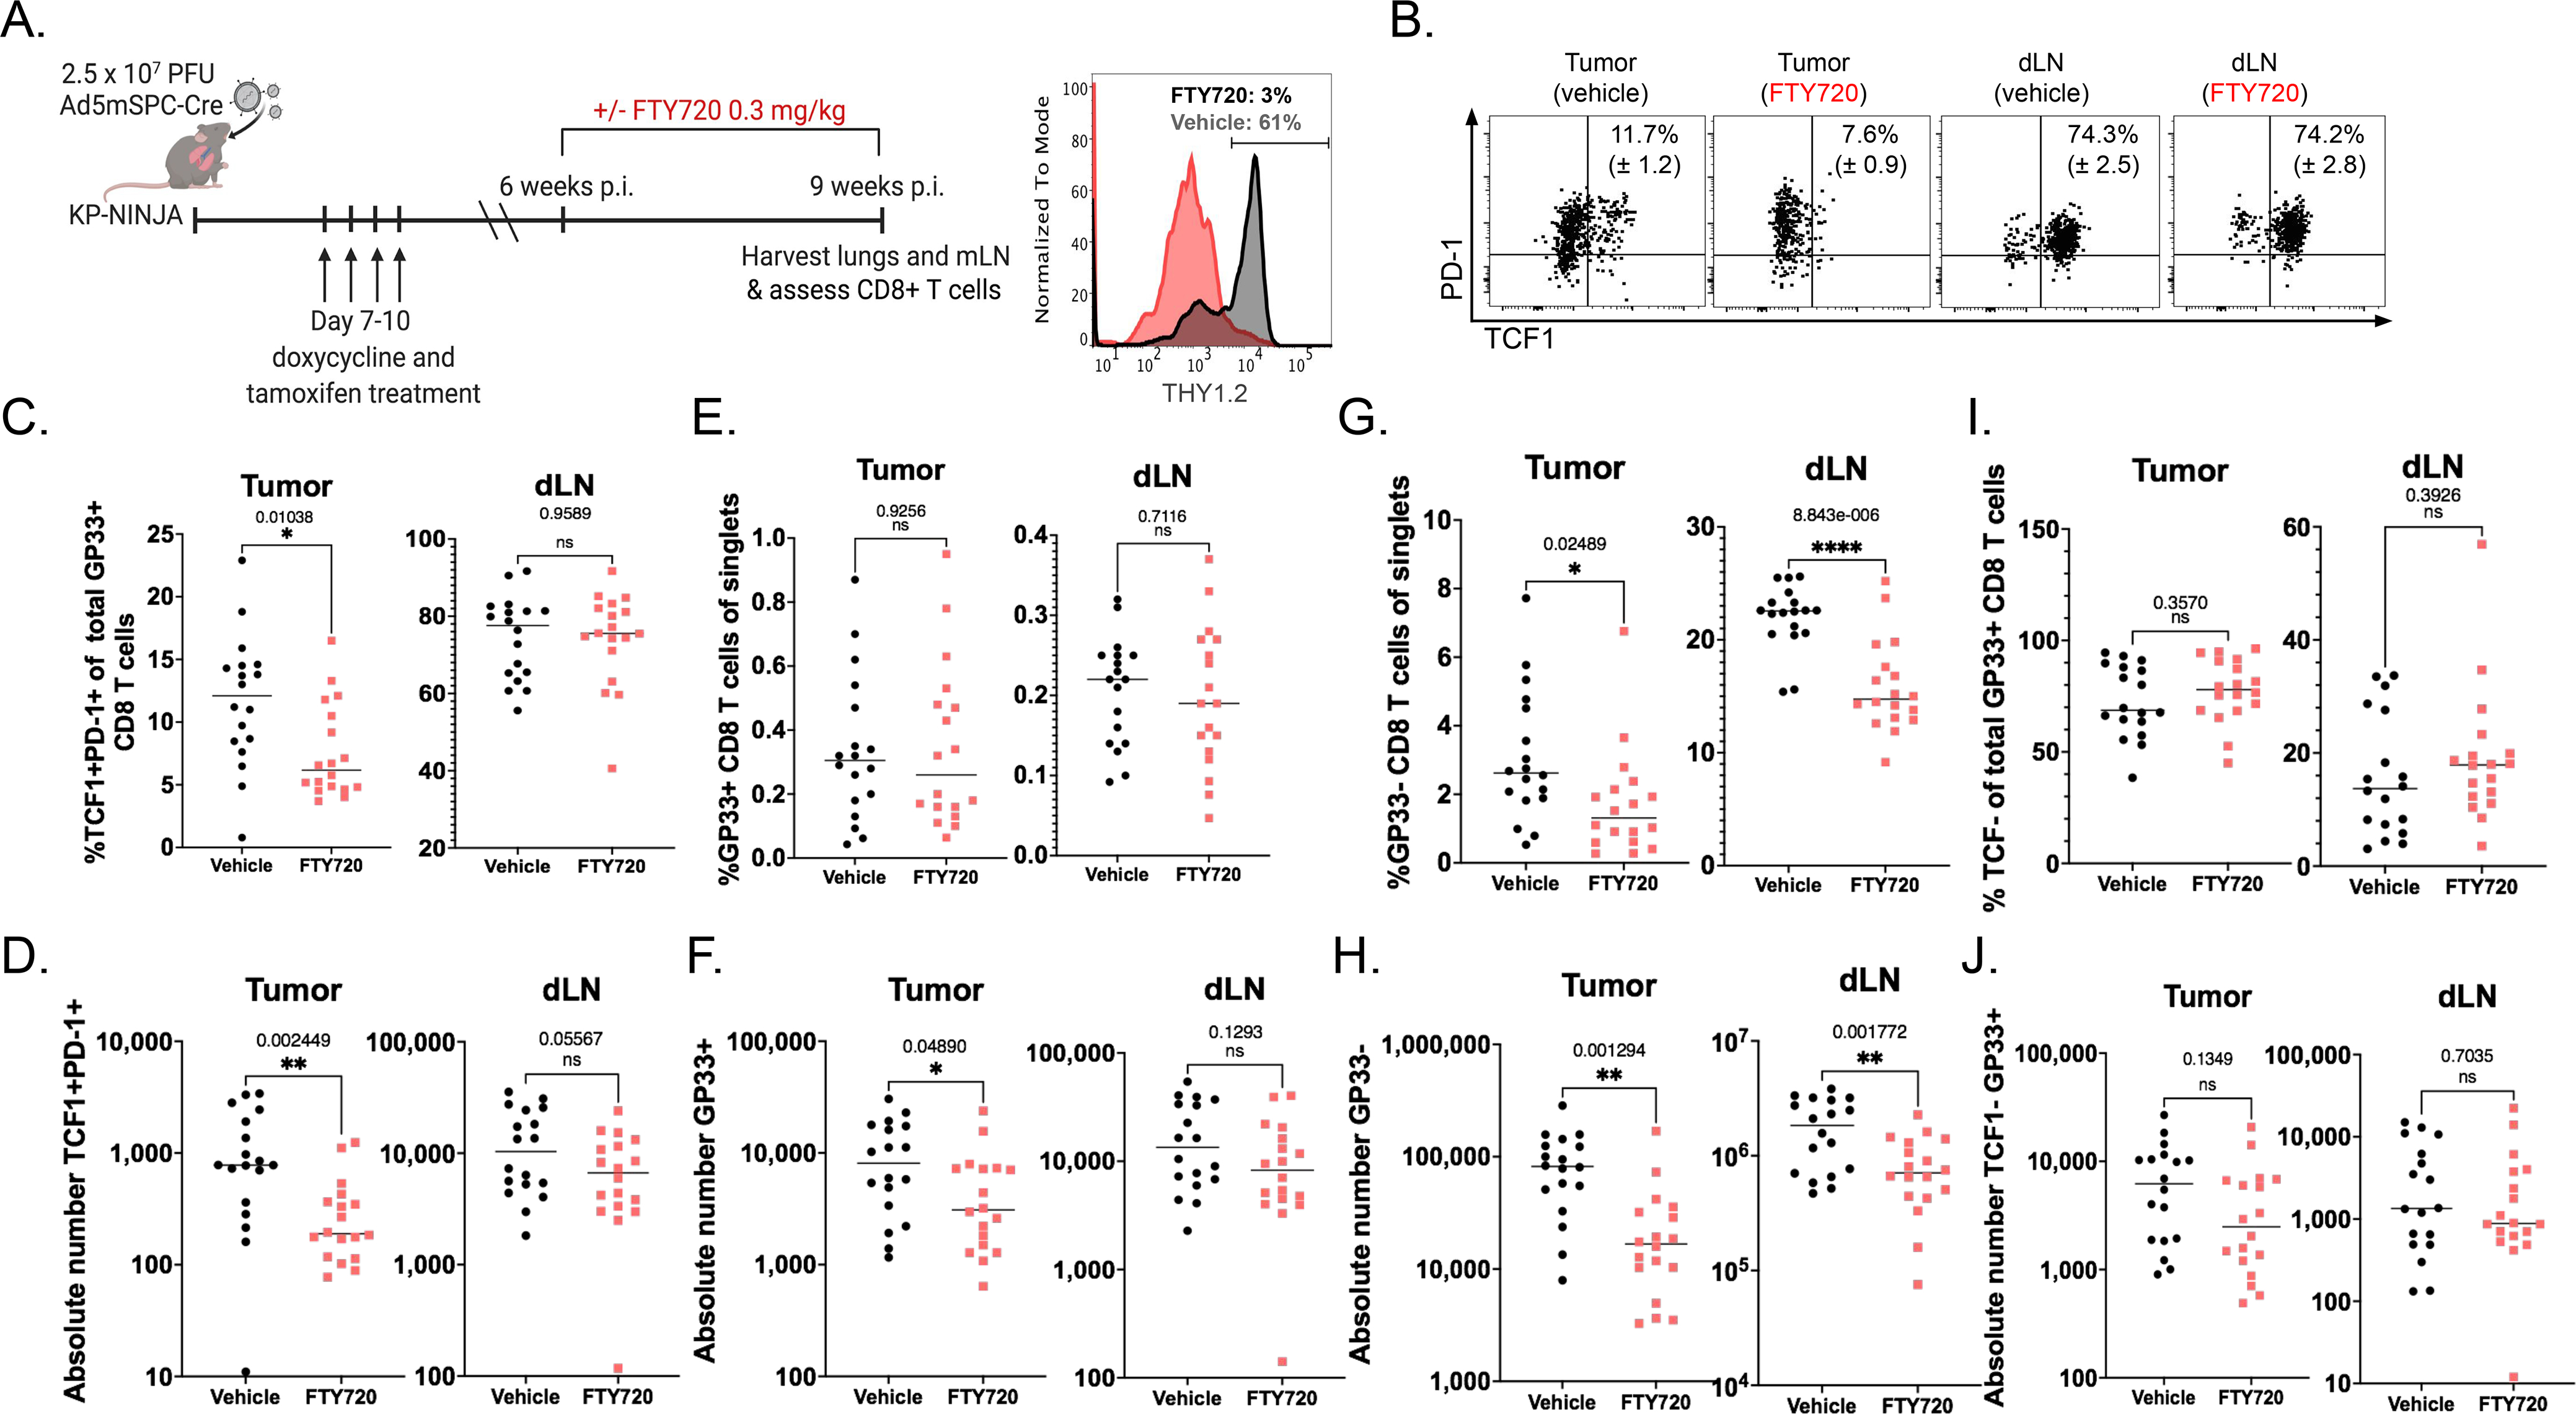
(A) Experimental schematic (left) with representative histogram (right) showing THY1.2+ events from whole blood 24 hours following 0.3mg/kg FTY720 treatment (gray) and vehicle-treated control (black). (B) Representative dots plots reporting mean and SEM of %TCF1+PD-1+ of GP33-specific cells, pre-gated on singlets, THY1.2+, CD8+ in the tissue (intravascular CD45−) in tumor and dLN ± FTY720. (C-D) The percent and absolute number of TCF1+ PD-1+ TSL in tumors (C, *p=0.01; D, **p=0.002) and dLNs (C, p=0.96; D, p=0.056) in vehicle-treated (black) vs. FTY720-treated (red). (E-F) Percent and absolute number of GP-33 specific CD8+ T cells in tumors (E, p=0.93; F, *p=0.049) and dLN (E, p=0.71; F, p=0.13) in vehicle-treated (black) vs. FTY720-treated (red). (G-H) Percent and number of non-GP-33-specific (GP33-loaded MHC I tetramer-) CD8+ T cells in tumors (G, *p=0.025; H, **p=0.001) and dLN (G, ****p=8.8−6; H, **p=0.002) in vehicle-treated (black) vs. FTY720-treated (red). Representative of 2 independent experiments containing 4 technical repeats. Statistics based on two tailed, unpaired t-tests; n=18 vehicle and n=18 FTY720 for tumor. (I-J) The percent and absolute number of TCF1− PD-1+ TSL in tumors (I, p=0.357; J, p=0.135) and dLNs (I, p=0.393; J, p=0.704) in vehicle-treated (black) vs. FTY720-treated (red).
TSL-like populations are present in metastatic and non-metastatic LNs of lung cancer patients
Tumor-draining lymph nodes from human patients are often used for diagnostic purposes and are thus difficult to obtain for research. Therefore, to investigate the potential importance of dLN T cells in human lung adenocarcinoma (LUAD), we took advantage of a recently published single cell RNA sequencing dataset from a study which included normal lung tissue (nLung), tumor-containing lung tissue (tLung), metastatic lymph nodes (mLN), and non-metastatic lung-draining lymph nodes (nLN) collected by surgical resections or ultrasound-guided bronchoscopy biopsies from 44 treatment-naïve LUAD patients (GSE131907; (81)). We catalogued 10,046 CD8+ T cells from all four tissues, based on their previous annotations, and these were grouped into 15 clusters and visualized using the dimension reduction method Uniform Manifold Approximation Projection (UMAP) (Figure 6A).
Figure 6: TSL-like populations are prevalent in non-metastatic LN of lung cancer patients.
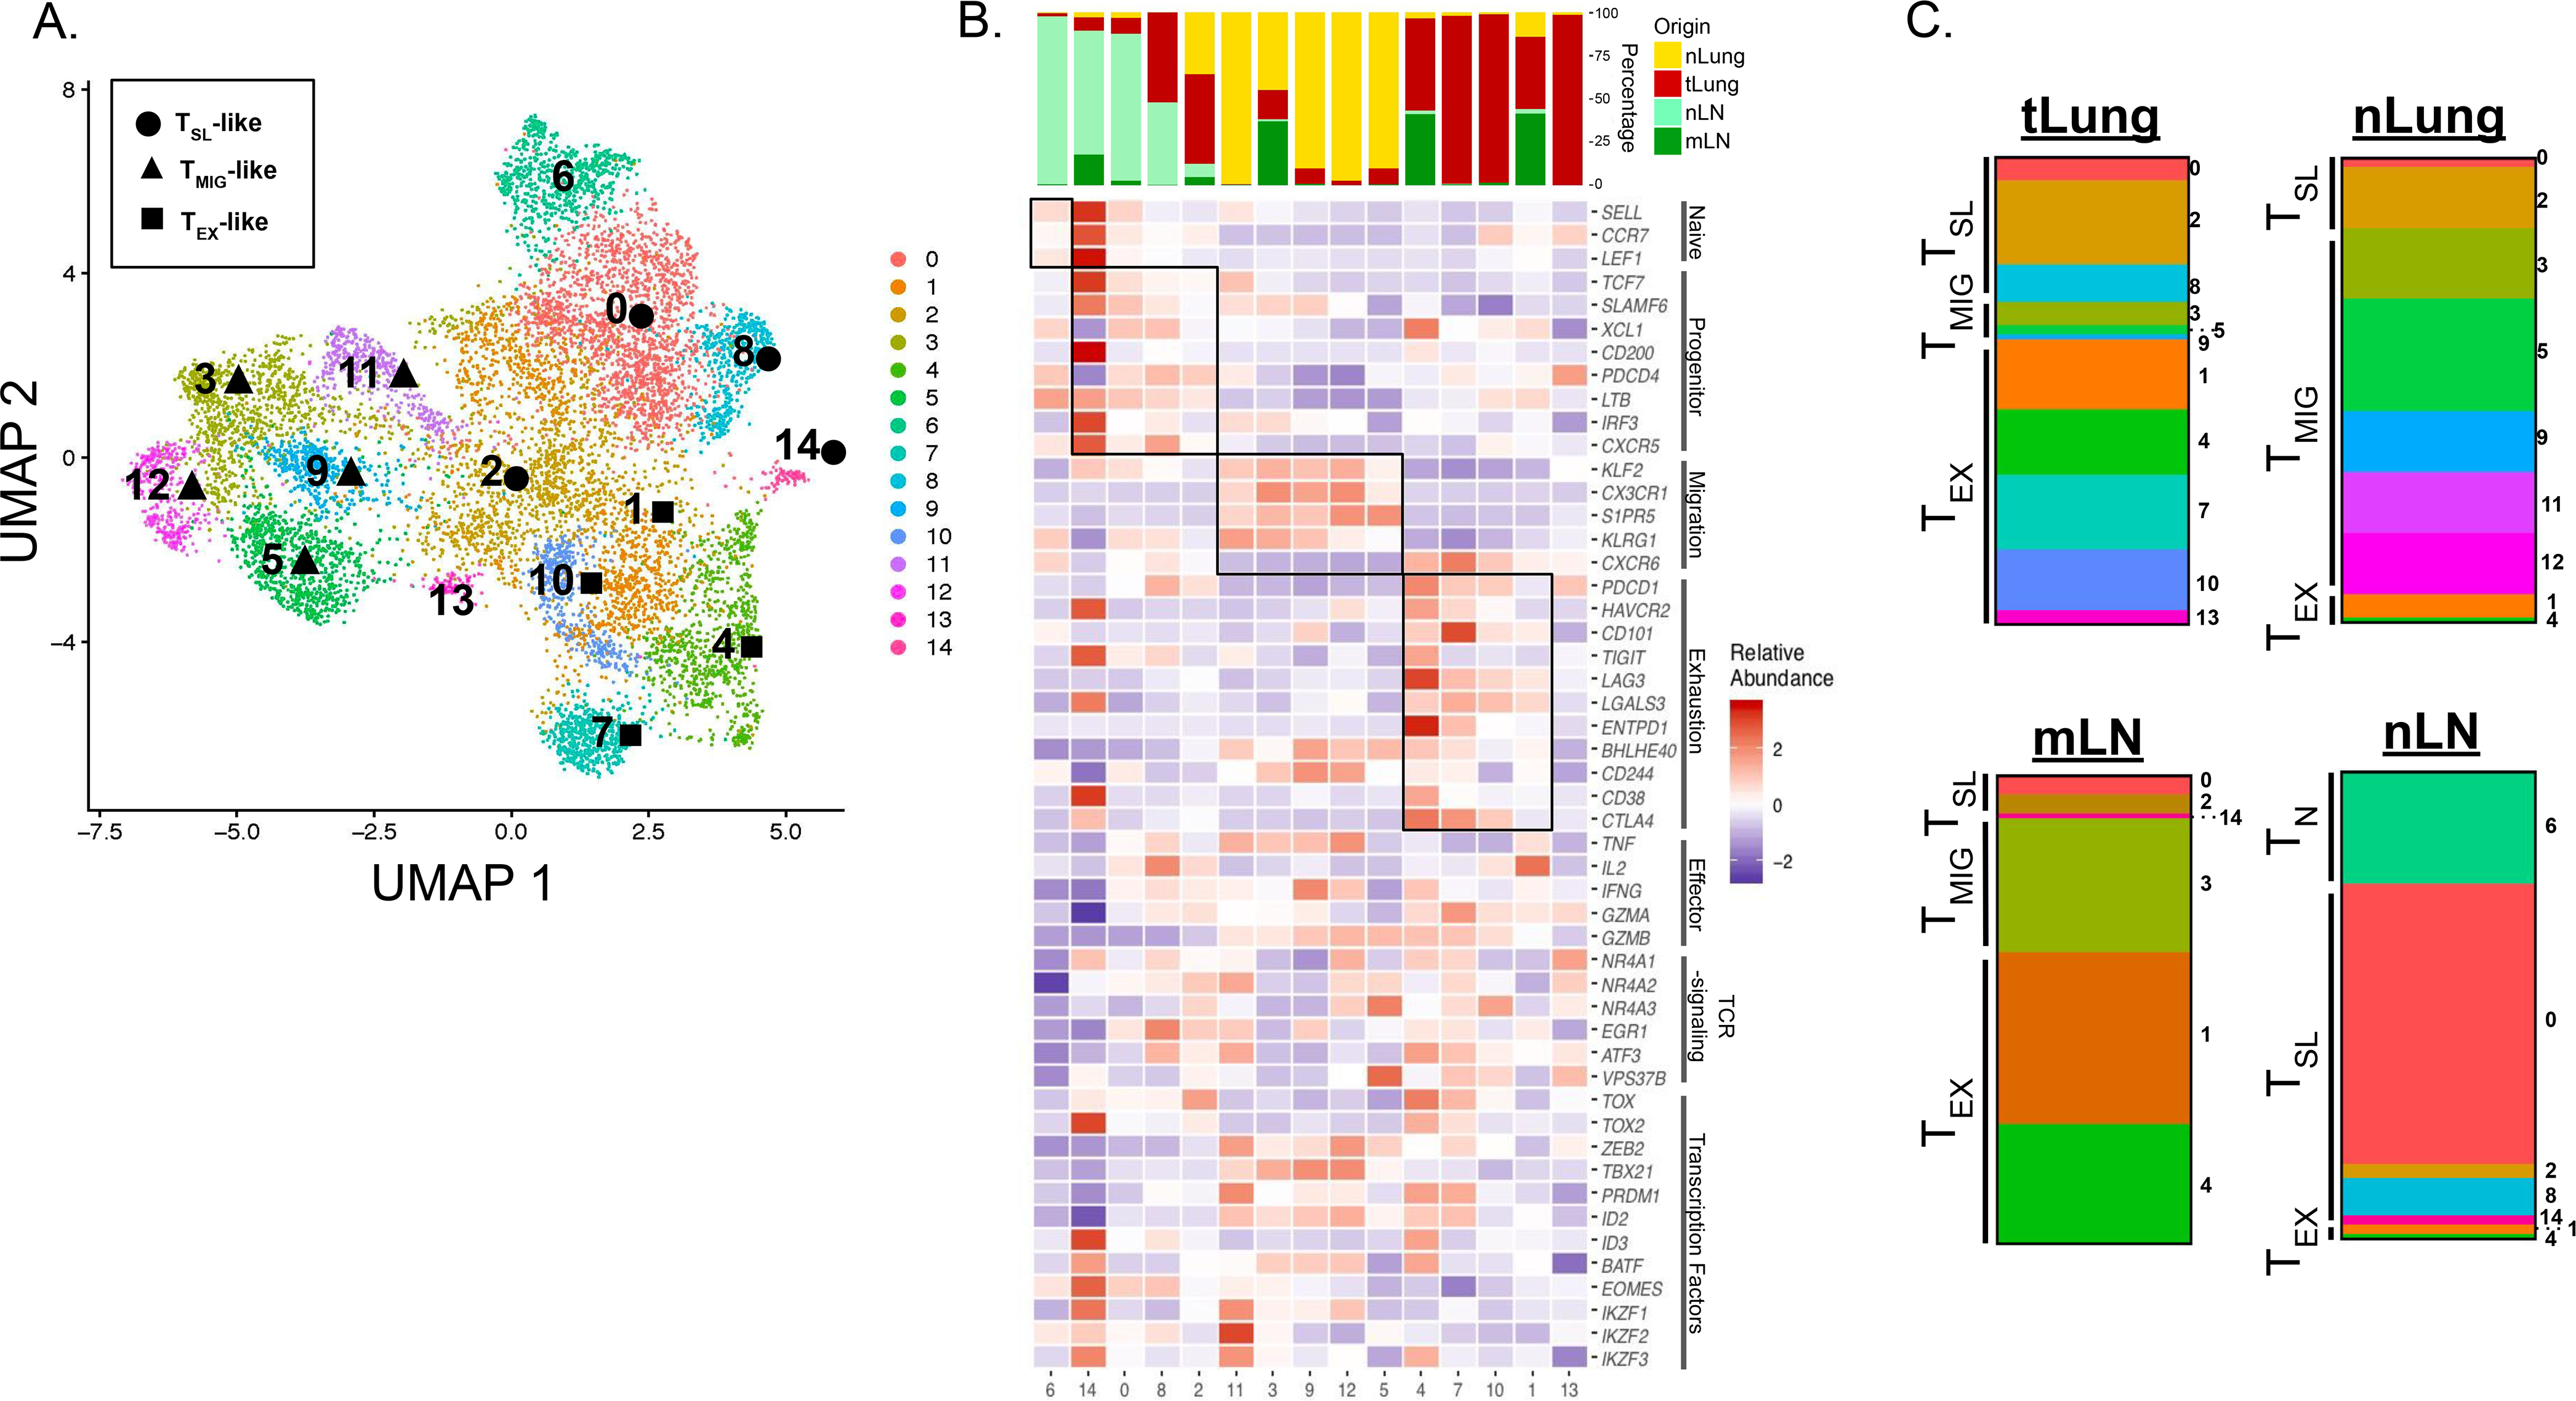
(A) UMAP displaying CD8+ T cell clusters 0–14 in treatment naïve LUAD patients from primary sites (tLung) and metastatic LN (mLN), normal lung tissue (nLung) and non-metastatic, normal LNs (nLN) (GSE131907; (81)). Clusters determined to have a TSL-like, TMIG-like, and TEX signature, based one gene expression, are denoted by ⬤, ▲, or ⬛, respectively. (B) Tissue of origin distributions for each cluster (top) and heatmap displaying relative abundance for naïve related, progenitor-related, migration-related, and exhaustion-related signature genes (bottom). Key effector cell-associated genes, genes associated with intracellular TCR signaling, and key transcription factors are also included. Relative abundance was calculated as Z-scaled average of log-transformed and cell-normalized counts. (C) Bar graphs depicting the make-up of total CD8+ T cells from each tissue showing the distribution of TN-like, TSL-Like, TMIG-like, or TEX-like clusters determined by gene signatures from B.
With the same signature genes used in Figure 1, we grouped CD8+ T cell clusters from LUAD patients into naïve T cell (TN), TSL-like, migratory T cell (TMIG)-like, and TEX-like categories (Figure 6B). We identified 1 naïve cluster (1), 4 clusters with a TSL-like signature (14, 0, 8, 2; ordered from highest to lowest TCF7 expression), 5 clusters with a TMIG-like signature (11, 3, 9, 12, 5; ordered from highest to lowest KLRG1 expression), and 4 clusters with a TEX-like signature (4, 7, 10, 1; ordered from highest to lowest PDCD1 expression). Gene expression signatures of TSL-like and TEX-like clusters were strikingly similar to these populations from tumor-bearing KP-NINJA mice in our model (Figure 2F). Strikingly, 73% of the nLN CD8+ T cells were TSL-like (Figure 6C), in agreement with our findings in mice. TSL-like cells made up 31% of CD8+ T cells from the tLung, and only 9% and 15% of the CD8+ T cells from the mLN and nLung, respectively. In contrast, TEX-like cell clusters were dominant in the mLN and tLung (61% and 61%, respectively). Interestingly, nLung tissue contained cells which belonged predominantly to TMIG-like clusters (78%). Together, these data from LUAD patients support our hypothesis that TSL cells reside in the dLNs and that differentiation occurs after the dLN T cells migrate to the tumor.
Discussion
PD-1+ TCF1+ CD8+ T cells are present in human and murine tumors and are necessary to sustain both the anti-tumor T cell response and responses after immunotherapy, but the mechanisms for their maintenance remained unclear. Using an autochthonous model of lung adenocarcinoma, we found that the population of intratumoral PD-1+ TCF1+ CD8+ T cells was maintained by migration from the tumor-draining lymph node (dLN). Most tumor-specific CD8+ T cells in dLNs expressed PD-1, TCF1, and SLAMF6 and had transcriptional patterns that were more similar to canonical TSL cells seen during chronic LCMV infection. By contrast, while some intratumoral CD8+ T cells were PD-1+ and TCF1+, many did not express SLAMF6 or other genes associated with TSL cells. Moreover, as the tumor microenvironment shifted from hot to cold, the intratumoral T cell population became more differentiated, while the population in the dLN was unchanged at the transcriptional and phenotypic levels. These findings, in combination with the shared TCR sequences found between tissues and pseudotime analyses, present convincing evidence for tumor-specific CD8+ T cells in the dLNs being developmentally related to (and likely the developmental precursors of) more differentiated intratumoral T cells in early and late tumors. Future studies will be needed to test this directly. While most studies of anti-tumor CD8+ T cell function and differentiation have focused on tumor tissues (82–90), our data demonstrate that the process of differentiation for tumor-specific CD8+ T cell begins in the dLN, with the dLN serving as a reservoir for maintaining T cells in a stem-like state throughout the course of tumor development.
The question of whether patients with cold tumors can respond to immunotherapeutic intervention has remained uncertain. Cold tumors have poor infiltration of T cells and/or T cell exclusion, which is thought to reflect a diminished or absent anti-tumor immune response, consistent with their poor response to checkpoint therapies (4). Yet, cold tumors have similar mutational burdens and antigen presentation capacity as hot tumors, suggesting they both have the capacity to initiate and drive anti-tumor T cell responses (53). These findings are in line with the cold tumors in our model, which maintain neoantigen expression and in vivo presentation of neoantigens (49, 60, 62, 91, 92). Given these observations, we hypothesized that the cold tumor microenvironment was a result of global exhaustion of tumor specific CD8+ T cells throughout the host. Surprisingly, many tumor-specific CD8+ T cells in late tumors were TCF1+, although pseudotime analyses demonstrated that these T cells were more differentiated than T cells from early tumors. These data are consistent with the possibility that the increased differentiation state of intratumoral T cells could account for the cold phenotype of late tumors. Additional possibilities include the inability of migrating T cells to physically enter tumors or defects in DC migration or function (53, 93–95). We also found that a cold TME is not indicative of global exhaustion of tumor-specific CD8+ T cells as cold tumors were associated dLNs containing TSL cells that were transcriptionally similar to TSL cells in dLNs associated with hot tumors. Thus, the distal location of dLN TSL cells likely protects them from changes that occur within the TME over the course of tumor development.
While many signals could promote the differentiation of intratumoral CD8+ T cells, TCR signals are prime candidates. TCR signals drive terminal T cell differentiation in chronic infection, and CD8+ T cells that recognize more abundant antigens are subject to more severe exhaustion (15, 25, 27, 33, 44, 54, 76–79). Likewise, antigenic peptides that deliver weaker TCR signals are less potent drivers of T cell exhaustion (44). Tcf7 is required to sustain CD8+ T cells during chronic infection (31, 40, 44), but TCR and inflammatory signals promote TCF1 downregulation (96). We found that intratumoral T cells had high levels of transcripts associated with downstream TCR signaling, while dLN T cells had low expression of these transcripts. These data are consistent with the idea that the dLN may protect TSL cells from persistent antigen exposure. We hypothesize that intratumoral CD8+ T cells are unable to escape persistent antigen and that without migration from the dLN, the pool of tumor-specific CD8+ T cells would become exhausted. Moreover, because T cell clones that recognize tumor antigens with higher avidity (so called “best fit” clones) are more prone to exhaustion, the dLN likely plays an important role in preventing the loss of best fit clones over the course of tumor development. The splenic white pulp may play a similar role during chronic LCMV infection (31, 38), although both the white and red pulps are sites of LCMV Clone 13 infection (97). Our data also raise the question of whether intratumoral niches (like TLS) could exist in tumors to protect TSL cells from differentiation. We previously showed that TLS associated with late tumors in our models were sites for antigen presentation (60), but it remains to be seen whether tumor-proximal niches such as TLS could protect resident T cells from persistent antigen exposure (60, 91, 92).
Our data highlight the critical role of migration in the maintenance of TSL cells in tumors but are less consistent with the idea that T cells differentiate in the lymphoid tissue prior to migration. The latter has been seen in chronic LCMV infection (31, 38) and may be due to the ongoing infection in the tissue. By contrast, we observed that TCF1hi T cells differentiate within tumors, and that migration was required for the presence of TCFhi T cells in tumors. We cannot rule out the possibility that a low number of naïve-like T cells from other extratumoral tissues besides the dLN, such as the spleen or thymus, may contribute to the ongoing anti-tumor immune response over the time course studied, as FTY720 treatment could potentially block migration from these tissues as well. However the concordance of TCR sequences between dLN and tumor suggest that these contributions would be minimal. It is not clear what drives the migration of TSL cells from dLNs to tumors. DC migration from tumors to dLNs is important for priming T cells, but the role of DCs in maintenance of TSL cells in dLNs is uncertain (98, 99). One simple model is that periodic signals from migrating DCs are also necessary for maintaining the migratory T cell population. Critically, while we did not see the accumulation of less-differentiated T cells in dLNs upon FTY720 treatment, it is possible that FTY720 also blocks the migration of antigen-presenting DCs to LNs, which could impact the differentiation of TSL cells in the dLN. Further studies will be needed to test what signals are necessary for maintenance and migration of T cells in dLNs.
The role of the dLN in immunotherapy remains uncertain. Expression of PD-L1 on DCs is important for responses to anti-PD-L1 in some tumor models, and migratory DCs in tumor dLNs express both PD-L1 and the costimulatory receptor B7–2 (100). Moreover, PD-1 blockade can act in dLNs in transplant tumor models (101, 102). Whether PD-1 blockade acts outside the TME in humans is not known, but therapeutic efficacy after anti-PD-1 treatment in patients is associated with changes in immune cell populations in the peripheral blood (103, 104) and with the appearance of new T cell clones in the tumor after therapy (105–107). Our analyses of CD8+ T cells from humans showed the presence of TSL-like cells in LNs and tumors. However, as PD-1 blockade functions poorly in patients with cold tumors, this suggests that these patients either lack LN TSL cells or that PD-1 blockade is insufficient to drive therapeutic responses in LNs of these patients. Thus, identifying novel therapeutic strategies directed towards tumor-specific T cells in the dLN may be a means towards improving outcomes for cancer patients with cold tumors.
Materials and Methods
Study Design
The aim of this study was to investigate mechanisms by which CD8+ TSL cells are maintained in tumors over the course of cancer progression. We utilized an autochthonous model, as well as an orthotopic transplant mouse model, of lung adenocarcinoma in which tumor cells express the neoantigen GP33 from LCMV. We evaluated the presence of tumor-specific CD8+ TSL cells in various lymphoid and non-lymphoid tissues by FACs using tetramer-specific cell staining. We analyzed single-cell RNA-sequencing to assess the differentiation state and trajectory of the cell subsets present after FACs sorting on endogenous tetramer-specific CD8+ T cells from tumors and draining lymph nodes of tumor-bearing mice, comparing them to tetramer-specific CD8+ T cells from spleens of mice infected with acute or chronic LCMV. In order to determine the clonal relationship of these cells from tumors and draining lymph nodes, we analyzed single-cell TCR sequencing. We tested the effect of blocking lymphocyte migration into tumors after three weeks of FTY720 treatment in autochthonous mice by FACs. Lastly, to assess whether similar phenomena occur in humans, we analyzed a publicly available single cell RNA-sequencing dataset from lymph nodes and lungs of non-small cell lung cancer patients.
Mice
C57BL/6J mice (Jackson Laboratories) were used for all transplant experiments. KP × CCSP-rtTA mice, referred to here as KP mice were obtained from Tyler Jacks lab (50) and crossed to NINJA mice (59) to obtain KP-NINJA (KraslslG12D/+, p53fl/fl, R26-NINJA/NINJA, CCSP-rtTA+) mice. KP (KraslslG12D/+, p53fl/fl, CCSP-rtTA+) mice were used as controls in some cases. 6+ week-old male and female mice were used for all experiments and were sex-matched and age-matched for each individual experiment. All studies were carried out in accordance with procedures approved by the Institutional Animal Care and Use Committees of Yale University. All mice were bred in specific pathogen-free conditions.
Lung Tumor Initiation
Autochthonous tumor generation: KP-NINJA mice were infected intratracheally with 2.5 × 10⁷ PFU Ad5mSPC-Cre (Dr. Anton Berns, Netherlands Cancer Institute), after precipitation with 10mM CaCl2 for 20–60 minutes, or 5 × 10⁴ PFU Lenti-cre. To induce expression of NINJA neoantigen in infected cells, mice were given doxycycline hyclate chow (625mg/kg; Envigo cat. TD.09628) days 7–11 post infection (p.i.) and concomitantly treated with 4.4mg tamoxifen (MP Biomedicals cat. MP215673894) in corn oil (ThermoFisher Scientific cat. S25271) by gavage on days 8–10 p.i. To induce neoantigen expression via lentivirus, KP mice were infected with 2.5 × 10⁴ PFU mClover-GP33–80-Cre lentivirus and assessed at 8 weeks p.i. Orthotopic KPN1 tumor transplants: Established KPN1 cells were maintained in complete DMEM (10% HI-FBS, 55μM beta-mercaptoethanol, 1x Pen/Strep and 1x L-Glut). Prior to injection, cells were washed 3x with 1xPBS and 200,000 cells were injected intravenously via tail vein injection. Subcutaneous KPN1 transplants: Established KPN1 cells, sorted for GFP+ (NINJA-expressing) cells, were maintained in complete DMEM (10% HI-FBS, 55μM beta-mercaptoethanol, 1x Pen/Strep and 1x L-Glut). Prior to injection, cells were washed 3x with 1xPBS and 500,000 cells were injected s.c. and measured using standard caliper measurements. Tumor volume = (LxW2)/2.
Tissue processing for flow cytometry
Prior to sacrifice, mice were injected retro-orbitally with 200uL anti-CD45-PECF594 in 1X PBS (1:200; BD Biosciences Cat# 562420). After 2–3 minutes, lungs (or thymus) were harvested at various time points ranging from 8–25 weeks p.i. into Collagenase IV (Worthington Biochemical, cat. LS004189) Buffer (1x HEPES buffer, 0.5mg/mL Collagenase IV, 20μg/mL DNase in 1x HBSS with MgCl2 and CaCl2) and run on the default Lung_01 protocol on a gentleMACS Dissociator instrument (Miltenyi Biotec). Samples were then incubated at 37°C for 30 min and further dissociated with default Lung_02 protocol. Digestion was quenched by adding 500 μL FBS. Bone marrow was collected from femurs and processed into single cell suspensions. Samples were then strained through 70 μm cell strainers, washed with 1% HI-FBS RPMI-1640 (ThermoFisher Scientific cat. 11875085) and red blood cells were lysed using 1x RBC Lysis Buffer (eBioscience, cat. 00–4333-57). Cells were counted using a hemocytometer for absolute number calculations. Lymph nodes (as well as spleens) were concomitantly harvested from tumor-bearing mice, and processed as described in (108). Single cell suspensions were stained using one of two antibody panels (see Flow cytometry section) in addition to tetramer for H2Db/GP33–43-specific CD8+ T cells (NIH Tetramer Core Facility). For intracellular staining, FoxP3/Transcription Factor Staining Buffer set (eBioscience cat# 00–5523-00) was used as per manufacturer’s protocol. Cells were washed and resuspended in FACs Buffer (0.5% FBS, 20% sodium azide in water, PBS 1X without Mg2+/Ca2+) until analysis on a BD LSRII flow cytometer (BD Biosciences).
Ex Vivo IFNγ expression
Single cell suspensions were obtained as described above. The number of cells from draining lymph nodes and tumors was determined using hemocytometer. Samples were then plated in 96-well flat bottom plates at a ratio of 25:75 with CD45.1 splenocytes and stimulated in 10% HI-FBS RPMI-1640 (Thermo Fisher Scientific cat. 11875085) containing Brefeldin A (eBioscience cat. 00–4506-51), and LCMV GP33–41 peptide (AnaSpec cat. AS-61296), or left unstimulated in 10% HI-FBS RPMI-1640 (ThermoFisher Scientific cat. 11875085) containing Brefeldin A (eBioscience cat. 00–4506-51). Plates were incubated for 4–6 hours at 37°C, and samples were then transferred to 96-well round bottom plates. Samples were stained for extracellular markers (see Flow cytometry section), fixed with BD Cytofix/Cytoperm Fixation/Permeabilization Solution kit (BD Biosciences cat. 554714), and stained with anti-IFNγ for intracellular cytokine assessment (see Flow cytometry section) in BD Perm/wash Buffer (BD Biosciences cat. 554714) as per manufacturer’s protocol.
Flow cytometry
Cells were prepared from various tissues and stained with extracellular antibodies in FACs Buffer (0.5% FBS, 20% sodium azide in water, PBS 1X without Mg2+/Ca2+). Staining reagents included PECF594 anti-CD45 (30-F11) and FITC anti-IFNγ (XMG1.2) from BD Biosciences; PERCP anti-CD90.2 (30-H12), BV421 anti-CD279 (PD-1; 29F.1A12), APCFire750 anti-CD90.1 (THY1.2; OX-7), BV605 anti-CD90.2 (30-H12), PECY7 anti-CD366 (TIM3; RMT3–23), BV421 anti-CD279 (29F.1A12), PE anti-SLAMF6 (330-AJ), BV421 anti-CD8α (53–6.7), BV711 anti-CD44 (IM7), APC/Fire750 anti-CD90.1 (THY1.1; IM7), and APC-Cy7 anti-CD45.1 (A20) from Biolegend, FITC anti-CD8α (CT-CD8α), and PeCy5 anti-CD8α (CT-CD8α) from Thermo Fischer Scientific; PE TCF1/7 (C63D9) from Cell Signaling Technologies. H-2D(b) LCMV GP 33–41 tetramer-KAVYNFATM-APC was provided by the NIH tetramer core. Cells were stained at 4°C for 30 minutes followed by fixation and permeabilization with apropriate intracellular staining kit. For intracellular staining of cytokines, the Cytofix/Cytoperm Fixation/Permeabilization Solution Kit from BD Biosciences was used as per manufacturer’s protocol. For intracellular staining, FoxP3/Transcription Factor Staining Buffer set (eBioscience cat# 00–5523-00) was used as per manufacturer’s protocol. Data were collected on LSRII cytometer (BD Biosciences). For sorting, indicated populations were sorted to >90% purity with FACSAria III cytometer (BD Biosciences).
Histology and IHC staining
Tumor-bearing lungs of KP-NINJA mice were fixed in 1x Formalin solutions in PBS (Millipore-Sigma) for 24 hours at 4°C, switched into 70% ETOH, and submitted to Yale histology core for paraffin embedding, sectioning, and hematoxylin and eosin (H&E) staining. Unstained slides of KP-NINJA autochthonous lung tumors were stained with anti-CD3 (ab5690) using the ImmPACT DAB Peroxidase kit (Vector Labs) for immunohistochemistry. H&E and anti-CD3 IHC stained sections were imaged on a Nikon TE2000 microscope (Micro Video Instruments, Inc. Avon, MA) using a 20x objective.
FTY720 Treatment
KP-NINJA mice were infected intratracheally with 2.5 × 10⁷ PFU Ad5mSPC-Cre (Dr. Anton Berns, Netherlands Cancer Institute) and treated with tamoxifen and doxycycline as previously described. From 6 to 9 weeks following intratracheal infection, mice were treated with 0.3 mg/kg FTY720 or vehicle (saline) i.p. every other day.
Cell line generation
The generation of the KPN1 cell line has been described (62). Briefly, KP-NINJA mice were infected intratracheally with 5 × 10⁴ PFU of lentiviral vector LV-rtta3-Cre. KP-NINJA mice were treated with doxycycline and tamoxifen as described to induce NINJA expression in transformed cells. Tumor-bearing lungs of all mice were harvested 20 weeks p.i., minced with scissors, and rotated at 37 C for 40 minutes in Collagenase IV Buffer + 2 mg/mL Dispase II (Sigma Aldrich cat. 04942078001). Homogenate was filtered through a cell strainer (Corning cat. 352340) and centrifuged at 200xg for 4 minutes at room temperature. Pellet was resuspended and cultured at 37°C and 5% CO2 in complete DMEM (DMEM + 10% FBS + 1% P/S), + 1x Gentamicin for the first 2 passages. After 6+ passages fibroblasts were visually undetectable and cell lines were verified to be 100% Kras-transformed by treating with puromycin (unrecombined Kras in this mouse confers puromycin resistance).
LCMV-Clone 13 and -Armstrong infections
For Chronic and acute LCMV infections, 7–10 weeks old C57BL/6 mice were infected intraperitoneally with 2×10⁶ PFU/mouse of LCMV-Clone 13 or LCMV-Armstrong (Figure S3I–K), respectfully. Mice were euthanized 28 days after infection to collect and process spleens as previously described (108).
Sorting and single cell RNA- and TCR- sequencing of GP33-specific CD8+ T cells
KP-NINJA mice were infected with Ad5mSPC-Cre, treated with doxycycline and tamoxifen, and lungs and dLN were harvested 8 and 17 weeks p.i. after i.v. injection of anti-CD45-PECF594 antibody (clone 30-F11, BD Biosciences), as described. Spleens were harvested from C57BL/6 mice 28 days following infection with LCMV-Clone 13 (or LCMV-Armstrong – Figure S3I–K). Tissues were dissociated as previously described and GP33-specific CD8+ T cells were sorted (i.v.CD45−CD8+GP33-loaded MHC I tetramer+) and submitted to the Yale Center for Genome Analysis for single-cell RNA and TCR sequencing. Single cell RNA-sequencing data was demultiplexed using Cell Ranger 3.0 Software and then further analyzed using Python. Data represents cells from n=3 pooled at each time point. Pooled GP33-specific endogenous cells from tumors and matched dLNs, as well as from spleens, were submitted for 10X single cell RNA-and TCR-sequencing to Yale Center for Genome Analysis (YCGA).
Motif Analysis
Consensus motifs in grouped CDR3 amino acid sequences were identified using two motif based sequencing analysis tools: Multiple Em for Motif Elicitation (MEME) and Gapped Local Alignment of Motifs (GLAM2) (1). The motif analysis across all four samples (early and late dLN and tumor) was performed separately for TCR alpha and TCR beta chain, including clones with ≥ 2 cells only. At first, fasta files were created separately, including TCR alpha or TCR beta CDR3 amino acid sequences for the clones with ≥ 2 cells, using Biostrings package. These fasta files were used as input files for motif analysis, separately for each chain. Filtration of CDR3 amino acid sequences were performed based on low alignment scores by GLAM2. From there, CDR3 amino acid sequences for each chain were further sub-grouped into separate fasta files based on similarity in sequences and alignment scores. Each sub-group of sequences for each chain were run for motif analysis using GLAM2 function and a position weight matrix as an output to define the motif for each sub group of sequences, either for TCR alpha or beta chain. The contribution of clones from each of the four samples to each motif (either for TCR alpha or TCR beta chain), were traced back using the clone IDs. Following this, consensus motif for each chain was defined as having clones shared by all four samples and ranked in an order based on the number of clones giving rise to each motif (Table S1).
Bioinformatics analysis of GP33-specific CD8+ T cells
Single cell RNA- and TCR-sequencing data from LCMV-Clone 13, LCMV-Armstrong, early and late dLNs and tumors was processed with CellRanger 3.1 using the mm10 mouse genome indices from 10x genomics. Number of cells analyzed and genes detected for each sample: Chronic LCMV(1,185 and11,595), Acute LCMV(10,768 and 12,960), early dLN (1,742 and 12,116), late dLN (876 and 11,595), early tumor (806 and 11,749), and late tumor (731 and 11,150). The libraries were further pre-processed in Python using the scprep package (github.com/krishnaswamylab/scprep). Cells with library size below 1000 UMI/cell and rare genes (genes detected in fewer than 5 cells) were removed. The data was then normalized by library size to 1,000 counts per cell and square-root transformed.
For visualization, PHATE (72) was used to embed the cells into two dimensions based on transcriptional profiles, allowing for visual comparison of global and local similarities between cells. Groups of similar cells were identified by running spectral clustering on our input data. For visualizing gene expression, we imputed missing and dropped-out values with MAGIC and visualized on PHATE (109). A small percentage of the cells were found to have low expression of CD8a after de-noising, and excluded from further analysis. Cell clusters for GP33-specific CD8+ T cells from chronic LCMV Clone 13 infection were visualized using PHATE maps and colored based on clustering into arbitrary 7 clusters. Similar to UMAP projections, the organization of clusters and the relative distances between clusters on PHATE embeddings have meaning (i.e., closely related clusters are located in closer physical proximity).
To analyze the cellular trajectories and infer pseudotime, we used the scVelo stochastic model (75, 110) stochastic model. Pseudotime was computed on the basis of the inferred velocity graph with scVelo.
Single group TCR sequence diversity was calculated using Simpson’s index based on number of clones and number of cells with clonal sequences (shared by 2 or more cells). Number of clonal sequences and number of cells with clonal sequences, respectfully: Early tumor (448 and 767), Early dLN (1098 and 1734), Late tumor (216 and 675), Late dLN (346 and 886). Morisita-Horn index between samples was calculated to compare overlap between samples. These calculations were conducted using R program.
Human CD8+ T cell single cell RNA-sequencing analysis
Single cell data was obtained from Gene Expression Omnibus (GEO) by accession code GSE131907 (81). Data processing, analysis and visualization were conducted using R program with package Seurat (v 3.1.0). Only CD8+ T cells (original labels “CD8 low T”, “Cytotoxic CD8+ T”, “Naive CD8+ T” and “Exhausted CD8+ T”) with tissues from tumor or normal lungs, and metastatic or normal lymph nodes (original labels “tLung”, “nLung”, “mLN” and “nLN”) were used for the analysis. Raw gene counts were log-normalized by Seurat function NormalizeData with parameter normalization.method set to “LogNormalize”. Cell clusters were identified from the normalized data using functions FindNeighbors and FindClusters on top 20 PCs and resolution 0.75. UMAP was used to visualize cell clusters based on top 20 PCs. For the marker gene expression heatmap, relative abundances for each gene were calculated as Z-scaled average of log2(RC+1). Here RC are relative counts calculated by Seurat function NormalizeData with parameter normalization.method set to “RC”.
Statistical analyses
All statistical analyses were performed using Prism V8.3.0 software.
Figure Design
Figures 1A, 1B, 2A, and 5A were created with BioRender.com.
Supplementary Material
Fig. S1: Representative FACS plots
Fig. S2: Tumor-specific TCF1+CD8+ T cells are present throughout disease progression in transplant KP-NINJA lung tumors
Fig. S3: Gene expression plots for LCMV, early and late dLNs and tumor comparisons
Fig. S4: Gene expression and transcript dynamics for co-embedded samples
Table 1: TCRA and TCRB motifs from T cells in tumors and dLNs
Table 2: Raw data file (excel spreadsheet)
Acknowledgements
We thank Joshi lab members for reviewing the manuscript. We also thank the Yale Cancer Center (P30 CA016359 40), Yale Flow Cytometry Core, Yale Center for Genomics Analysis, and Yale School of Medicine Histology Facility. For Ad5mSPC-Cre we thank Dr. Anton Berns (Netherlands Cancer Institute). We also thank Dr. John Wherry (University of Pennsylvania) for the generous gift of LCMV clone 13.
Funding:
This work was supported by grants from the NCI K22CA200912 (N.S.J.), Young Investigator Award- Melanoma Research Alliance (N.S.J.), Career Enhancement Award from Yale SPORE in lung cancer 1P50CA196530 (N.S.J.), a grant from the Lung Cancer Research Foundation (LCRF) (N.S.J.), NCI 1RO1CA237037–01A1 (N.S.J.), an American Lung Association Discovery Award (N.S.J.), the Yale Cancer Center Leslie Warner Postdoctoral Fellowship (K.A.C.), the Interdisciplinary Immunology Training Program NIH AI07019 (K.A.C.), AI125741 (W.C.), AI148403 (W.C.), American Cancer Society Research Scholar Grant (W.C.), Novo Nordisk grant NNF20OC0063436 (S.K.), and HIPC NIH grant AI089992 (S.K.). M.Y.K. is a member of the Medical Scientist Training Program at the Medical College of Wisconsin, which is partially supported by a training grant from NIGMS (T32-GM080202). This work was also funded in part by the NHLBI-funded postdoctoral fellowship: T32 HL007974 (G.F.). GF is a PhD Student in the Investigative Medicine Program at Yale which is supported by CTSA Grant Number UL1 TR001863 from the National Center for Advancing Translational Science (NCATS), a component of the NIH.
Footnotes
Competing interests: S.K. is a paid advisor for ImmuneAI. This relationship did not influence the work performed in this study. The other authors declare that they have no competing interests.
Data and materials availability:
RNA- and TCR-seq data from this study are deposited in GEO under accession number GSE182509. Ad5mSPC-Cre was obtained from Dr. Anton Berns at the Netherlands Cancer Institute (a.berns2@nki.nl). All data needed to evaluate the conclusions in this paper are present in the paper or he Supplemental Materials.
References
- 1.Bailey TL, Boden M, Buske FA, Frith M, Grant CE, Clementi L, Ren J, Li WW, Noble WS, MEME SUITE: tools for motif discovery and searching. Nucleic acids research 37, W202–208 (2009). [DOI] [PMC free article] [PubMed] [Google Scholar]
- 2.Duma N, Santana-Davila R, Molina JR, Non-Small Cell Lung Cancer: Epidemiology, Screening, Diagnosis, and Treatment. Mayo Clin Proc 94, 1623–1640 (2019). [DOI] [PubMed] [Google Scholar]
- 3.Howlader N, Forjaz G, Mooradian MJ, Meza R, Kong CY, Cronin KA, Mariotto AB, Lowy DR, Feuer EJ, The Effect of Advances in Lung-Cancer Treatment on Population Mortality. N Engl J Med 383, 640–649 (2020). [DOI] [PMC free article] [PubMed] [Google Scholar]
- 4.Herbst RS, Soria J-C, Kowanetz M, Fine GD, Hamid O, Gordon MS, Sosman JA, McDermott DF, Powderly JD, Gettinger SN, Kohrt HEK, Horn L, Lawrence DP, Rost S, Leabman M, Xiao Y, Mokatrin A, Koeppen H, Hegde PS, Mellman I, Chen DS, Hodi FS, Predictive correlates of response to the anti-PD-L1 antibody MPDL3280A in cancer patients. Nature 515, 563–567 (2014). [DOI] [PMC free article] [PubMed] [Google Scholar]
- 5.Taube JM, Anders RA, Young GD, Xu H, Sharma R, McMiller TL, Chen S, Klein AP, Pardoll DM, Topalian SL, Chen L, Colocalization of Inflammatory Response with B7-H1 Expression in Human Melanocytic Lesions Supports an Adaptive Resistance Mechanism of Immune Escape. Sci Transl Med 4, (2012). [DOI] [PMC free article] [PubMed] [Google Scholar]
- 6.Chen DS, Mellman I, Elements of cancer immunity and the cancer-immune set point. Nature 541, 321–330 (2017). [DOI] [PubMed] [Google Scholar]
- 7.Sanmamed MF, Chen L, A Paradigm Shift in Cancer Immunotherapy: From Enhancement to Normalization. Cell 175, 313–326 (2018). [DOI] [PMC free article] [PubMed] [Google Scholar]
- 8.Spranger S, Koblish HK, Horton B, Scherle PA, Newton R, Gajewski TF, Mechanism of tumor rejection with doublets of CTLA-4, PD-1/PD-L1, or IDO blockade involves restored IL-2 production and proliferation of CD8+ T cells directly within the tumor microenvironment. J Immunother Cancer 2, 1–14 (2014). [DOI] [PMC free article] [PubMed] [Google Scholar]
- 9.Wherry EJ, Ha SJ, Kaech SM, Haining WN, Sarkar S, Kalia V, Subramaniam S, Blattman JN, Barber DL, Ahmed R, Molecular signature of CD8+ T cell exhaustion during chronic viral infection. Immunity 27, 670–684 (2007). [DOI] [PubMed] [Google Scholar]
- 10.Angelosanto JM, Blackburn SD, Crawford A, Wherry EJ, Progressive loss of memory T cell potential and commitment to exhaustion during chronic viral infection. J Virol 86, 8161–8170 (2012). [DOI] [PMC free article] [PubMed] [Google Scholar]
- 11.Doering TA, Crawford A, Angelosanto JM, Paley MA, Ziegler CG, Wherry EJ, Network analysis reveals centrally connected genes and pathways involved in CD8+ T cell exhaustion versus memory. Immunity 37, 1130–1144 (2012). [DOI] [PMC free article] [PubMed] [Google Scholar]
- 12.Wu T, Ji Y, Moseman EA, Xu HC, Manglani M, Kirby M, Anderson SM, Handon R, Kenyon E, Elkahloun A, Wu W, Lang PA, Gattinoni L, McGavern DB, Schwartzberg PL, TCF1-Bcl6 axis counteracts type I interferon to repress exhaustion and maintain T cell stemness. Sci. Immunol 1, 12 (2016). [DOI] [PMC free article] [PubMed] [Google Scholar]
- 13.Sakuishi K, Apetoh L, Sullivan JM, Blazar BR, Kuchroo VK, Anderson AC, Targeting Tim-3 and PD-1 pathways to reverse T cell exhaustion and restore anti-tumor immunity. J Exp Med 207, 2187–2194 (2010). [DOI] [PMC free article] [PubMed] [Google Scholar]
- 14.Fuller MJ, Khanolkar A, Tebo AE, Zajac AJ, Maintenance, loss, and resurgence of T cell responses during acute, protracted, and chronic viral infections. J Immunol 172, 4204–4214 (2004). [DOI] [PubMed] [Google Scholar]
- 15.Wherry EJ, Blattman JN, Murali-Krishna K, van der Most R, Ahmed R, Viral persistence alters CD8 T-cell immunodominance and tissue distribution and results in distinct stages of functional impairment. J Virol 77, 4911–4927 (2003). [DOI] [PMC free article] [PubMed] [Google Scholar]
- 16.Agnellini P, Wolint P, Rehr M, Cahenzli J, Karrer U, Oxenius A, Impaired NFAT nuclear translocation results in split exhaustion of virus-specific CD8+ T cell functions during chronic viral infection. Proc Natl Acad Sci U S A 104, 4565–4570 (2007). [DOI] [PMC free article] [PubMed] [Google Scholar]
- 17.Zhou S, Ou R, Huang L, Price GE, Moskophidis D, Differential tissue-specific regulation of antiviral CD8+ T-cell immune responses during chronic viral infection. J Virol 78, 3578–3600 (2004). [DOI] [PMC free article] [PubMed] [Google Scholar]
- 18.Shin H, Blackburn SD, Intlekofer AM, Kao C, Angelosanto JM, Reiner SL, Wherry EJ, A role for the transcriptional repressor Blimp-1 in CD8(+) T cell exhaustion during chronic viral infection. Immunity 31, 309–320 (2009). [DOI] [PMC free article] [PubMed] [Google Scholar]
- 19.Mackerness KJ, Cox MA, Lilly LM, Weaver CT, Harrington LE, Zajac AJ, Pronounced virus-dependent activation drives exhaustion but sustains IFN-gamma transcript levels. J Immunol 185, 3643–3651 (2010). [DOI] [PMC free article] [PubMed] [Google Scholar]
- 20.Bolouri H, Young M, Beilke J, Johnson R, Fox B, Huang L, Santini CC, Hill CM, Vries AVV, Shannon PT, Dervan A, Sivakumar P, Trotter M, Bassett D, Ratushny A, Integrative network modeling reveals mechanisms underlying T cell exhaustion. Sci Rep 10, 1915 (2020). [DOI] [PMC free article] [PubMed] [Google Scholar]
- 21.Chen Z, Ji Z, Ngiow SF, Manne S, Cai Z, Huang AC, Johnson J, Staupe RP, Bengsch B, Xu C, Yu S, Kurachi M, Herati RS, Vella LA, Baxter AE, Wu JE, Khan O, Beltra JC, Giles JR, Stelekati E, McLane LM, Lau CW, Yang X, Berger SL, Vahedi G, Ji H, Wherry EJ, TCF-1-Centered Transcriptional Network Drives an Effector versus Exhausted CD8 T Cell-Fate Decision. Immunity 51, 840–855 e845 (2019). [DOI] [PMC free article] [PubMed] [Google Scholar]
- 22.Martins GA, Cimmino L, Liao J, Magnusdottir E, Calame K, Blimp-1 directly represses Il2 and the Il2 activator Fos, attenuating T cell proliferation and survival. J Exp Med 205, 1959–1965 (2008). [DOI] [PMC free article] [PubMed] [Google Scholar]
- 23.Rutishauser RL, Martins GA, Kalachikov S, Chandele A, Parish IA, Meffre E, Jacob J, Calame K, Kaech SM, Transcriptional repressor Blimp-1 promotes CD8(+) T cell terminal differentiation and represses the acquisition of central memory T cell properties. Immunity 31, 296–308 (2009). [DOI] [PMC free article] [PubMed] [Google Scholar]
- 24.Hudson WH, Gensheimer J, Hashimoto M, Wieland A, Valanparambil RM, Li P, Lin JX, Konieczny BT, Im SJ, Freeman GJ, Leonard WJ, Kissick HT, Ahmed R, Proliferating Transitory T Cells with an Effector-like Transcriptional Signature Emerge from PD-1(+) Stem-like CD8(+) T Cells during Chronic Infection. Immunity 51, 1043–1058 e1044 (2019). [DOI] [PMC free article] [PubMed] [Google Scholar]
- 25.Blackburn SD, Shin H, Haining WN, Zou T, Workman CJ, Polley A, Betts MR, Freeman GJ, Vignali DA, Wherry EJ, Coregulation of CD8+ T cell exhaustion by multiple inhibitory receptors during chronic viral infection. Nat Immunol 10, 29–37 (2009). [DOI] [PMC free article] [PubMed] [Google Scholar]
- 26.Li J, He Y, Hao J, Ni L, Dong C, High Levels of Eomes Promote Exhaustion of Anti-tumor CD8(+) T Cells. Front Immunol 9, 2981 (2018). [DOI] [PMC free article] [PubMed] [Google Scholar]
- 27.Khan O, Giles JR, McDonald S, Manne S, Ngiow SF, Patel KP, Werner MT, Huang AC, Alexander KA, Wu JE, Attanasio J, Yan P, George SM, Bengsch B, Staupe RP, Donahue G, Xu W, Amaravadi RK, Xu X, Karakousis GC, Mitchell TC, Schuchter LM, Kaye J, Berger SL, Wherry EJ, TOX transcriptionally and epigenetically programs CD8(+) T cell exhaustion. Nature 571, 211–218 (2019). [DOI] [PMC free article] [PubMed] [Google Scholar]
- 28.Scott AC, Dundar F, Zumbo P, Chandran SS, Klebanoff CA, Shakiba M, Trivedi P, Menocal L, Appleby H, Camara S, Zamarin D, Walther T, Snyder A, Femia MR, Comen EA, Wen HY, Hellmann MD, Anandasabapathy N, Liu Y, Altorki NK, Lauer P, Levy O, Glickman MS, Kaye J, Betel D, Philip M, Schietinger A, TOX is a critical regulator of tumour-specific T cell differentiation. Nature 571, 270–274 (2019). [DOI] [PMC free article] [PubMed] [Google Scholar]
- 29.Seo H, Chen J, Gonzalez-Avalos E, Samaniego-Castruita D, Das A, Wang YH, Lopez-Moyado IF, Georges RO, Zhang W, Onodera A, Wu CJ, Lu LF, Hogan PG, Bhandoola A, Rao A, TOX and TOX2 transcription factors cooperate with NR4A transcription factors to impose CD8(+) T cell exhaustion. Proc Natl Acad Sci U S A 116, 12410–12415 (2019). [DOI] [PMC free article] [PubMed] [Google Scholar]
- 30.Alfei F, Kanev K, Hofmann M, Wu M, Ghoneim HE, Roelli P, Utzschneider DT, von Hoesslin M, Cullen JG, Fan Y, Eisenberg V, Wohlleber D, Steiger K, Merkler D, Delorenzi M, Knolle PA, Cohen CJ, Thimme R, Youngblood B, Zehn D, TOX reinforces the phenotype and longevity of exhausted T cells in chronic viral infection. Nature 571, 265–269 (2019). [DOI] [PubMed] [Google Scholar]
- 31.Im SJ, Hashimoto M, Gerner MY, Lee J, Kissick HT, Burger MC, Shan Q, Hale JS, Lee J, Nasti TH, Sharpe AH, Freeman GJ, Germain RN, Nakaya HI, Xue HH, Ahmed R, Defining CD8+ T cells that provide the proliferative burst after PD-1 therapy. Nature 537, 417–421 (2016). [DOI] [PMC free article] [PubMed] [Google Scholar]
- 32.Kanev K, Wu M, Drews A, Roelli P, Wurmser C, von Hosslin M, Zehn D, Proliferation-competent Tcf1+ CD8 T cells in dysfunctional populations are CD4 T cell help independent. Proc Natl Acad Sci U S A 116, 20070–20076 (2019). [DOI] [PMC free article] [PubMed] [Google Scholar]
- 33.Miller BC, Sen DR, Al Abosy R, Bi K, Virkud YV, LaFleur MW, Yates KB, Lako A, Felt K, Naik GS, Manos M, Gjini E, Kuchroo JR, Ishizuka JJ, Collier JL, Griffin GK, Maleri S, Comstock DE, Weiss SA, Brown FD, Panda A, Zimmer MD, Manguso RT, Hodi FS, Rodig SJ, Sharpe AH, Haining WN, Subsets of exhausted CD8(+) T cells differentially mediate tumor control and respond to checkpoint blockade. Nat Immunol 20, 326–336 (2019). [DOI] [PMC free article] [PubMed] [Google Scholar]
- 34.Siddiqui I, Schaeuble K, Chennupati V, Fuertes Marraco SA, Calderon-Copete S, Pais Ferreira D, Carmona SJ, Scarpellino L, Gfeller D, Pradervand S, Luther SA, Speiser DE, Held W, Intratumoral Tcf1(+)PD-1(+)CD8(+) T Cells with Stem-like Properties Promote Tumor Control in Response to Vaccination and Checkpoint Blockade Immunotherapy. Immunity 50, 195–211 e110 (2019). [DOI] [PubMed] [Google Scholar]
- 35.He R, Hou S, Liu C, Zhang A, Bai Q, Han M, Yang Y, Wei G, Shen T, Yang X, Xu L, Chen X, Hao Y, Wang P, Zhu C, Ou J, Liang H, Ni T, Zhang X, Zhou X, Deng K, Chen Y, Luo Y, Xu J, Qi H, Wu Y, Ye L, Follicular CXCR5- expressing CD8(+) T cells curtail chronic viral infection. Nature 537, 412–428 (2016). [DOI] [PubMed] [Google Scholar]
- 36.Leong YA, Chen Y, Ong HS, Wu D, Man K, Deleage C, Minnich M, Meckiff BJ, Wei Y, Hou Z, Zotos D, Fenix KA, Atnerkar A, Preston S, Chipman JG, Beilman GJ, Allison CC, Sun L, Wang P, Xu J, Toe JG, Lu HK, Tao Y, Palendira U, Dent AL, Landay AL, Pellegrini M, Comerford I, McColl SR, Schacker TW, Long HM, Estes JD, Busslinger M, Belz GT, Lewin SR, Kallies A, Yu D, CXCR5(+) follicular cytotoxic T cells control viral infection in B cell follicles. Nat Immunol 17, 1187–1196 (2016). [DOI] [PubMed] [Google Scholar]
- 37.Brummelman J, Mazza EMC, Alvisi G, Colombo FS, Grilli A, Mikulak J, Mavilio D, Alloisio M, Ferrari F, Lopci E, Novellis P, Veronesi G, Lugli E, High-dimensional single cell analysis identifies stem-like cytotoxic CD8(+) T cells infiltrating human tumors. J Exp Med 215, 2520–2535 (2018). [DOI] [PMC free article] [PubMed] [Google Scholar]
- 38.Im SJ, Konieczny BT, Hudson WH, Masopust D, Ahmed R, PD-1+ stemlike CD8 T cells are resident in lymphoid tissues during persistent LCMV infection. Proc Natl Acad Sci U S A 117, 4292–4299 (2020). [DOI] [PMC free article] [PubMed] [Google Scholar]
- 39.Jadhav RR, Im SJ, Hu B, Hashimoto M, Li P, Lin JX, Leonard WJ, Greenleaf WJ, Ahmed R, Goronzy JJ, Epigenetic signature of PD-1+ TCF1+ CD8 T cells that act as resource cells during chronic viral infection and respond to PD-1 blockade. Proc Natl Acad Sci U S A 116, 14113–14118 (2019). [DOI] [PMC free article] [PubMed] [Google Scholar]
- 40.Utzschneider DT, Charmoy M, Chennupati V, Pousse L, Ferreira DP, Calderon-Copete S, Danilo M, Alfei F, Hofmann M, Wieland D, Pradervand S, Thimme R, Zehn D, Held W, T Cell Factor 1-Expressing Memory-like CD8+ T Cells Sustain the Immune Response to Chronic Viral Infections. Immunity 45, 415–427 (2016). [DOI] [PubMed] [Google Scholar]
- 41.Kurtulus S, Madi A, Escobar G, Klapholz M, Nyman J, Christian E, Pawlak M, Dionne D, Xia J, Rozenblatt-Rosen O, Kuchroo VK, Regev A, Anderson AC, Checkpoint Blockade Immunotherapy Induces Dynamic Changes in PD-1(−)CD8(+) Tumor-Infiltrating T Cells. Immunity 50, 181–194 e186 (2019). [DOI] [PMC free article] [PubMed] [Google Scholar]
- 42.Paley MA, Kroy DC, Odorizzi PM, Johnnidis JB, Dolfi DV, Barnett BE, Bikoff EK, Robertson EJ, Lauer GM, Reiner SL, Wherry EJ, Progenitor and Terminal Subsets of CD8+ T cells Cooperate to Contain Chronic Viral Infection. Science 338, 1220–1225 (2012). [DOI] [PMC free article] [PubMed] [Google Scholar]
- 43.Beltra JC, Manne S, Abdel-Hakeem MS, Kurachi M, Giles JR, Chen Z, Casella V, Ngiow SF, Khan O, Huang YJ, Yan P, Nzingha K, Xu W, Amaravadi RK, Xu X, Karakousis GC, Mitchell TC, Schuchter LM, Huang AC, Wherry EJ, Developmental Relationships of Four Exhausted CD8(+) T Cell Subsets Reveals Underlying Transcriptional and Epigenetic Landscape Control Mechanisms. Immunity 52, 825–841 e828 (2020). [DOI] [PMC free article] [PubMed] [Google Scholar]
- 44.Utzschneider DT, Alfei F, Roelli P, Barras D, Chennupati V, Darbre S, Delorenzi M, Pinschewer DD, Zehn D, High antigen levels induce an exhausted phenotype in a chronic infection without impairing T cell expansion and survival. J Exp Med 213, 1819–1834 (2016). [DOI] [PMC free article] [PubMed] [Google Scholar]
- 45.Jackson EL, Olive KP, Tuveson DA, Bronson R, Crowley D, Brown M, Jacks T, The differential effects of mutant p53 alleles on advanced murine lung cancer. Cancer Res 65, 10280–10288 (2005). [DOI] [PubMed] [Google Scholar]
- 46.Sweet-Cordero A, Mukherjee S, Subramanian A, You H, Roix JJ, Ladd-Acosta C, Mesirov J, Golub TR, Jacks T, An oncogenic KRAS2 expression signature identified by cross-species gene-expression analysis. Nat Genet 37, 48–55 (2005). [DOI] [PubMed] [Google Scholar]
- 47.Winslow MM, Dayton TL, Verhaak RG, Kim-Kiselak C, Snyder EL, Feldser DM, Hubbard DD, DuPage MJ, Whittaker CA, Hoersch S, Yoon S, Crowley D, Bronson RT, Chiang DY, Meyerson M, Jacks T, Suppression of lung adenocarcinoma progression by Nkx2–1. Nature 473, 101–104 (2011). [DOI] [PMC free article] [PubMed] [Google Scholar]
- 48.Snyder EL, Watanabe H, Magendantz M, Hoersch S, Chen TA, Wang DG, Crowley D, Whittaker CA, Meyerson M, Kimura S, Jacks T, Nkx2–1 represses a latent gastric differentiation program in lung adenocarcinoma. Mol Cell 50, 185–199 (2013). [DOI] [PMC free article] [PubMed] [Google Scholar]
- 49.DuPage M, Cheung AF, Mazumdar C, Winslow MM, Bronson R, Schmidt LM, Crowley D, Chen J, Jacks T, Endogenous T cell responses to antigens expressed in lung adenocarcinomas delay malignant tumor progression. Cancer Cell 19, 72–85 (2011). [DOI] [PMC free article] [PubMed] [Google Scholar]
- 50.DuPage M, Dooley AL, Jacks T, Conditional mouse lung cancer models using adenoviral or lentiviral delivery of Cre recombinase. Nature Protocols 4, 1064–1072 (2009). [DOI] [PMC free article] [PubMed] [Google Scholar]
- 51.DuPage M, Mazumdar C, Schmidt LM, Cheung AF, Jacks T, Expression of tumour-specific antigens underlies cancer immunoediting. Nature 482, 405–409 (2012). [DOI] [PMC free article] [PubMed] [Google Scholar]
- 52.Hegde S, Krisnawan VE, Herzog BH, Zuo C, Breden MA, Knolhoff BL, Hogg GD, Tang JP, Baer JM, Mpoy C, Lee KB, Alexander KA, Rogers BE, Murphy KM, Hawkins WG, Fields RC, DeSelm CJ, Schwarz JK, DeNardo DG, Dendritic Cell Paucity Leads to Dysfunctional Immune Surveillance in Pancreatic Cancer. Cancer Cell 37, 289–307 e289 (2020). [DOI] [PMC free article] [PubMed] [Google Scholar]
- 53.Spranger S, Luke JJ, Bao R, Zha Y, Hernandez KM, Li Y, Gajewski AP, Andrade J, Gajewski TF, Density of immunogenic antigens does not explain the presence or absence of the T-cell-inflamed tumor microenvironment in melanoma. Proc Natl Acad Sci U S A 113, E7759–E7768 (2016). [DOI] [PMC free article] [PubMed] [Google Scholar]
- 54.Schietinger A, Philip M, Krisnawan VE, Chiu EY, Delrow JJ, Basom RS, Lauer P, Brockstedt DG, Knoblaugh SE, Hammerling GJ, Schell TD, Garbi N, Greenberg PD, Tumor-Specific T Cell Dysfunction Is a Dynamic Antigen-Driven Differentiation Program Initiated Early during Tumorigenesis. Immunity 45, 389–401 (2016). [DOI] [PMC free article] [PubMed] [Google Scholar]
- 55.Van Pel A, Georlette M, Boon T, Tumor cell variants obtained by mutagenesis of a Lewis lung carcinoma cell line: Immune rejection by syngeneic mice. Proc Natl Acad Sci U S A 76, 5282–5285 (1979). [DOI] [PMC free article] [PubMed] [Google Scholar]
- 56.Cheung AF, Dupage MJ, Dong HK, Chen J, Jacks T, Regulated expression of a tumor-associated antigen reveals multiple levels of T-cell tolerance in a mouse model of lung cancer. Cancer Res 68, 9459–9468 (2008). [DOI] [PMC free article] [PubMed] [Google Scholar]
- 57.Alonso R, Flament H, Lemoine S, Sedlik C, Bottasso E, Peguillet I, Premel V, Denizeau J, Salou M, Darbois A, Nunez NG, Salomon B, Gross D, Piaggio E, Lantz O, Induction of anergic or regulatory tumor-specific CD4(+) T cells in the tumor-draining lymph node. Nat Commun 9, 2113 (2018). [DOI] [PMC free article] [PubMed] [Google Scholar]
- 58.Wang J, Perry CJ, Meeth K, Thakral D, Damsky W, Micevic G, Kaech S, Blenman K, Bosenberg M, UV-induced somatic mutations elicit a functional T cell response in the YUMMER1.7 mouse melanoma model. Pigment Cell Melanoma Res 30, 428–435 (2017). [DOI] [PMC free article] [PubMed] [Google Scholar]
- 59.Damo M, Fitzgerald B, Lu Y, Nader M, William I, Cheung JF, Connolly KA, Foster GG, Akama-Garren E, Lee DY, Chang GP, Gocheva V, Schmidt LM, Boileve A, Wilson JH, Cui C, Monroy I, Gokare P, Cabeceiras P, Jacks T, Joshi NS, Inducible de novo expression of neoantigens in tumor cells and mice. Nat Biotechnol, (2020). [DOI] [PMC free article] [PubMed] [Google Scholar]
- 60.Joshi NS, Akama-Garren EH, Lu Y, Lee DY, Chang GP, Li A, DuPage M, Tammela T, Kerper NR, Farago AF, Robbins R, Crowley DM, Bronson RT, Jacks T, Regulatory T Cells in Tumor-Associated Tertiary Lymphoid Structures Suppress Anti-tumor T Cell Responses. Immunity 43, 579–590 (2015). [DOI] [PMC free article] [PubMed] [Google Scholar]
- 61.Fitzgerald B, Connolly KA, Foster GG, Cui C, Cheung JF, Fagerberg E, Mariuzza DL, Joshi NS, Novel mouse model for the study of anti-tumor T cell responses in Kras driven lung adenocarcinoma. In preparation. [DOI] [PMC free article] [PubMed] [Google Scholar]
- 62.Fitzgerald B, Connolly KA, Cui C, Mariuzza DL, Fagerberg E, Hornick NI, Foster GG, William I, Cheung JF, Joshi NS, A novel mouse model for the study of anti-tumor T cell responses in Kras driven lung adenocarcinoma. Available at SSRN: 10.2139/ssrn.3835424, (2021). [DOI] [PMC free article] [PubMed] [Google Scholar]
- 63.Yamauchi T, Hoki T, Oba T, Jain V, Chen H, Attwood K, Battaglia S, George S, Chatta G, Puzanov I, Morrison C, Odunsi K, Segal BH, Dy GK, Ernstoff MS, Ito F, A circulating T-cell differentiation marker to predict response to immune checkpoint inhibitors. BioRxiv, (2020). [Google Scholar]
- 64.Yao C, Sun HW, Lacey NE, Ji Y, Moseman EA, Shih HY, Heuston EF, Kirby M, Anderson S, Cheng J, Khan O, Handon R, Reilley J, Fioravanti J, Hu J, Gossa S, Wherry EJ, Gattinoni L, McGavern DB, O’Shea JJ, Schwartzberg PL, Wu T, Single-cell RNA-seq reveals TOX as a key regulator of CD8(+) T cell persistence in chronic infection. Nat Immunol 20, 890–901 (2019). [DOI] [PMC free article] [PubMed] [Google Scholar]
- 65.Gerlach C, Moseman EA, Loughhead SM, Alvarez D, Zwijnenburg AJ, Waanders L, Garg R, de la Torre JC, von Andrian UH, The Chemokine Receptor CX3CR1 Defines Three Antigen-Experienced CD8 T Cell Subsets with Distinct Roles in Immune Surveillance and Homeostasis. Immunity 45, 1270–1284 (2016). [DOI] [PMC free article] [PubMed] [Google Scholar]
- 66.Yu B, Zhang K, Milner JJ, Toma C, Chen R, Scott-Browne JP, Pereira RM, Crotty S, Chang JT, Pipkin ME, Wang W, Goldrath AW, Epigenetic landscapes reveal transcription factors that regulate CD8(+) T cell differentiation. Nat Immunol 18, 573–582 (2017). [DOI] [PMC free article] [PubMed] [Google Scholar]
- 67.Singer M, Wang C, Cong L, Marjanovic ND, Kowalczyk MS, Zhang H, Nyman J, Sakuishi K, Kurtulus S, Gennert D, Xia J, Kwon JYH, Nevin J, Herbst RH, Yanai I, Rozenblatt-Rosen O, Kuchroo VK, Regev A, Anderson AC, A Distinct Gene Module for Dysfunction Uncoupled from Activation in Tumor-Infiltrating T Cells. Cell 166, 1500–1511 e1509 (2016). [DOI] [PMC free article] [PubMed] [Google Scholar]
- 68.Philip M, Fairchild L, Sun L, Horste EL, Camara S, Shakiba M, Scott AC, Viale A, Lauer P, Merghoub T, Hellmann MD, Wolchok JD, Leslie CS, Schietinger A, Chromatin states define tumour-specific T cell dysfunction and reprogramming. Nature 545, 452–456 (2017). [DOI] [PMC free article] [PubMed] [Google Scholar]
- 69.Li C, Zhu B, Son YM, Wang Z, Jiang L, Xiang M, Ye Z, Beckermann KE, Wu Y, Jenkins JW, Siska PJ, Vincent BG, Prakash YS, Peikert T, Edelson BT, Taneja R, Kaplan MH, Rathmell JC, Dong H, Hitosugi T, Sun J, The Transcription Factor Bhlhe40 Programs Mitochondrial Regulation of Resident CD8(+) T Cell Fitness and Functionality. Immunity 51, 491–507 e497 (2019). [DOI] [PMC free article] [PubMed] [Google Scholar]
- 70.Skon CN, Lee JY, Anderson KG, Masopust D, Hogquist KA, Jameson SC, Transcriptional downregulation of S1pr1 is required for the establishment of resident memory CD8+ T cells. Nat Immunol 14, 1285–1293 (2013). [DOI] [PMC free article] [PubMed] [Google Scholar]
- 71.Barber DL, Wherry EJ, Masopust D, Zhu B, Allison JP, Sharpe AH, Freeman GJ, Ahmed R, Restoring function in exhausted CD8 T cells during chronic viral infection. Nature 439, 682–687 (2006). [DOI] [PubMed] [Google Scholar]
- 72.Moon KR, van Dijk D, Wang Z, Gigante S, Burkhardt DB, Chen WS, Yim K, Elzen AVD, Hirn MJ, Coifman RR, Ivanova NB, Wolf G, Krishnaswamy S, Visualizing structure and transitions in high-dimensional biological data. Nat Biotechnol 37, 1482–1492 (2019). [DOI] [PMC free article] [PubMed] [Google Scholar]
- 73.Swanson BJ, Murakami M, Mitchell TC, Kappler J, Marrack P, RANTES Production by Memory Phenotype T Cells Is Controlled by a Posttranscriptional, TCR-dependent Process. Immunity 17, 605–615 (2002). [DOI] [PubMed] [Google Scholar]
- 74.Hanninen A, Maksimow M, Alam C, Morgan DJ, Jalkanen S, Ly6C supports preferential homing of central memory CD8+ T cells into lymph nodes. Eur J Immunol 41, 634–644 (2011). [DOI] [PubMed] [Google Scholar]
- 75.Bergen V, Lange M, Peidli S, Wolf FA, Theis FJ, Generalizing RNA velocity to transient cell states through dynamical modeling. BioRxiv, (2019). [DOI] [PubMed] [Google Scholar]
- 76.Bucks CM, Norton JA, Boesteanu AC, Mueller YM, Katsikis PD, Chronic antigen stimulation alone is sufficient to drive CD8+ T cell exhaustion. J Immunol 182, 6697–6708 (2009). [DOI] [PMC free article] [PubMed] [Google Scholar]
- 77.Streeck H, Brumme ZL, Anastario M, Cohen KW, Jolin JS, Meier A, Brumme CJ, Rosenberg ES, Alter G, Allen TM, Walker BD, Altfeld M, Antigen Load and Viral Sequence Diversification Determine the Functional Profile of HIV-1-Specific CD8+ T Cells. PLOS Medicine 5, 0790–0804 (2008). [DOI] [PMC free article] [PubMed] [Google Scholar]
- 78.Shin H, Blackburn SD, Blattman JN, Wherry EJ, Viral antigen and extensive division maintain virus-specific CD8 T cells during chronic infection. J Exp Med 204, 941–949 (2007). [DOI] [PMC free article] [PubMed] [Google Scholar]
- 79.Man K, Gabriel SS, Liao Y, Gloury R, Preston S, Henstridge DC, Pellegrini M, Zehn D, Berberich-Siebelt F, Febbraio MA, Shi W, Kallies A, Transcription Factor IRF4 Promotes CD8(+) T Cell Exhaustion and Limits the Development of Memory-like T Cells during Chronic Infection. Immunity 47, 1129–1141 e1125 (2017). [DOI] [PubMed] [Google Scholar]
- 80.Moran AE, Holzapfel KL, Xing Y, Cunningham NR, Maltzman JS, Punt J, Hogquist KA, T cell receptor signal strength in Treg and iNKT cell development demonstrated by a novel fluorescent reporter mouse. J Exp Med 208, 1279–1289 (2011). [DOI] [PMC free article] [PubMed] [Google Scholar]
- 81.Kim N, Kim HK, Lee K, Hong Y, Cho JH, Choi JW, Lee JI, Suh YL, Ku BM, Eum HH, Choi S, Choi YL, Joung JG, Park WY, Jung HA, Sun JM, Lee SH, Ahn JS, Park K, Ahn MJ, Lee HO, Single-cell RNA sequencing demonstrates the molecular and cellular reprogramming of metastatic lung adenocarcinoma. Nat Commun 11, 2285 (2020). [DOI] [PMC free article] [PubMed] [Google Scholar]
- 82.Duhen T, Duhen R, Montler R, Moses J, Moudgil T, de Miranda NF, Goodall CP, Blair TC, Fox BA, McDermott JE, Chang SC, Grunkemeier G, Leidner R, Bell RB, Weinberg AD, Co-expression of CD39 and CD103 identifies tumor-reactive CD8 T cells in human solid tumors. Nat Commun 9, 2724 (2018). [DOI] [PMC free article] [PubMed] [Google Scholar]
- 83.Turcotte S, Gros A, Hogan K, Tran E, Hinrichs CS, Wunderlich JR, Dudley ME, Rosenberg SA, Phenotype and function of T cells infiltrating visceral metastases from gastrointestinal cancers and melanoma: implications for adoptive cell transfer therapy. J Immunol 191, 2217–2225 (2013). [DOI] [PMC free article] [PubMed] [Google Scholar]
- 84.Uryvaev A, Passhak M, Hershkovits D, Sabo E, Bar-Sela G, The role of tumor-infiltrating lymphocytes (TILs) as a predictive biomarker of response to anti-PD1 therapy in patients with metastatic non-small cell lung cancer or metastatic melanoma. Med Oncol 35, 25 (2018). [DOI] [PubMed] [Google Scholar]
- 85.O’Brien SM, Klampatsa A, Thompson JC, Martinez MC, Hwang WT, Rao AS, Standalick JE, Kim S, Cantu E, Litzky LA, Singhal S, Eruslanov EB, Moon EK, Albelda SM, Function of Human Tumor-Infiltrating Lymphocytes in Early-Stage Non-Small Cell Lung Cancer. Cancer Immunol Res 7, 896–909 (2019). [DOI] [PMC free article] [PubMed] [Google Scholar]
- 86.Lee JH, Kim Y, Sim CK, Heo S, Song IH, Park HS, Park SY, Bang WS, Park IA, Lee M, Lee JH, Cho YS, Chang S, Jung J, Kim J, Lee SB, Kim SY, Lee MS, Gong G, Expansion of tumor-infiltrating lymphocytes and their potential for application as adoptive cell transfer therapy in human breast cancer. Oncotarget 8, 113345–113359 (2017). [DOI] [PMC free article] [PubMed] [Google Scholar]
- 87.Gettinger SN, Choi J, Mani N, Sanmamed MF, Datar I, Sowell R, Du VY, Kaftan E, Goldberg S, Dong W, Zelterman D, Politi K, Kavathas P, Kaech S, Yu X, Zhao H, Schlessinger J, Lifton R, Rimm DL, Chen L, Herbst RS, Schalper KA, A dormant TIL phenotype defines non-small cell lung carcinomas sensitive to immune checkpoint blockers. Nat Commun 9, 3196 (2018). [DOI] [PMC free article] [PubMed] [Google Scholar]
- 88.Inoue H, Park JH, Kiyotani K, Zewde M, Miyashita A, Jinnin M, Kiniwa Y, Okuyama R, Tanaka R, Fujisawa Y, Kato H, Morita A, Asai J, Katoh N, Yokota K, Akiyama M, Ihn H, Fukushima S, Nakamura Y, Intratumoral expression levels of PD-L1, GZMA, and HLA-A along with oligoclonal T cell expansion associate with response to nivolumab in metastatic melanoma. Oncoimmunology 5, e1204507 (2016). [DOI] [PMC free article] [PubMed] [Google Scholar]
- 89.Sade-Feldman M, Yizhak K, Bjorgaard SL, Ray JP, de Boer CG, Jenkins RW, Lieb DJ, Chen JH, Frederick DT, Barzily-Rokni M, Freeman SS, Reuben A, Hoover PJ, Villani AC, Ivanova E, Portell A, Lizotte PH, Aref AR, Eliane JP, Hammond MR, Vitzthum H, Blackmon SM, Li B, Gopalakrishnan V, Reddy SM, Cooper ZA, Paweletz CP, Barbie DA, Stemmer-Rachamimov A, Flaherty KT, Wargo JA, Boland GM, Sullivan RJ, Getz G, Hacohen N, Defining T Cell States Associated with Response to Checkpoint Immunotherapy in Melanoma. Cell 175, 998–1013 e1020 (2018). [DOI] [PMC free article] [PubMed] [Google Scholar]
- 90.Tumeh PC, Harview CL, Yearley JH, Shintaku IP, Taylor EJ, Robert L, Chmielowski B, Spasic M, Henry G, Ciobanu V, West AN, Carmona M, Kivork C, Seja E, Cherry G, Gutierrez AJ, Grogan TR, Mateus C, Tomasic G, Glaspy JA, Emerson RO, Robins H, Pierce RH, Elashoff DA, Robert C, Ribas A, PD-1 blockade induces responses by inhibiting adaptive immune resistance. Nature 515, 568–571 (2014). [DOI] [PMC free article] [PubMed] [Google Scholar]
- 91.Jansen CS, Prokhnevska N, Master VA, Sanda MG, Carlisle JW, Bilen MA, Cardenas M, Wilkinson S, Lake R, Sowalsky AG, Valanparambil RM, Hudson WH, McGuire D, Melnick K, Khan AI, Kim K, Chang YM, Kim A, Filson CP, Alemozaffar M, Osunkoya AO, Mullane P, Ellis C, Akondy R, Im SJ, Kamphorst AO, Reyes A, Liu Y, Kissick H, An intra-tumoral niche maintains and differentiates stem-like CD8 T cells. Nature 576, 465–470 (2019). [DOI] [PMC free article] [PubMed] [Google Scholar]
- 92.Engelhard VH, Rodriguez AB, Mauldin IS, Woods AN, Peske JD, Slingluff CL, Immune Cell Infiltration and Tertiary Lymphoid Structures as Determinants of Antitumor Immunity. The Journal of Immunology 200, 432–442 (2018). [DOI] [PMC free article] [PubMed] [Google Scholar]
- 93.Broz ML, Binnewies M, Boldajipour B, Nelson AE, Pollack JL, Erle DJ, Barczak A, Rosenblum MD, Daud A, Barber DL, Amigorena S, Van’t Veer LJ, Sperling AI, Wolf DM, Krummel MF, Dissecting the tumor myeloid compartment reveals rare activating antigen-presenting cells critical for T cell immunity. Cancer Cell 26, 638–652 (2014). [DOI] [PMC free article] [PubMed] [Google Scholar]
- 94.Spranger S, Dai D, Horton B, Gajewski TF, Tumor-Residing Batf3 Dendritic Cells Are Required for Effector T Cell Trafficking and Adoptive T Cell Therapy. Cancer Cell 31, 711–723 e714 (2017). [DOI] [PMC free article] [PubMed] [Google Scholar]
- 95.Spranger S, Bao R, Gajewski TF, Melanoma-intrinsic beta-catenin signalling prevents anti-tumour immunity. Nature 523, 231–235 (2015). [DOI] [PubMed] [Google Scholar]
- 96.Danilo M, Chennupati V, Silva JG, Siegert S, Held W, Suppression of Tcf1 by Inflammatory Cytokines Facilitates Effector CD8 T Cell Differentiation. Cell Reports 22, 2107–2117 (2018). [DOI] [PubMed] [Google Scholar]
- 97.Mueller SN, Matloubian M, Clemens DM, Sharpe AH, Freeman GJ, Gangappa S, Larsen CP, Ahmed R, Viral targeting of fibroblastic reticular cells contributes to immunosuppression and persistence during chronic infection. Proc Natl Acad Sci U S A 104, 15430–15435 (2007). [DOI] [PMC free article] [PubMed] [Google Scholar]
- 98.Salmon H, Idoyaga J, Rahman A, Leboeuf M, Remark R, Jordan S, Casanova-Acebes M, Khudoynazarova M, Agudo J, Tung N, Chakarov S, Rivera C, Hogstad B, Bosenberg M, Hashimoto D, Gnjatic S, Bhardwaj N, Palucka AK, Brown BD, Brody J, Ginhoux F, Merad M, Expansion and Activation of CD103(+) Dendritic Cell Progenitors at the Tumor Site Enhances Tumor Responses to Therapeutic PD-L1 and BRAF Inhibition. Immunity 44, 924–938 (2016). [DOI] [PMC free article] [PubMed] [Google Scholar]
- 99.Roberts EW, Broz ML, Binnewies M, Headley MB, Nelson AE, Wolf DM, Kaisho T, Bogunovic D, Bhardwaj N, Krummel MF, Critical Role for CD103(+)/CD141(+) Dendritic Cells Bearing CCR7 for Tumor Antigen Trafficking and Priming of T Cell Immunity in Melanoma. Cancer Cell 30, 324–336 (2016). [DOI] [PMC free article] [PubMed] [Google Scholar]
- 100.Oh SA, Wu D-C, Cheung J, Navarro A, Xiong H, Cubas R, Totpal K, Chiu H, Wu Y, Comps-Agrar L, Leader AM, Merad M, Roose-Germa M, Warming S, Yan M, Kim JM, Rutz S, Mellman I, PD-L1 expression by dendritic cells is a key regulator of T-cell immunity in cancer. Nature Cancer, (2020). [DOI] [PubMed] [Google Scholar]
- 101.Dammeijer F, van Gulijk M, Mulder EE, Lukkes M, Klaase L, van den Bosch T, van Nimwegen M, Lau SP, Latupeirissa K, Schetters S, van Kooyk Y, Boon L, Moyaart A, Mueller YM, Katsikis PD, Eggermont AM, Vroman H, Stadhouders R, Hendriks RW, Thusen JV, Grunhagen DJ, Verhoef C, van Hall T, Aerts JG, The PD-1/PD-L1-Checkpoint Restrains T cell Immunity in Tumor-Draining Lymph Nodes. Cancer Cell, (2020). [DOI] [PubMed] [Google Scholar]
- 102.Francis DM, Manspeaker MP, Schudel A, Sestito LF, O’Melia MJ, Kissick HT, Pollack BP, Waller EK, Thomas SN, Blockade of immune checkpoints in lymph nodes through locoregional delivery augments cancer immunotherapy. Sci Transl Med 12, (2020). [DOI] [PMC free article] [PubMed] [Google Scholar]
- 103.Kim KH, Cho J, Ku BM, Koh J, Sun JM, Lee SH, Ahn JS, Cheon J, Min YJ, Park SH, Park K, Ahn MJ, Shin EC, The First-week Proliferative Response of Peripheral Blood PD-1(+)CD8(+) T Cells Predicts the Response to Anti-PD-1 Therapy in Solid Tumors. Clin Cancer Res 25, 2144–2154 (2019). [DOI] [PubMed] [Google Scholar]
- 104.Ottonello S, Genova C, Cossu I, Fontana V, Rijavec E, Rossi G, Biello F, Dal Bello MG, Tagliamento M, Alama A, Coco S, Boccardo S, Vanni I, Ferlazzo G, Moretta L, Grossi F, Mingari MC, Carrega P, Pietra G, Association Between Response to Nivolumab Treatment and Peripheral Blood Lymphocyte Subsets in Patients With Non-small Cell Lung Cancer. Front Immunol 11, 125 (2020). [DOI] [PMC free article] [PubMed] [Google Scholar]
- 105.Forde PM, Chaft JE, Smith KN, Anagnostou V, Cottrell TR, Hellmann MD, Zahurak M, Yang SC, Jones DR, Broderick S, Battafarano RJ, Velez MJ, Rekhtman N, Olah Z, Naidoo J, Marrone KA, Verde F, Guo H, Zhang J, Caushi JX, Chan HY, Sidhom JW, Scharpf RB, White J, Gabrielson E, Wang H, Rosner GL, Rusch V, Wolchok JD, Merghoub T, Taube JM, Velculescu VE, Topalian SL, Brahmer JR, Pardoll DM, Neoadjuvant PD-1 Blockade in Resectable Lung Cancer. N Engl J Med 378, 1976–1986 (2018). [DOI] [PMC free article] [PubMed] [Google Scholar]
- 106.Wu TD, Madireddi S, de Almeida PE, Banchereau R, Chen YJ, Chitre AS, Chiang EY, Iftikhar H, O’Gorman WE, Au-Yeung A, Takahashi C, Goldstein LD, Poon C, Keerthivasan S, de Almeida Nagata DE, Du X, Lee HM, Banta KL, Mariathasan S, Das Thakur M, Huseni MA, Ballinger M, Estay I, Caplazi P, Modrusan Z, Delamarre L, Mellman I, Bourgon R, Grogan JL, Peripheral T cell expansion predicts tumour infiltration and clinical response. Nature 579, 274–278 (2020). [DOI] [PubMed] [Google Scholar]
- 107.Yost KE, Satpathy AT, Wells DK, Qi Y, Wang C, Kageyama R, McNamara KL, Granja JM, Sarin KY, Brown RA, Gupta RK, Curtis C, Bucktrout SL, Davis MM, Chang ALS, Chang HY, Clonal replacement of tumor-specific T cells following PD-1 blockade. Nat Med 25, 1251–1259 (2019). [DOI] [PMC free article] [PubMed] [Google Scholar]
- 108.Joshi NS, Cui W, Chandele A, Lee HK, Urso DR, Hagman J, Gapin L, Kaech SM, Inflammation directs memory precursor and short-lived effector CD8(+) T cell fates via the graded expression of T-bet transcription factor. Immunity 27, 281–295 (2007). [DOI] [PMC free article] [PubMed] [Google Scholar]
- 109.van Dijk D, Sharma R, Nainys J, Yim K, Kathail P, Carr AJ, Burdziak C, Moon KR, Chaffer CL, Pattabiraman D, Bierie B, Mazutis L, Wolf G, Krishnaswamy S, Pe’er D, Recovering Gene Interactions from Single-Cell Data Using Data Diffusion. Cell 174, 716–729 e727 (2018). [DOI] [PMC free article] [PubMed] [Google Scholar]
- 110.La Manno G, Soldatov R, Zeisel A, Braun E, Hochgerner H, Petukhov V, Lidschreiber K, Kastriti ME, Lonnerberg P, Furlan A, Fan J, Borm LE, Liu Z, van Bruggen D, Guo J, He X, Barker R, Sundstrom E, Castelo-Branco G, Cramer P, Adameyko I, Linnarsson S, Kharchenko PV, RNA velocity of single cells. Nature 560, 494–498 (2018). [DOI] [PMC free article] [PubMed] [Google Scholar]
Associated Data
This section collects any data citations, data availability statements, or supplementary materials included in this article.
Supplementary Materials
Fig. S1: Representative FACS plots
Fig. S2: Tumor-specific TCF1+CD8+ T cells are present throughout disease progression in transplant KP-NINJA lung tumors
Fig. S3: Gene expression plots for LCMV, early and late dLNs and tumor comparisons
Fig. S4: Gene expression and transcript dynamics for co-embedded samples
Table 1: TCRA and TCRB motifs from T cells in tumors and dLNs
Table 2: Raw data file (excel spreadsheet)
Data Availability Statement
RNA- and TCR-seq data from this study are deposited in GEO under accession number GSE182509. Ad5mSPC-Cre was obtained from Dr. Anton Berns at the Netherlands Cancer Institute (a.berns2@nki.nl). All data needed to evaluate the conclusions in this paper are present in the paper or he Supplemental Materials.