Abstract
There is a critical need to develop noninvasive, nondestructive methods for assessing the quality of engineered constructs prior to implantation. Currently, the composition and maturity of engineered tissues are assessed using destructive, costly, and time-consuming biochemical and mechanical analyses. The goal of this study was to use noninvasive, multimodal imaging to monitor osteogenic differentiation and matrix deposition by human mesenchymal stem/stromal cells (MSCs) during in vitro culture. MSCs were encapsulated in alginate hydrogels and cultured in osteogenic conditions for 4 weeks. Samples were evaluated using fluorescence lifetime imaging (FLIm) and ultrasound backscatter microscopy (UBM) prior to traditional biochemical and mechanical testing. Using linear regression analysis, we identified strong correlations between imaging parameters (e.g., fluorescence lifetime and acoustic attenuation coefficient) and destructive mechanical and biochemical tests to assess the maturation of osteogenically induced constructs. These data demonstrate the promise of nondestructive label-free imaging techniques to noninvasively ascertain the progression and maturity of tissue engineered bone grafts.
Keywords: fluorescence lifetime imaging, ultrasound backscatter, mesenchymal stem/stromal cell, osteogenic differentiation, osteogenic graft
Graphical Abstract
1. INTRODUCTION
The manufacture of tissue-engineered bone constructs requires the exposure of implants to in vitro culture stimuli beginning at less than 1 day and lasting for several weeks. There is no consensus on the necessary culture duration to benefit tissue regeneration. Current methods to detect biochemical or mechanical properties of engineered constructs are destructive, limiting our ability to assess construct maturation in real-time without costly biopsies that consume valuable tissue for delivery to the patient. Nondestructive technologies to test engineered construct properties are needed to move the field toward clinical translation.
Mesenchymal stem/stromal cells (MSCs) are an attractive cell source for tissue engineered bone because they undergo osteogenic differentiation, produce extracellular matrix proteins, and secrete a host of regenerative factors in response to mechanical, biochemical, and microenvironmental signals.1,2 MSCs deposit a collagen-rich extracellular matrix during osteogenic differentiation.3 Biomolecules such as collagen and matricellular proteins secreted during differentiation possess unique autofluorescence (AF) signatures characterized by fluorescence spectra and fluorescence lifetimes (LT).4 Tissue fluorescence signatures are representative of all excitable fluorophores present, and the resultant measurements can be analyzed to characterize the biochemical composition. AF spectra and LT characteristics under ultraviolet (UV) excitation correlate well with collagen content and collagen cross-links, two distinct biochemical changes associated with changes in mechanical properties and overall maturation of osteogenic extracellular matrix.5–8 AF techniques can be used to nondestructively resolve cells from their surrounding extracellular matrix without the need for cellular labeling, offering a noninvasive approach to monitor cell behavior.9
Quantitative ultrasound (QUS) analysis is a method of characterizing tissue by analyzing raw radio frequency (RF) waveforms10 and has been employed in multiple contexts including monitoring engineered constructs.11 Previous studies report QUS parameters from high frequency ultrasound correlate strongly with mineral density in collagen-hydroxyapatite hydrogels12 and were used for estimating cell size, concentration, and the mass of calcium during differentiation of osteoblastic precursor cells.13 Herein, we investigated the acoustic attenuation coefficient and spectral intercept–two theoretically independent parameters as indicators of acoustic impedance and/or scatter concentration–to nondestructively monitor mineral deposition by MSCs.
Alginate hydrogels are injectable biomaterials with tunable biophysical properties that can present cell-instructive ligands by covalently modifying the polymer backbone with peptide motifs such as RGD14 or GFOGER.15 Others have sought to increase the osteoconductive potential of alginate by incorporation of biomineralized particles in the pregel solution16 or postgelation mineralization.17 The incorporation of biomineralized substrata within alginate hydrogels is a potential strategy for enhancing hydrogel osteogenic potential while retaining its injectable property, and this approach has been used successfully to treat large bone defects in sheep.18 Furthermore, alginate possesses minimal AF and optical properties amenable to ultrasonic evaluation, making it a valuable platform for FLIm and UBM analysis during osteogenic differentiation.
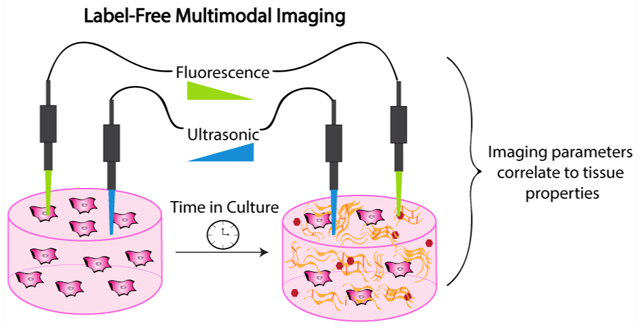
In this work, we used multimodal label-free imaging combining FLIm and UBM to detect the presence of biomolecules and changes in mechanical properties that occur during osteogenic differentiation of engineered constructs. We hypothesized that the secretion of biomolecules by MSCs encapsulated in osteoconductive alginate hydrogels could be detected in a noninvasive manner using label-free imaging. Our objective was to establish correlations between imaging parameters (i.e., fluorescence lifetime, fluorescence intensity ratio, and ultrasonic properties) and specific biochemical or mechanical markers of differentiation. This work demonstrates the potential of a noninvasive FLIm and UBM platform to nondestructively monitor and evaluate the maturation of engineered bone constructs in vitro.
2. MATERIALS AND METHODS
Cell Culture.
Human bone marrow-derived MSCs (Lonza, Walkersville, MD) were expanded under standard conditions until use at passage 4 in minimum essential alpha medium (α-MEM; w/L-glutamine, w/o ribo/deoxyribonucleosides (Invitrogen, Carlsbad, CA)) supplemented with 10% fetal bovine serum (FBS; Atlanta Biologicals, Flowery Branch, GA) and 1% penicillin (10 000 U mL−1) and streptomycin (10 mg mL−1, Mediatech, Manassas, VA) (P/S). At passage 3, one passage prior to construct formation, cells were preconditioned in osteogenic media (growth media containing 50 μg mL−1 ascorbate 2-phosphate, 10 mM β-glycerophosphate, and 10 nM dexamethasone (all from Sigma, St. Louis, MO) for 1 week.
Alginate Hydrogel Fabrication.
RGD-modified alginate was prepared by covalently coupling G4RGDSP (Commonwealth Biotechnologies, Richmond, VA) to UltraPure VLVG sodium alginate (Pronova, Lysaker, Norway) using standard carbodiimide chemistry, yielding hydrogels with a degree of substitution (DS) of 2.14 Degree of substitution is defined as the number of peptide ligands conjugated to a single alginate polymer chain. The resulting RGD-alginate was sterile filtered, lyophilized for 4 days, and then reconstituted to 2.5% (w/v) in sterile phosphate buffered saline (PBS) (Invitrogen, Carlsbad, CA).14
Poly(lactide-co-glycolide) (PLG) microspheres were formed using a standard double emulsion technique.19 Biomineralized polymeric microspheres were prepared as previously described.18,20,21 Briefly, microspheres were hydrolyzed for 10 min in 0.5 M NaOH and rinsed in distilled H2O. Microspheres were immediately placed in modified simulated body fluid (mSBF) and incubated at −37 °C for 7 days. At the conclusion, biomineralized microspheres were sterilized with 70% ethanol, washed with sterile distilled H2O, frozen overnight at −80 °C, and lyophilized for 3 days. Microparticle morphology was visualized using scanning electron microscopy. Microparticles were dehydrated in 100% ethanol, pipetted onto a silicon wafer, and sputter coated with gold (Pelco SC-7 Auto Sputter Coater). Images were acquired using a scanning electron microscope (Quattro ESEM, Thermo Fisher, Newington, NH) at 5 kV.
Preconditioned MSCs were resuspended in 8 parts alginate containing microspheres, 1 part 70 mg mL−1 CaCO3 (Sky Spring Nanomaterials, Houston, TX) in PBS. Cross-linking was initiated by exposure to 1 part 150 mg mL−1 D-glucono δ-lactone (GDL) (Sigma) in PBS and pipetting up and down to thoroughly mix all parts.22 Mixed solution was pipetted into silicone molds adhered to glass plates and allowed to gel for 1 h followed by 1 min per side exposure to 200 mM CaCl2 (Sigma). After formation, constructs contained 1 × 10⁶ cell mL−1 and 5 mg mL−1 mineralized microspheres (Figure 1A). The microparticle concentration was selected since it was the greatest concentration that remained uniformly dispersed throughout gelation. Constructs were maintained in osteogenic media and collected at 1, 14, or 28 days for analysis.
Figure 1.
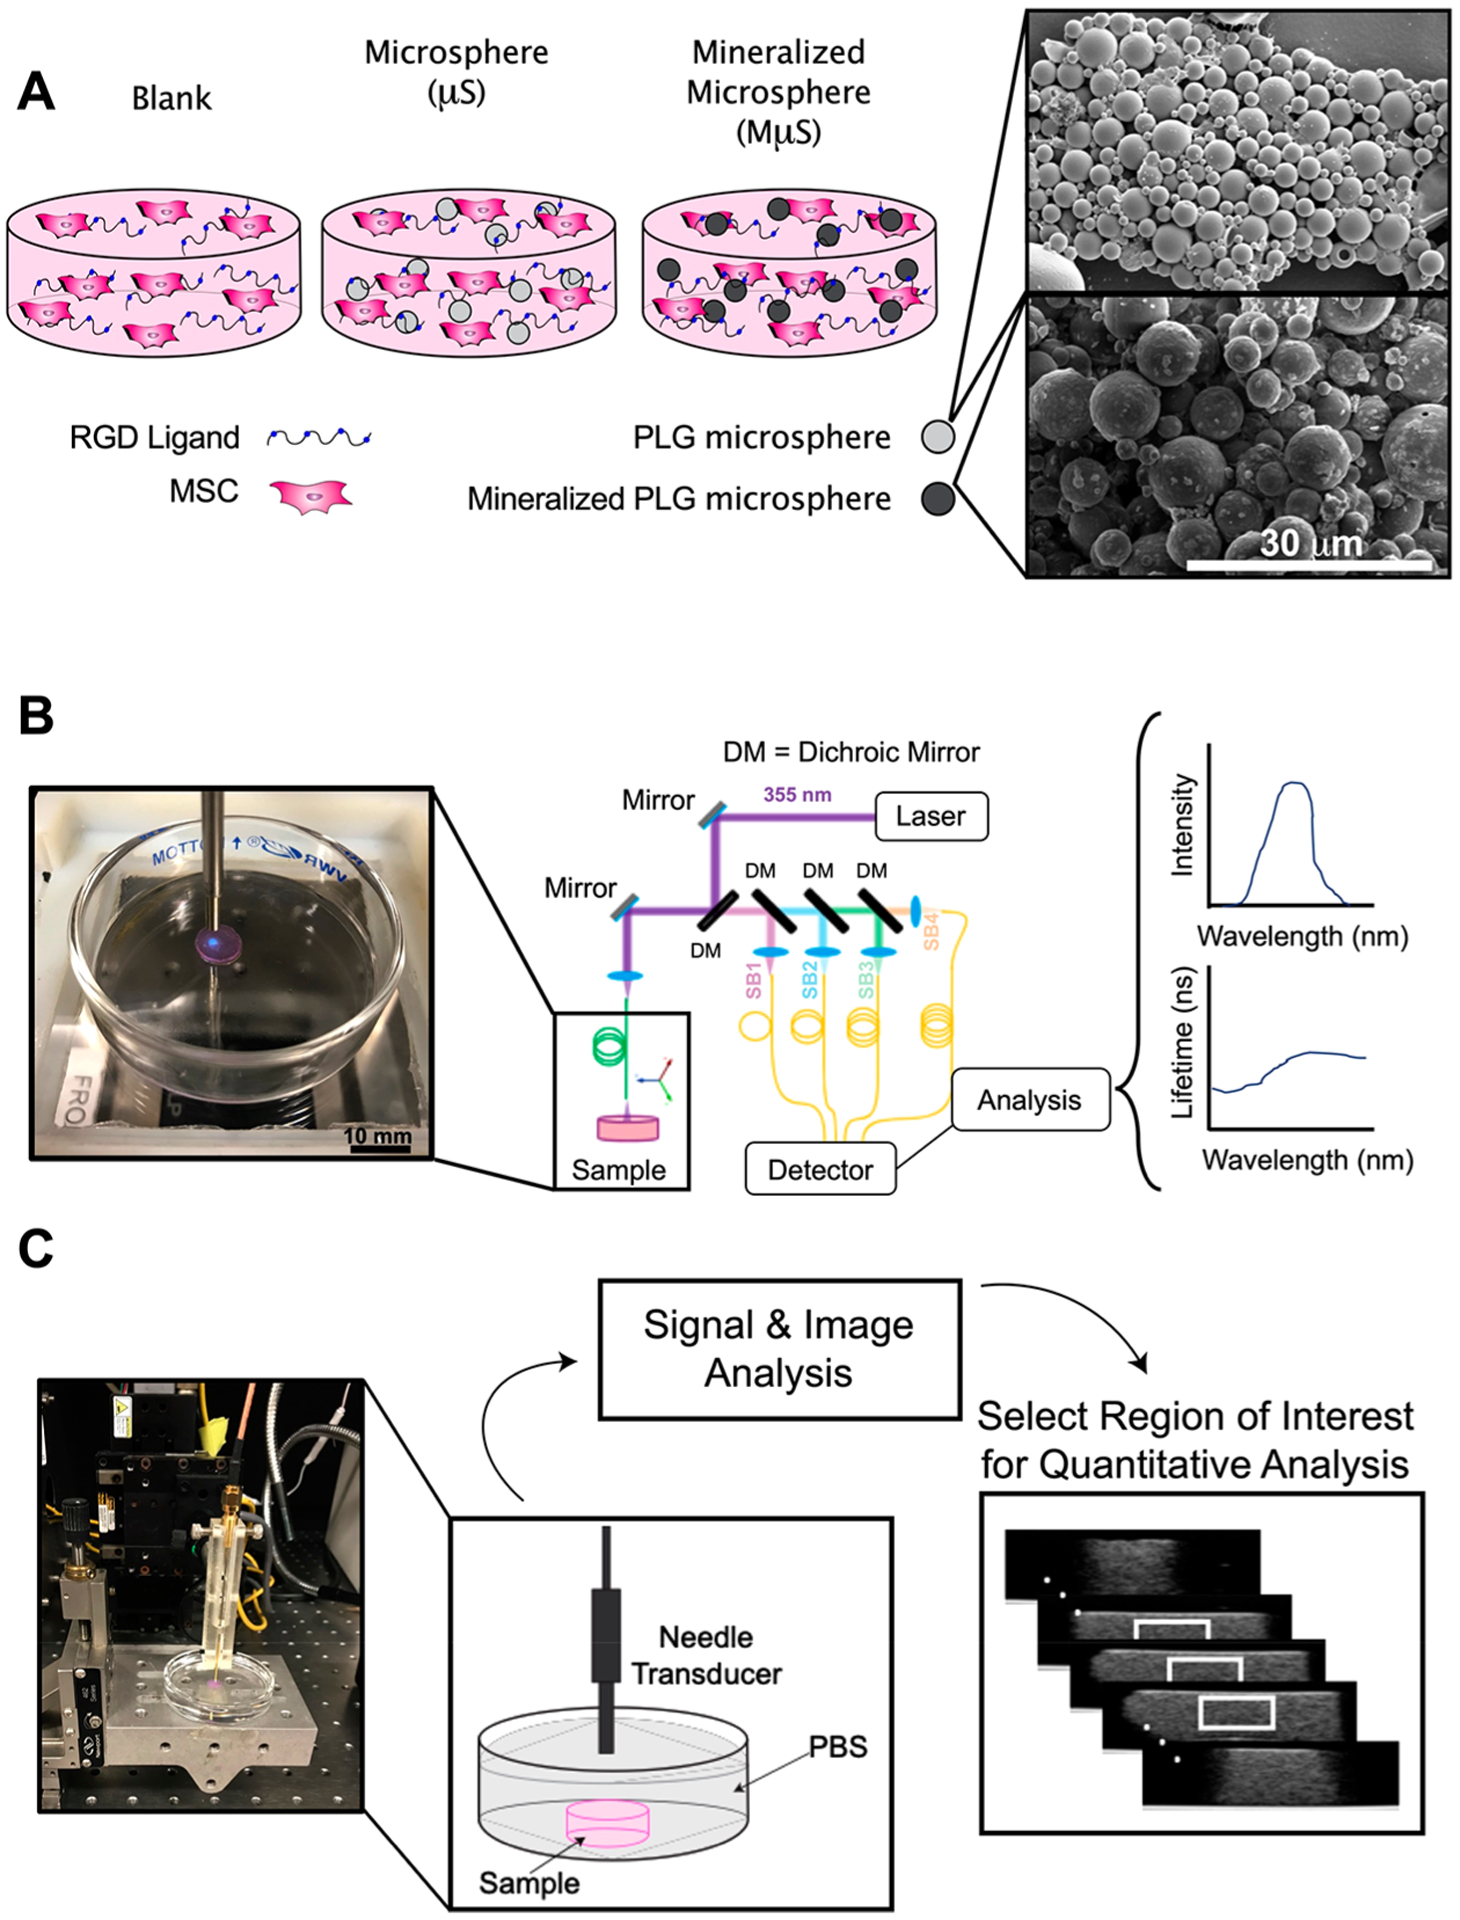
Schematic representation of experimental approach. (A) Schematic of hydrogel composition (left) and scanning electron microscope images of microparticles (right). Scale bar represents 30 μm. (B) Fluorescence lifetime imaging (FLIm) of hydrogel sample showing data acquisition of autofluorescence (blue light) and schematic of data acquisition, processing, and display. (C) Photograph of ultrasound backscatter microscopy (UBM) acquisition and schematic of data processing to illustrate region of interest (white box) for radiofrequency (RF) data analysis.
Fluorescence Lifetime Imaging.
Construction and use of the multispectral fluorescence lifetime imaging system (ms-FLIm) is reported in previous studies.5–9,23 Excitation was performed by a 355 nm pulsed laser (STV-02E, TEEM photonics, France) and guided to the sample through a step-index 400 μm core multimode fiber (Polymicro Technologies, Phoenix, AZ). AF signal from samples was collected by the same fiber optics and sent to a wavelength selection module. The wavelength selection module, composed of dichroic mirrors and band-pass filters, divided AF signal into four spectral channels (channel 1, 390 ± 9 nm; channel 2, 435 ± 20 nm; channel 3, 510 ± 42 nm; and channel 4, 607 ± 35 nm). Unique delays were introduced to each channel by coupling the light to four optical delay lines of different lengths. AF signals of four channels were sequentially detected by a single microchannel plate photomultiplier tube (MCP PMT, R3809U-50, Hamamatsu Photonics, Japan) and sampled at 12.5 Gs s−1 by a high-speed digitizer (PXIe-5185, National Instruments, Austin, TX) (Figure 1B).
For each spectral channel, a fluorescence decay was acquired by deconvolving the instrument response function from raw decay data using the constrained least-squares deconvolution with Laguerre expansion.24 The absolute fluorescence intensity was then retrieved by integrating the deconvolved fluorescence decay over the acquisition window. An intensity ratio between the intensity of each channel and the summation of all four channel intensities was calculated to reflect fluorescence spectra. The fluorescence lifetime was calculated from the deconvolved fluorescence decay as the intensity average lifetime.25 The intensity ratio and fluorescence lifetime maps of all four channels were achieved by raster scanning the sampling fiber on top of the sample. A circular region of interest (ROI) was manually selected based on sample shape, and all the pixels within the ROI were averaged. The average intensity ratio and fluorescence lifetime values were representative of each sample, and 1 value per sample was used for statistical analysis. Channel 4 was excluded from analysis due to lack of signal during the measurement.
Ultrasound Backscatter Microscopy (UBM).
To acquire UBM data, a 0.5 × 0.5 mm 33 MHz ± 70% transducer mounted at the tip of a steel tube (OD: 1 mm) (NIH UTRC, University of Southern California, Los Angeles, CA) was positioned approximately 3 mm above the constructs and raster scanned using the 3-D motorized translation stage (Figure 1C). This unfocused transducer was chosen to minimize the effects of diffraction on quantitative ultrasound estimates. Pulsing/receiving was performed with a monocycle generator (AVB2-TE-C Avtech, Ogdensburg, NY), 30 dB amplifier, and analog band-pass filter (10–100 MHz) before sampled at 400 MHz using a PCI digitizer (CS12400 Gage, Lockport, IL). Each scan location yielded 16 averages and spacing between frames was 200 μm. For B-mode image reconstruction, signals were band-passed filtered from 20 to 60 MHz, envelope detected, and log-compressed.
For quantitative analysis, 310 A-lines from a central volume (2 mm (L) × 2 mm (W) × 1 mm (H)) were extracted from each construct (Figure 1C). The acoustic attenuation coefficient was estimated using the spectral shift algorithm with which the downward shift in central frequency was tracked with depth.10 A-lines were segmented into 15 windows of length 20λ with 95% overlap. Windows were optically filtered with a Hamming window and their spectra averaged laterally across all A-lines. Central frequency was determined using a Gaussian fit over the −20 dB bandwidth of the spectra, and the downward shift was estimated using linear regression.
The spectral intercept of each construct was calculated from the same volume of A-lines used for attenuation analysis. This parameter is directly proportional to scatter concentration and acoustic impedance and is theoretically independent of the attenuation coefficient as opposed to other metrics such as midband fit and spectral slope.26 The −20 dB spectrum was averaged across the whole volume, normalized to planar reflectance data, and linear regression was used to determine the intercept.
Mechanical and Biochemical Analysis of Hydrogels.
After imaging, gels were either collected for histological processing or tested mechanically prior to biochemical analysis. For histological processing, gels were fixed overnight at 4 °C in 4% paraformaldehyde containing barium chloride. Gels were washed twice with deionized H2O, dehydrated, paraffin-embedded, and sectioned at 5 μm. Sections were stained with picrosirius red using standard protocols.27
Storage and loss moduli were measured using a Discovery HR-2 hybrid stress-controlled rheometer (Thermal Analysis Instruments, New Castle, DE) equipped with an 8 mm parallel plate geometry.28 Gels were tested using a frequency sweep from 0.1 to 10.0 rad s−1 at 0.1% strain with 5 points per decade. The shear storage and loss moduli were determined by averaging at least 7 points in the linear viscoelastic region. After mechanical testing, gels were collected in passive lysis buffer (PLB, Promega, Sunnyvale, CA). Following a freeze–thaw cycle, the lysate was sonicated (10 s on ice) and centrifuged to pellet cell and hydrogel debris. DNA content was measured from the supernatant using a Quant-iT PicoGreen dsDNA Assay Kit (Invitrogen). The pellet was digested in 0.9 N H2SO4 and calcium content was quantified using an o-cresolphthalein assay as previously described.29 Collagen content was determined using a hydroxyproline assay.30 Briefly, hydrolysate was first reacted with 150 μL Chloramine T (Sigma-Aldrich) and incubated at room temperature for 20 min. Aldehyde-perchloric acid solution (150 μL) was then added to each sample and incubated at 60 °C for 15 min. Following incubation, tubes were left to cool for 10 min, and sample absorbance was read on a microplate reader. Hydroxyproline was converted to collagen mass assuming that collagen contains 13.7% hydroxyproline.31
Statistical Analysis.
Data are presented as means ± standard deviation of n = 4–7 constructs per group. Statistical analyses were performed with two-way analysis of variance (ANOVA), followed by Tukey’s multiple comparison post hoc test when appropriate to determine significance (p < 0.05). Significance is denoted by alphabetical letterings; groups with no significance are linked by the same letters, while groups with significance do not share a letter. A lack of significance between groups is indicated with “ns” and a line bridging nonsignificant groups. Correlations between bivariate parameters were modeled separately to determine correlations between imaging outcome parameters and biochemical components of matched samples using simple linear least-squares regression analysis. r2 values between 0.0 and 0.2, 0.2–0.4, 0.4–0.6, 0.6–0.8, and 0.8–1.0 are described as very weak, weak, moderate, strong, and very strong, respectively.32 Statistical analysis was performed using JMP v14.0 software (SAS, Carry, NC).
3. RESULTS
Mineralized Microspheres Enhance Construct Properties.
Cells were encapsulated in alginate hydrogels denoted as blank (lacking microspheres), μS (for PLG-microsphere), or MμS (for mineralized microspheres). The inclusion of microspheres within hydrogels produced an opaque gel compared to their blank counterpart (Figure 2A). DNA content decreased approximately 50% over 4 weeks (p = 0.02) in all groups (Figure 2B). Calcium content increased 2.0- and 3.0-fold in blank and MμS constructs, respectively (p < 0.001) (Figure 2C), while a significant increase in collagen content was measured (Figure 2D) and observed (Figure 2E) only in the MμS group (p = 0.003). Gradual increases in the storage and loss moduli were detected over 4 weeks in all groups (Figure 2F, G). We observed the greatest change in biochemical and mechanical properties associated with osteogenic differentiation in the MμS constructs. Therefore, we used this formulation to further evaluate how biochemical and mechanical properties correlate with optical and ultrasonic properties measured by FLIm and UBM, respectively.
Figure 2.
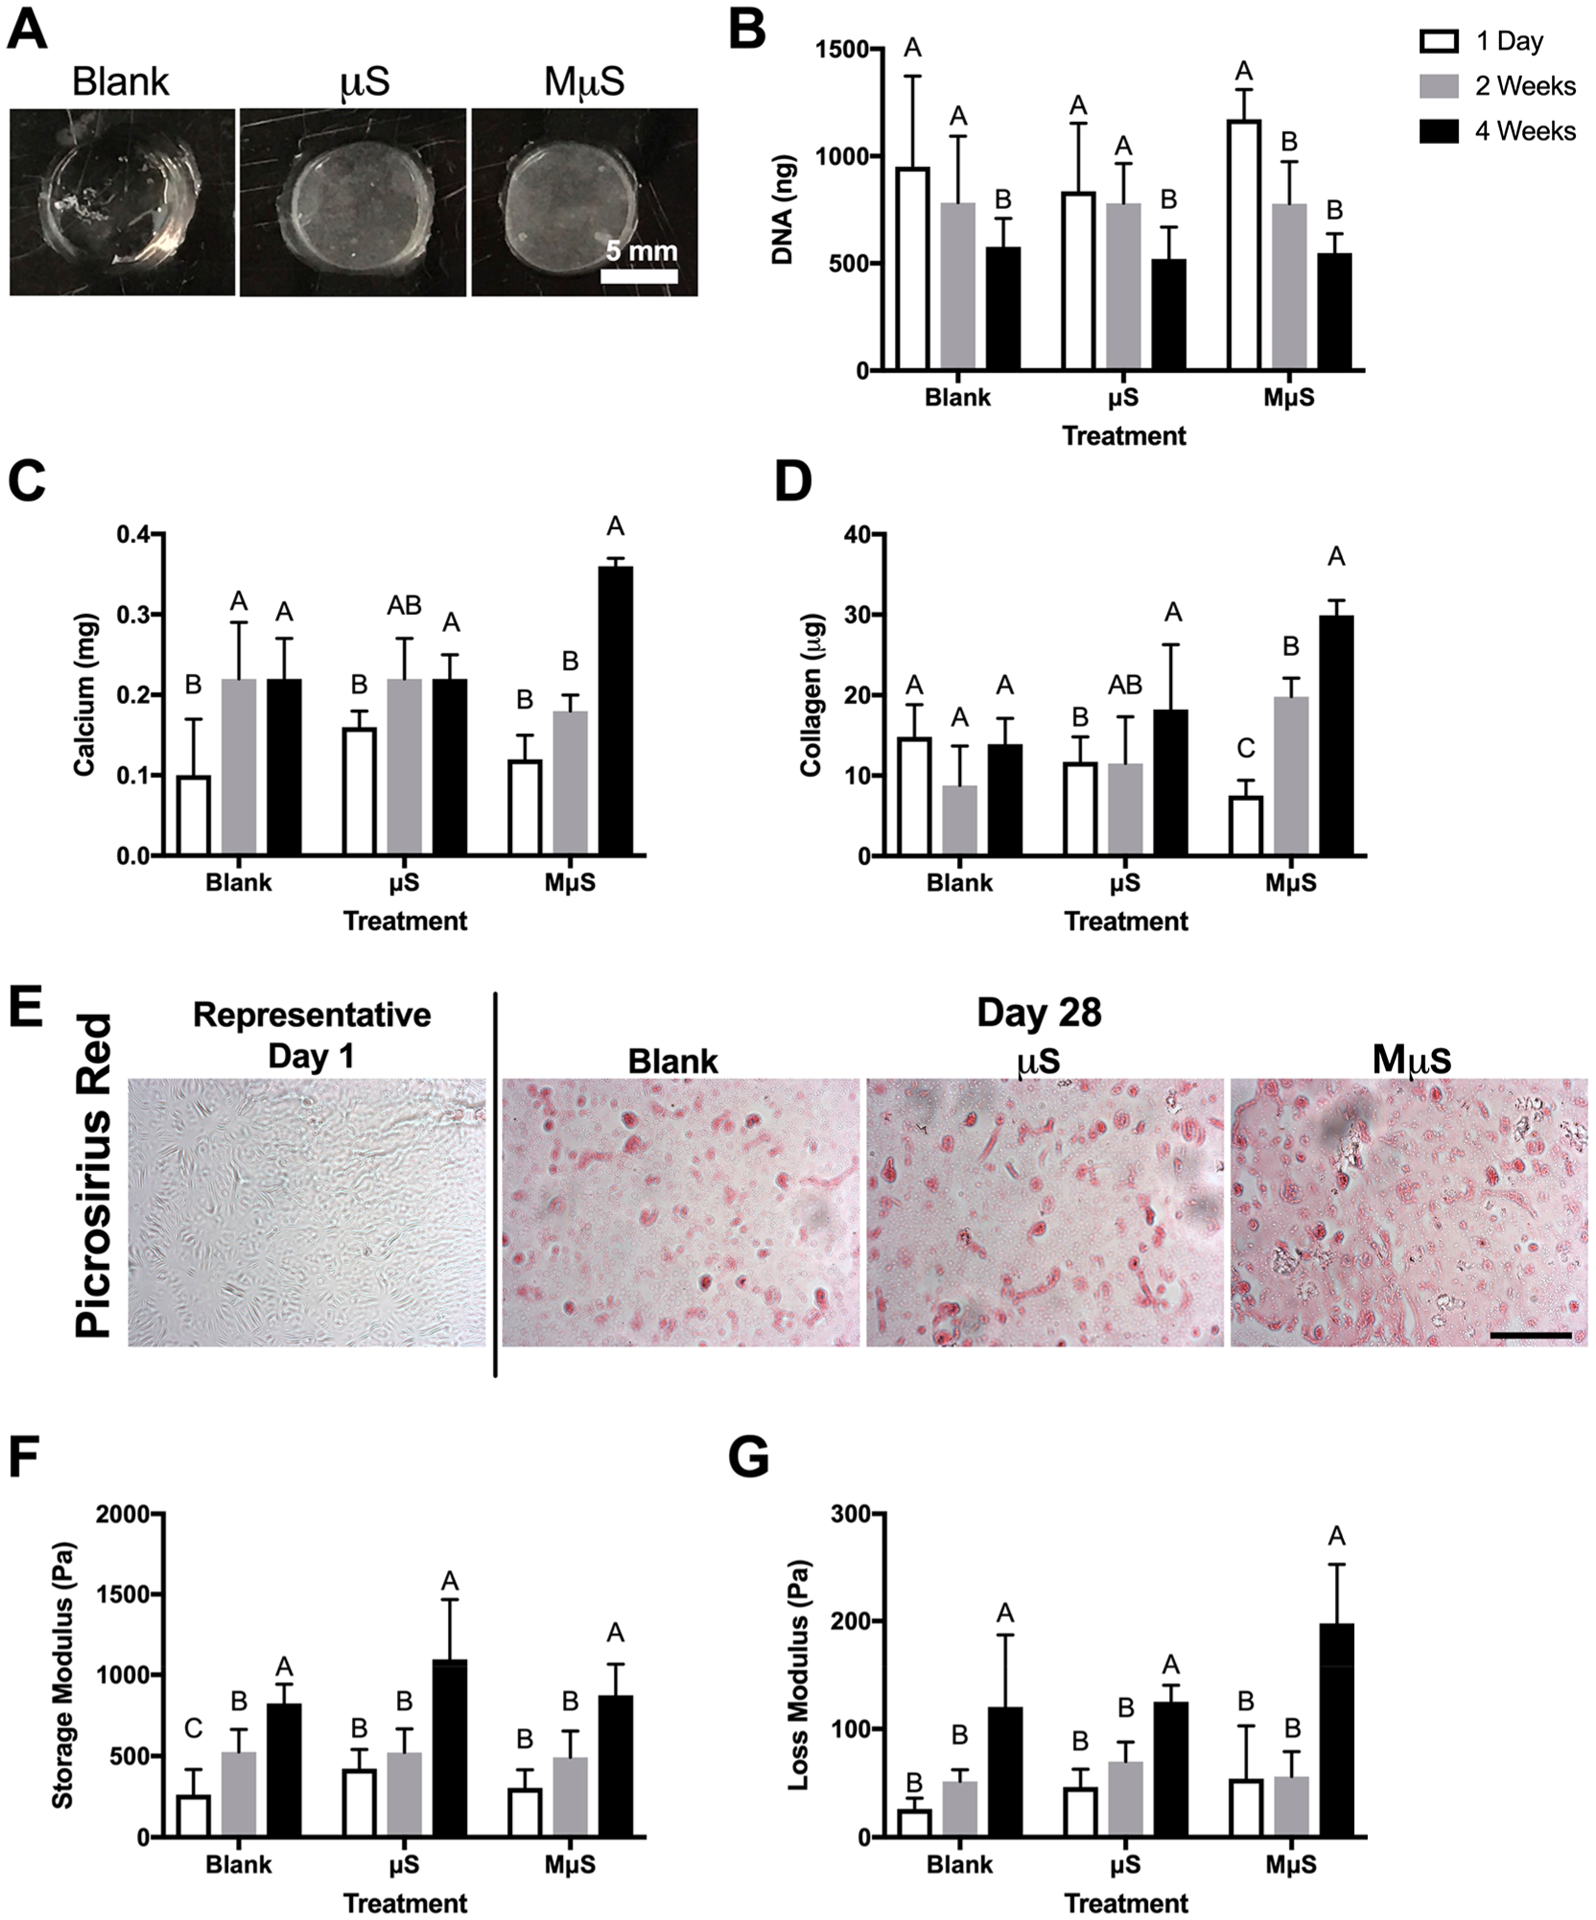
Mineralized microspheres enhance biochemical and mechanical markers of osteogenic differentiation. (A) Gross morphology of hydrogels lacking microspheres (blank) or containing PLG microspheres (μS) or mineralized PLG microspheres (MμS). Scale bar represents 5 mm. (B) DNA, (C) calcium, and (D) collagen content over 4 weeks in culture. (E) Picrosirius red staining. Scale bar represents 100 μm. (F) Storage and (G) loss moduli over 4 weeks in culture (n = 4–6 replicates for all measurements).
Imaging Modalities Detect Changes in Osteogenic Constructs.
Fluorescence lifetime and ultrasound properties were measured at each time point prior to biochemical analysis. Unique lifetime (LT) values (CH1 LT = 4.47 ns, CH2 LT = 3.80, CH3 LT = 3.42) and fluorescence intensity ratios (CH1 FIR = 0.15, CH2 FIR = 0.44, CH3 FIR = 0.37) were measured in each channel at the beginning of the experiment (Figure 3A, 3E). Over 4 weeks in culture, lifetime values for channels 1 and 2 decreased and the average lifetime in channel 3 was unchanged (Figure 3B–D). Decreased measured lifetime in channels 1 and 2 corresponded with increases in the fluorescence intensity ratio in those channels (Figure 3F, G). Consequently, fluorescence intensity ratio in channel 3 decreased over the culture duration (Figure 3H). These changes indicate the generation of molecules with strong AF in channels 1 and 2 with fluorescence lifetime signatures lower than the values prior to in vitro culture.
Figure 3.
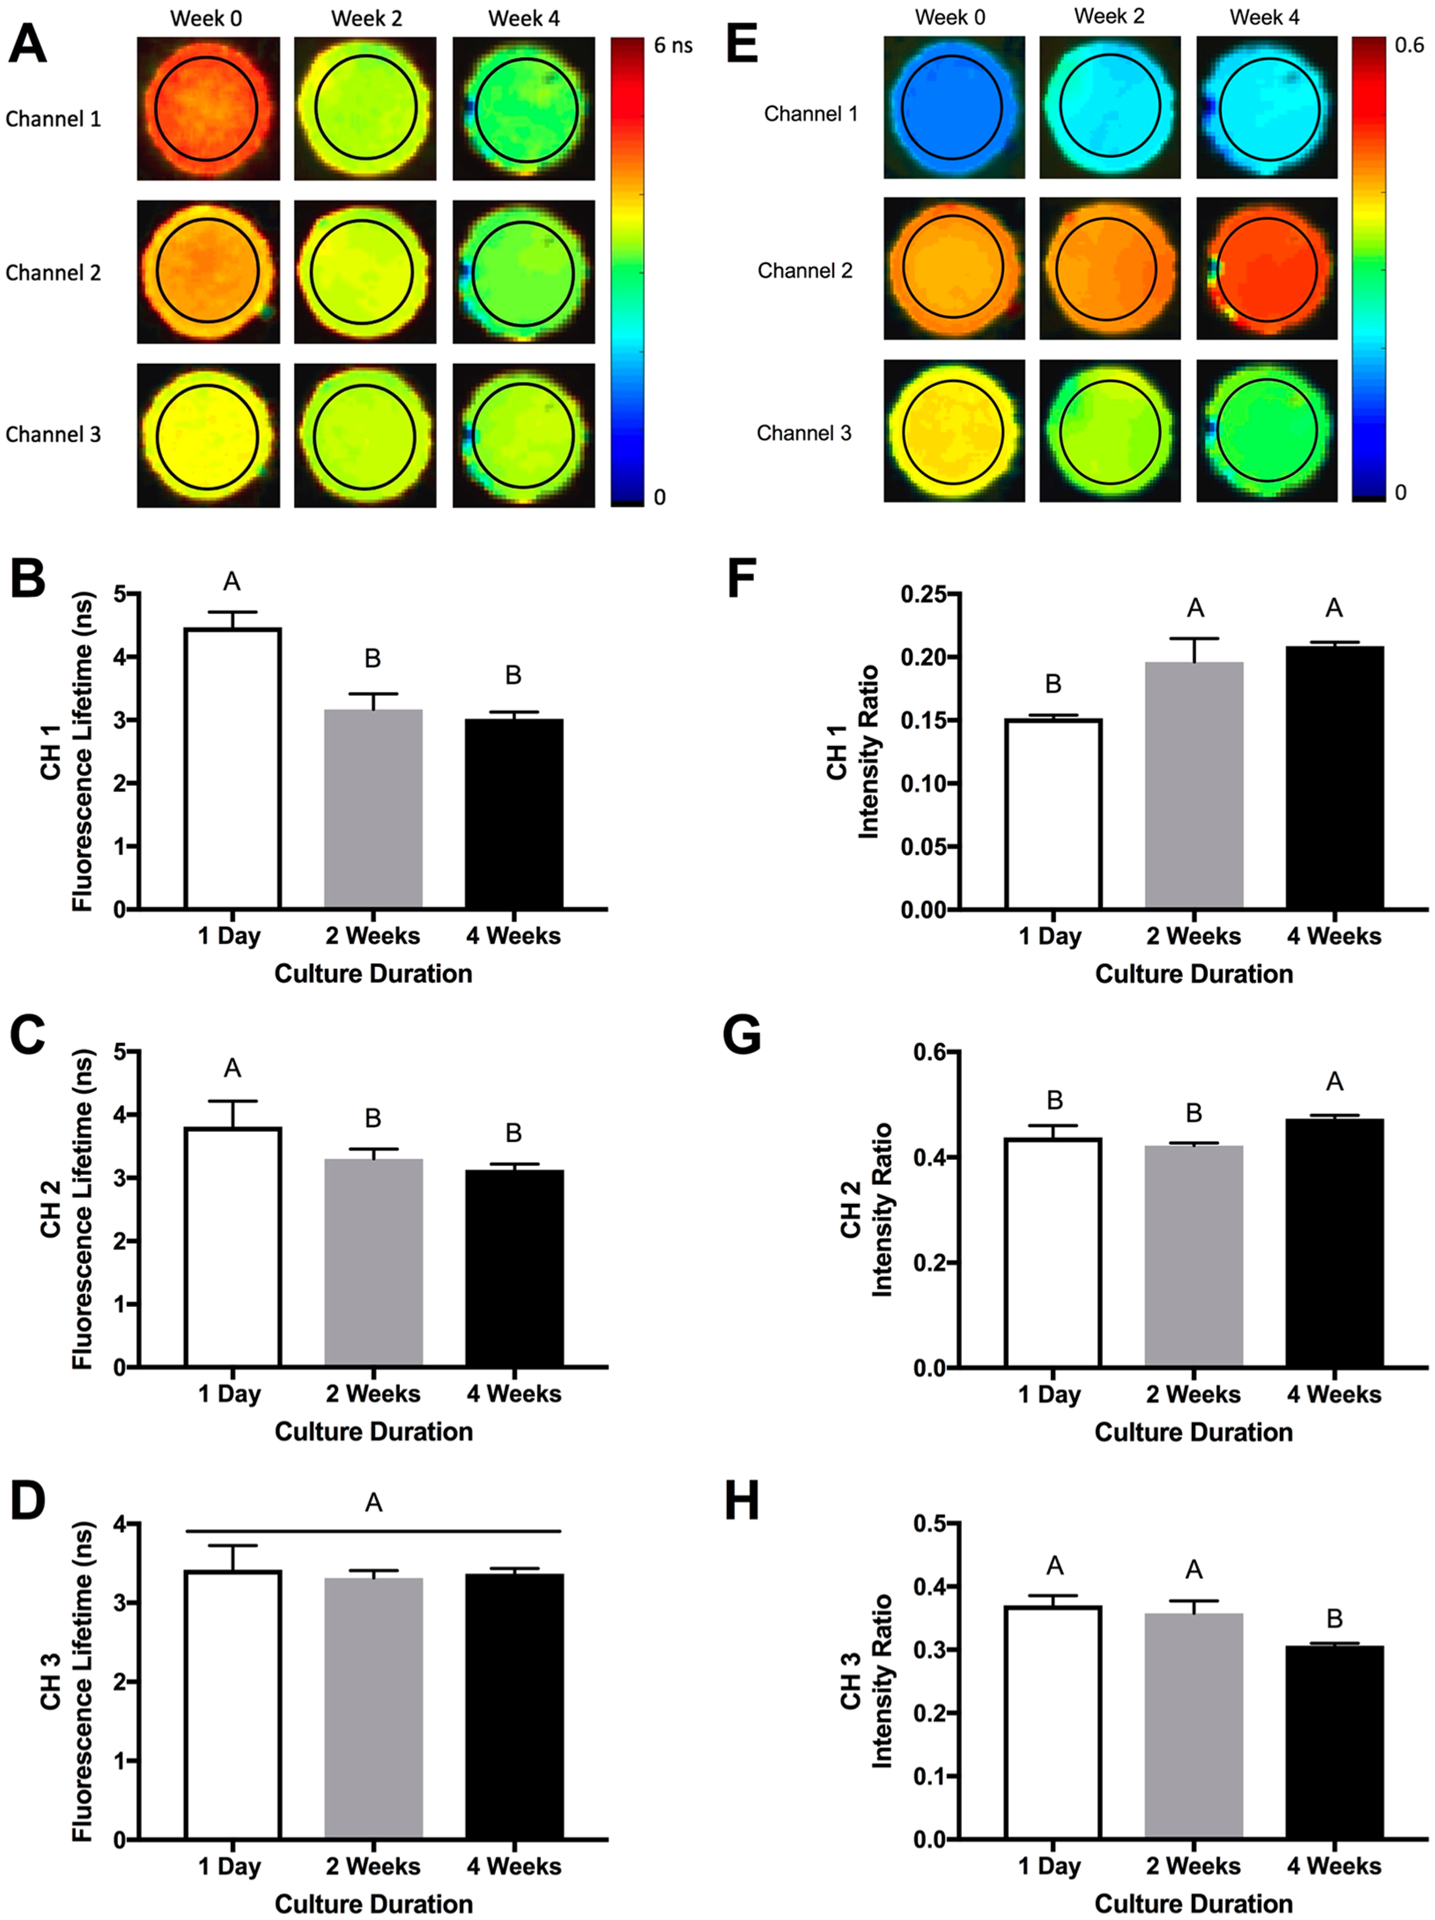
Fluorescence lifetime imaging (FLIm) detects changes in engineered constructs over time. (A) Representative color-scale images of hydrogel fluorescence lifetime over 4 weeks. FLIm measurements from the region of interest (denoted by black circle) were used to quantify average fluorescence lifetime. Fluorescence lifetime measurements in (B) channel 1, (C) channel 2, and (D) channel 3 over 4 weeks. (E) Representative color-scaled images of hydrogel fluorescence intensity ratio over 4 weeks. Fluorescence measurements from the region of interest (denoted by black circle) were used to quantify the fluorescence intensity ratios. Fluorescence intensity ratio in (F) channel 1, (G) channel 2, and (H) channel 3 over 4 weeks (average n = 7 ± standard deviation).
We used UBM to characterize the full construct volume (Figure 4A). Images demonstrate increased opacity over the culture duration, which is corroborated by the increasing attenuation coefficient (Figure 4B). The spectral intercept increased over the culture duration, implying an increase in either the acoustic impedance, the scatter concentration, or both (Figure 4C).
Figure 4.
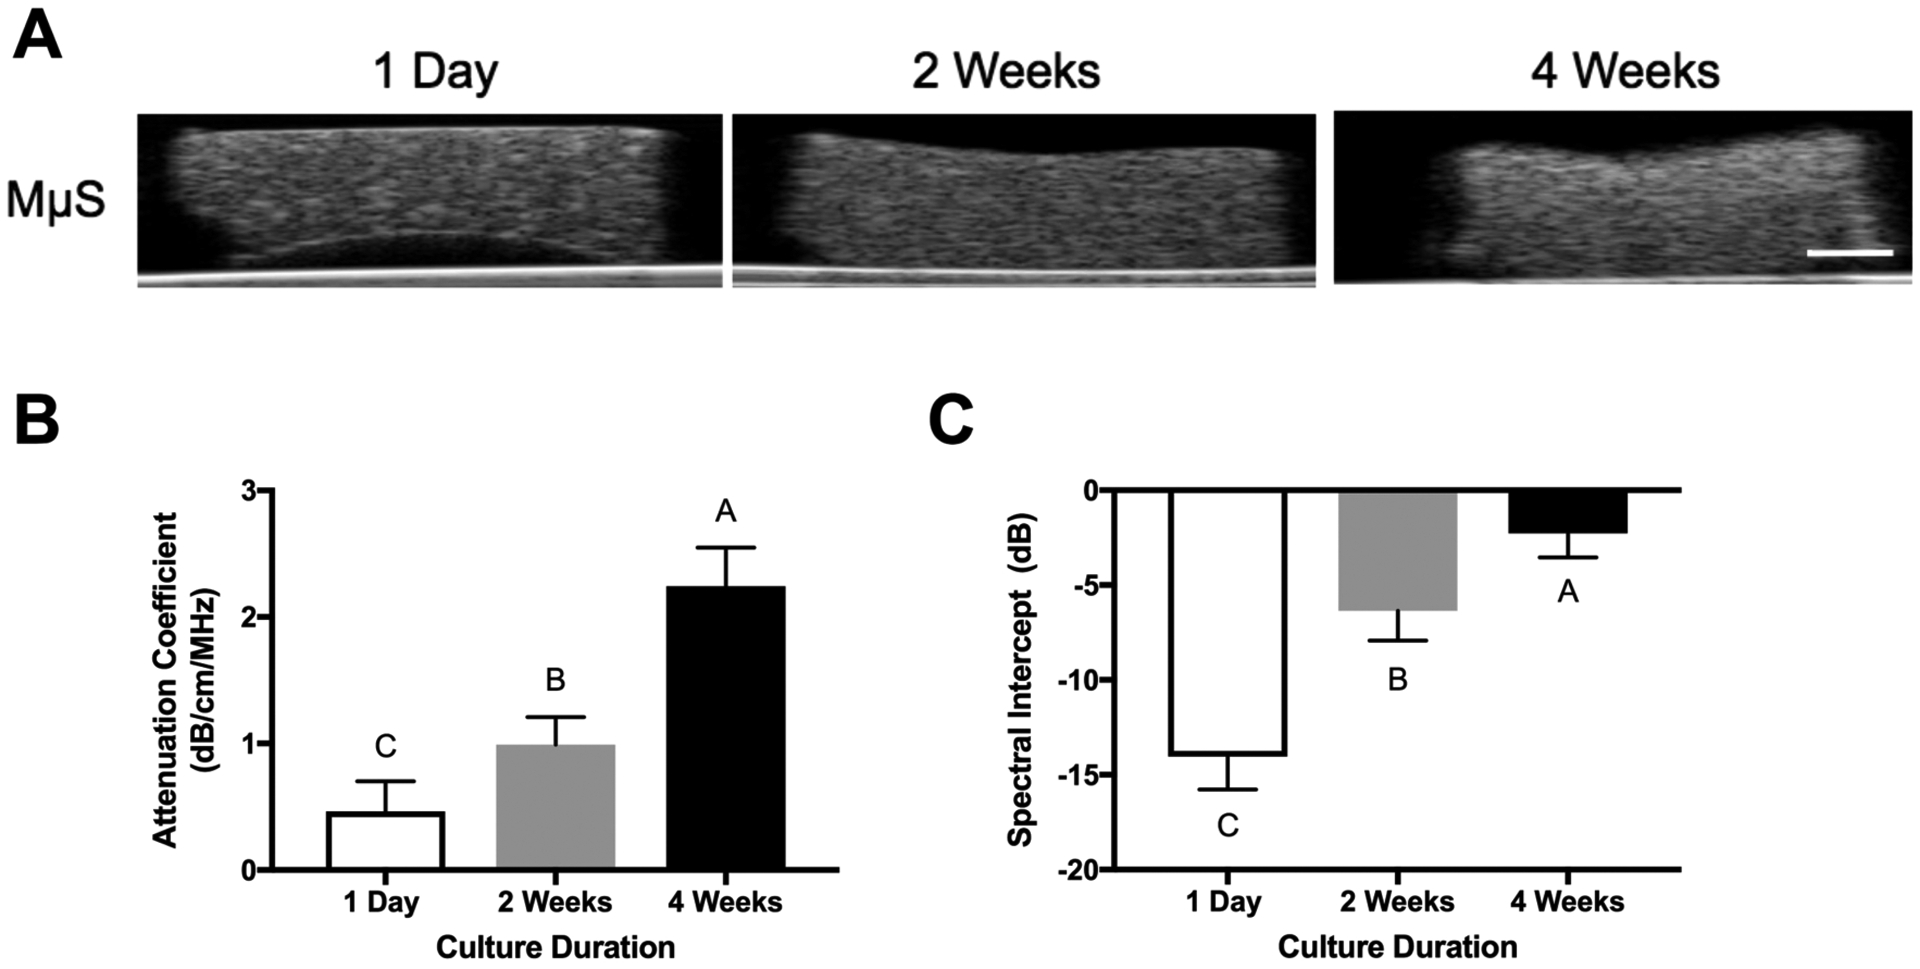
Ultrasound backscatter microscopy detects differences in engineered osteogenic constructs over time. (A) Representative UBM images of constructs (70 dB dynamic range, scale bar represents 1 mm). (B) Attenuation coefficient and (C) spectral intercept of engineered constructs over 4 weeks (n = 5–7 samples per measurement).
Construct Biochemical Properties Correlate with Optical and Ultrasonic Parameters.
The fluorescent signature of carbonated apatite and collagen reside predominantly in channel 1, and the channel 1 lifetime of pure hydroxyapatite was 1.58 ns (data not shown). Decreases in channel 1 lifetime moderately correlated to increases in calcium (p = 0.0007, r2 = 0.57) and collagen (p = 0.0038, r2 = 0.46) content (Figure 5A, B). Moreover, the increase in channel 1 FIR demonstrated a strong positive correlation with increasing calcium (p < 0.0001, r2 = 0.69) and moderate positive correlation with increasing collagen content (p = 0.006, r2 = 0.42) (Figure 5C, D). The AF emission signature for cellular NADH is about 460 nm,33 corresponding to channel 2 in this FLIm system. We observed a strong positive correlation between channel 2 fluorescence lifetime and DNA content (p = 0.0002, r2 = 0.64) (Figure 5E). The strongest correlation was observed between attenuation coefficient, a measure of acoustic impedance, and calcium content (p < 0.0001, r2 = 0.89) (Figure 5F). We also observed a strong correlation between calcium and the spectral intercept, an additional means to measure acoustic impedance or scatter concentration (p = 0.0004, r2 = 0.69) (Figure 5G). We detected a moderate positive correlation between spectral intercept and collagen, a major constituent in extracellular matrix produced during differentiation (p = 0.0107, r2 = 0.46) (Figure 5H).
Figure 5.
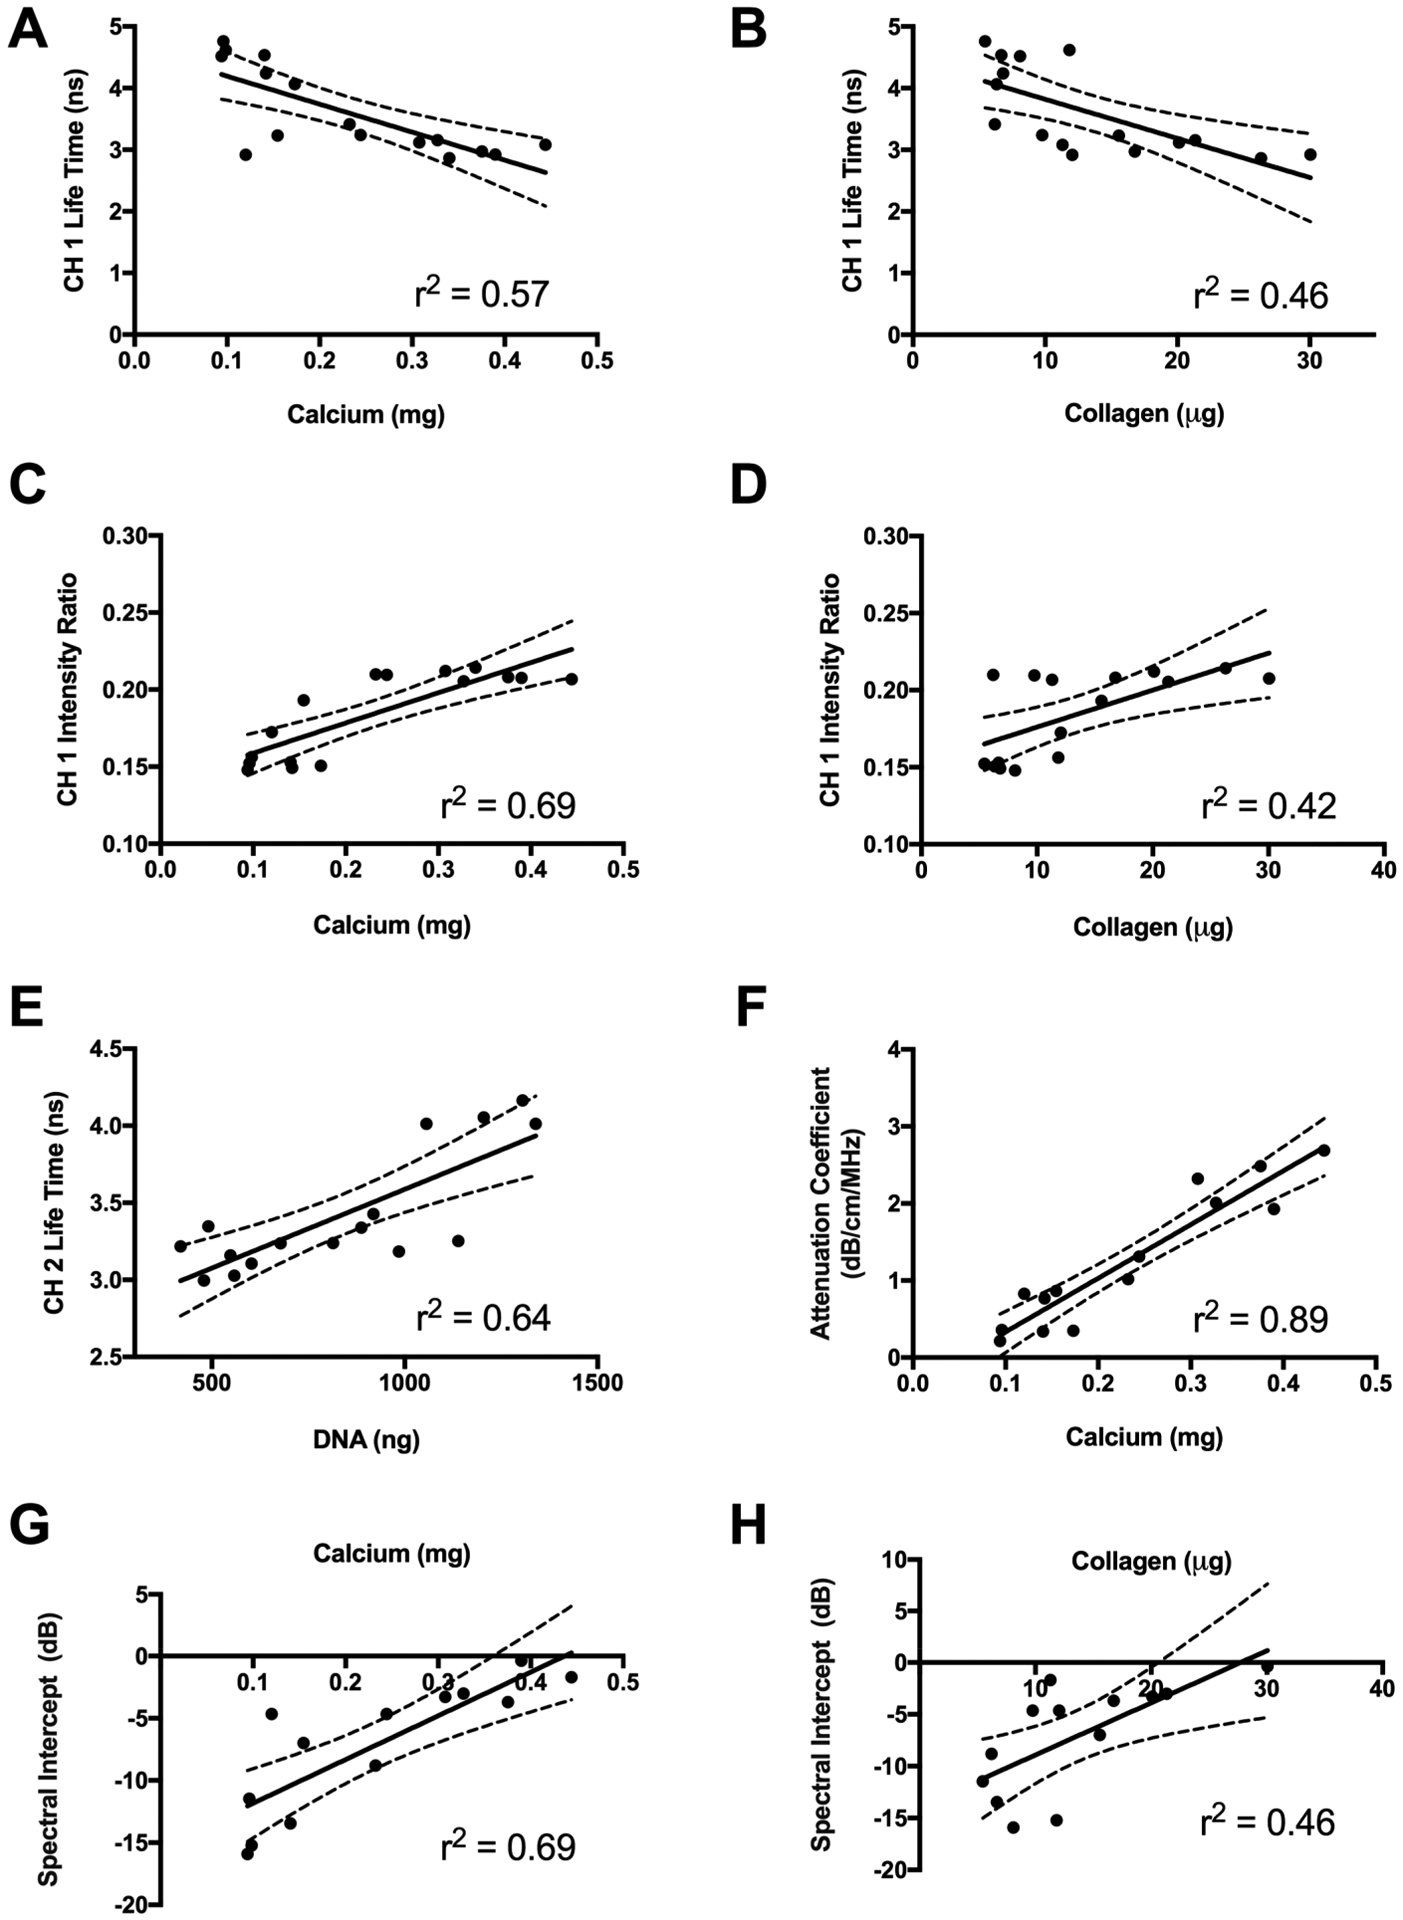
(A, B) Optical and ultrasonic properties correlate to biochemical and mechanical properties. (A, B) Channel 1 fluorescence lifetime as a function of (A) calcium and (B) collagen content. (C, D) Channel 1 fluorescence intensity ratio as a function of (C) calcium and (D) collagen content. (E) Channel 2 fluorescence lifetime as a function of DNA content. (F) Attenuation coefficient as a function of calcium content. (G, H) Spectral intercept as a function of (G) calcium and (H) collagen content.
Construct Mechanical Properties Correlate with Biochemical, Optical, and Ultrasonic Parameters.
Changes in differentiation-associated biochemical properties also correlated with changes in bulk mechanical properties and ultrasonic values (Figure 6). The strongest correlation was observed between the loss modulus and calcium (p < 0.0001, r2 = 0.73) (Figure 6A). However, changes to bulk mechanical properties were detectable and correlated with ultrasonic properties. The loss modulus exhibited a strong positive correlation with the attenuation coefficient (p = 0.0002, r2 = 0.69) (Figure 6B). The storage modulus also correlated strongly with calcium (p = 0.0003, r2 = 0.67) and collagen content (p = 0.0008, r2 = 0.62) (Figure 6C, D). We observed a moderate correlation between the storage modulus and the attenuation coefficient (p = 0.0002, r2 = 0.69) (Figure 6E). The interplay between increasing biochemical complexity, corresponding to changes in AF and ultrasonic impedance, and functional differences in bulk mechanical properties is demonstrated in Figure 7.
Figure 6.
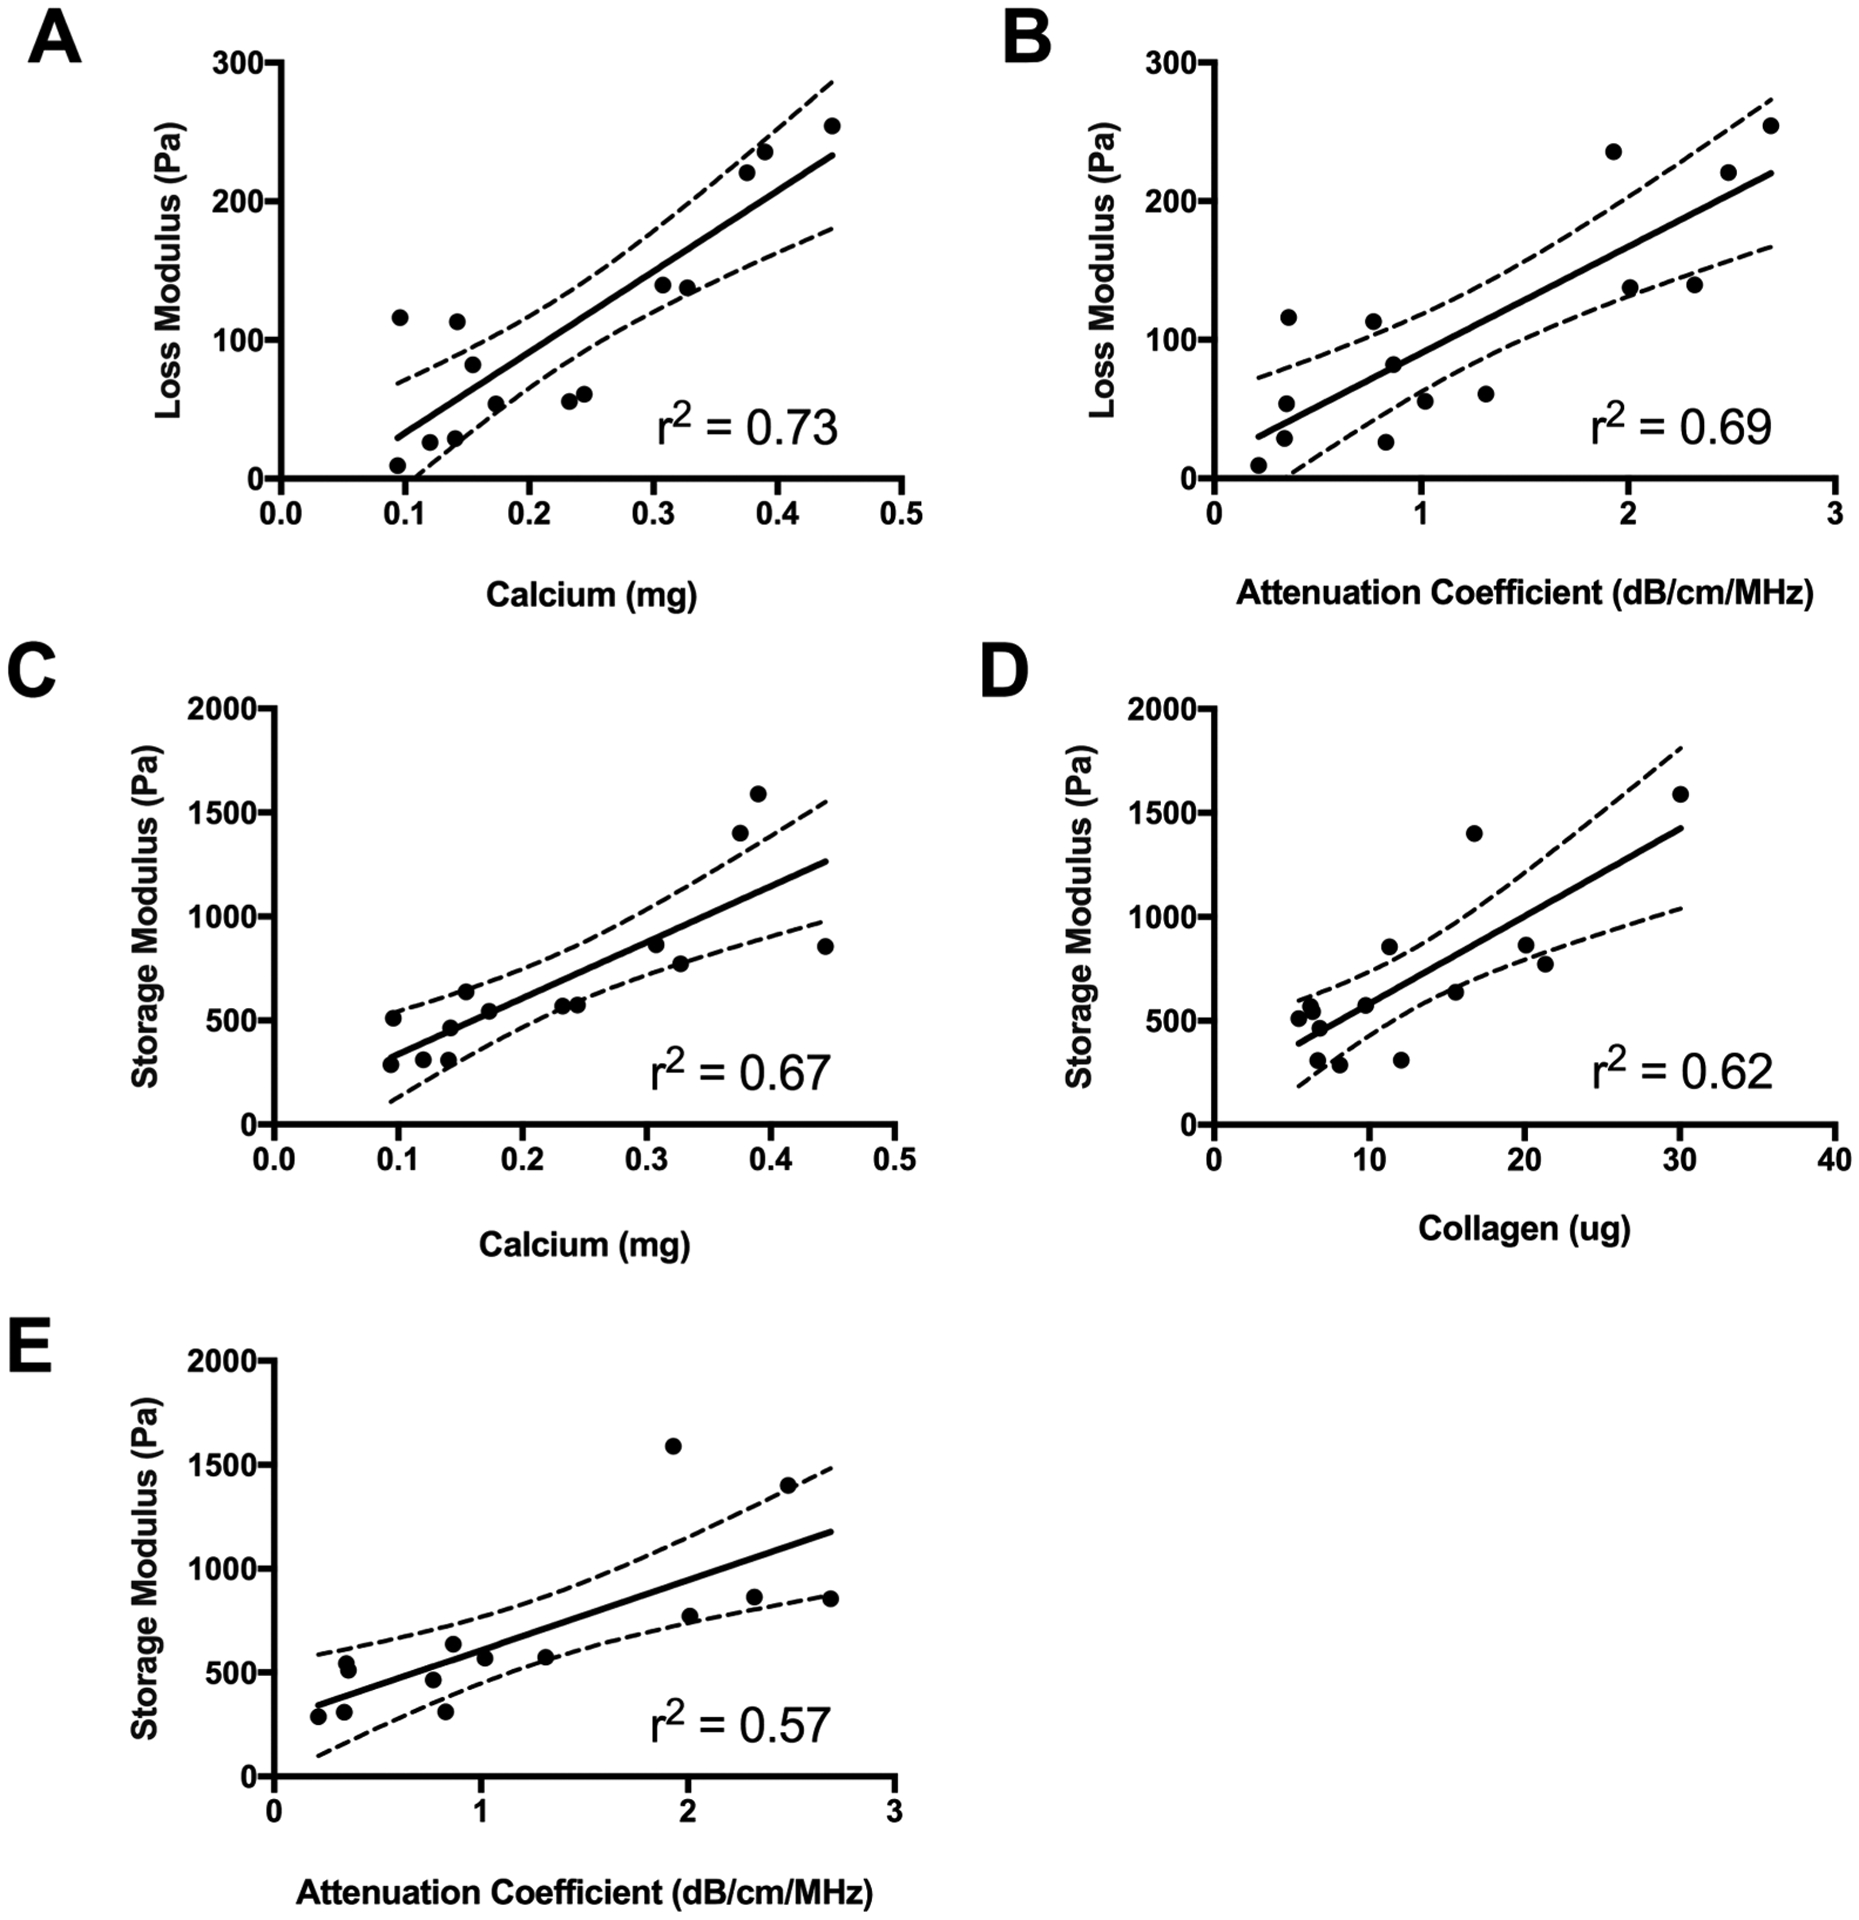
Mechanical properties correlate to biochemical, optical, and sonic properties. (A, B) Loss modulus as a function of (A) calcium content and (B) attenuation coefficient. (C–E) Storage modulus as a function of (C) calcium content, (D) collagen content, and (E) attenuation coefficient.
Figure 7.
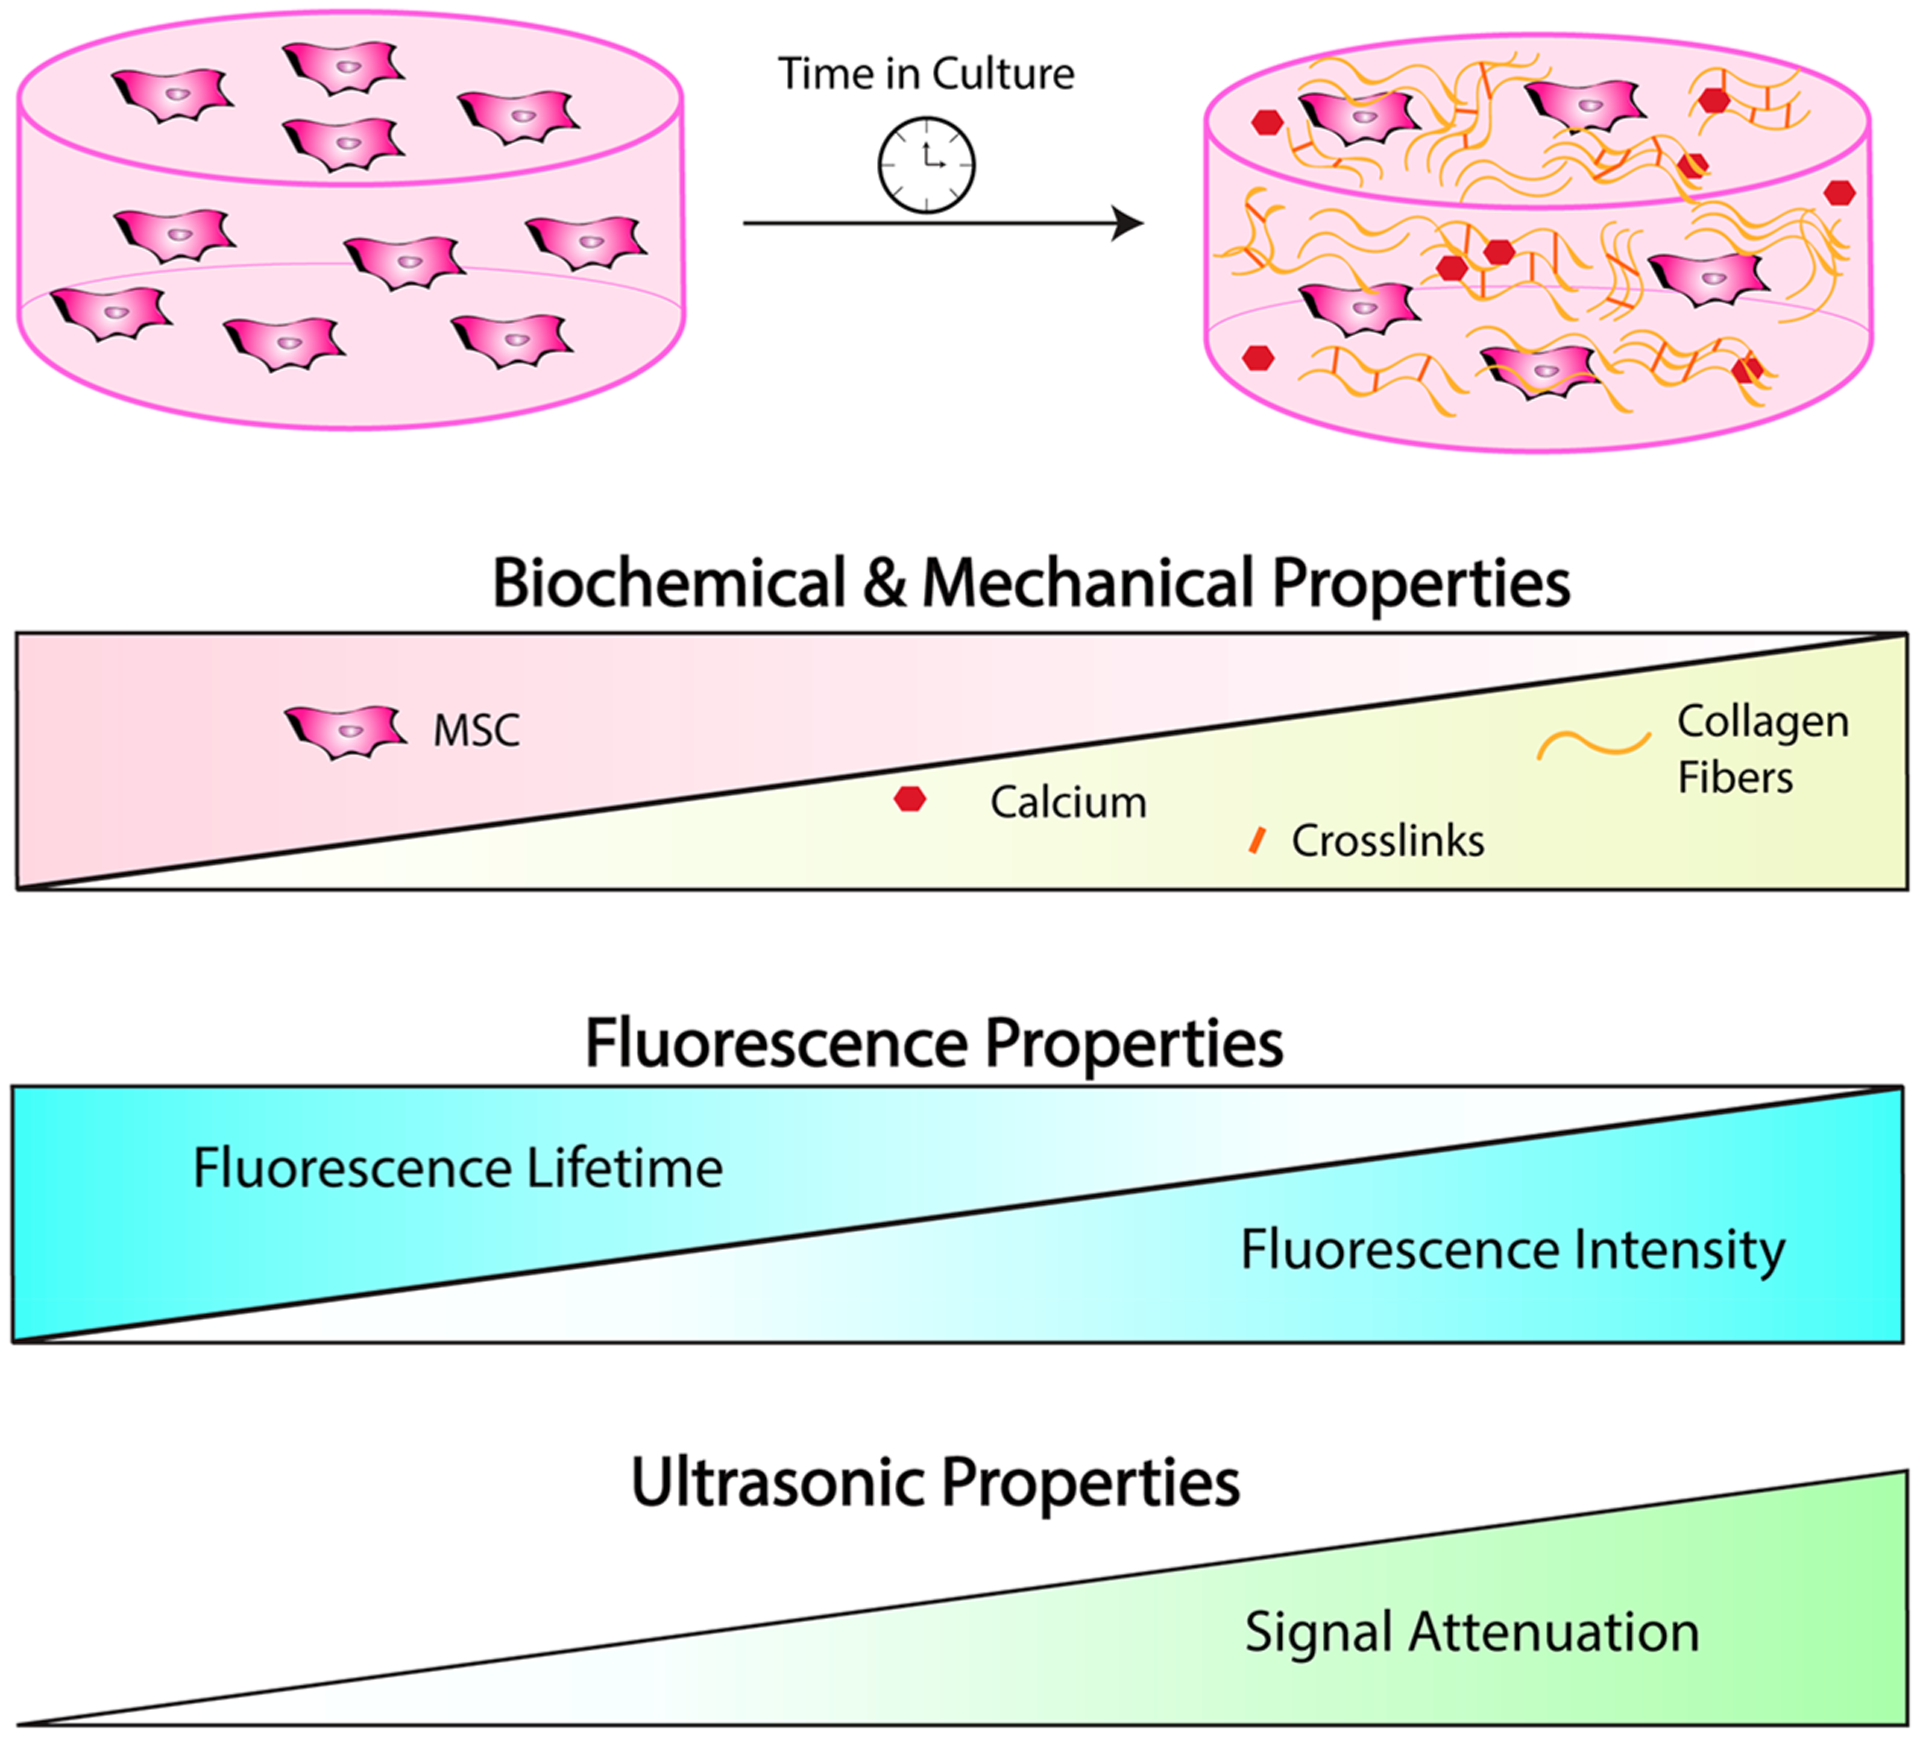
Optical and ultrasonic imaging can detect dynamic changes in engineered constructs during in vitro culture.
4. DISCUSSION
Cellular therapies are at the forefront of regenerative medicine, but current strategies to evaluate evolving construct properties in real time are lacking. Nondestructive techniques to assess maturation of engineered tissues are needed to determine necessary and sufficient culture durations to ensure function prior to in vivo implantation. In this study, we encapsulated human MSCs and osteoconductive polymer microparticles in alginate hydrogels, an FDA-approved and highly tunable material used in tissue engineering applications. MSCs are broadly used in tissue engineering, yet the heterogeneous nature of this cell population can result in substantial variability in responses to soluble and materials-based stimuli. Thus, the development of effective, nondestructive tools to monitor the maturation of engineered tissues is critical to improve uniformity of graft formation and propel these products to the clinic. We hypothesized this multimodal imaging approach could be used to perform nondestructive analysis of engineered constructs during in vitro culture. Linear regression analysis revealed moderate and strong correlations between imaging parameters and collagen and calcium deposition by encapsulated MSCs, indicators of osteogenic differentiation. Bone repair requires a complex sequence of events characterized by deposition of extracellular matrix that is remodeled and mineralized to generate new bone. In vitro tissue engineering affords additional controls and evaluation methods to further our understanding of graft maturation compared to in vivo tissue formation. These studies represent the first report of combined optical and ultrasonic imaging methods to monitor osteogenic differentiation in 3D culture.
The application of FLIm to detect AF of tissues has been rapidly expanding from characterizing cells in monolayer culture34 to analysis of tissue biopsies such as skin35,36 and engineered tissue constructs.5,9 The main advantage of this approach is that samples can be imaged and analyzed without the need for additional labeling. FLIm is effective at identifying the unique AF signatures of collagen and collagen cross-links, which occur during tissue maturation.7,8 Collagen expression and content are frequently used as markers for osteogenic differentiation and indicators of tissue maturation. In this study, we observed strong AF signal in the first three of four channels, corresponding to emission wavelengths of 390/18 nm, 435/40 nm, and 510/84 nm for channels 1, 2, and 3 respectively. Although channel 3 accounted for 30–40% of the recorded FIR, the lifetime value in channel 3 was unchanged over the culture duration. Although channel 3 LT was unchanged at the time points investigated, that does not imply the channel is not useful. It is possible that multiple independent fluorophores contribute in opposing manners to channel 3 AF, resulting in no net change. In contrast, the emission of NADH from cellular metabolism is known to dominate channel 2 (435 ± 40 nm).33 MSCs entrapped in alginate hydrogels were first preconditioned using osteogenic supplements, and constructs were maintained in these conditions throughout the experiment. We observed decreased DNA content during differentiation, which likely resulted from a reduced proliferative capacity during osteogenic differentiation.37 DNA content is an indirect measure of cellularity and accompanying NADH in samples. Decreased DNA content occurred concomitant to decreased LT values, which resulted in a strong positive correlation between channel 2 fluorescence lifetime and DNA content.
Type I collagen is the main organic constituent in bone extracellular matrix and the fluorescent signature in channel 1 correlates with collagen content in collagen-rich materials.6 As expected, we observed a moderate negative correlation between collagen content and channel 1 fluorescence lifetime but positive correlation with channel 1 FIR as collagen content increased. In addition to collagen, carbonated apatite exhibited strong AF in channel 1. We selected a single concentration of mineralized microparticles for these studies to maximize the osteogenic response and the osteoconductive potential of the gel. However, the interplay between microparticle concentration and hydrogel mechanical properties, cell behavior, and optical imaging merits further investigation. We observed channel 1 lifetime decrease significantly over the first 2 weeks of culture and reach a final lifetime value of 3.02 ns, approaching that of carbonated apatite that measured 2.96 ns. In contrast, the AF signal for hydroxyapatite dominated channel 2 with an average lifetime of 3.2 ns. Channel 2 lifetime decreased over 4 weeks and reached a final lifetime similar to that of hydroxyapatite, the mature form of mineral and main inorganic constituent of bone. Increasing collagen and calcium content are expected during osteogenic differentiation and correlations to these strong fluorophores are not surprising. However, dissolution and re-precipitation of calcium used to cross-link the hydrogels concomitant with simultaneous changes in calcium and collagen deposited by entrapped MSCs make it difficult to decouple individual component contributions to FL values. Moreover, environmental effects may alter FLIm signals compared to the pure components measured here. Yet, these data suggest that FLIm was able to detect changes in AF resulting from collagenous matrix deposition and the progressive stages of biomineralization from carbonated apatite into hydroxyapatite found in mature bone.
Consistent with many light-based methods, FLIm has a limited penetration depth for analysis, which largely renders it a surface characterization tool. However, FLIm can be readily combined with other imaging techniques such as UBM to provide further compositional analysis throughout the entire volume of a construct. In addition to images, quantitative acoustic analysis of samples revealed compositional and mechanical properties that can be used to assess tissue engineered constructs.11–13 However, highly focused transducers are too bulky for scanning inside well plates and degrade performance of attenuation and backscatter analysis due to diffraction effects. Therefore, we employed a small unfocused transducer that can be paired with an optical fiber for rapid, multimodal assessment of structural and biochemical properties. The spectral shift algorithm for estimating the acoustic attenuation coefficient assumes linear frequency dependence, which can be prone to error in bone at high frequencies. However, estimates assuming linear frequency dependence provide value with softer materials, such as early stage engineered bone, which generally conform better to this assumption. Compared to transmission configurations required for insertion measurements, the reflectance mode techniques used in this study are more conducive to high-throughput applications and nondestructive sample analysis.10 Also, the spectral shift algorithm does not require calibration to a well-characterized phantom, which is challenging to calibrate at the high frequencies employed.
Using high-frequency UBM methods, we detected changes to the acoustic attenuation coefficient, a measure of acoustic signal impedance, and the spectral intercept, an indirect measure of particle size and frequency. In agreement with biochemical data indicating increased calcium and collagen deposition during culture, UBM measured increased attenuation coefficient and spectral intercept. Increased calcium content correlated moderately and strongly to spectral intercept and attenuation coefficient, respectively. These correlations are in agreement with correlations between FLIm and biochemical parameters, indicating relatively homogeneous biochemical properties throughout the volume of constructs.
This is the first study to utilize multimodal imaging techniques to monitor the formation of an implantable osteogenic graft made of human cells. These nondestructive techniques facilitated rigorous, matched sample analysis to correlate biochemical and mechanical properties to imaging outputs. The autofluorescence of biological molecules can change during microenvironmental perturbations. FLIm properties are sensitive to local pH38 and temperature39 conditions during acquisition, which can make comparisons between different experiments and systems difficult. However, in a previous study, we used the FLIm system under aseptic conditions to longitudinally monitor collagen hydrogels over time with consistent results.7 Continuing efforts seek to adapt the UBM system to operate under aseptic conditions and increase the functionality of this technique. Current acquisition methods require constructs at least 2 mm in height to provide a sufficient volume for data analysis. Therefore, this technique is limited to 3D geometries and would be difficult to implement for thinner constructs such as cell sheets or films. In this study, we identified several correlative relationships between measured outcomes. However, cell-based constructs undergo a complex sequence of events including several multivariate interactions that limit our ability to describe a cause and effect relationship.
5. CONCLUSIONS
Label-free FLIm and UBM were used to monitor collagen and calcium deposition within osteogenic tissue engineered constructs. These techniques demonstrated strong correlations to DNA, collagen, and calcium content within alginate hydrogels over 4 weeks in culture. Continued development of high-throughput, compact, and sterile tools for nondestructive characterization and quality control of engineered tissue prior to implantation is a vital step toward clinical application. The combined use of fluorescent surface measurements to infer biochemical composition with a more penetrative technique to evaluate gross morphology is valuable.
ACKNOWLEDGMENTS
This work was supported by grants from the California Institute for Regenerative Medicine (Grant RT3-07981) and the National Institutes of Health (R01 DE025475 and R01 DE025899). The content is solely the responsibility of the authors and does not necessarily represent the official views of the National Institutes of Health, CIRM, or any other agency of the State of California. The funders had no role in the decision to publish or preparation of the manuscript. J.N.H. received support from the National Defense Science and Engineering Graduate Fellowship (32 CFR 168a), Schwall Fellowship in Medical Research, and Achievement Rewards for College Scientists (ARCS) Foundation. We also acknowledge Matthew McCormick for his assistance with analyzing ultrasound backscatter microscopy data.
Footnotes
The authors declare no competing financial interest.
REFERENCES
- (1).Pittenger MF; Mackay AM; Beck SC; Jaiswal RK; Douglas R; Mosca JD; Moorman MA; Simonetti DW; Craig S; Marshak DR Multilineage potential of adult human mesenchymal stem cells. Science 1999, 284, 143–147. [DOI] [PubMed] [Google Scholar]
- (2).da Silva Meirelles L; Fontes AM; Covas DT; Caplan AI Mechanisms involved in the therapeutic properties of mesenchymal stem cells. Cytokine Growth Factor Rev. 2009, 20, 419–427. [DOI] [PubMed] [Google Scholar]
- (3).Assis-Ribas T; Forni MF; Winnischofer SMB; Sogayar MC; Trombetta-Lima M Extracellular matrix dynamics during mesenchymal stem cells differentiation. Dev. Biol 2018, 437, 63–74. [DOI] [PubMed] [Google Scholar]
- (4).Croce AC; Bottiroli G Autofluorescence spectroscopy and imaging: a tool for biomedical research and diagnosis. Eur. J. Histochem 2014, 58, 320–337. [DOI] [PMC free article] [PubMed] [Google Scholar]
- (5).Haudenschild A; Sherlock B; Zhou X; Hu J; Leach J; Marcu L; Athanasiou K Nondestructive fluorescence lifetime imaging and time-resolved fluorescence spectroscopy detect cartilage matrix depletion and correlate with mechanical properties. Eur. Cells Mater 2018, 36, 30–43. [DOI] [PubMed] [Google Scholar]
- (6).Li C; Shklover J; Parvizi M; Sherlock BE; Alfonso Garcia A; Haudenschild AK; Griffiths LG; Marcu L Label-free assessment of collagenase digestion on bovine pericardium properties by fluorescence lifetime imaging. Ann. Biomed. Eng 2018, 46, 1870–1881. [DOI] [PMC free article] [PubMed] [Google Scholar]
- (7).Sherlock BE; Harvestine JN; Mitra D; Haudenschild A; Hu J; Athanasiou KA; Leach JK; Marcu L Nondestructive assessment of collagen hydrogel cross-linking using time-resolved autofluorescence imaging. J. Biomed. Opt 2018, 23, 1–9. [DOI] [PMC free article] [PubMed] [Google Scholar]
- (8).Mitra D; Fatakdawala H; Nguyen-Truong M; Creecy A; Nyman J; Marcu L; Leach JK Detection of pentosidine cross-links in cell-secreted decellularized matrices using time resolved fluorescence spectroscopy. ACS Biomater. Sci. Eng 2017, 3, 1944–1954. [DOI] [PMC free article] [PubMed] [Google Scholar]
- (9).Alfonso-Garcia A; Shklover J; Sherlock BE; Panitch A; Griffiths LG; Marcu L Fiber-based fluorescence lifetime imaging of recellularization processes on vascular tissue constructs. J. Biophotonics 2018, 11, e201700391. [DOI] [PMC free article] [PubMed] [Google Scholar]
- (10).Quantitative Ultrasound in Soft Tissues, 1st ed.; Mamou J, Oelze ML, Eds.; Springer: Amsterdam, The Netherlands, 2013. [Google Scholar]
- (11).Dalecki D; Mercado KP; Hocking DC Quantitative ultrasound for nondestructive characterization of engineered tissues and biomaterials. Ann. Biomed. Eng 2016, 44, 636. [DOI] [PMC free article] [PubMed] [Google Scholar]
- (12).Gudur M; Rao RR; Hsiao Y-S; Peterson AW; Deng CX; Stegemann JP Noninvasive, quantitative, spatiotemporal characterization of mineralization in three-dimensional collagen hydrogels using high-resolution spectral ultrasound imaging. Tissue Eng., Part C 2012, 18, 935–946. [DOI] [PMC free article] [PubMed] [Google Scholar]
- (13).Gudur MSR; Rao RR; Peterson AW; Caldwell DJ; Stegemann JP; Deng CX Noninvasive quantification of in vitro osteoblastic differentiation in 3D engineered tissue constructs using spectral ultrasound imaging. PLoS One 2014, 9, e85749. [DOI] [PMC free article] [PubMed] [Google Scholar]
- (14).Ho SS; Keown AT; Addison B; Leach JK Cell migration and bone formation from mesenchymal stem cell spheroids in alginate hydrogels are regulated by adhesive ligand density. Biomacromolecules 2017, 18, 4331–4340. [DOI] [PMC free article] [PubMed] [Google Scholar]
- (15).Shekaran A; Garcia JR; Clark AY; Kavanaugh TE; Lin AS; Guldberg RE; Garcia AJ Bone regeneration using an alpha 2 beta 1 integrin-specific hydrogel as a BMP-2 delivery vehicle. Biomaterials 2014, 35, 5435–5461. [DOI] [PMC free article] [PubMed] [Google Scholar]
- (16).Alves Cardoso D; Van Den Beucken JJ; Both LL; Bender J; Jansen JA; Leeuwenburgh SC Gelation and biocompatibility of injectable alginate-calcium phosphate gels for bone regeneration. J. Biomed. Mater. Res., Part A 2014, 102, 808–817. [DOI] [PubMed] [Google Scholar]
- (17).Suarez-Gonzalez D; Barnhart K; Saito E; Vanderby R Jr; Hollister S; Murphy WL Controlled nucleation of hydroxyapatite on alginate scaffolds for stem cell-based bone tissue engineering. J. Biomed. Mater. Res., Part A 2010, 95, 222–234. [DOI] [PMC free article] [PubMed] [Google Scholar]
- (18).Ingavle GC; Gionet-gonzales M; Vorwald CE; Bohannon LK; Clark K; Galuppo LD; Leach JK Biomaterials Injectable mineralized microsphere-loaded composite hydrogels for bone repair in a sheep bone defect model. Biomaterials 2019, 197, 119–128. [DOI] [PMC free article] [PubMed] [Google Scholar]
- (19).Cohen S; Yoshioka T; Lucarelli M; Hwang LH; Langer R Controlled delivery systems for proteins based on poly(lactic/glycolic acid) microspheres. Pharm. Res 1991, 8, 713–720. [DOI] [PubMed] [Google Scholar]
- (20).Davis HE; Binder BY; Schaecher P; Yakoobinsky DD; Bhat A; Leach JK Enhancing osteoconductivity of fibrin gels with apatite-coated polymer microspheres. Tissue Eng., Part A 2013, 19, 1773–1782. [DOI] [PMC free article] [PubMed] [Google Scholar]
- (21).Jongpaiboonkit L; Franklin-Ford T; Murphy WL Growth of hydroxyapatite coatings on biodegradable polymer microspheres. ACS Appl. Mater. Interfaces 2009, 1, 1504–1511. [DOI] [PMC free article] [PubMed] [Google Scholar]
- (22).Madrigal JL; Shams S; Stilhano S; Silva EA Characterizing the encapsulation and release of lentivectors and adeno-associated vectors from degradable alginate hydrogels. Biomater. Sci 2019, 7, 645–656. [DOI] [PubMed] [Google Scholar]
- (23).Yankelevich DR; Ma D; Liu J; Sun Y; Sun Y; Bec J; Elson DS; Marcu L Design and evaluation of a device for fast multispectral time-resolved fluorescence spectroscopy and imaging. Rev. Sci. Instrum 2014, 85, 034303. [DOI] [PMC free article] [PubMed] [Google Scholar]
- (24).Liu J; Qi J; Marcu L Reply to Comment: ‘A novel method for fast and robust estimation of fluorescence decay dynamics using constrained least-square deconvolution with Laguerre expansion’. Phys. Med. Biol 2017, 62, 1637–1641. [DOI] [PMC free article] [PubMed] [Google Scholar]
- (25).Sillen A; Engelborghs Y The correct use of ‘average’ fluorescence parameters. Photochem. Photobiol 1998, 67, 475–486. [Google Scholar]
- (26).Lizzi FL; Ostromogilsky M; Feleppa EJ; Rorke MC Relationship of ultrasonic spectral parameters to features of tissue microstructure. IEEE Trans Ultrason Ferroelectr Freq Control 1987, 34, 319–329. [DOI] [PubMed] [Google Scholar]
- (27).Murphy KC; Hoch AI; Harvestine JN; Zhou D; Leach JK Mesenchymal stem cell spheroids retain osteogenic phenotype through α2β1 signaling. Stem Cells Transl. Med 2016, 5, 1229–1237. [DOI] [PMC free article] [PubMed] [Google Scholar]
- (28).Hung BP; Harvestine JN; Saiz AM; Gonzalez-Fernandez T; Sahar DE; Weiss ML; Leach JK Defining hydrogel properties to instruct lineage- and cell-specific mesenchymal differentiation. Biomaterials 2019, 189, 1–10. [DOI] [PMC free article] [PubMed] [Google Scholar]
- (29).Harvestine JN; Orbay H; Chen JY; Sahar DE; Leach JK Cell-secreted extracellular matrix, independent of cell source, promotes the osteogenic differentiation of human stromal vascular fraction. J. Mater. Chem. B 2018, 6, 4104–4115. [DOI] [PMC free article] [PubMed] [Google Scholar]
- (30).Hagerty P; Lee A; Calve S; Lee CA; Vidal M; Baar K The effect of growth factors on both collagen synthesis and tensile strength of engineered human ligaments. Biomaterials 2012, 33, 6355–6361. [DOI] [PubMed] [Google Scholar]
- (31).Creemers LB; Jansen DC; Van Veen-Reurings A; Van Den Bos T; Everts V Microassay for the assessment of low levels of hydroxyproline. BioTechniques 1997, 22, 656–658. [DOI] [PubMed] [Google Scholar]
- (32).Salkind NJ Statistics for People Who (Think They) Hate Statistics; Sage Publications: 2000. [Google Scholar]
- (33).Blacker TS; Mann ZF; Gale JE; Ziegler M; Bain AJ; Szabadkai G; Duchen MR Separating NADH and NADPH fluorescence in live cells and tissues using FLIM. Nat. Commun 2014, 5, 1–9. [DOI] [PMC free article] [PubMed] [Google Scholar]
- (34).Ashjian P; Elbarbary A; Zuk P; DeUgarte DA; Benhaim P; Marcu L; Hedrick MH Noninvasive in situ evaluation of osteogenic differentiation by time-resolved laser-induced fluorescence spectroscopy. Tissue Eng. 2004, 10, 411–420. [DOI] [PMC free article] [PubMed] [Google Scholar]
- (35).Dancik Y; Favre A; Loy CJ; Zvyagin AV; Roberts MS Errata: Use of multiphoton tomography and fluorescence lifetime imaging to investigate skin pigmentation in vivo. J. Biomed. Opt 2013, 18, No. 029802. [DOI] [PubMed] [Google Scholar]
- (36).Galletly NP; McGinty J; Dunsby C; Teixeira F; Requejo-Isidro J; Munro I; Elson DS; Neil MAA; Chu AC; French PMW; Stamp GW Fluorescence lifetime imaging distinguishes basal cell carcinoma from surrounding uninvolved skin. Br. J. Dermatol 2008, 159, 152–161. [DOI] [PubMed] [Google Scholar]
- (37).Hoch AI; Mittal V; Mitra D; Vollmer N; Zikry CA; Leach JK Cell-secreted matrices perpetuate the bone-forming phenotype of differentiated mesenchymal stem cells. Biomaterials 2016, 74, 178–187. [DOI] [PMC free article] [PubMed] [Google Scholar]
- (38).Ogikubo S; Nakabayashi T; Adachi T; Islam MS; Yoshizawa T; Kinjo M; Ohta N Intracellular pH sensing using autofluorescence lifetime microscopy. J. Phys. Chem. B 2011, 115, 10385–10390. [DOI] [PubMed] [Google Scholar]
- (39).Okabe K; Inada N; Gota C; Harada Y; Funatsu T; Uchiyama S Intracellular temperature mapping with a fluorescent polymeric thermometer and fluorescence lifetime imaging microscopy. Nat. Commun 2012, 3, 705–709. [DOI] [PMC free article] [PubMed] [Google Scholar]


