

Chlamydia trachomatis positivity and testing for both Chlamydia trachomatis and Neisseria gonorrhoeae in the United States have increased during pregnancy from 2010 to 2018, but many are not tested in accordance with guidelines.
Abstract
Background
Chlamydia trachomatis (CT) and Neisseria gonorrhoeae (NG) case surveillance relies on reported positive laboratory results. Changes in reported cases may represent changes in testing practice or infection prevalence. This study evaluated changes over time for CT and NG positivity and testing rates of pregnant persons.
Methods
Prenatal testing results from persons aged 16 to 40 years tested by a national reference clinical laboratory were analyzed for CT and NG testing and positivity from 2010 to 2018 (n = 3,270,610).
Results
Testing rates increased among pregnant persons for CT (from 56.3% in 2010 to 64.1% in 2018, P < 0.001) and NG (from 55.6% to 63.2%, P < 0.001). Higher CT testing rates were found in Black non-Hispanic (adjusted odds ratio [AOR], 1.58; 95% confidence interval [CI], 1.57–1.60) and Hispanic (AOR, 1.19; 95% CI, 1.18–1.20) persons. NG and CT testing rates were virtually identical. Significant increasing trends in CT positivity were observed for each age group studied (P < 0.001 for all): 16–19 (from 11.7% to 13.0%), 20–24 (from 6.4% to 6.7%), 25–30 (from 1.9% to 2.4%), and 31–40 years (from 0.76% to 0.92%). Black non-Hispanic persons had the highest positivity for CT (AOR, 2.52; 95% CI, 2.46–2.57) and NG (AOR, 5.42; 95% CI, 5.05–5.82).
Conclusions
Testing and adjusted positivity for both CT and NG among pregnant persons increased from 2010 to 2018. Higher testing rates were observed in Black non-Hispanic and Hispanic persons (even in persons younger than 25 years), suggesting some testing decisions may have been based on perceived risk, in contrast to many guidelines recommending screening all pregnant persons younger than 25 years.
In 2018, the Centers for Disease Control and Prevention (CDC) reported that cases of Chlamydia trachomatis (CT) in the United States increased to record levels (1,758,668; 539.9 cases per 100,000 population).1 Reported cases of Neisseria gonorrhoeae (NG) increased 89% from 2010 (309,341; 100.2 cases per 100,000 population) to 2018 (583,405; 179.1 cases per 100,000 population), rising to the highest level since 1991.1 Of particular concern, CT and NG infections during pregnancy are associated with an increased risk of many adverse perinatal outcomes including preterm delivery,2,3 preterm rupture of membranes,2–4 and low birth weight.3–5 Treatment of CT during pregnancy is the most effective option for preventing postnatal complications and the infection being passed from mother to child during delivery.6
Both the CDC and the US Preventive Services Task Force recommend screening for CT and NG at the first prenatal visit for all pregnant persons younger than 25 years and those 25 years and older with risk factors.6–8 The American College of Obstetricians and Gynecologists recommends screening all pregnant persons for CT and those younger than 25 years for NG (and persons living where gonorrhea is common).9
CT and NG case surveillance in the United States relies heavily on reported positive laboratory results. Without negative results, it is unclear if changes in reported cases represent changes in testing practices or changes in prevalence among persons tested. Trends in sentinel populations can help interpret trends in national case report data. Pregnant persons have been used as a sentinel population for HIV prevalence10 and hepatitis C virus infection.11
This study uses data from a large national reference clinical laboratory to analyze trends in testing and positivity for CT/NG from 2010 to 2018 during pregnancy.
MATERIALS AND METHODS
Study Population
Pregnant persons were identified by searching for patients who had prenatal serum screening tests performed at Quest Diagnostics. Prenatal serum screening tests are used to categorize risk for open neural tube defects, Down syndrome (trisomy 21), and Edward's syndrome (trisomy 18). Deidentified laboratory prenatal screening test results from persons aged 16 to 40 years, with a company-wide unique patient identification number, from 2010 to 2018 were selected for potential inclusion. Only the first pregnancy for each patient was considered. Patients were included in the study if they also had any type of laboratory testing performed at Quest Diagnostics during the estimated third trimester of pregnancy to ensure continuity of laboratory services. The third trimester requirement could be the prenatal screening or any other laboratory test. (Trimester was based on gestational age listed with prenatal serum screening. When gestational age was not available, a value of 117 days was assigned given this was both the mean and median value for persons with available data.) Requiring continuity of laboratory services into the third trimester (as determined by receiving laboratory test requests of any kind during the third trimester) helped to ensure patients were most likely receiving all laboratory testing during their pregnancy from the same laboratory and were not tested for CT/NG elsewhere. Although guidelines recommend CT/NG testing at the first prenatal visit, many are tested later during pregnancy. Oral and rectal specimens were excluded because of small numbers and a lower risk of fetal infection.
CT and NG Testing
CT/NG test results were included from cervical, vaginal, or urine testing. Testing was performed using the Aptima Combo 2 CT/NG Assay (Hologic, Marlborough, MA) or CT/NG co-testing using the BD ProbeTec as part of a Pap test/cervical examination (Becton Dickinson, Franklin Lakes, NJ). All CT/NG test results were included for analysis of testing proportions. Only results reported as positive (values “positive” or “detected”) or negative (values “negative” or “not detected”) were included in the analysis of positivity. Urine specimens were included in the analysis but grouped with the vaginal/cervical anatomic site specimen results for analysis because of lack of differentiation of said specimens in the data files.
Demographic Factors
Race/ethnicity data were provided by the ordering health care provider at the time of the prenatal serum screening; however, the fields are often left unfilled or are completed as “not given.” Payer type analysis of Medicaid includes managed care Medicaid. Medicare patients were not considered in the payer type analysis because of the small number, but they were included in overall statistics. All other individuals with known payer type were grouped into “private” insurance. Patients were classified by age group at the time of testing for analysis: 16–19, 20–24, 25–30, and 31–40 years.
Statistical Analysis
Comparisons of CT/NG positivity and testing proportions between 2010 and 2018, race/ethnicity groups during the whole study period, and age groups during the whole study period were analyzed using the χ2 test. Trends in CT/NG positivity and testing proportions from 2010 to 2018 were analyzed using the Cochran-Armitage test for trend. Multivariable models were performed to assess demographically adjusted changes in testing and positivity rates over time. Variables were selected for inclusion in the model using a stepwise entry criterion of P < 0.05. All potential variables met this criterion and are shown in the figures depicting model results. Model fit was assessed using the area under the curve from receiver operating characteristic curves. Data analyses were performed using SAS Studio 3.6 on SAS 9.4 (SAS Institute Inc., Cary, NC). This Quest Diagnostics Health Trends study was deemed exempt by the Western Institutional Review Board (Puyallup, WA).
RESULTS
There were 5,304,969 unique patients selected for potential inclusion. Pregnant persons who did not have any diagnostic testing performed at Quest Diagnostics in the third trimester were excluded (n = 2,034,359), as were specimens that did not contain results from the vaginal, cervical, or urine anatomic source (n = 239 oral/rectal specimens). The population included in this study constituted 62% of patients selected for potential inclusion (n = 3,270,610). There were 294 patients with only equivocal CT/NG testing results that were excluded from CT/NG positivity analyses.
Demographic variables were largely similar between persons included and excluded (Table 1). Race/ethnicity data were available for a significantly higher proportion of included than excluded persons (55.0% vs. 42.0%, P < 0.001). Payer type data, either Medicaid or private payer, was available for more included than excluded persons (97.3% vs. 90.4%, P < 0.001). A significantly higher proportion of persons included had CT (60.4% vs. 28.3%, P < 0.001) and NG testing (59.6% vs. 27.9%, P < 0.001) performed. Included and excluded persons had similar positivity rates for CT (3.9% vs. 4.0%) and NG (0.40% vs. 0.49%).
TABLE 1.
Demographics of Included and Excluded Pregnant Persons
| Excluded | Included | 2010 | 2011 | 2012 | 2013 | 2014 | 2015 | 2016 | 2017 | 2018 | |
|---|---|---|---|---|---|---|---|---|---|---|---|
| No. | 2,034,359 | 3,270,610 | 459,248 | 394,013 | 345,766 | 331,175 | 336,112 | 339,843 | 344,074 | 355,643 | 364,736 |
| Age group, y | |||||||||||
| 16–19 | 180,830 (8.9) | 262,759 (8.0) | 45,056 (9.8) | 36,785 (9.3) | 31,075 (9.0) | 27,394 (8.3) | 26,171 (7.8) | 25,083 (7.4) | 23,983 (7.0) | 23,716 (6.7) | 23,496 (6.4) |
| 20–24 | 486,974 (23.9) | 719,912 (22.0) | 105,921 (23.1) | 90,550 (23.0) | 79,272 (22.9) | 75,553 (22.8) | 75,517 (22.5) | 74,077 (21.8) | 72,710 (21.1) | 73,118 (20.6) | 73,194 (20.1) |
| 25–30 | 708,316 (34.8) | 1,154,570 (35.3) | 159,346 (34.7) | 137,799 (35.0) | 120,959 (35.0) | 116,426 (35.2) | 119,124 (35.4) | 121,481 (35.8) | 123,305 (35.8) | 126,547 (35.6) | 129,583 (35.5) |
| 31–40 | 658,239 (32.4) | 1,133,369 (34.7) | 148,925 (32.4) | 128,879 (32.7) | 114,460 (33.1) | 111,802 (33.8) | 115,300 (34.3) | 119,202 (35.1) | 124,076 (36.1) | 132,262 (37.2) | 138,463 (38.0) |
| Race/Ethnicity* | |||||||||||
| Not available | 1,180,839 (58.0) | 1,470,192 (45.0) | 219,798 (47.9) | 178,930 (45.4) | 148,572 (42.0) | 139,799 (42.2) | 148,226 (44.1) | 151,449 (44.6) | 152,621 (44.4) | 160,719 (45.2) | 170,078 (46.6) |
| Black NH | 178,544 (20.9) | 354,671 (19.7) | 49,609 (20.7) | 45,077 (21.0) | 40,762 (20.7) | 39,793 (20.8) | 37,446 (19.9) | 35,743 (19.0) | 35,437 (18.5) | 35,935 (18.4) | 34,869 (17.9) |
| White NH | 397,023 (46.5) | 835,324 (46.4) | 119,595 (50.0) | 105,206 (48.9) | 94,891 (48.1) | 91,321 (47.7) | 86,684 (46.1) | 84,736 (45.0) | 85,046 (44.4) | 84,536 (43.4) | 83,309 (42.8) |
| Hispanic | 177,665 (20.8) | 423,521 (23.5) | 49,943 (20.9) | 45,602 (21.2) | 43,150 (21.9) | 42,383 (22.2) | 44,563 (23.7) | 47,655 (25.3) | 49,149 (25.7) | 50,710 (26.0) | 50,366 (25.9) |
| Other | 100,288 (11.8) | 186,902 (10.4) | 20,303 (8.5) | 19,198 (8.9) | 18,391 (9.3) | 17,879 (9.3) | 19,193 (10.2) | 20,260 (10.8) | 21,821 (11.4) | 23,743 (12.2) | 26,114 (13.4) |
| Payer type† | |||||||||||
| Medicaid | 514,460 (28.0) | 850,137 (26.7) | 128,339 (28.6) | 117,646 (30.6) | 102,098 (30.3) | 99,620 (30.8) | 96,460 (29.6) | 84,653 (25.9) | 76,429 (22.8) | 74,674 (21.5) | 70,218 (19.8) |
| Private payer | 1,324,607 (72.0) | 2,332,413 (73.3) | 319,757 (71.4) | 266,331 (69.4) | 234,739 (69.7) | 223,466 (69.2) | 228,991 (70.4) | 241,762 (74.1) | 259,332 (77.2) | 272,659 (78.5) | 285,376 (80.3) |
The table represents demographics for persons during first known pregnancy. Numbers in parentheses represent the proportion of the population in each demographic group; category sums may not total 100% because of rounding.
*Percentages for individual race/ethnicities are based on a denominator of those with available data.
†Payer type data were either not available or were Medicare data for 88,060 (2.7%) of included and 195,292 (9.6%) of excluded pregnant persons.
NH indicates non-Hispanic.
Many demographic characteristics of persons included in this study changed from 2010 to 2018 (Table 1). The mean maternal age increased every year from 2010 (28.0 ± 5.8 years) to 2018 (28.9 ± 5.6 years), an overall increase of 0.9 years. The percent of pregnant persons who were teenagers decreased by 35% (from 9.8% in 2010 to 6.4% in 2018), whereas the percent who were aged 31–40 years increased by 17% (from 32.4% in 2010 to 38.0% in 2018). Among persons whose race/ethnicity was provided, the percent of pregnancies from White non-Hispanic and Black non-Hispanic persons declined over the study period, 14.4% and 13.5%, respectively. The percent of pregnancies from Hispanic persons and those with other ethnicities increased greatly, 23.9% and 57.6%, respectively. The percent of Medicaid-covered persons increased from 2010 (28.6%) to 2013 (30.8%) but declined every year thereafter.
There was a significant increasing trend (P < 0.001) in CT testing of pregnant persons during the study period from 2010 (56.3%) to 2018 (64.1%). Average CT testing proportions from 2010 to 2018 were higher in younger age groups: 72.3% for 16–19 years, 66.3% for 20–24 years, 58.3% for 25–30 years, and 56.0% for 31–40 years. There was a significant increasing trend in CT testing rates for each of these age groups from 2010 to 2018 (Fig. 1): 16–19 years (10%, from 69.4% to 76.4%; P < 0.001), 20–24 years (9%, from 63.6% to 69.5%; P < 0.001), 25–30 years (16%, from 53.8% to 62.4%; P < 0.001), and 31–40 years (22%, from 49.7% to 60.8%; P < 0.001). There was also a significant increasing trend in CT testing rates from 2010 to 2018 for each race/ethnicity studied and in the group where race/ethnicity data were unavailable (P < 0.001).
Figure 1.

C. trachomatis testing trends in the United States by race/ethnicity and age group during pregnancy. Each line represents years 2010–2018, data from Quest Diagnostics. Bars represent 95% confidence limits. Cochran-Armitage test for trend P < 0.01 for all groups expect “Other” race/ethnicity age 16 to 19 years.
There was a significant increasing trend in CT positivity for each age group studied (P < 0.001 for all): 16–19 years (from 11.7% to 13.0%), 20–24 years (from 6.4% to 6.7%), 25–30 years (from 1.9% to 2.4%), and 31–40 years (from 0.76% to 0.92%). When age was not accounted for, there were statistically significant decreasing CT positivity trends (P < 0.001) for Black non-Hispanic (from 8.6% to 7.2%, a 16% decrease) and Hispanic persons (from 5.3% to 4.7%, an 11% decrease). However, in age-stratified analyses, no Black non-Hispanic nor Hispanic age group demonstrated a statistically significant decline in CT positivity during the study period, indicating the overall decline in these groups was due, in large part, to an increase in maternal age. Stratified analyses also revealed the increasing trends in age-adjusted CT positivity were driven primarily by increases in White non-Hispanic persons, who demonstrated a larger relative increase in CT positivity within each age group than all other groups with race/ethnicity data available (Fig. 2).
Figure 2.

C. trachomatis positivity trends in the United States by race/ethnicity and age group during pregnancy. Each line represents years 2010–2018, data from Quest Diagnostics. Bars represent 95% confidence limits. Cochran-Armitage test for trend: *P < 0.05; **P < 0.01; ***P < 0.001.
NG testing rates overall and testing rates within individual age and ethnicity stratifications were very similar to CT testing rates (Fig. 3). Of pregnant persons tested for NG, 99.9% were also tested for CT. Of pregnant persons tested for CT, 98.5% were also tested for NG.
Figure 3.
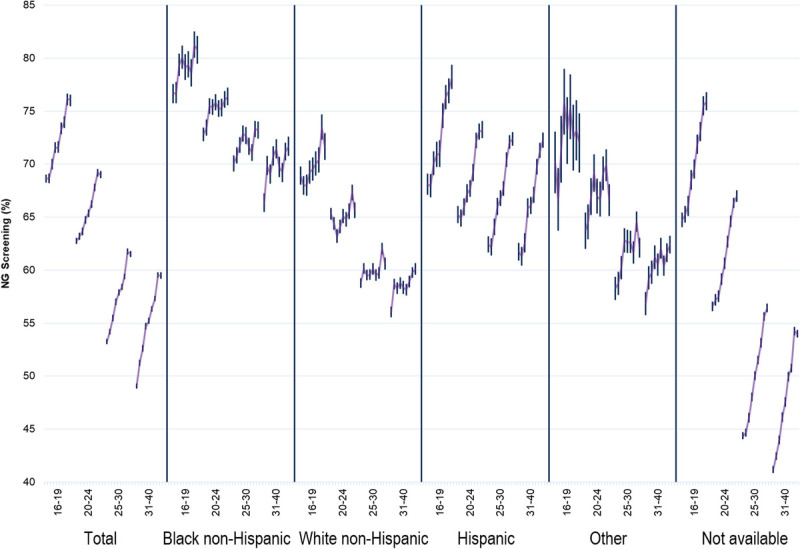
N. gonorrhoeae testing trends in the United States by race/ethnicity and age group during pregnancy. Each line represents years 2010–2018, data from Quest Diagnostics. Bars represent 95% confidence limits. Cochran-Armitage test for trend P < 0.01 for all groups, except “other” race/ethnicity with ages 16 to 19 years.
NG positivity increased for all age groups ≥20 years from 2010 to 2018, but only the 25- to 30-year age group demonstrated a statistically significant increasing trend (from 0.17% to 0.24%, a 41% increase; P < 0.01). Unlike CT, analyses stratified by age group and race/ethnicity combinations revealed only one significant increasing trend in NG positivity from 2010 to 2018 in persons with data available (Fig. 4): White non-Hispanic persons in the 25- to 30-years age group (from 0.10% to 0.17%, a 70% increase; P < 0.05). Black non-Hispanic persons had significantly higher NG positivity rates than any other race/ethnicity group for each age group studied (P < 0.001 for all), but also demonstrated a significant declining trend in positivity (from 1.57% to 1.16%, a 26% decline; P < 0.001) during the study period in unadjusted analysis. However, as with CT, age-stratified analyses revealed no statistically significant decline in NG positivity for any age group of Black non-Hispanic persons (Fig. 4).
Figure 4.
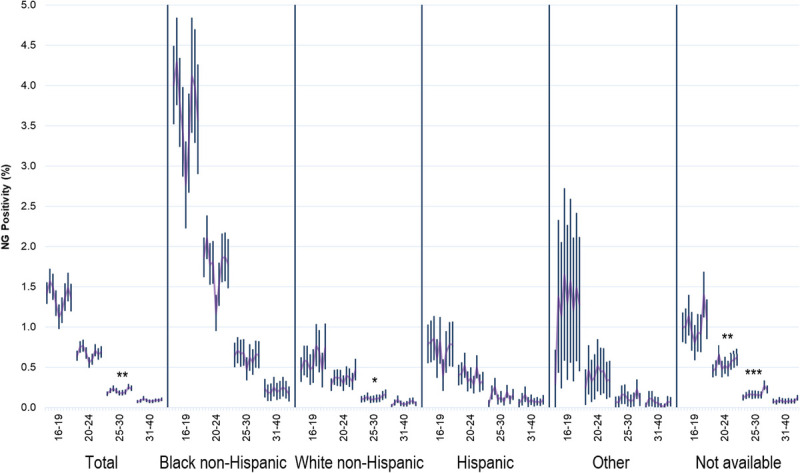
N. gonorrhoeae positivity trends in the United States by race/ethnicity and age group during pregnancy. Each line represents years 2010–2018, data from Quest Diagnostics. Bars represent 95% confidence limits. Cochran-Armitage test for trend: *P < 0.05; **P < 0.01; ***P < 0.001.
Multivariable logistic regression models with CT testing as the dependent variable revealed an increase in testing over time per yearly increment (AOR, 1.05; 95% confidence interval [CI], 1.05–1.06). Notable factors associated with an increased likelihood of CT testing being performed included the 16- to 19-year age group, Black non-Hispanic race/ethnicity, and Medicaid patients. Pregnant persons with race/ethnicity data missing had a lower adjusted likelihood of CT testing being performed. Factors associated with NG testing were virtually identical (Fig. 5). There was a strong age-based relationship in the CT positivity model (Fig. 6). Other notable factors associated with CT positivity included Medicaid payment (AOR, 1.30; 95% CI, 1.29–1.33) and both Black non-Hispanic (AOR, 2.52; 95% CI, 2.46–2.57) and Hispanic (AOR, 1.68; 95% CI, 1.64–1.72) race/ethnicity. The model also indicated an increase in CT positivity over time (AOR, 1.02, 95% CI, 1.02–1.02). Factors associated with NG positivity were largely similar to CT, although the association for Black non-Hispanic persons was notably stronger (AOR, 5.42; 95% CI, 5.05–5.82). A small but statistically significant association with study year was identified in the NG positivity model.
Figure 5.
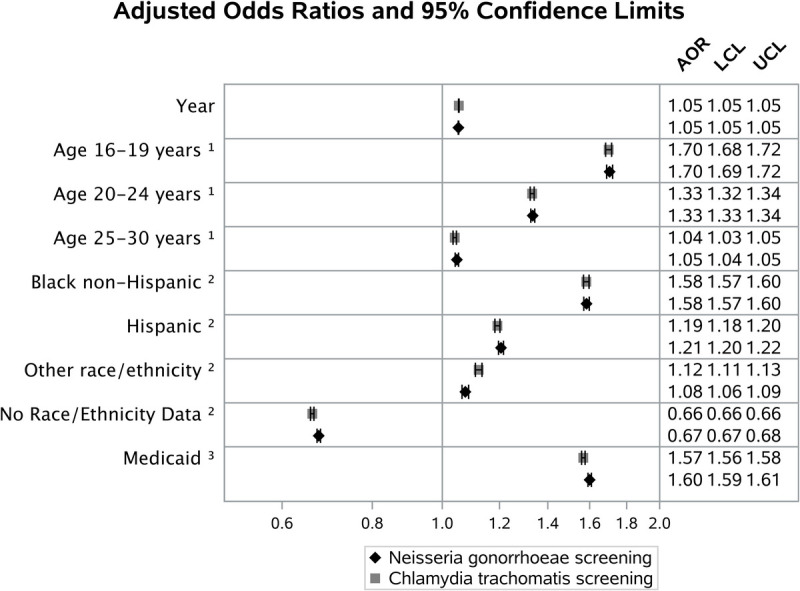
Multivariable models, associations with C. trachomatis and N. gonorrhoeae testing during pregnancy. Data from Quest Diagnostics, 2010–2018. Reference groups: 1, age 31 to 40 years; 2, White non-Hispanic; and 3, all non-Medicaid and unknown payer types. The AOR for “year” is per yearly increment. Area under the curve, 0.62 for both models.
Figure 6.
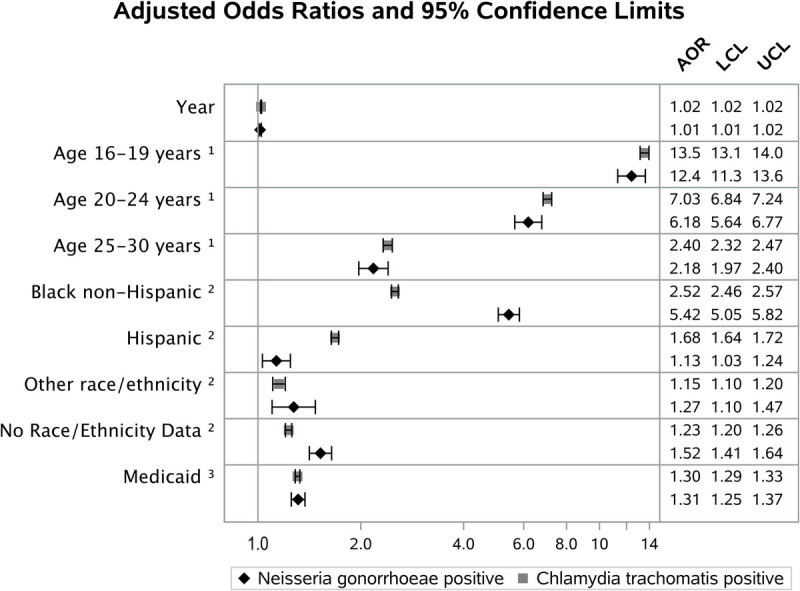
Multivariable models, associations with C. trachomatis and N. gonorrhoeae positivity during pregnancy. Data from Quest Diagnostics, 2010–2018. Reference groups: 1, age 31 to 40 years; 2, White non-Hispanic; and 3, all non-Medicaid and unknown payer types. The AOR for “year” is per yearly increment. C. trachomatis model (n = 1,975,556) with testing performed and positive/negative results; area under the curve, 0.77. N. gonorrhoeae model (n = 1,948,056) with testing performed and positive/negative results; area under the curve, 0.79.
DISCUSSION
This study provides an assessment of CT and NG testing and positivity rates in a large population of nearly 3.3 million pregnant persons in the United States over the 2010–2018 period. CT testing rates rose from 56.3% in 2010 to 64.1% in 2018 (a 1.7% relative annual increase). This annual increase closely compares with an increase of 2.0% among commercial health maintenance organization insurance members (43.1% in 2010 to 50.6% in 2018) and of 2.2% among commercial preferred provider organization insurance members (40.0% in 2010 to 47.6% in 2018) included in National Committee for Quality Assurance HEDIS measure of testing sexually active 16- to 24-year-old females.12 Our data suggest that changes in key demographic factors over time are impacting changes in both testing and positivity. Contributing factors to the rise in sexually transmitted infections (STIs) include drug use, stigma, unstable housing (contributes to decreased access to care), decreased condom use, and reductions in state and local sexually transmitted disease programs.13,14
The proportions of pregnancies from persons in the demographic groups with the highest testing and positivity rates (the 16- to 19-year age group, Black non-Hispanic persons [when race/ethnicity data were available], and Medicaid patients) all declined from 2010 to 2018 (35%, 14%, and 31%, respectively). Multivariable models controlling for age, payer type, and race/ethnicity indicated a 2% relative annual increase in CT positivity. There was a small but statistically significant annual change in NG positivity over time in the adjusted multivariable model, but White non-Hispanic persons in the 25- to 30-years age group were the only stratification of persons with available race/ethnicity data that displayed a significant increasing trend over time. The models also indicated a 5% relative annual increase in testing for both CT and NG, but it is important to note that many pregnant persons who should be tested according to existing guidelines remained untested. In persons with race/ethnicity data available, higher CT and NG testing rates were found in Black non-Hispanic and Hispanic persons (even in persons younger than 25 years), suggesting that many testing decisions were based on perceived risk, whereas many current guidelines recommend screening all pregnant persons younger than 25 years.6–9
An important limitation to this study is that race/ethnicity data were only available for 55% of included pregnant persons. The reasons for race/ethnicity not being completed on laboratory requisitions are unclear. Geography is only a partial explanation, as all states have provided at least some race/ethnicity data. It is likely the differences are based on individual patients' or providers' willingness to provide this information. Fortunately, race/ethnicity data were available for more than 1.8 million pregnant persons. White non-Hispanic persons younger than 25 years were less likely to be tested than Black non-Hispanic persons, even though the positivity rate for CT among the tested White non-Hispanic population was more than 6.0%. Since 2010, positivity for CT has increased more for the White non-Hispanic population than for pregnant persons of other races. Previous research indicates a higher prevalence of pelvic inflammatory disease among Black non-Hispanic versus White non-Hispanic females without a previous STI diagnosis.15 Although reasons for racial disparity in pelvic inflammatory disease are numerous, this may suggest that Black non-Hispanic females are more likely to have had an undiagnosed, asymptomatic STI or less likely to have received or reported a diagnosis for a symptomatic infection. Still, in our study, the Black non-Hispanic population was significantly more likely than the White non-Hispanic population to test positive for CT (AOR, 2.52) and NG (AOR, 5.42), although they experienced a 26% decline in NG positivity and an 16% decline in CT positivity from 2010 to 2018. However, no age group of Black non-Hispanic persons demonstrated a statistically significant decline in CT or NG positivity, indicating the overall declines were likely driven by increasing maternal age. A recent study of pregnant persons from Atlanta, Georgia (more than two-thirds of whom were Black non-Hispanic) found rates of CT and NG testing (97% each) and positivity (11% and 3%, respectively) that were even higher than those found for the Black non-Hispanic population included in this study.16
A major strength of this study is the analysis of testing and positivity rates at a large scale from pregnant individuals residing in all US states and the District of Columbia. The ability to analyze both positive and negative laboratory results in what could be considered a sentinel population may help interpret trends in national case report data. The rates of increase in CT positivity between 2010 and 2018 shown in this study are similar to, but lower than, increases in CDC case rates for females. For pregnant persons aged 20 to 24 years, a 5% increase was observed compared with a 19% increase in CDC case rates in females. For pregnant persons aged 25 to 30 years in this study, there was a 26% increase compared with a 40% increase in case rates for females aged 25 to 29 years. For pregnant persons aged 31 to 40 years in this study, there was a 21% increase compared with a 50% increase in case rates for females aged 30 to 39 years.1,17 The increases in positivity rates for NG in pregnant persons 20 years and over during this study, although only statistically significant in the 25- to 30-year age group, were also comparable with, but lower than, CDC case rate increases.1,17 Case report data and findings from this study also indicate declining NG infection rates in females younger than 20 years, consistent with previous research.18 In light of these findings, it is reasonable to conclude that observation of CT/NG positivity from laboratory results in the pregnant population may inform national surveillance efforts, but only to determine trends in positivity, not overall rates.
A large proportion of potential patients (38%) were excluded because of a lack of any type of laboratory testing performed at Quest Diagnostics during the third trimester. These patients had lower demonstrated testing rates than included patients and could have biased the results accordingly; however, many persons are tested for CT/NG at later stages of pregnancy. The lack of any testing being performed during the third trimester may indicate these women changed laboratory service providers during pregnancy and were tested for CT/NG by another laboratory provider (which was the reason for their exclusion). The similarity in CT/NG positivity between persons included and excluded suggests little to no bias in the positivity findings as a result of exclusions; however, using laboratory data to assess trends in positivity has some inherent limitations including individual health care providers moving in or out of the database. These limitations have been explored in depth previously.19 It is also difficult to discern what impact implementation of the Affordable Care Act, specifically Medicaid expansion, may have had on testing and positivity rates during the study period. Only the first pregnancy per patient was selected for inclusion in the study, resulting in excluding specimens from older persons at later stages of the study. Thus, our finding of pregnant persons' age increasing during the study period is likely an underestimate.
Testing and adjusted positivity rates for both CT and NG among pregnant persons have increased from 2010 to 2018. The Black non-Hispanic population had the highest risk for CT (AOR, 2.52; 95% CI, 2.46–2.57) and NG (AOR, 5.42; 95% CI, 5.05–5.82) positivity but also demonstrated the largest declines from 2010 to 2018 (16% and 26%, respectively), a decline driven primarily by the increase in maternal age. Higher testing rates were observed in Black non-Hispanic and Hispanic persons (even persons younger than 25 years), suggesting some testing decisions may have been based on perceived risk, in contrast to many current guidelines recommending screening all pregnant persons younger than 25 years. Despite the 5% relative annual increase in testing for both CT and NG indicated in the adjusted models, many who should be tested according to existing guidelines likely remained untested.
Footnotes
Conflict of Interest and Sources of Funding: Quest Diagnostics provided support in the form of salaries for J.K.N., H.W.K., and D.P.A. but had no role in study design, collection, analysis, interpretation of data, writing the report, or the decision to submit the report for publication. H.W.K. and D.P.A. own stock in Quest Diagnostics. T.A.P., G.T., and T.L.G. have no disclosures.
The findings and conclusions in this report are those of the authors and do not necessarily represent the official position of the Centers for Disease Control and Prevention.
Contributor Information
Justin K. Niles, Email: justin.k.niles@questdiagnostics.com.
Thomas A. Peterman, Email: tap1@cdc.gov.
Guoyu Tao, Email: gat3@cdc.gov.
Thomas L. Gift, Email: teg5@cdc.gov.
Damian P. Alagia, Email: Damian.P.Alagia@questdiagnostics.com.
REFERENCES
- 1.Centers for Disease Control and Prevention . Sexually Transmitted Disease Surveillance 2018. Atlanta, GA: U.S. Department of Health and Human Services; 2019. doi: 10.15620/cdc.79370. Accessed May 1, 2020. [DOI] [Google Scholar]
- 2.Blas MM Canchihuaman FA Alva IE, et al. Pregnancy outcomes in women infected with Chlamydia trachomatis: A population-based cohort study in Washington State. Sex Transm Infect 2007; 83:314–318. [DOI] [PMC free article] [PubMed] [Google Scholar]
- 3.Edwards LE Barrada MI Hamann AA, et al. Gonorrhea in pregnancy. Am J Obstet Gynecol 1978; 132:637–641. [DOI] [PubMed] [Google Scholar]
- 4.Olson-Chen C, Balaram K, Hackney DN. Chlamydia trachomatis and adverse pregnancy outcomes: Meta-analysis of patients with and without infection. Matern Child Health J 2018; 22:812–821. [DOI] [PubMed] [Google Scholar]
- 5.Heumann CL Quilter LA Eastment MC, et al. Adverse birth outcomes and maternal Neisseria gonorrhoeae infection: A population-based cohort study in Washington state. Sex Transm Dis 2017; 44:266–271. [DOI] [PMC free article] [PubMed] [Google Scholar]
- 6.Workowski KA Bolan GA, Centers for Disease Control and Prevention . Sexually transmitted diseases treatment guidelines, 2015. MMWR Recomm Rep 2015; 64(RR-03):1–137. [PMC free article] [PubMed] [Google Scholar]
- 7.U.S. Preventive Services Task Force . Chlamydial Infection: Screening: Final Recommendation Statement. 2017. Available at: https://www.uspreventiveservicestaskforce.org/uspstf/document/RecommendationStatementFinal/chlamydial-infection-screening. Accessed May 1, 2020.
- 8.U.S. Preventive Services Task Force . Gonorrhea: Screening: Final Recommendation Statement. 2017. Available at: https://www.uspreventiveservicestaskforce.org/uspstf/recommendation/gonorrhea-screening. Accessed May 1, 2020.
- 9.American College of Obstetricians and Gynecologists . Routine Tests During Pregnancy. Available at: https://www.acog.org/patient-resources/faqs/pregnancy/routine-tests-during-pregnancy. Accessed May 1, 2020.
- 10.Guidelines for Conducting HIV Sentinel Serosurveys among Pregnant Women and Other Groups World Health Organization (WHO) Joint United Nations Programme on HIV/AIDS (UNAIDS) US Centers for Disease Control and Prevention (CDC). 2003. Available at: https://www.who.int/hiv/pub/surveillance/en/ancguidelines.pdf. Accessed October 19, 2020.
- 11.Ly KN Jiles RB Teshale EH, et al. Hepatitis C virus infection among reproductive-aged women and children in the United States, 2006 to 2014. Ann Intern Med 2017; 166:775–782. [DOI] [PubMed] [Google Scholar]
- 12.NCQA . HEDIS Measures and Technical Resources, Chlamydia Screening in Women (CHL). Available at: https://www.ncqa.org/hedis/measures/chlamydia-screening-in-women/. Accessed January 18, 2021.
- 13.Tapp J, Hudson T. Sexually transmitted infections prevalence in the United States and the relationship to social determinants of health. Nurs Clin N Am 2020; 55:283–293. [DOI] [PubMed] [Google Scholar]
- 14.Hogben M, Leichliter JS. Social determinants and sexually transmitted disease disparities. Sex Transm Dis 2008; 35(12 Suppl):S13–S18. [DOI] [PubMed] [Google Scholar]
- 15.CDC . CDC Health disparities and inequalities report—United States, 2013. MMWR Suppl 2013; 62(Suppl 3). [PubMed] [Google Scholar]
- 16.Goggins ER Chamberlain AT Kim TG, et al. Patterns of screening, infection, and treatment of Chlamydia trachomatis and Neisseria gonorrhoeae in pregnancy. Obstet Gynecol 2020; 135:799–807. [DOI] [PubMed] [Google Scholar]
- 17.Centers for Disease Control and Prevention . Sexually Transmitted Disease Surveillance 2010. Atlanta, GA: U.S. Department of Health and Human Services, 2011. Available at: https://www.cdc.gov/std/stats/archive/surv2010.pdf. Accessed October 19, 2020. [Google Scholar]
- 18.Kaufman HW Gift TL Kreisel K, et al. Chlamydia and gonorrhea: Shifting age-based positivity among young females, 2010–2017. Am J Prev Med 2020; 59:697–703. [DOI] [PMC free article] [PubMed] [Google Scholar]
- 19.Satterwhite CL Gray AM Berman S, et al. Chlamydia trachomatis infections among women attending prenatal clinics: United States, 2004–2009. Sex Transm Dis 2012; 39:416–420. [DOI] [PubMed] [Google Scholar]