

Abstract
Objective:
Emerging data suggest that a 30% relative decline in liver fat as assessed by magnetic resonance imaging-proton density fat fraction (MRI-PDFF) may be associated with Nonalcoholic fatty liver disease (NAFLD) Activity Score improvement, but the association between decline in MRI-PDFF and fibrosis regression is not known. Therefore, we aimed to examine the association between ≥ 30% relative decline in MRI-PDFF and fibrosis regression in NAFLD.
Design:
This prospective study included 100 well-characterized patients with biopsy-proven NAFLD with paired contemporaneous MRI-PDFF assessment at two time points. MRI-PDFF response was defined as ≥ 30% relative decline in MRI-PDFF. The primary outcome was ≥1 stage histological fibrosis regression.
Results:
The median (interquartile range) age was 54 (43-62) years, and body mass index was 31.9 (29-36) kg/m2. In multivariable-adjusted logistic regression analysis (adjusted for age, gender, diabetes status, race/ethnicity, interval between biopsies, gamma-glutamyl transferase, liver stiffness by magnetic resonance elastography, and change in platelet counts), MRI-PDFF response was an independent predictor of fibrosis regression with adjusted odds ratio of 6.46 (95% confidence interval: 1.1-37.0, p = 0.04). The proportion of patients with MRI-PDFF response with fibrosis regression, fibrosis no change, and fibrosis progression were 40.0%, 24.6%, and 13.0%, respectively, and the proportion of patients with MRI-PDFF response increased with fibrosis regression (p = 0.03).
Conclusion:
≥ 30% reduction in MRI-PDFF in early phase trials can provide a useful estimate of odds of ≥ 1 stage improvement in fibrosis. These data may be helpful in sample-size estimation in nonalcoholic steatohepatitis trials.
Keywords: NAFLD, MRI-PDFF, fibrosis regression, NAS
Introduction
Nonalcoholic fatty liver disease (NAFLD) is one of the common causes of chronic liver disease worldwide affecting 30% of the global population1,2. In addition, the number of NAFLD patients is expected to increase with the global increase in obesity and metabolic syndrome3. Therefore, the development of therapeutic agents for NAFLD is a major unmet need, but no drug is currently approved by the United States Food and Drug Administration.
Liver fibrosis is the most important factor associated with the prognosis and liver-related complications in NAFLD and ≥ 1 stage improvement of fibrosis without worsening of nonalcoholic steatohepatiti (NASH) is a key regulatory endpoint that is used to evaluate therapeutic efficacy in Phase 3 clinical trials of therapeutic agents for NASH 4–6 . In Phase 2b trials, a 2-point improvements in NAFLD Activity Score (NAS), which is the sum of steatosis (0-3), lobular inflammation (0-3), and hepatocellular ballooning (0-2)7, has also been used to evaluate therapeutic efficacy. Therefore, multiple liver biopsies are required to evaluate therapeutic efficacy of an agent during its clinical development. However, liver biopsy has several limitations including invasiveness, sampling error, and only moderate inter-/intra-observer reproducibility8–10. Therefore, developing a non-invasive and objective evaluation method for assessment of treatment response is an urgent need in order to avoid the need for liver biopsy evaluation in clinical trials.
Magnetic resonance imaging (MRI)-estimated proton density fat fraction (PDFF) is a non-invasive evaluation method developed to quantify liver fat 11,12. Liver fat is one of the pathological features in NAFLD, and the assessment of liver fat by MRI-PDFF has the highest diagnostic accuracy compared to other non-invasive assessment methods13–15. MRI-PDFF is better than histology in assessing quantitative changes in liver fat in NASH trials16,17. Therefore, MRI-PDFF is commonly used as a primary endpoint in early phase NASH trials 18–21.
Emerging data suggests that a 30% relative decline in MRI-PDFF is associated with NAS improvement and NAS response (≥ 2 points improvement in NAS, with no worsening in fibrosis)22–25. However, to date, there are limited data regarding the association between a ≥ 30% relative decline in MRI-PDFF and fibrosis regression in patients with NASH. Therefore, there is a gap-in-knowledge whether changes in MRI-PDFF are associated with changes in liver fibrosis in NASH. This paper fills that gap-in-knowledge by providing new data on MRI-PDFF response and 1-stage regression in fibrosis.
Here, we aimed to examine whether a ≥ 30% relative decline in MRI-PDFF is associated with fibrosis regression in well-characterized patients with NAFLD who had a paired liver biopsy and contemporaneous MRI-PDFF assessment.
Methods
Study design
This is a longitudinal prospective study derived from a well-characterized cohort with biopsy-proven NAFLD. This study includes 100 consecutive uniquely phenotyped patients who underwent standardized research visit that included history, physical examination, biochemical testing, and paired liver biopsy (using NASH CRN Histologic Scoring System7) and MRI-PDFF assessment at NAFLD Research Center, University of California San Diego (UCSD) from March 2010 through October 2019. All patients completed written informed consent prior to enrollment. The study was approved by the UCSD Institutional Review Board.
Inclusion and exclusion criteria
Patients ≥ 18 years of age with biopsy proven NAFLD and written informed consent were included in the study. For this study, patients were included if MRI-PDFF was measured contemporaneously with their baseline liver biopsy and if they had a subsequent liver biopsy and contemporaneous MRI-PDFF. Patients meeting any of the following criteria were excluded from the study: significant alcohol consumption (defined as ≥14 drinks/week for men or ≥7 drinks/week for women) within the previous 2-year period; underlying liver disease including hepatitis B, hepatitis C, hemochromatosis, Wilson’s disease, alpha-1 antitrypsin deficiency, glycogen storage disease, autoimmune hepatitis, and cholestatic or vascular liver disease; clinical or laboratory evidence of secondary causes or chronic conditions associated with hepatic steatosis including nutritional disorders, human immunodeficiency virus infection, and use of steatogenic drugs such as amiodarone, glucocorticoids, methotrexate, l-asparaginase, and valproic acid; major systemic illnesses; contraindications to MRI including metallic implants, claustrophobia, and body circumference exceeding the imaging chamber capacity; pregnancy or attempting to be pregnant.
Histological evaluation
All patients underwent a baseline liver biopsy, followed by a second liver biopsy. Histologic assessments of liver biopsies were systematically assessed by an experienced liver pathologist blinded with clinical data. Biopsy results were scored using NASH CRN histologic scoring system7. Fibrosis was scored from 0 to 4, with stage 4 fibrosis defined as cirrhosis. Hepatic steatosis and lobular inflammation were scored from 0 to 3. Hepatocyte ballooning was scored from 0 to 2. Hepatic steatosis, lobular inflammation and hepatocyte ballooning were combined to obtain NAS ranging from 0 to 8. Fibrosis regression was defined as ≥1 stage decrease in fibrosis. NAS response was defined as ≥ 2 points improvement in NAS, with no worsening in fibrosis.
MRI assessment
Advanced MRI based phenotyping for MRI-PDFF and liver stiffness measurement by magnetic resonance elastography (MRE) was performed under the oversight of the UCSD Liver Imaging Group using a 3T research scanner (GE Signa EXCITE HDxt; GE Healthcare, Waukesha, WI) with all participants in the supine position. The details of the MRI protocol have been described previously11,26–28. The image analysts were blinded to all clinical and biochemical data. We chose the ≥ 30% MRI-PDFF relative decline cut-point, a priori, to assess whether it is associated with higher odds of fibrosis regression in NASH. MRI-PDFF response was defined as ≥ 30% relative decline in MRI-PDFF and MRI-PDFF non-response was defined as < 30% relative decline in MRI-PDFF. The median (interquartile range [IQR]) interval between biopsy and MRI-PDFF at baseline assessment and follow-up assessment was 36 (−1–66) days and −2 (−16–27) days, respectively.
Primary and secondary outcome
The primary outcome was histologic fibrosis regression by at least one stage from baseline assessment to follow-up assessment. For fibrosis regression assessment, patients with stage 0 fibrosis at baseline were excluded from the analysis. The secondary outcome was NAS response (≥ 2 points improvement in NAS, with no worsening in fibrosis). The association between MRI-PDFF response (≥ 30% relative decline in MRI-PDFF) and NAS response and fibrosis regression was evaluated.
Sample size estimation
The sample size estimation for primary outcome (as defined as ≥ 1 stage improvement in fibrosis using the NASH CRN Histologic scoring system between the baseline biopsy and the follow-up biopsy) was developed using previously published data. A previous meta-analysis of published studies with paired liver biopsies provided an estimate of fibrosis regression rate to be approximately 25% in this patient population 29. We recently demonstrated that ≥ 30% relative decline in MRI-PDFF was associated with higher odds of NAS response (odds ratios [ORs]: 4.86–6.98) 22,25. Based upon these data, we hypothesized ≥ 30% relative decline in MRI-PDFF would be associated with fibrosis regression with an odds ratio of 5.0. To obtain a power of 0.80 with an alpha of 0.05, we projected a sample size of 74 to obtain statistical significance. Therefore, we had adequate power to detect fibrosis regression associated with ≥ 30% relative decline in MRI-PDFF in the study.
Statistical analysis
Patient characteristics between patients with MRI-PDFF response (≥ 30% relative decline in MRI-PDFF) and those with non-response (< 30% relative decline in MRI-PDFF) was compared using Fisher’s exact test or Mann-Whitney U test. The optimal thresholds of MRI-PDFF and liver stiffness by MRE were determined based on receiver operating characteristics (ROC) analysis and Youden index. Univariable and multivariable logistic regression analysis were performed for factors associated with fibrosis regression. Physical examination data, biochemical data, histological findings, MRI findings, and changes in these variables were used for univariable logistic regression analysis. Factors with p < 0.05 on univariable logistic regression and age, sex, race/ethnicity, diabetes status, interval between biopsies were used for multivariable-adjusted logistic regression analysis. The association between MRI-PDFF response and change in fibrosis and NAS was examined using Cochran-Armitage trend test. The association between MRI-PDFF response and fibrosis regression was examined using Fisher’s exact test. The association between histological response and MRI-PDFF response was examined using logistic regression analysis. Statistical significance was defined as p < 0.05. All statistical analyses were performed using EZR (Saitama Medical center, Jichi Medical University, Saitama, Japan)30 and a graphical user interface for R (The R Foundation for Statistical Computing, Vienna, Austria).
Results
Patient characteristics
A total of 100 consecutive patients (62.0% women) who underwent paired liver biopsies and MRI-PDFF assessments were enrolled in the study. All patients provided written informed consent as part of the prospective evaluation in UCSD NAFLD Research Center. Twenty patients received standard of care liver biopsy and eighty patients were enrolled in the following clinical trials: ezetimibe versus placebo18 (n=38), sitagliptin versus placebo31 (n=19), selonsertib21 (n=12), colesevelam versus placebo17 (n=8), cenicriviroc versus placebo32 (n=4), obeticholic acid versus placebo33 (n=8), aramchol versus placebo34 (n=5), and other drugs (n=11) (these patients were enrolled in short-term trials). The patient characteristics are shown in Table.1. The median (IQR) age was 54 (43–62) years, and body mass index (BMI) was 31.9 (29–36) kg/m2. The interval between paired biopsies was 1.4 (0.6–2.9) years. The number of patients with fibrosis stage 0, 1, 2, 3, and 4 at baseline biopsy was 27, 35, 12, 16, and 10, respectively. Fibrosis regression was defined as ≥1 stage decrease in fibrosis using the NASH CRN Histological Scoring System, and twenty patients had fibrosis regression. Furthermore, 25 patients had MRI-PDFF response (≥ 30% relative decline in MRI-PDFF). Comparing the baseline patient characteristics between patients with MRI-PDFF response and those with MRI-PDFF non-response, no difference was observed in age, BMI, diabetes status, biochemical data, and histological findings.
Table. 1.
Patient characteristics
| All patients (n = 100) | Patients with MRI-PDFF response (≥ 30% relative decline in MRI-PDFF) (n = 25) | Patients with MRI-PDFF non-response (< 30% relative decline in MRI-PDFF) (n = 75) | p value | |
|---|---|---|---|---|
| Age (years) | 54 (43–62) | 55 (45–63) | 54 (41–60) | 0.4 |
| Weight (kg) | 89.5 (76–99) | 89.1 (80–94) | 89.7 (75–102) | 0.9 |
| BMI (kg/m2) | 31.9 (29–36) | 30.5 (28–34) | 32.5 (29–37) | 0.3 |
| Gender (women, n [%]) | 62 (62.0%) | 15 (60.0%) | 47 (62.7%) | 0.8 |
| Race, n (%) | 0.2 | |||
| White | 43 (43.0%) | 9 (36.0%) | 34 (45.3%) | |
| Hispanic | 40 (40.0%) | 10 (40.0%) | 30 (40.0%) | |
| Other | 17 (17.0%) | 6 (24.0%) | 11 (14.7%) | |
| Diabetes mellitus, n (%) | 47 (47.0%) | 12 (48.0%) | 35 (46.7%) | 1 |
| Hypertension, n (%) | 48 (48.0%) | 17 (68.0%) | 31 (41.3%) | 0.04 |
| Dyslipidemia, n (%) | 42 (42.0%) | 13 (52.0%) | 29 (38.7%) | 0.3 |
| Biochemical data | ||||
| AST (IU/L) | 35 (26–58) | 31 (26–61) | 35 (26–54) | 0.7 |
| ALT (IU/L) | 45 (32–77) | 44 (31–75) | 47 (36–77) | 0.6 |
| ALP (IU/L) | 73 (61–87) | 76 (57–87) | 72 (62–87) | 0.9 |
| GGT (IU/L) | 40 (28–63) | 39 (27–49) | 41 (28–65) | 0.5 |
| Bilirubin (mg/dl) | 0.4 (0.3–0.6) | 0.5 (0.4–0.6) | 0.4 (0.3–0.6) | 0.7 |
| Total cholesterol (mg/dl) | 182 (155–200) | 182 (151–195) | 181 (156–201) | 0.9 |
| HDL (mg/dl) | 43 (36–54) | 43 (39–52) | 43 (35–55) | 0.4 |
| LDL (mg/dl) | 98 (81–124) | 102 (81–129) | 97 (81–124) | 0.7 |
| TG (mg/dl) | 145 (111–197) | 147 (117–175) | 145 (111–198) | 0.7 |
| Platelet count (109/L) | 247 (198–278) | 239 (207–263) | 249 (196–280) | 0.6 |
| HbA1c (%) | 6.0 (5.6–6.6) | 6.0 (5.7–6.7) | 5.0 (5.6–6.6) | 0.9 |
| Interval between biopsies (years) | 1.4 (0.6–2.9) | 1.4 (0.6–3.1) | 1.4 (0.7–2.5) | 0.8 |
| Histological findings* | ||||
| Fibrosis stage, n (%) | 0.7 | |||
| 0 | 27 (27.0%) | 9 (36.0%) | 18 (24.0%) | |
| 1 | 35 (35.0%) | 7 (28.0%) | 28 (37.3%) | |
| 2 | 12 (12.0%) | 2 (8.0%) | 10 (13.3%) | |
| 3 | 16 (16.0%) | 4 (16.0%) | 12 (16.0%) | |
| 4 | 10 (10.0%) | 3 (12.0%) | 7 (9.3%) | |
| Steatosis grade (0/1/2/3) | 0.8 | |||
| 0 | 1 (1.0%) | 0 (0%) | 1 (1.3%) | |
| 1 | 34 (34.0%) | 8 (32.0% | 26 (34.7%) | |
| 2 | 40 (40.0%) | 12 (48.0%) | 28 (37.3%) | |
| 3 | 25 (25.0%) | 5 (20.0%) | 20 (26.7%) | 0.8 |
| Lobular inflammation (0/1/2/3) | ||||
| 0 | 0 (0%) | 0 (0%) | 0 (0%) | |
| 1 | 39 (39.0%) | 8 (32.0%) | 31 (41.3%) | |
| 2 | 56 (56.0%) | 16 (64.0%) | 40 (53.3%) | |
| 3 | 5 (5.0%) | 1 (4.0%) | 4 (5.3%) | |
| Ballooning grade (0/1/2) | 0.3 | |||
| 0 | 10 (10.0%) | 4 (16.0%) | 6 (8.0%) | |
| 1 | 56 (56.0%) | 11 (44.0%) | 45 (60.0%) | |
| 2 | 34 (34.0%) | 10 (40.0%) | 24 (32.0%) | |
| NAS | 5 (4–6) | 5 (4–6) | 5 (4–6) | 0.7 |
| MRI findings | ||||
| PDFF (%) | 14.2 (9.1–19.5) | 12.6 (9.3–18.0) | 14.4 (8.9–19.7) | 0.9 |
| Liver stiffness (kPa) | 2.92 (2.49–3.89) | 2.88 (2.35–3.89) | 2.99 (2.53–3.83) | 0.5 |
Data are shown in median (interquartile range).
MRI-PDFF response and non-response are defined as ≥ 30% relative decline and < 30% relative decline in MRI-PDFF.
NASH CRN histology scoring system is used.
P value indicates difference between patients with MRI-PDFF response and those with MRI-PDFF non-response.
BMI, body mass index; AST, aspartate aminotransferase; ALT, alanine aminotransferase; ALP, alkaline phosphatase, GGT, gamma glutamyl transferase; HDL, high-density lipoprotein; LDL, low-density lipoprotein; TG, triglycerides; HbA1c, hemoglobin A1c; NAS, nonalcoholic fatty liver disease activity score; MRI, magnetic resonance imaging; PDFF, proton density fat fraction
Factors associated with fibrosis regression
Association between fibrosis regression and baseline characteristics and changes in clinical and histological factors were examined (Table.2). Regarding a threshold of MRI-PDFF for fibrosis regression, a ≥ 25% relative decline in MRI-PDFF was selected by ROC analysis and Youden index in the study (area under the ROC: 0.59, 95% confidence interval [CI]: 0.44-0.75). When a ≥ 25% relative decline in MRI-PDFF was used for the fibrosis regression analysis, sensitivity, specificity, positive predictive value (PPV), and negative predictive value (NPV) were 45.0%, 81.1%, 47.4%, and 79.6%, respectively, and a ≥ 25% relative decline in MRI-PDFF was significantly associated with fibrosis regression (p = 0.03). When a ≥ 30% relative decline in MRI-PDFF was used for the analysis, sensitivity, specificity, PPV, and NPV of a ≥ 30% relative decline in MRI-PDFF for fibrosis regression were 40.0%, 84.9%, 50.0%, and 78.9%, respectively, and a ≥ 30% relative decline in MRI-PDFF was also significantly associated with fibrosis regression (p = 0.03). Furthermore, the positive likelihood ratio of and a ≥ 30% relative decline in MRI-PDFF for fibrosis regression was 2.65. Based on the results and previous reports, a ≥ 30% relative decline in MRI-PDFF was used for further analyses in this study. In univariable analysis, among baseline characteristics gamma-glutamyl transferase (GGT) level and liver stiffness by MRE was associated with fibrosis regression. Of the examined changes in clinical and histological factors, NAS response, MRI-PDFF response and an increase in platelet count were significantly associated with fibrosis regression. A ≥ 9.4% relative decline in liver stiffness by MRE was selected as an optimal threshold for fibrosis regression by ROC analysis, but a ≥ 9.4% relative decline in liver stiffness was not associated with fibrosis regression (OR: 0.51, 95% CI: 0.2–1.6, p = 0.2). In multivariable-adjusted logistic regression analysis (adjusted for age, gender, diabetes status, race/ethnicity, interval between biopsies, GGT, liver stiffness at baseline, and change in platelet count), NAS response was an independent predictor of fibrosis regression with multivariable-adjusted odds ratio (aOR) of 5.03 (95% CI: 1.2–21.6, p = 0.03). When evaluating MRI-PDFF response (adjusted for age, gender, diabetes status, race/ethnicity, interval between biopsies, GGT, liver stiffness at baseline, and change in platelet counts) as a non-invasive model, MRI-PDFF response was an independent predictor of fibrosis regression with aOR of 6.46 (95% CI: 1.1–37.0, p = 0.04, Figure.1).
Table.2.
Factors associated with ≥ 1 stage improvement in fibrosis stage
| Univariable analysis |
|||
|---|---|---|---|
| Odds ratio | 95%CI | p value | |
| Age (years) | 1.02 | 0.9–1.1 | 0.4 |
| Weight (kg) | 1.00 | 0.9–1.0 | 0.9 |
| BMI (kg/m2) | 0.99 | 0.9–1.1 | 0.8 |
| Gender (Women) | 0.80 | 0.3–2.4 | 0.7 |
| Race | |||
| Non-Hispanic | 1 | ||
| Hispanic | 0.87 | 0.3–2.5 | 0.8 |
| Diabetes mellitus (presence) | 1.24 | 0.4–3.5 | 0.7 |
| Hypertension (presence) | 0.92 | 0.3–2.6 | 0.9 |
| Presence of dyslipidemia (presence) | 1.07 | 0.4–3.0 | 0.9 |
| Interval between biopsies (years) |
1.14 | 0.8–1.6 | 0.5 |
| Clinical data at 1st biopsy |
|||
| AST per 40 IU/L | 1.04 | 0.7–1.6 | 0.9 |
| ALT per 40 IU/L | 0.89 | 0.6–1.3 | 0.5 |
| ALP per 40 IU/L | 0.40 | 0.1–1.1 | 0.09 |
| GGT per 40 IU/L | 0.38 | 0.2–0.9 | 0.03 |
| Bilirubin (mg/dl) | 0.89 | 0.2–5.3 | 0.9 |
| Total cholesterol (mg/dl) | 1.00 | 0.9–1.0 | 0.8 |
| HDL (mg/dl) | 1.00 | 0.9–1.0 | 0.9 |
| LDL (mg/dl) | 0.99 | 0.9–1.0 | 0.9 |
| TG (mg/dl) | 1.00 | 0.9–1.0 | 0.9 |
| Platelet count (109/L) | 1.00 | 0.9–1.0 | 0.7 |
| HbA1c (%) | 0.78 | 0.5–1.3 | 0.3 |
| Histological findings* | |||
| Fibrosis stage | 0.78 | 0.5–1.3 | 0.3 |
| NAS | 0.84 | 0.5–1.3 | 0.4 |
| Steatosis grade | 0.78 | 0.4–1.5 | 0.4 |
| Lobular inflammation | 1.04 | 0.4–2.6 | 0.9 |
| Ballooning grade | 0.68 | 0.3–1.6 | 0.4 |
| MRI findings | |||
| PDFF | 0.96 | 0.9–1.0 | 0.3 |
| Liver stiffness (kPa) |
0.39 | 0.2–0.8 | 0.008 |
| Time course change of clinical data |
|||
| Weight change ≥ 10% | 1.34 | 0.1–16 | 0.8 |
| AST per 10 IU/L | 0.93 | 0.8–1.0 | 0.2 |
| ALT per 10 IU/L | 0.97 | 0.9–1.1 | 0.6 |
| ALP per 10 IU/L | 1.15 | 0.8–1.7 | 0.5 |
| GGT per 10 IU/L | 1.05 | 0.9–1.2 | 0.5 |
| Bilirubin (mg/dl) | 1.70 | 0.2–16 | 0.6 |
| Total cholesterol (mg/dl) | 1.01 | 0.9–1.0 | 0.3 |
| HDL (mg/dl) | 1.02 | 0.9–1.1 | 0.6 |
| LDL (mg/dl) | 1.00 | 0.9–1.0 | 0.7 |
| TG (mg/dl) | 0.99 | 0.9–1.0 | 0.5 |
| Platelet count (109/L) | 1.03 | 1.0–1.1 | 0.007 |
| HbA1c (%) | 0.93 | 0.5–1.8 | 0.8 |
| Histological findings* | |||
| Presence of NAS response | 3.08 | 1.1–9.0 | 0.04 |
| Steatosis grade (per 1 point decrease) | 1.87 | 0.9–3.8 | 0.08 |
| Lobular inflammation (per 1 point decrease) | 1.55 | 0.8–3.1 | 0.2 |
| Ballooning grade (per 1 point decrease) | 2.36 | 1.1–5.1 | 0.03 |
| MRI findings | |||
| PDFF response (≥ 30% relative decline) | 3.75 | 1.2–12 | 0.03 |
| Liver stiffness (≥ 9.4% relative decline) | 0.51 | 0.2–1.6 | 0.2 |
NASH CRN histology scoring system is used.
NAS response is defined as ≥ 2 points improvement in NAS, with no worsening of fibrosis. MRI-PDFF response is defined as ≥ 30% relative decline in MRI-PDFF.
Bold characters indicate factors with p value < 0.05.
BMI, body mass index; AST, aspartate aminotransferase; ALT, alanine aminotransferase; ALP, alkaline phosphatase, GGT, gamma-glutamyl transferase; HDL, high-density lipoprotein; LDL, low-density lipoprotein; TG, triglycerides; HbA1c, hemoglobin A1c; NAS, nonalcoholic fatty liver disease activity score; MRI, magnetic resonance imaging; PDFF, proton density fat fraction; CI, confidence interval
Figure.1.
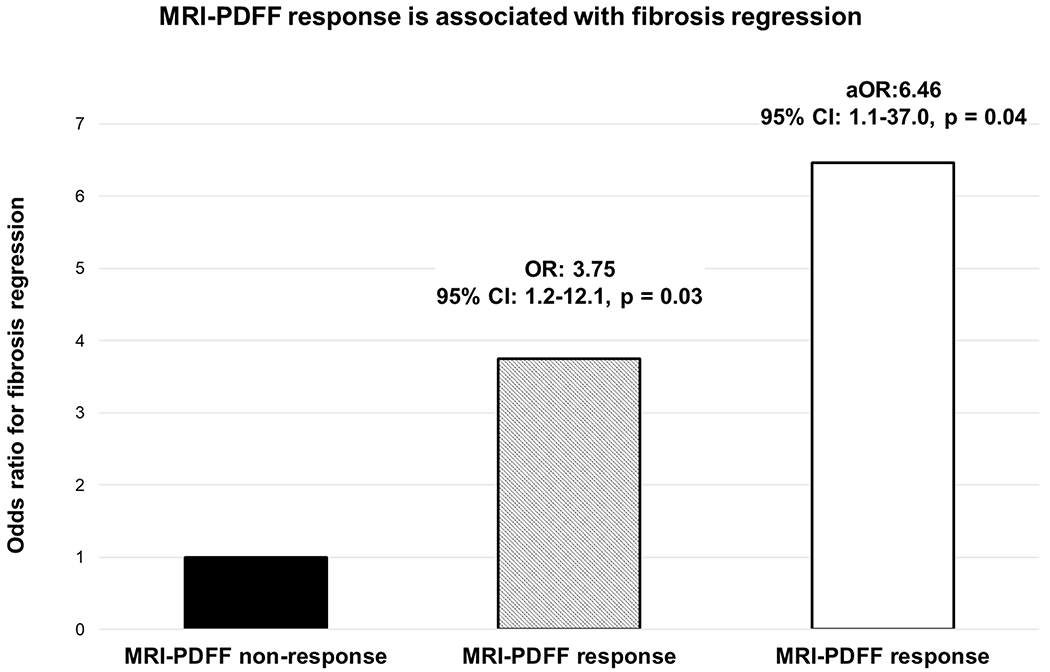
Odds ratio of MRI-PDFF response for fibrosis regression
MRI-PDFF response and non-response are defined as ≥ 30% relative decline and < 30% relative decline in MRI-PDFF.
Age, gender, diabetes status, race/ethnicity, interval between biopsies, gamma-glutamyl transferase, liver stiffness by magnetic resonance elastography and change in platelet count were adjusted in multivariable-adjusted logistic regression analysis.
OR, odds ratio; aOR, adjusted odds ratio; MRI, magnetic resonance imaging; PDFF, proton density fat fraction
Association between histological change and MRI-PDFF response (≥ 30% relative decline in MRI-PDFF)
The association between histological change and MRI-PDFF response was examined. The proportion of patients with MRI-PDFF response with fibrosis regression, fibrosis no change, and fibrosis progression were 40.0%, 24.6%, and 13.0%, respectively and the proportion of patients with MRI-PDFF response increased with fibrosis regression (p = 0.03, Figure.2A). When examined the association between change in NAS and MRI-PDFF response, the proportion of patients with MRI-PDFF response with change in NAS ≥−3, −2, −1, 0, 1, and 2 was 57.1%, 40.0%, 14.8%, 15.0%, 14.3%, and 0%, respectively. The proportion of patients with MRI-PDFF response increased in a dose dependent fashion with a decrease in NAS (p < 0.001, Figure.2B). In sensitivity analysis, a ≥ 30% relative decline in MRI-PDFF was associated with an interval decrease in steatosis grade. Furthermore, a ≥ 30% relative decline in MRI-PDFF was significantly associated with a NAS response with an OR of 4.75 (95% CI: 1.8–12, p = 0.001) and fibrosis regression with an OR of 3.75 (95%CI: 1.2–12, p = 0.03, Table.3).
Figure.2.


Association between MRI-PDFF response and histological response
(A) Association between MRI-PDFF response and change in fibrosis stage
(B)Association between MRI-PDFF response and change in NAS MRI-PDFF response is defined as ≥ 30% relative decline in MRI-PDFF.
MRI, magnetic resonance imaging; PDFF, proton density fat fraction; NAS, nonalcoholic fatty liver disease score
Table.3.
Association between histological response and ≥ 30% relative decline in MRI-PDFF
| Relative decline in MRI-PDFF | ≥ 30% vs < 30% relative decline in MRI-PDFF | ||||
|---|---|---|---|---|---|
|
| |||||
| Histologic response (≥ 1 point/stage decrease) | ≥ 30% (n = 25) | < 30% (n = 75) | Odds ratio | 95%CI | p value |
| Steatosis | 64% | 32% | 3.78 | 1.5-9.8 | 0.006 |
| Lobular inflammation | 44% | 24% | 2.49 | 0.9-6.4 | 0.06 |
| Ballooning | 56% | 41% | 1.81 | 0.7-4.5 | 0.2 |
| NAS response* | 60% | 24% | 4.75 | 1.8-12 | 0.001 |
| Fibrosis** | 50% | 21% | 3.75 | 1.2-12 | 0.03 |
NAS response is defined as ≥ 2 points improvement in NAS with no worsening of fibrosis.
Fibrosis response limits to patients with fibrosis stage 1-4 at baseline.
MRI, magnetic resonance imaging; PDFF, proton density fat fraction; NAS, nonalcoholic fatty liver disease activity score; CI, confidence interval
Discussion
Main findings
This study demonstrated that MRI-PDFF response as defined as a ≥ 30% relative decline in MRI-PDFF was significantly associated with six times higher odds of ≥ 1 stage improvement in liver fibrosis using the NASH CRN Histologic Scoring System. Liver fibrosis is an important factor that is strongly associated with the development of liver-related complications in NAFLD patients4–6, and improvement of liver fibrosis is an important endpoint in NASH trials. The non-invasive assessment of improvement in fibrosis is a critical unmet need and this study demonstrates that MRI-PDFF may be useful as a non-invasive method for assessing fibrosis regression in NASH trials. Fibrosis improvement is set as an endpoint in clinical trials35,36, and the findings in this study support the use of a ≥ 30% relative decline in MRI-PDFF as a potential treatment response criteria and a trial endpoint for both phase 2A and 2B clinical trials.
Context with published literature
Recent advances have made it possible to quantitatively evaluate liver fat37–39. MRI-PDFF has been established as the most accurate non-invasive method to assess liver fat14,15. It has been reported that changes in aspartate aminotransferase, alanine aminotransferase, and GGT levels are associated with change in MRI-PDFF and change in MRI-PDFF was more sensitive than change in histological steatosis grade in quantifying change in liver fat content16. Changes in MRI-PDFF have also been reported to correlate with improvements in histological steatosis changes40,41. These results indicate the value of using an accurate quantitative biomarker of hepatic steatosis, MRI-PDFF, over semi-quantitative ordinal categories of steatosis on liver biopsy. MRI-PDFF is better than histology in assessing quantitative changes in liver fat in the setting of clinical trials.
Regarding the association between change in MRI-PDFF and NAS response, two independent studies have identified the same optimal cutoff (≥30%) for MRI-PDFF decline to predict NAS response22,23. A recent meta-analysis of seven trials including 346 subjects showed that MRI-PDFF response as defined as a ≥ 30% relative decline in MRI-PDFF was associated with significantly higher odds of ≥ 2 point improvement in NAS25. However, there is no established data that demonstrated a significant association between change in MRI-PDFF and fibrosis regression in previous studies. The meta-analysis that showed the significant association between MRI-PDFF response and NAS response did not have the data to examine the association between MRI-PDFF response and fibrosis regression as the seven treatment trials that were included in the meta-analysis did not require patients enrolled in the trials to have fibrosis at baseline. This present study provides new evidence linking MRI-PDFF response and its association with ≥ 1 stage improvement in fibrosis stage in patients with NAFLD.
This study also proved the significant association between MRI-PDFF response and NAS response. Furthermore, recent studies demonstrated NAS response is associated with fibrosis regression 42,43. These findings espouse our new finding that a ≥ 30% relative decline in MRI-PDFF is associated with fibrosis regression.
Regarding the association between change in liver stiffness by MRE and fibrosis regression, no significant association was noted. Compared to the previous study that demonstrated the significant association between change in liver stiffness and fibrosis regression24, the baseline liver stiffness by MRE was lower in this study. Therefore, this study lacks the sensitivity to show improvements in MRE. We believe that a baseline MRE ≥ 3.3 kPa (indicating fibrosis stage ≥2) would be needed to then start seeing improvement and the number of patients with MRE ≥ 3.3 kPa is too small in this study to document regression of fibrosis to make meaningful conclusions from this study regarding MRE44. Furthermore, liver stiffness reflects liver fibrosis which is the accumulation of collagen fiber and elastic fiber45. Since the accumulation of elastin fiber could cause the irreversibility of liver fibrosis, the amelioration of fibers may take longer than morphological change as assessed by liver biopsy46. To evaluate the clinical significance of change in liver stiffness by MRE, especially decline in liver stiffness and fibrosis regression, a further long-term observation study with a large number of high liver stiffness patients is necessary.
Strengths and limitations
The strengths of the study are that this study enrolled prospectively recruited well-characterized NAFLD patients. All participants underwent a systematic and standardized liver disease assessment, and other causes of liver disease were systematically excluded. In addition, the number of patients was sufficient to verify the significance of ≥ 30% relative decline in MRI-PDFF. Baseline characteristics between patients with MRI-PDFF response and those with MRI-PDFF non-response were similar. This study population is representative of a tertiary care referral center where patients were offered participation into clinical trials as well as natural history follow-up providing a more generalizable and realistic estimate of these findings. The interval between biopsies in this study is 1.5 years, therefore, these data need to be validated over 5-10 years of follow-up. Furthermore, this proof-of-concept study needs to be validated in the setting of a treatment trial to better understand the diagnostic test characteristics of a ≥ 30% relative decline in MRI-PDFF and fibrosis improvement in NASH.
Future implications
This study demonstrated that ≥ 30% relative decline in MRI-PDFF was associated with fibrosis regression in NAFLD. A ≥ 30% relative decline in MRI-PDFF may be used as a therapeutic target in clinical trials and, if validated, in NAFLD management in future. Liver biopsy is currently the golden standard for assessing therapeutic efficacy, but repeated assessment is difficult. Identification of a non-invasive method for evaluating therapeutic effect has been a challenge in NAFLD clinical practice, and the results of this study suggest that ≥ 30% relative decline in MRI-PDFF can be used as a potential surrogate marker for evaluating therapeutic effect in a NASH trial. The clinical significance of a ≥ 30% relative decline in MRI-PDFF may be influenced in either direction based upon the mechanism of action of a drug. A ≥ 30% relative decline in MRI-PDFF may be useful in assessing treatment response with agents that have a strong anti-steatotic mechanism of action, but the number of patients of each drug is limited to analysis in subgroups, and this requires further investigation in comparative efficacy studies. Furthermore, observation periods may influence fibrosis regression and this point also needs further investigation. The ultimate goal of treatment in patients with NASH related fibrosis is to prevent progression to cirrhosis, and reduction in hepatic decompensation, liver-related mortality and all-cause mortality. It is still unclear whether a ≥ 30% relative decline in MRI-PDFF is associated with reduced progression to cirrhosis, and reduction in hepatic decompensation, liver-related mortality and all-cause mortality. Therefore, large, multicenter, prospective studies are needed to validate the association between a ≥ 30% relative decline in MRI-PDFF and fibrosis regression or prognosis.
In summary, a ≥ 30% relative decline in MRI-PDFF is associated with fibrosis regression. Hence, ≥ 30% reduction in MRI-PDFF in early phase trials can provide a useful estimate of odds of ≥ 1 stage improvement in fibrosis. These data may be helpful in sample-size estimation in NASH trials.
Significance of this study.
What is already known about this subject?
Emerging data suggest that a 30% relative decline in liver fat as assessed by magnetic resonance imaging-proton density fat fraction (MRI-PDFF) may be associated with Nonalcoholic fatty liver disease (NAFLD) Activity Score improvement.
Liver fibrosis is the most important factor associated with the prognosis and liver-related complications in NAFLD and improvement in liver fibrosis is an important endpoint in nonalcoholic steatohepatitis (NASH) clinical trials, but the association between decline in MRI-PDFF and fibrosis regression is not known.
What are the new findings?
MRI-PDFF response (≥ 30% relative decline in MRI-PDFF) was an independent predictor of fibrosis regression with adjusted odds ratio of 6.46.
How might impact on clinical practice in the foreseeable future?
MRI-PDFF response defined as a ≥ 30% relative decline in MRI-PDFF is associated with ≥ 1 stage improvement in fibrosis and may be used as a surrogate marker for fibrosis regression in early phase clinical trials for NASH.
Funding:
Rohit Loomba received funding support from NIEHS (5P42ES010337), NCATS (5UL1TR001442), DOD PRCRP (W81XWH-18-2-0026), NIDDK (U01DK061734, R01DK106419, R01DK121378, R01DK124318, P30DK120515), NHLBI (P01HL147835), and NIAAA (U01AA029019). Veeral Ajmera received funding support from NIDDK (K23DK119460). Nobuharu Tamaki received funding support from the Uehara Memorial Foundation (201940021).
Conflict of interests:
Rohit Loomba serves as a consultant or advisory board member for Anylam/Regeneron, Arrowhead Pharmaceuticals, AstraZeneca, Bird Rock Bio, Boehringer Ingelheim, Bristol-Myer Squibb, Celgene, Cirius, CohBar, Conatus, Eli Lilly, Galmed, Gemphire, Gilead, Glympse bio, GNI, GRI Bio, Inipharm, Intercept, Ionis, Janssen Inc., Merck, Metacrine, Inc., NGM Biopharmaceuticals, Novartis, Novo Nordisk, Pfizer, Prometheus, Promethera, Sanofi, Siemens, and Viking Therapeutics. In addition, his institution has received grant support from Allergan, Boehringer-Ingelheim, Bristol-Myers Squibb, Cirius, Eli Lilly and Company, Galectin Therapeutics, Galmed Pharmaceuticals, GE, Genfit, Gilead, Intercept, Grail, Janssen, Madrigal Pharmaceuticals, Merck, NGM Biopharmaceuticals, NuSirt, Pfizer, pH Pharma, Prometheus, and Siemens. He is also co-founder of Liponexus, Inc. Claude B. Sirlin reports grants from GE, Siemens, Philips, Bayer, Gilead; personal consultation fees from Blade, Boehringer, and Epigenomics; consultation under the auspices of the University to AMRA, BMS, Exact Sciences, GE Digital, and IBM-Watson; lab service agreements from Enanta, Gilead, ICON, Intercept, Nusirt, Shire, Synageva, Takeda; royalties or honoraria from Wolters Kluwer and Medscape, respectively, for educational material outside the submitted work. The other authors disclose no conflicts.
Abbreviations:
- NAFLD
nonalcoholic fatty liver disease
- NAS
Nonalcoholic fatty liver disease Activity Score
- MRI
magnetic resonance imaging
- PDFF
proton density fat fraction
- NASH
nonalcoholic steatohepatitis
- UCSD
University of California San Diego
- OR
odds ratio
- BMI
body mass index
- GGT
gamma-glutamyl transferase
- aOR
adjusted odds ratio
- CI
confidence interval
- IQR
interquartile range
- PPV
positive predictive value
- NPV
negative predictive value
Footnotes
Publisher's Disclaimer: Disclaimer: The content is solely the responsibility of the authors and does not necessarily represent the official views of the National Institutes of Health.
Patient consent for publication: Not required
Patient and public involvement: Patients and/or the public were not involved in the design, or conduct, or reporting, or dissemination plans of this research.
Ethics approval: The study was approved by the University of California San Diego Institutional Review Board (Approval Number: 111298).
Data availability statement:
All data relevant to the study are included in the article. Data details can be provided upon request to credible investigators on verification for patient confidentiality.
References
- 1.Younossi ZM. Non-alcoholic fatty liver disease - A global public health perspective. J Hepatol 2019;70:531–44. [DOI] [PubMed] [Google Scholar]
- 2.Loomba R, Sanyal AJ. The global NAFLD epidemic. Nat Rev Gastroenterol Hepatol 2013;10:686–90. [DOI] [PubMed] [Google Scholar]
- 3.Li J, Zou B, Yeo YH, et al. Prevalence, incidence, and outcome of non-alcoholic fatty liver disease in Asia, 1999-2019: a systematic review and meta-analysis. Lancet Gastroenterol Hepatol 2019;4:389–98. [DOI] [PubMed] [Google Scholar]
- 4.Dulai PS, Singh S, Patel J, et al. Increased risk of mortality by fibrosis stage in nonalcoholic fatty liver disease: Systematic review and meta-analysis. Hepatology 2017;65:1557–65. [DOI] [PMC free article] [PubMed] [Google Scholar]
- 5.Ekstedt M, Hagström H, Nasr P, et al. Fibrosis stage is the strongest predictor for disease-specific mortality in NAFLD after up to 33 years of follow-up. Hepatology 2015;61:1547–54. [DOI] [PubMed] [Google Scholar]
- 6.Hagström H, Nasr P, Ekstedt M, et al. Fibrosis stage but not NASH predicts mortality and time to development of severe liver disease in biopsy-proven NAFLD. J Hepatol 2017;67:1265–73. [DOI] [PubMed] [Google Scholar]
- 7.Kleiner DE, Brunt EM, Van Natta M, et al. Design and validation of a histological scoring system for nonalcoholic fatty liver disease. Hepatology 2005;41:1313–21. [DOI] [PubMed] [Google Scholar]
- 8.Regev A, Berho M, Jeffers LJ, et al. Sampling error and intraobserver variation in liver biopsy in patients with chronic HCV infection. Am J Gastroenterol 2002;97:2614–8. [DOI] [PubMed] [Google Scholar]
- 9.Kuwashiro T, Takahashi H, Hyogo H, et al. Discordant pathological diagnosis of non-alcoholic fatty liver disease: A prospective multicenter study. JGH Open 2020;4:497–502. [DOI] [PMC free article] [PubMed] [Google Scholar]
- 10.Davison BA, Harrison SA, Cotter G, et al. Suboptimal reliability of liver biopsy evaluation has implications for randomized clinical trials. J Hepatol 2020;28:30399–8. [DOI] [PubMed] [Google Scholar]
- 11.Permutt Z, Le TA, Peterson MR, et al. Correlation between liver histology and novel magnetic resonance imaging in adult patients with non-alcoholic fatty liver disease - MRI accurately quantifies hepatic steatosis in NAFLD. Aliment Pharmacol Ther 2012;36:22–9. [DOI] [PMC free article] [PubMed] [Google Scholar]
- 12.Caussy C, Reeder SB, Sirlin CB, et al. Noninvasive, Quantitative Assessment of Liver Fat by MRI-PDFF as an Endpoint in NASH Trials. Hepatology 2018;68:763–72. [DOI] [PMC free article] [PubMed] [Google Scholar]
- 13.Imajo K, Kessoku T, Honda Y, et al. Magnetic Resonance Imaging More Accurately Classifies Steatosis and Fibrosis in Patients With Nonalcoholic Fatty Liver Disease Than Transient Elastography. Gastroenterology 2016;150:626–37 e7. [DOI] [PubMed] [Google Scholar]
- 14.Park CC, Nguyen P, Hernandez C, et al. Magnetic Resonance Elastography vs Transient Elastography in Detection of Fibrosis and Noninvasive Measurement of Steatosis in Patients With Biopsy-Proven Nonalcoholic Fatty Liver Disease. Gastroenterology 2017;152:598–607 e2. [DOI] [PMC free article] [PubMed] [Google Scholar]
- 15.Castera L, Friedrich-Rust M, Loomba R. Noninvasive Assessment of Liver Disease in Patients With Nonalcoholic Fatty Liver Disease. Gastroenterology 2019;156:1264–81 e4. [DOI] [PMC free article] [PubMed] [Google Scholar]
- 16.Noureddin M, Lam J, Peterson MR, et al. Utility of magnetic resonance imaging versus histology for quantifying changes in liver fat in nonalcoholic fatty liver disease trials. Hepatology 2013;58:1930–40. [DOI] [PMC free article] [PubMed] [Google Scholar]
- 17.Le TA, Chen J, Changchien C, et al. Effect of colesevelam on liver fat quantified by magnetic resonance in nonalcoholic steatohepatitis: a randomized controlled trial. Hepatology 2012;56:922–32. [DOI] [PMC free article] [PubMed] [Google Scholar]
- 18.Loomba R, Sirlin CB, Ang B, et al. Ezetimibe for the treatment of nonalcoholic steatohepatitis: assessment by novel magnetic resonance imaging and magnetic resonance elastography in a randomized trial (MOZART trial). Hepatology 2015;61:1239–50. [DOI] [PMC free article] [PubMed] [Google Scholar]
- 19.Loomba R, Morgan E, Watts L, et al. Novel antisense inhibition of diacylglycerol O-acyltransferase 2 for treatment of non-alcoholic fatty liver disease: a multicentre, double-blind, randomised, placebo-controlled phase 2 trial. Lancet Gastroenterol Hepatol 2020;5:829–38. [DOI] [PubMed] [Google Scholar]
- 20.Loomba R MRI-PDFF treatment response criteria in nonalcoholic steatohepatitis. Hepatology 2020. [DOI] [PMC free article] [PubMed] [Google Scholar]
- 21.Loomba R, Lawitz E, Mantry PS, et al. The ASK1 inhibitor selonsertib in patients with nonalcoholic steatohepatitis: A randomized, phase 2 trial. Hepatology 2018;67:549–59. [DOI] [PMC free article] [PubMed] [Google Scholar]
- 22.Loomba R, Neuschwander-Tetri BA, Sanyal A, et al. Multicenter validation of association between decline in MRI-PDFF and histologic response in nonalcoholic steatohepatitis. Hepatology 2020;21:31121. [DOI] [PMC free article] [PubMed] [Google Scholar]
- 23.Patel J, Bettencourt R, Cui J, et al. Association of noninvasive quantitative decline in liver fat content on MRI with histologic response in nonalcoholic steatohepatitis. Therap Adv Gastroenterol 2016;9:692–701. [DOI] [PMC free article] [PubMed] [Google Scholar]
- 24.Jayakumar S, Middleton MS, Lawitz EJ, et al. Longitudinal correlations between MRE, MRI-PDFF, and liver histology in patients with non-alcoholic steatohepatitis: Analysis of data from a phase II trial of selonsertib. J Hepatol 2019;70:133–41. [DOI] [PubMed] [Google Scholar]
- 25.Stine JG, Munaganuru N, Barnard A, et al. Change in MRI-PDFF and Histologic Response in Patients with Nonalcoholic Steatohepatitis: A Systematic Review and Meta-Analysis. Clin Gastroenterol Hepatol 2020;31:31220–9. [DOI] [PMC free article] [PubMed] [Google Scholar]
- 26.Tang A, Desai A, Hamilton G, et al. Accuracy of MR imaging-estimated proton density fat fraction for classification of dichotomized histologic steatosis grades in nonalcoholic fatty liver disease. Radiology 2015;274:416–25. [DOI] [PMC free article] [PubMed] [Google Scholar]
- 27.Tang A, Tan J, Sun M, et al. Nonalcoholic fatty liver disease: MR imaging of liver proton density fat fraction to assess hepatic steatosis. Radiology 2013;267:422–31. [DOI] [PMC free article] [PubMed] [Google Scholar]
- 28.Caussy C, Soni M, Cui J, et al. Nonalcoholic fatty liver disease with cirrhosis increases familial risk for advanced fibrosis. J Clin Invest 2017;127:2697–704. [DOI] [PMC free article] [PubMed] [Google Scholar]
- 29.Singh S, Allen AM, Wang Z, et al. Fibrosis progression in nonalcoholic fatty liver vs nonalcoholic steatohepatitis: a systematic review and meta-analysis of paired-biopsy studies. Clin Gastroenterol Hepatol 2015;13:643–54 e1–9; quiz e39-40. [DOI] [PMC free article] [PubMed] [Google Scholar]
- 30.Kanda Y Investigation of the freely available easy-to-use software ‘EZR’ for medical statistics. Bone Marrow Transplant 2013;48:452–8. [DOI] [PMC free article] [PubMed] [Google Scholar]
- 31.Cui J, Philo L, Nguyen P, et al. Sitagliptin vs. placebo for non-alcoholic fatty liver disease: A randomized controlled trial. J Hepatol 2016;65:369–76. [DOI] [PMC free article] [PubMed] [Google Scholar]
- 32.Ratziu V, Sanyal A, Harrison SA, et al. Cenicriviroc Treatment for Adults With Nonalcoholic Steatohepatitis and Fibrosis: Final Analysis of the Phase 2b CENTAUR Study. Hepatology 2020;72:892–905. [DOI] [PubMed] [Google Scholar]
- 33.Younossi ZM, Ratziu V, Loomba R, et al. Obeticholic acid for the treatment of non-alcoholic steatohepatitis: interim analysis from a multicentre, randomised, placebo-controlled phase 3 trial. Lancet 2019;394:2184–96. [DOI] [PubMed] [Google Scholar]
- 34.Safadi R, Konikoff FM, Mahamid M, et al. The fatty acid-bile acid conjugate Aramchol reduces liver fat content in patients with nonalcoholic fatty liver disease. Clin Gastroenterol Hepatol 2014;12:2085–91.e1. [DOI] [PubMed] [Google Scholar]
- 35.Neuschwander-Tetri BA, Loomba R, Sanyal AJ, et al. Farnesoid X nuclear receptor ligand obeticholic acid for non-cirrhotic, non-alcoholic steatohepatitis (FLINT): a multicentre, randomised, placebo-controlled trial. Lancet 2015;385:956–65. [DOI] [PMC free article] [PubMed] [Google Scholar]
- 36.Friedman SL, Ratziu V, Harrison SA, et al. A randomized, placebo-controlled trial of cenicriviroc for treatment of nonalcoholic steatohepatitis with fibrosis. Hepatology 2018;67:1754–67. [DOI] [PMC free article] [PubMed] [Google Scholar]
- 37.Tamaki N, Koizumi Y, Hirooka M, et al. Novel quantitative assessment system of liver steatosis using a newly developed attenuation measurement method. Hepatol Res 2018;48:821–8. [DOI] [PubMed] [Google Scholar]
- 38.Koizumi Y, Hirooka M, Tamaki N, et al. New diagnostic technique to evaluate hepatic steatosis using the attenuation coefficient on ultrasound B mode. PLoS One 2019;14:e0221548. [DOI] [PMC free article] [PubMed] [Google Scholar]
- 39.Han A, Byra M, Heba E, et al. Noninvasive Diagnosis of Nonalcoholic Fatty Liver Disease and Quantification of Liver Fat with Radiofrequency Ultrasound Data Using One-dimensional Convolutional Neural Networks. Radiology 2020;295:342–50. [DOI] [PMC free article] [PubMed] [Google Scholar]
- 40.Middleton MS, Van Natta ML, Heba ER, et al. Diagnostic accuracy of magnetic resonance imaging hepatic proton density fat fraction in pediatric nonalcoholic fatty liver disease. Hepatology 2018;67:858–72. [DOI] [PMC free article] [PubMed] [Google Scholar]
- 41.Middleton MS, Heba ER, Hooker CA, et al. Agreement Between Magnetic Resonance Imaging Proton Density Fat Fraction Measurements and Pathologist-Assigned Steatosis Grades of Liver Biopsies From Adults With Nonalcoholic Steatohepatitis. Gastroenterology 2017;153:753–61. [DOI] [PMC free article] [PubMed] [Google Scholar]
- 42.Kleiner DE, Brunt EM, Wilson LA, et al. Association of Histologic Disease Activity With Progression of Nonalcoholic Fatty Liver Disease. JAMA Netw Open 2019;2:e1912565. [DOI] [PMC free article] [PubMed] [Google Scholar]
- 43.Tamaki N, Munaganuru N, Jung J, et al. Clinical utility of change in nonalcoholic fatty liver disease activity score and change in fibrosis in NAFLD. Clin Gastroenterol Hepatol 2020. [DOI] [PMC free article] [PubMed] [Google Scholar]
- 44.Jung J, Loomba RR, Imajo K, et al. MRE combined with FIB-4 (MEFIB) index in detection of candidates for pharmacological treatment of NASH-related fibrosis. Gut 2020. [DOI] [PMC free article] [PubMed] [Google Scholar]
- 45.Yasui Y, Abe T, Kurosaki M, et al. Non-invasive liver fibrosis assessment correlates with collagen and elastic fiber quantity in patients with hepatitis C virus infection. Hepatol Res 2019;49:33–41. [DOI] [PubMed] [Google Scholar]
- 46.Kanta J Elastin in the Liver. Front Physiol 2016;7:491. [DOI] [PMC free article] [PubMed] [Google Scholar]
Associated Data
This section collects any data citations, data availability statements, or supplementary materials included in this article.
Data Availability Statement
All data relevant to the study are included in the article. Data details can be provided upon request to credible investigators on verification for patient confidentiality.