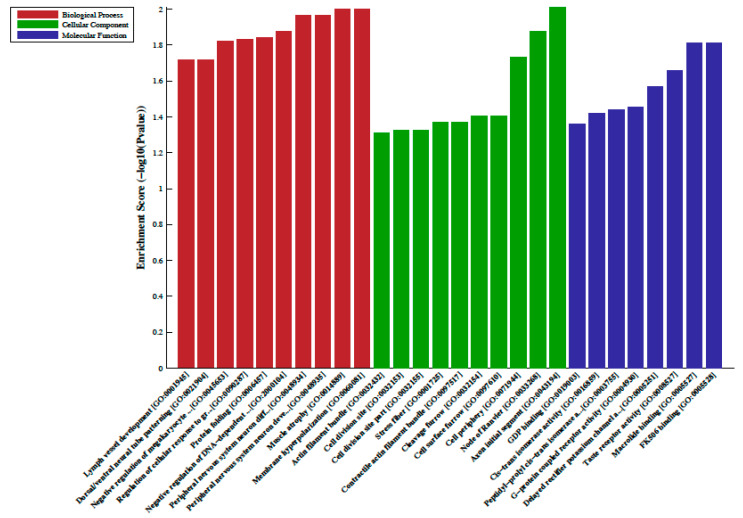
Figure 1.
Gene ontology (GO) enrichment analysis of the differentially hypermethylated genes in metformin-treated diabetes. The bar plot shows the top ten enrichment score values of the significant enrichment terms. Enriched GO terms were categorized into biological processes, cellular components, and molecular function. Data are presented as enriched scores expressed as −log10 (p value).

