Abstract
A potentially curative hepatic resection is the optimal treatment for hepatocellular carcinoma (HCC), but most patients are not candidates for resection and most resected HCCs eventually recur. Until recently, neoadjuvant systemic therapy for HCC has been limited by a lack of effective systemic agents. Here, in a single arm phase 1b study, we evaluated the feasibility of neoadjuvant cabozantinib and nivolumab in patients with HCC including patients outside of traditional resection criteria (NCT03299946). Of 15 patients enrolled, 12 (80%) underwent successful margin negative resection, and 5/12 (42%) patients had major pathologic responses. In-depth biospecimen profiling demonstrated an enrichment in T effector cells, as well as tertiary lymphoid structures, CD138+ plasma cells, and a distinct spatial arrangement of B cells in responders as compared to non-responders, indicating an orchestrated B-cell contribution to antitumor immunity in HCC.
Introduction
Hepatocellular carcinoma (HCC) constitutes more than 90% of all primary liver cancers, and usually develops in the setting of chronic liver disease including alcohol, chronic viral hepatitis (B or C), and non-alcoholic fatty liver disease. HCC is the fourth leading cause of cancer-related death, and the death rate is rising in the United States and in many other parts of the world1–3. Most HCC is unresectable at presentation as a result of extrahepatic extension, inadequate functional hepatic reserve, anatomical constraints removing the primary tumor, or gross invasion of the portal or hepatic veins4,5. Globally, less than 30% of HCCs are resectable at the time of diagnosis, and many are also outside of criteria for liver transplantation6,7. Even among the subset of patients who undergo a potentially curative partial hepatectomy, long-term disease-free survival is poor with recurrence rates of 54–100% in historical series of patients receiving a partial hepatectomy with curative intent for HCC8–10. The majority of recurrences (~80%) are intrahepatic. Since negative margins are usually observed at the time of surgical resection, it is believed that HCC recurrence often occurs because of micrometastasis that persist after resection. Perioperative strategies that can reduce the burden of micrometastatic disease have the potential to improve outcomes in this disease.
For some cancers, neoadjuvant therapeutic strategies can reduce tumor volume allowing patients with locally advanced or unresectable cancers to obtain secondary resectability. However, the use of perioperative therapy in HCC patients has been hampered by a lack of any effective therapies in general for this disease, and no systemic therapy is approved for neoadjuvant or adjuvant use in HCC. Until recently, sorafenib was the only FDA-approved systemic therapy, but it has a response rate of less than 10% thereby limiting its utility as a neoadjuvant approach11, and it provides no benefit in the adjuvant setting12. Several different forms of locoregional therapy including transarterial chemoembolization (TACE) have been investigated in the neoadjuvant setting, but these studies have generally failed to show evidence of clinical benefit13–17. Given the recent approval for several systemic therapeutic agents in HCC18, reassessing the potential role of neoadjuvant therapy in the treatment of HCC is warranted.
Cabozantinib and nivolumab are systemic therapies that are used as monotherapy in the treatment of advanced HCC. Cabozantinib is a multi-kinase inhibitor of VEGF receptor (VEGFR)-2, AXL, and c-MET20. Nivolumab is an inhibitory antibody against the immune checkpoint programmed cell death protein 1 (PD-1)19. Recently, multiple combinations of VEGF-targeted therapies and PD-(L)1 therapies have been evaluated in HCC21 and other cancer types22. Most notably, the combination of bevacizumab (anti-VEGF) and atezolizumab (anti-PD-L1) together yielded an objective response rate (ORR) of 27.5% in a global phase 3 trial of advanced HCC23, suggesting the potential for synergy between these modalities. Cabozantinib and nivolumab have been combined previously and have shown clinically meaningful responses and acceptable toxicities in patients with HCC24. Thus, cabozantinib and nivolumab provide a rationale initial combination with which to test the utility of neoadjuvant therapy for borderline resectable or locally advanced HCC.
In this study, we treated patients with HCC that included patients outside of traditional criteria for upfront resection (referred throughout as borderline or locally advanced HCC) with the combination of cabozantinib and nivolumab. The goal was to investigate the feasibility of neoadjuvant therapy to obtain secondary resectability and elucidate both systemic and local immune responses to this combination. We leveraged serially obtained peripheral blood specimens and core liver biopsies to evaluate the effects of cabozantinib alone, which is administered for 2 weeks prior to adding nivolumab, followed by an in-depth profiling of the immune tumor microenvironment (TME) in the surgically resected samples. We conducted multiplex immunohistochemistry, suspension mass cytometry (CyTOF®), and Imaging Mass Cytometry™ (IMC™) to identify potential determinants of response.
Results
Clinical responses to neoadjuvant cabozantinib and nivolumab
Patient characteristics
From April, 2018 until September, 2019, we enrolled 15 patients through the Liver Cancer Multidisciplinary Clinic at the Johns Hopkins Sidney Kimmel Comprehensive Cancer Center in Baltimore, MD. Baseline demographic and disease characteristics are shown in Supplementary Table 1. All patients had disease for which upfront surgical resection was not recommended at the time of multidisciplinary evaluation, due to the presence of high risk tumor features that historically predict poor outcomes with upfront surgical resection4,5. Notable tumor features of the enrolled patient population included multinodular disease (n=6, 40%), portal vein invasion (n=4, 27%), infiltrative disease (n=9, 60%), and tumor diameter over 10 cm (n=6, 40%); these patients were also not candidates for liver transplantation. In most cases patients were offered palliative locoregional therapies or systemic therapy with lenvatinib or sorafenib as alternatives to the study.
Feasibility and safety
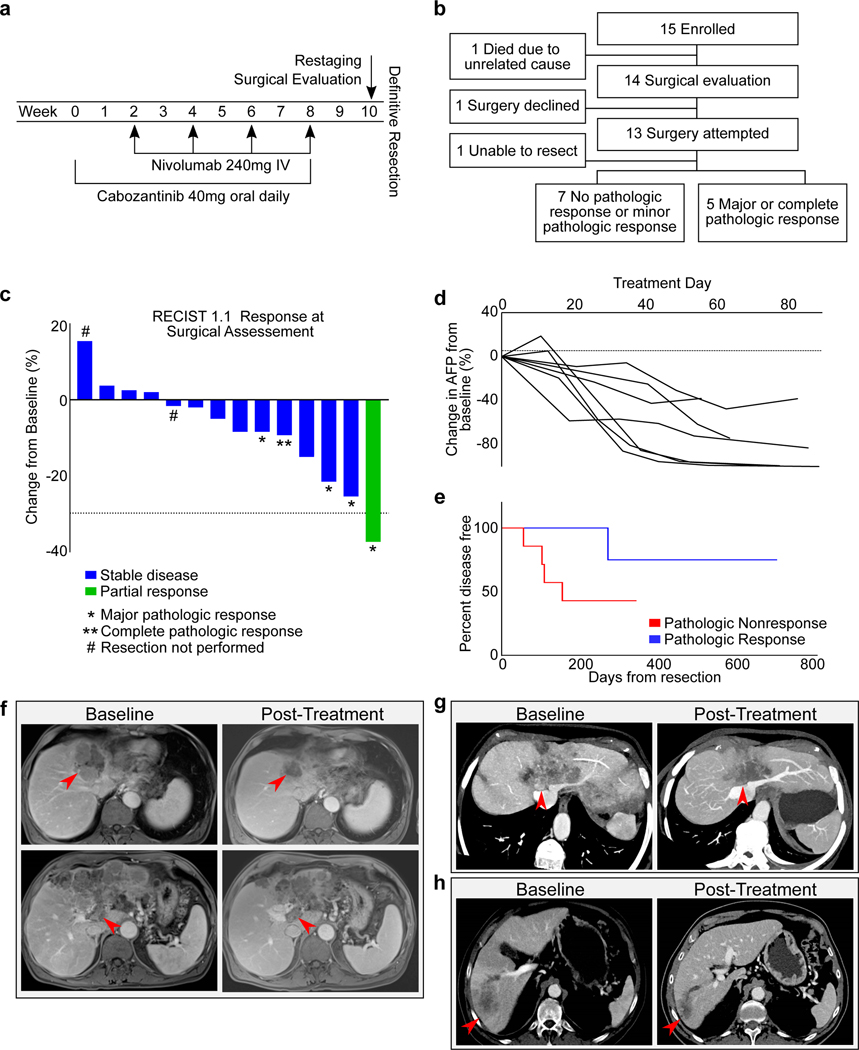
All enrolled patients were assigned to receive neoadjuvant cabozantinib in combination with nivolumab (Fig. 1a). The study met its primary feasibility endpoint, with no patients experiencing a treatment-related adverse event that precluded continuing on to surgery within 60 days of the planned date for surgical evaluation, as defined in the protocol (95% CI: 0, 0.19). One patient died early in the course of study therapy and prior to surgical evaluation; however, the cause of death was biliary sepsis, unrelated to study treatment (Fig. 1b).
Figure 1.
Clinical responses to neoadjuvant cabozantinib and nivolumab. a, Study schema. b, Flowchart of outcomes. Of the 15 patients with borderline resectable or locally advanced HCC, 12 underwent a margin negative resection. c, The change from baseline in the target lesion diameter according to Response Evaluation Criteria in Solid Tumors (RECIST), version 1.1, for all evaluable patients (n=14 patients) following neoadjuvant therapy. *, major pathologic response; **, complete pathologic response; # resection not performed. d, Change in AFP tumor marker for all patients with an elevated AFP at baseline (n=7 patients). e, Disease free survival (DFS) for all patients (n=12 patients) undergoing resection, stratified by pathologic response. All responders had DFS >233 days, whereas 4/7 nonresponders developed early progression between 56 and 155 days. f, A 69 year-old male with a multinodular and infiltrative HCC with portal vein (PV) tumor thrombus, having progressed after prior TACE therapy. Pre-treatment MRI shows the tumor occluding middle hepatic vein (HV), left HV, left portal pedicle (PP), and abutting the cava, right HVs, and right PP. With neoadjuvant therapy, the tumor no longer abutted the right HV/PP, the PV was less distended, and the tumor thrombus was not enhancing. AFP declined from 106,732 to 806.9 (>99% reduction). The patient had a margin negative extended left hepatectomy and remains without recurrence with a normal AFP >1 year from resection. g, Multiplanar reconstruction of baseline and post-treatment imaging for a 75 year-old female with a multinodular and infiltrative HCC. At baseline, the tumor occluded middle and left HVs with abutment of cava, right HV confluence, and left and right PPs. After neoadjuvant therapy, the tumor no longer enhanced, was less involved at the cava and the right HV/PP, enabling a margin negative resection. The patient remains without disease recurrence at 2 years from resection. h, Multiplanar reconstruction of baseline and post-treatment imaging of a 71 year-old male with an infiltrative HCC with a satellite lesion and extensive PV tumor thrombus. With treatment, the AFP declined from >30,000 to 12.9 (>99% reduction) and demonstrated a partial response by RECIST 1.1. The patient remains without disease recurrence >2 years from resection.
The safety and tolerability of cabozantinib and nivolumab in the 8-week neoadjuvant treatment period were generally consistent with the toxicity profile of the two individual drugs, and with the prior experience of this combination in HCC24. Treatment-related adverse events are shown in Supplementary Table 2. Treatment-related adverse events of any grade occurred in 14/15 patients (93.3%), and grade 3 or higher treatment-related adverse events occurred in 2 patients (13.3%). The most common treatment-related adverse events were nausea, vomiting, and fatigue. Severe treatment-related adverse events included a case of myasthenia gravis and a case of autoimmune hepatitis, both attributable to nivolumab. Both severe adverse events improved with immunosuppression to ≤ grade 1 before the planned surgical evaluation. Transient dose interruptions of cabozantinib due to treatment-related adverse events occurred in 6 patients (40%), and 2 patients (13%) required dose reductions. The most common cause of cabozantinib dose interruption or reduction was grade 1–2 gastrointestinal complaints (diarrhea, nausea, anorexia). Dosing of nivolumab was held due to treatment-related adverse events in two patients (13%), in both cases related to grade 3–4 immune-related adverse events (hepatitis, myasthenia gravis).
There were no discernable adverse events from neoadjuvant therapy on the perioperative period after surgery in any patient, and there were no perioperative deaths. One patient who underwent an extended left hepatectomy and portal vein thrombectomy developed elevated liver enzymes, ascites, hypotension, and lactemia, resulting in a prolonged post-operative hospital course. These complications were not attributed to the patient’s neoadjuvant therapy, but were instead attributed to the limited post-resection functional liver remnant volume. The patient’s liver enzymes and functional status improved slowly with supportive care, with the ascites completely resolving within six months of surgical resection.
Clinical activity and pathologic responses
Among the 14 patients who completed therapy and underwent surgical evaluation, 13 pursued surgical resection, and one was recommended against surgical resection (Fig. 1b). The patient who did not pursue surgical resection had not experienced a clinical response to neoadjuvant therapy and had insufficient hepatic reserve to undergo resection; this patient subsequently pursued locoregional therapy with TACE. Among the patients who underwent surgical resection, one patient’s surgical resection was aborted intra-operatively because of concerns about safely removing the tumor off of the right portal pedicle. This patient continues to receive systemic therapy. The remaining 12 patients (86%) underwent successful margin-negative surgical resections of their tumor.
Of the 12 patients who underwent successful surgical resection, 4 had major pathologic responses (90% or more tumor necrosis) and 1 had a complete pathologic response, i.e. major or complete pathologic response rate of 5/12 (42%) among resected patients. All patients achieving major or complete pathologic responses had some degree of radiographic tumor regression, although in most cases the reduction in radiographic tumor volume did not reflect the full extent of tumor necrosis (Fig. 1c). By RECIST 1.1, no evaluable patients had progressive disease, 13/14 had stable disease (93%), and 1 had a partial response (7%). A total of 7 patients had elevated AFP at study baseline, and all experienced a decline in AFP from baseline of at least 30% over the 8-week treatment duration (Fig. 1d). With a median follow-up of approximately one year, 5/12 patients who underwent surgical resection had recurred. Although the small number of patients precludes formal statistical comparisons, the disease free survival (DFS) was greater than 233 days for all individuals with pathologic responses, whereas 4/7 patients without major or complete pathologic responses developed progression early (between 56 and 155 days), (Fig. 1e). Overall survival was not mature at the time of analysis. Despite the brief neoadjuvant treatment course, multiple patients had radiographic tumor changes resulting in enhanced resectability (Fig. 1f-h), whereas no patients had meaningful radiographic tumor progression over the neoadjuvant treatment course.
Effects of cabozantinib on antitumor T cell immunity
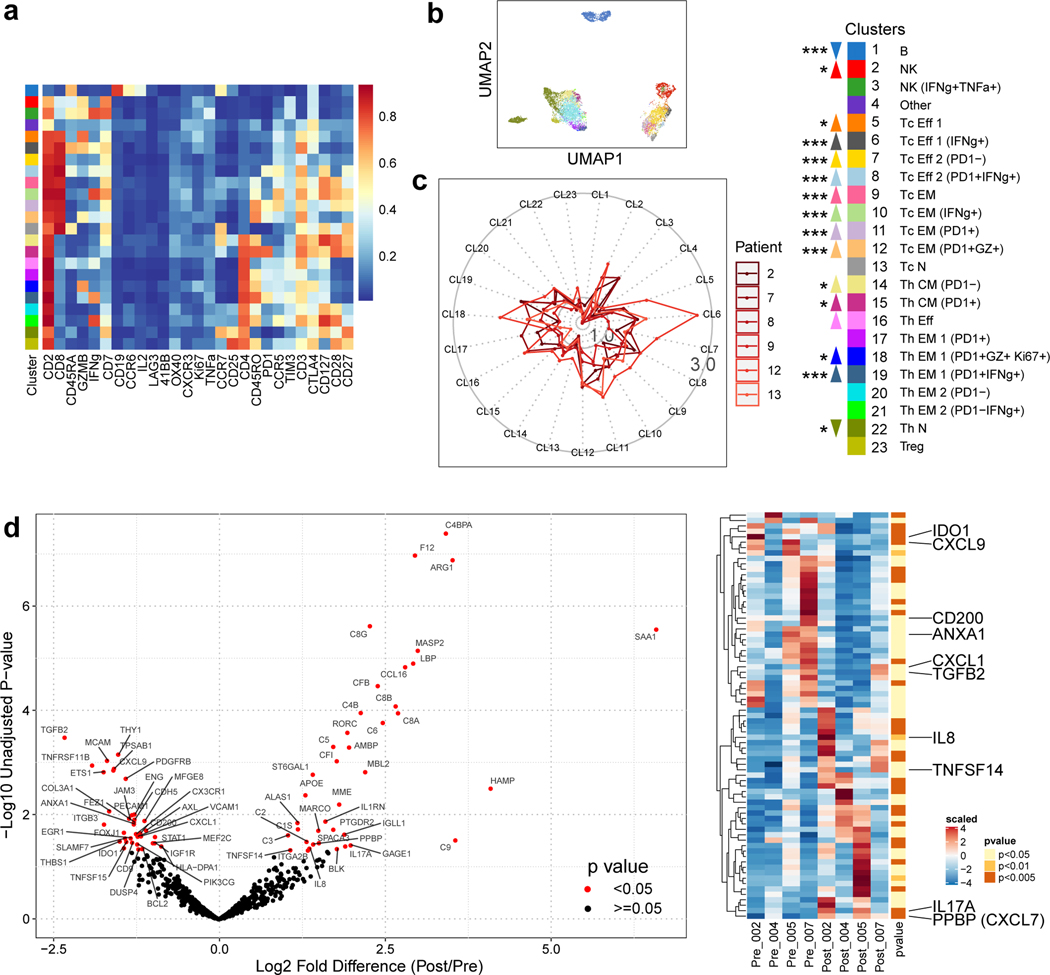
Informed by the clinical responses, we first sought to determine whether cabozantinib separately contributes to antitumor immune effects. This inquiry was specifically enabled by our trial design involving cabozantinib monotherapy for two weeks prior to the addition of nivolumab. To understand the systemic immunological effects of cabozantinib, we examined PBMCs in six patients, for which paired samples from baseline and post 2 weeks of treatment were available (Supplementary Table 3). Using a CyTOF panel with 28 markers geared for characterizing T cells25 (Supplementary Table 4), we distinguished a total of 22 immune cell types clustered by FlowSOM (Fig. 2a, b). Upon comparing the two timepoints, we observed ~1.5–2-fold increases in abundance of most effector and memory T cell subtypes in both CD4+ and CD8+ T cell populations (Fig. 2c). This included cell subtypes that were positive for interferon gamma (IFNγ), granzyme B, and Ki-67, all of which are important signatures of activation and functionally involved in antitumor immunity.
Figure 2.
Cabozantinib enhances systemic and local antitumor T cell responses. a, Serially obtained peripheral blood mononuclear cells (PBMCs) from six paired pre- and post-cabozantinib (cabo) samples were assayed by a 27-marker CyTOF panel dedicated to phenotyping T cells. FlowSOM algorithm as employed to generate 23 annotated final clusters. Scaled expression profile for each of the clusters identified from the entire dataset and hierarchically clustered are shown in the heatmap. b, UMAP representation of the annotated clusters. c, Radar plots showing post-cabo versus baseline fold changes for each patient. Inner solid boundary, 1-fold difference; outer solid boundary, 3-fold difference. Color legends are shared by panels A-C. Upward or downward arrows reflect direction of change due to cabo (***, P<0.005; **, P<0.01; *, P<0.05; FDR-adjusted, paired modeling by patient, edgeR). d, Volcano plots showing the results of nCounter® PanCancer Immune Profiling Panel for four paired pre- and post-cabo samples extracted from FFPE core biopsies. Red, unadjusted P-value <0.05 by linear modeling. Adjacent heatmap shows scaled levels of markers in each sample. Unadjusted p-values are annotated by color. Abbreviations: CM, central memory; Eff, effector; EM, effector memory; N, naïve; NK, natural killer; Tc, cytotoxic T; Th, helper T.
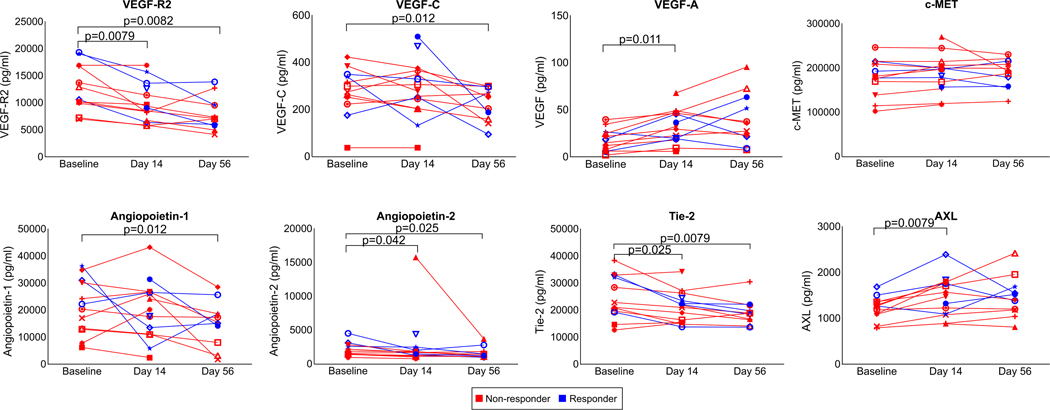
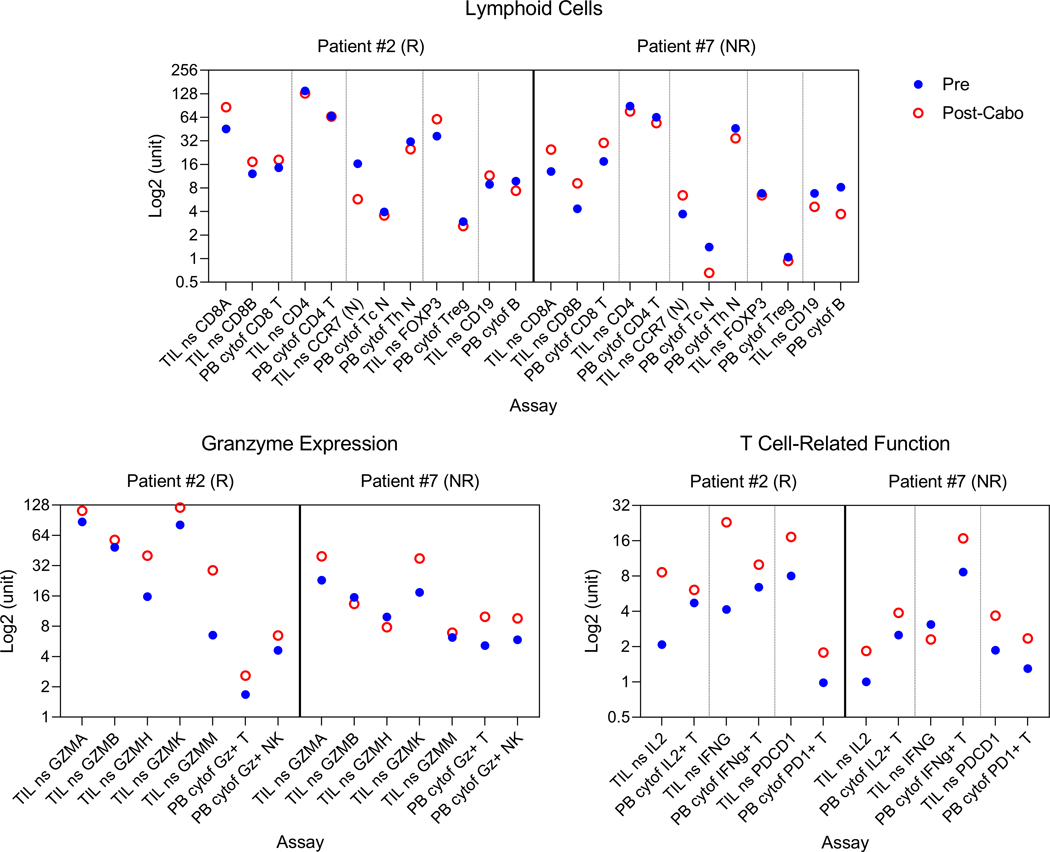
To explore the molecular changes that may occur within the TME as a result of cabozantinib alone, we identified four paired core biopsy samples (Supplementary Table 3) for transcriptional profiling with the nCounter® Nanostring PanCancer Immune Profiling Panel. In a paired pre vs. post-treatment analysis, there were several differences supporting the pro-immune effects of cabozantinib within the TME (Fig. 2d). In the post-cabozantinib samples, 0.40~0.49-fold changes in AXL, PDGFRB, and PECAM1 levels were quantified, demonstrating the target-specific consequences of cabozantinib. Additional target-specific treatment effects were independently corroborated by measurements (ELISA, luminex, or electrochemiluminescence) of correlates in the plasma, e.g. VEGF Receptor 2, Angiopoietin-2, TEK Tyrosine Kinase 2 (Tie2) (Extended Data Fig. 1), which were consistent with previously reported trends26,27. In support of the idea that cabozantinib invigorates antitumor immunity, Nanostring assay also showed lower transcriptional levels in post-cabozantinib samples of IDO1 (0.28-fold), TGFB2 (0.49-fold), ANXA1 (0.36-fold), CXCL1 (0.71-fold), CD200 (0.46-fold), and CX3CR1 (0.45-fold), and higher levels of IL17A (3.58-fold), TNFSF14 (1.76-fold). In contrast, there were also changes that were not indicative of improved immune responses, e.g. higher PPBP (2.25-fold) and IL8 (5.1-fold). In two patients for whom both Nanostring and CyTOF results were available, findings suggestive of T cell activation were largely congruent (Extended Data Fig. 2).
Thus, cabozantinib alone was overall associated with enhanced pro-immune signatures both systemically and locally, and importantly, promotion of T cell differentiation toward antigen-experienced and less exhausted phenotypes. These findings suggested that cabozantinib elicits immunological responses that can be further exploited by nivolumab to confer immune-mediated therapeutic synergy.
Immune-rich TME in responders of cabozantinib and nivolumab
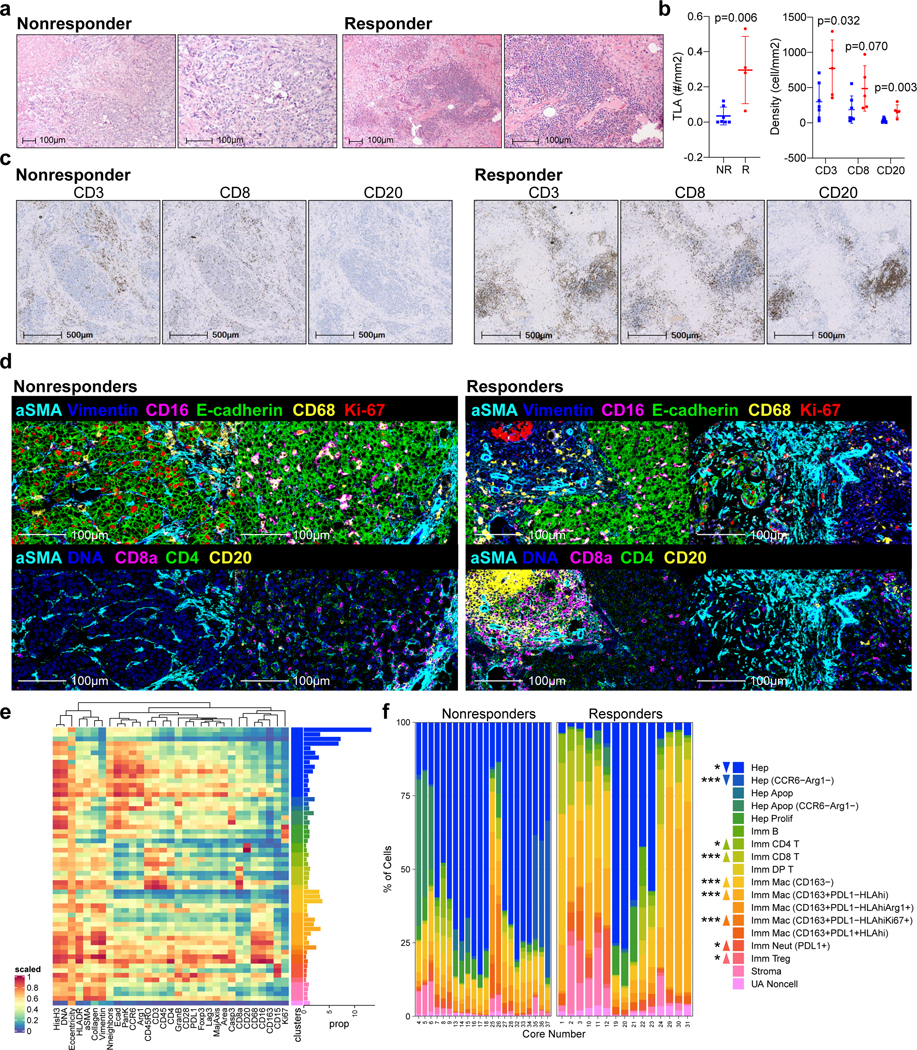
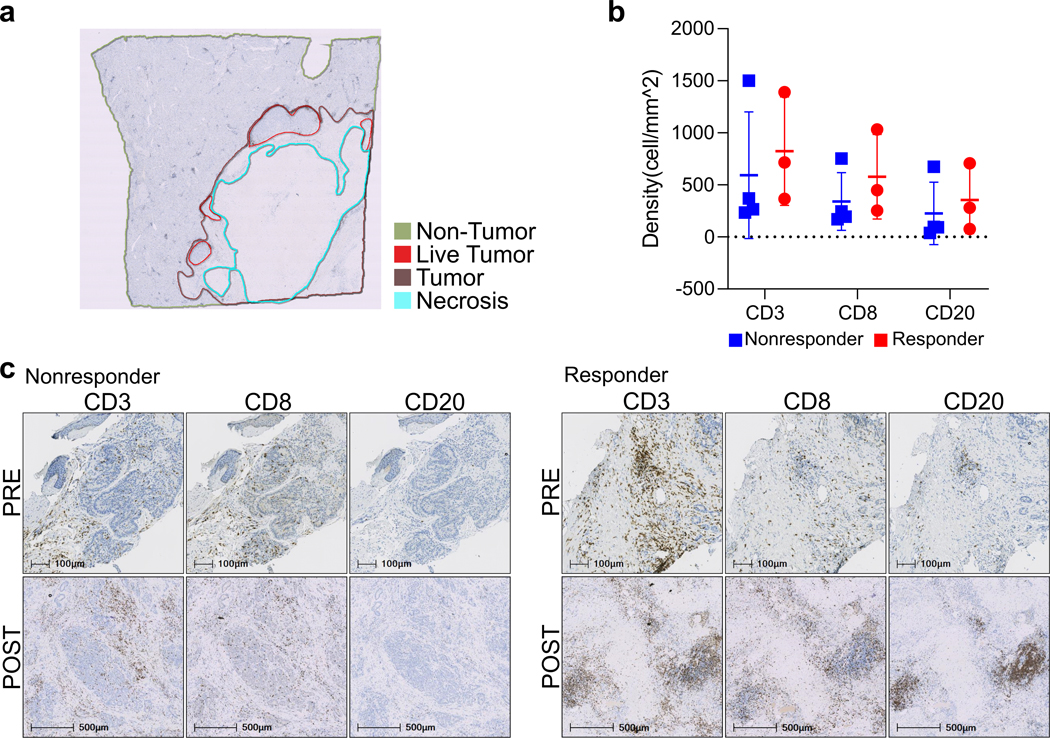
When evaluating the combination-treated, surgically resected tumor samples, pathologic review identified highly immune-infiltrated foci, i.e. tertiary lymphoid structures (TLA), in the pathologic responders compared to the non-responders (Fig. 3a). To quantitatively assess immune infiltration, we annotated each tumor specimen into non-tumor, live tumor, necrosis, and tumor regions (Extended Data Fig. 3a) and analyzed the regions using the digital imaging analysis platform, HALO. Consistent with the pathologic review, the absolute number of TLAs within the tumor regions was significantly greater in the responders (P=0.006; Fig. 3b). There were also higher densities of CD3+ and CD8+ T cells, and CD20+ B cells (P=0.032, 0.07, 0.003, respectively) but not CD57+ NK cells (P=0.41) in the responders compared to the non-responders (Fig. 3b, c). Significant differences were noted in the tumor regions but not in non-tumor regions (P=0.62, 0.39, 0.61, respectively; Extended Data Fig. 3b), suggesting that these immunological responses are tumor-specific. Furthermore, upon qualitative review, heavy immune infiltration appeared to be observed only in the post-treatment samples of responders (Extended Data Fig. 3c). A more robust immunological comparison between the core biopsy baseline and surgical post-treatment samples, however, could not be performed due to both limited availability of samples and systemic bias concerns related to different sampling methods.
Figure 3.
Response to cabozantinib and nivolumab is characterized by an immune-rich TME. a, Representative H&Es, one from 7 nonresponders and one from 5 responders, of dense immune-rich foci, i.e. tertiary lymphoid structures (TLA) in the surgically resected tumors post-cabozantinib and nivolumab. b, Quantification of TLAs along with CD3+ cells, CD8+ cells, and CD20+ cells per tumor area (mm2) in non-responders (NR, n=7 patients) and responders (R, n=5 patients ) as detected by immunohistochemistry (IHC). (mean±s.d., unpaired two-tailed T-tests). c, Representative IHC staining for CD3, CD8, and CD20 (one patient selected from each group for representation; quantitative data shown in panel b). d, Representative multicolored images from IMC for non-responders and responders (two patients selected from each group for representation). e, Scaled heatmap of IMC parameters for a total of 59,453 single cells identified from 37 cores representing 12 surgically resected post-treatment samples. The dataset was clustered by FlowSOM into 60 metaclusters annotated into 18 final clusters. The proportion (prop) of each cluster out of the entire dataset is shown as horizontal bar graphs. f, Abundance of each annotated cell type cluster as a percentage of total cells within each core stratified into non-responder and responder groups. Cell type color legends apply to both panels E (horizontal bar graph) and F. Upward or downward arrows reflect the levels in responders relative to non-responders (***, P<0.005; *, P<0.05; FDR-adjusted, edgeR). Abbreviations: Apop, apoptotic; DP, double-positive; Hep, Hepatocellular carcinoma; Imm, immune subtype; Mac, macrophage; Neut, neutrophil; UA, unassigned.
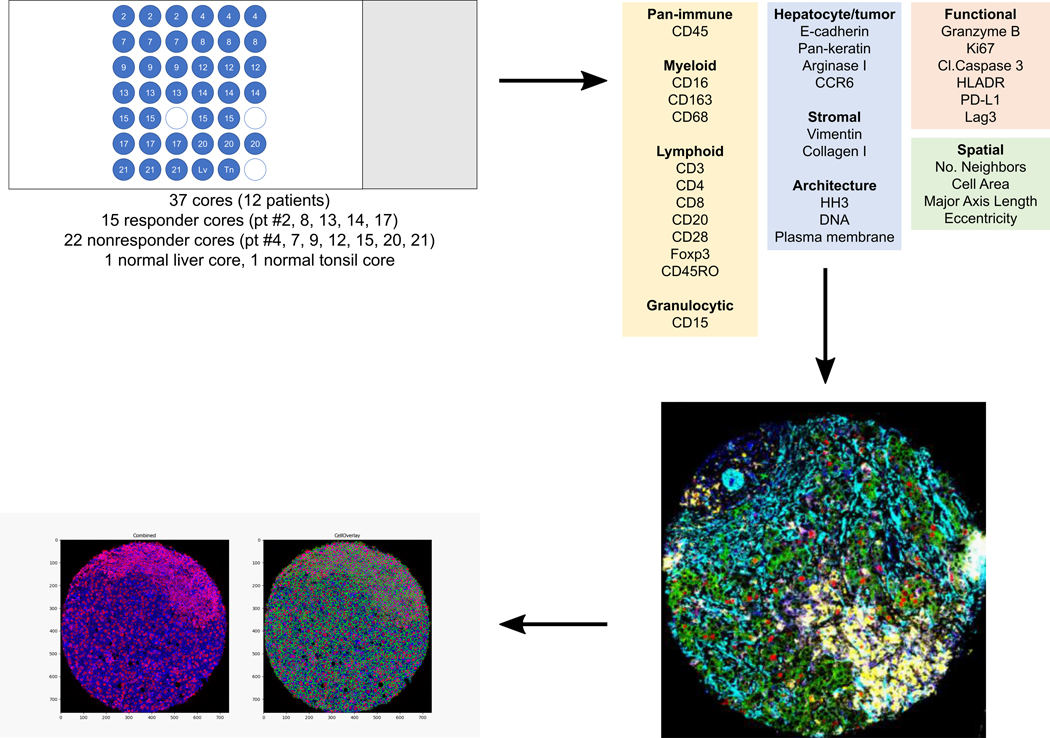
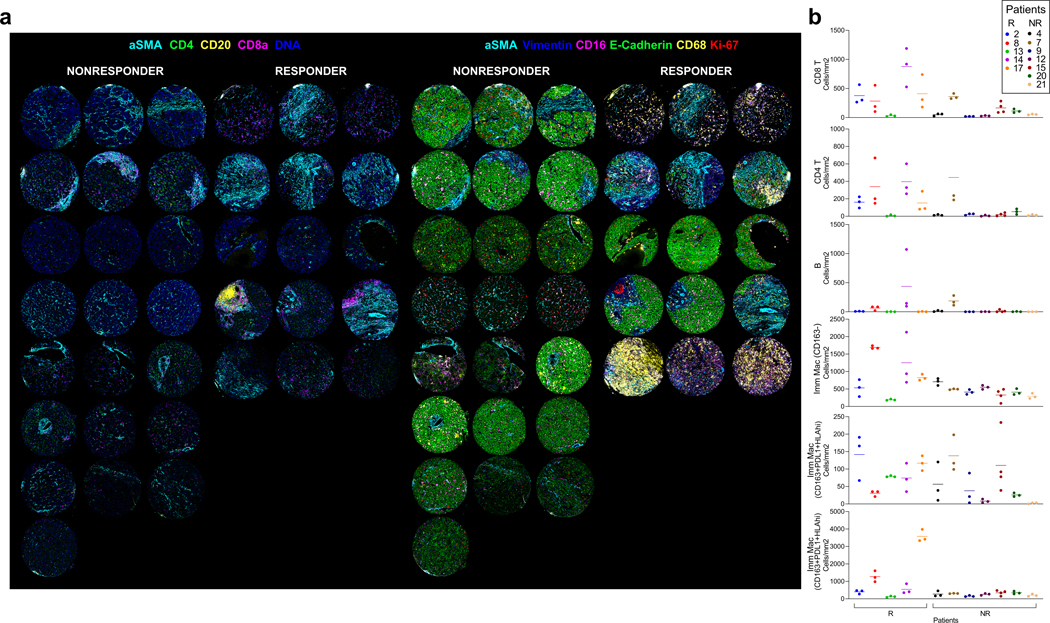
To more extensively interrogate the differences in the immune TME between the responders and non-responders, we constructed a tissue microarray containing 37 representative tumor region cores from the 12 surgically resected tumor samples (Supplementary Table 3), with 3 cores from each of 11 samples and 4 cores from 1 sample (Extended Data Fig. 4). Using the tissue microarray, we conducted IMC with a panel of 27-markers (Supplementary Table 5) and reviewed the resulting multiplexed images (Fig. 3d, Extended Data Fig. 5a). Visual analysis of these multiplexed images identifies that non-responder samples were still dense with E-cadherin positive cells, i.e. presumably HCC cells, and responder samples exhibited a greater presence of T cells (CD8a+, CD4+) T cells. Myeloid cells (CD16+, CD68+ cells) were visually detected in both responders and non-responders. To compare quantitatively, we then segmented the multiplexed images into a single-cell dataset to enable analysis of the immune profiles on a per-cell basis. A total of 59,453 cells were discriminated. The single-cell dataset was then clustered into 17 following cell types using FlowSOM28 (Fig. 3e): 5 HCC/hepatocyte (E-cadherin+pan-keratin+CD45-); 1 stromal/architectural (vimentin+, collagen+, α-smooth muscle actin+, E-cadherin- or pan-keratin-); 1 B cell (CD45+CD20+CD3-); 1 CD4 T cell (CD45+CD3+CD4+); 1 regulatory T cell (CD45+CD3+CD4+Foxp3+); 1 CD8 T cell (CD45+CD3+CD8+); 1 double-positive T cell (CD45+CD3+CD4+CD8+); 1 neutrophil (CD45+ CD68-CD15+); and 5 myeloid/macrophage (CD45+CD16+CD68+). HCC cells represented 75.4% of total cells in the non-responder cores and 29.8% of total cells in the responder cores. Conversely, the abundance of CD4+ and CD8+ T cells were significantly higher in the responder samples than the non-responder samples (FDR-adjusted p <0.05, <0.005, respectively; Fig. 3f). As expected, the density of the cell populations found in each of the cores largely trended together for each sample except for the cell types that are relatively less common, e.g. B cells (Extended Data Fig. 5b). Moreover, T cell abundances from this IMC dataset strongly correlated with the IHC results (p<0.0001, r=0.82).
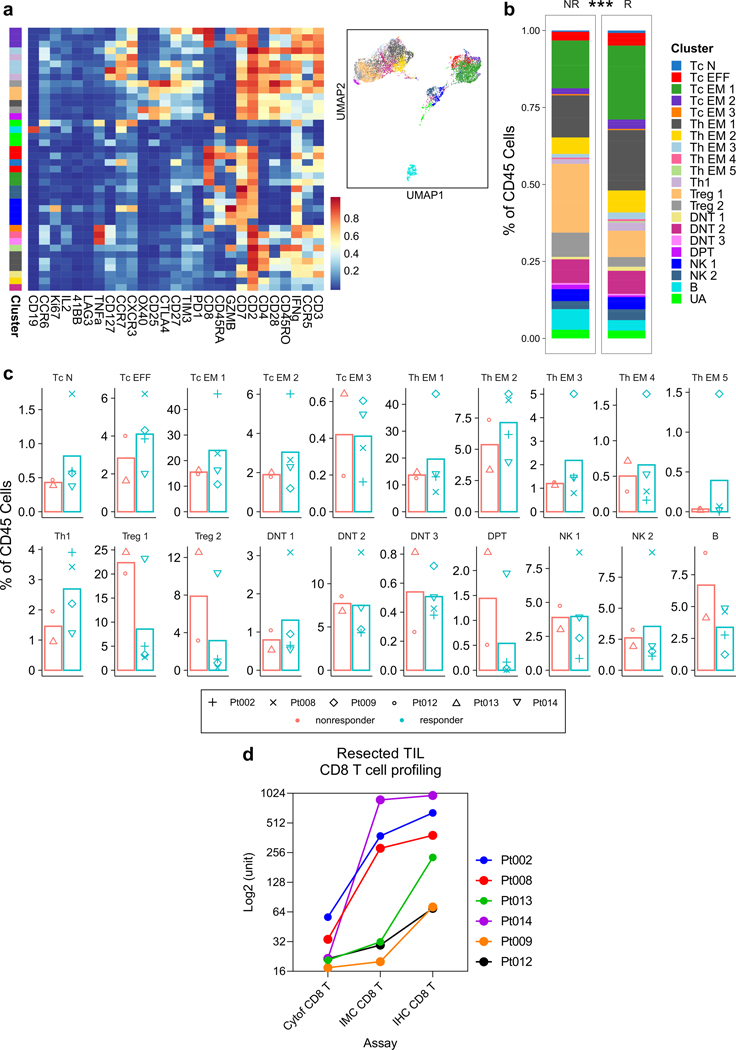
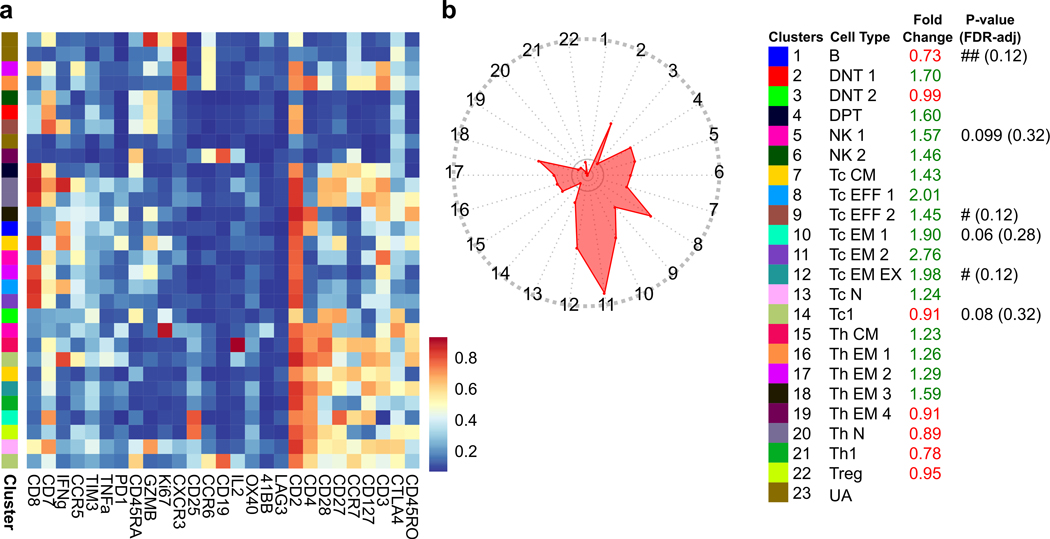
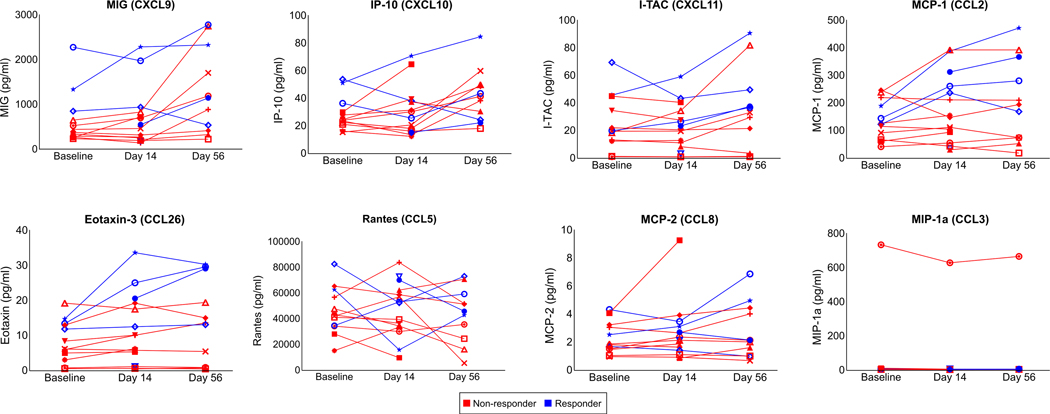
To more deeply characterize the immune cell subtypes and function that distinguishes responders and non-responders, we performed additional profiling with CyTOF using the aforementioned 28-marker panel (Supplementary Table 4). Profiling was performed on single cells enzymatically dissociated from six of the surgically resected tumors available for assaying (Supplemental Table 3). CyTOF-based subtyping (Extended Data Fig. 6a) demonstrated that the lymphoid cell profiles were significantly different between the non-responder and responder tumors with enrichment of IFNγ+ effector memory CD4+ (Th EM 1) and CD8+ T cells (Tc EM 1) as well as Granzyme B+ effector CD8+ T cells (Tc EFF) (P<0.0001; Extended Data Fig. 6b, c). Across the disparate profiling modalities, we also found that the T cell abundances were highly correlated (Extended Data Fig. 6d). Consistent with these in-tumor findings, CyTOF profiling of the PBMCs obtained at the time of surgery showed that cabozantinib and nivolumab also systemically promoted effector and effector memory T cell subtypes (Extended Data Fig. 7). In addition to T cells, the presence of myeloid cell types in the tumor were also higher in the responder group (Fig. 3f). Among the myeloid cell clusters, macrophage clusters characterized by lower expression of CD163 and arginase-1 were higher in abundance in the responders (FDR-adjusted p<0.001), suggesting that the observed response was associated with a lower degree of myeloid-induced immunosuppression. Of note, greater infiltration of lymphoid and myeloid cells within the responder TME were associated with trends toward higher plasma levels of CXCL9/10/11, CCL2, and CCL26 (Extended Data Fig. 8), which are chemokines that mediate recruitment of lymphoid and myeloid cells29–32.
Spatial arrangement of B and myeloid cells in responder TME
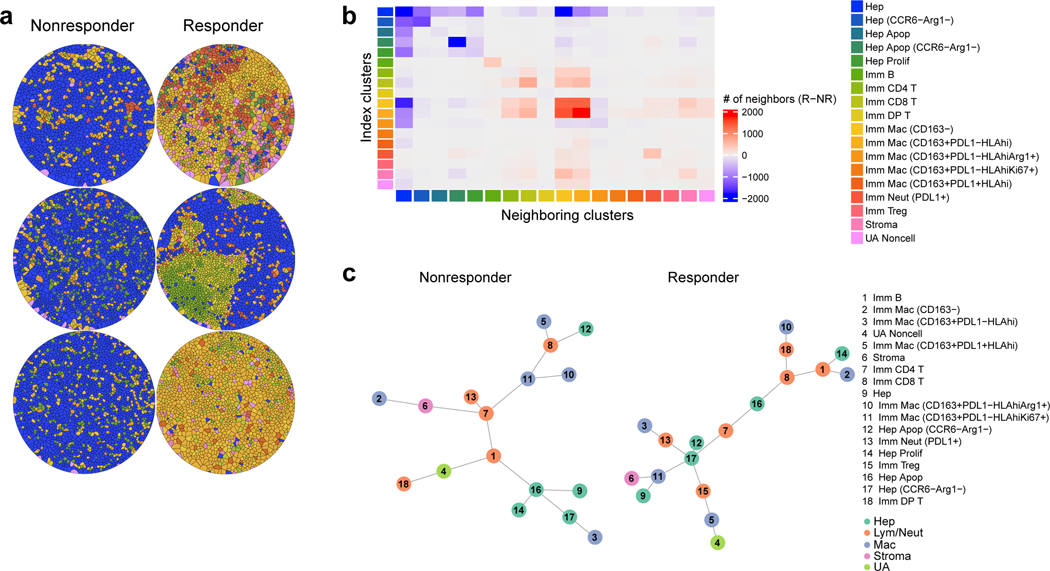
The IMC data enables further quantification of the spatial relationships between neighboring cells that mediate therapeutic response not captured by analyses of cell type abundance alone. To thus explore the density of specific cellular regions in these samples, Voronoi tessellation allowed for rendering individual cells into partitioned polygons based on the proximity of the neighboring cells to distinguish homogeneous cell type composition from regions composed of heterogeneous cell types (Fig. 4a). Specifically, immune-rich regions were demonstrable as distinct aggregates of lymphoid cells, especially B cells, and macrophages. To further analyze the inter-cellular interactions that distinguish responders and non-responders, we applied a neighborhood analysis to the cell types identified by IMC to quantify which cell types were the top closest neighbors for any given index cell type based on their spatial coordinates (Fig. 4b). We then generated a heatmap of the differences in the total counts of the top neighboring relationships between the responder and non-responder groups. As expected, a much higher number of lymphoid-lymphoid, myeloid-myeloid, and lymphoid-myeloid neighboring relationships were detected in responders. Notably, B cells were spatially distinct in responder TME; their top neighbors were other B cells.
Figure 4.
Spatial relationships among the cell types are distinct with respect to response. a, Representative Voronoi tessellations of three cores for each response group (each core is from a unique patient; representative of n=6 patients). b, Heatmap displaying top neighboring cell types (columns) for each given index cell type (rows). The difference between responder and non-responder cells in their absolute number of top two neighboring cell types are indicated by color (red, more in responders; blue, more in non-responders). Cell type clusters are annotated by color along the rows and columns Color legends apply to panels A and C (data representative of n=12 patients total). c, Minimum spanning tree representations of spatial relationships among the cell types in the non-responder (n=37196 cells) and responder (n=22257 cells) groups based on minimum Euclidean distances from each cell to all other cell types. Abbreviations: Apop, apoptotic; DP, double-positive; Hep, Hepatocellular carcinoma; Imm, immune subtype; Lym, lymphocyte; Mac, macrophage; Neut, neutrophil; NR, non-responder; R, responder; Tc, cytotoxic T; Th, helper T; UA, unassigned.
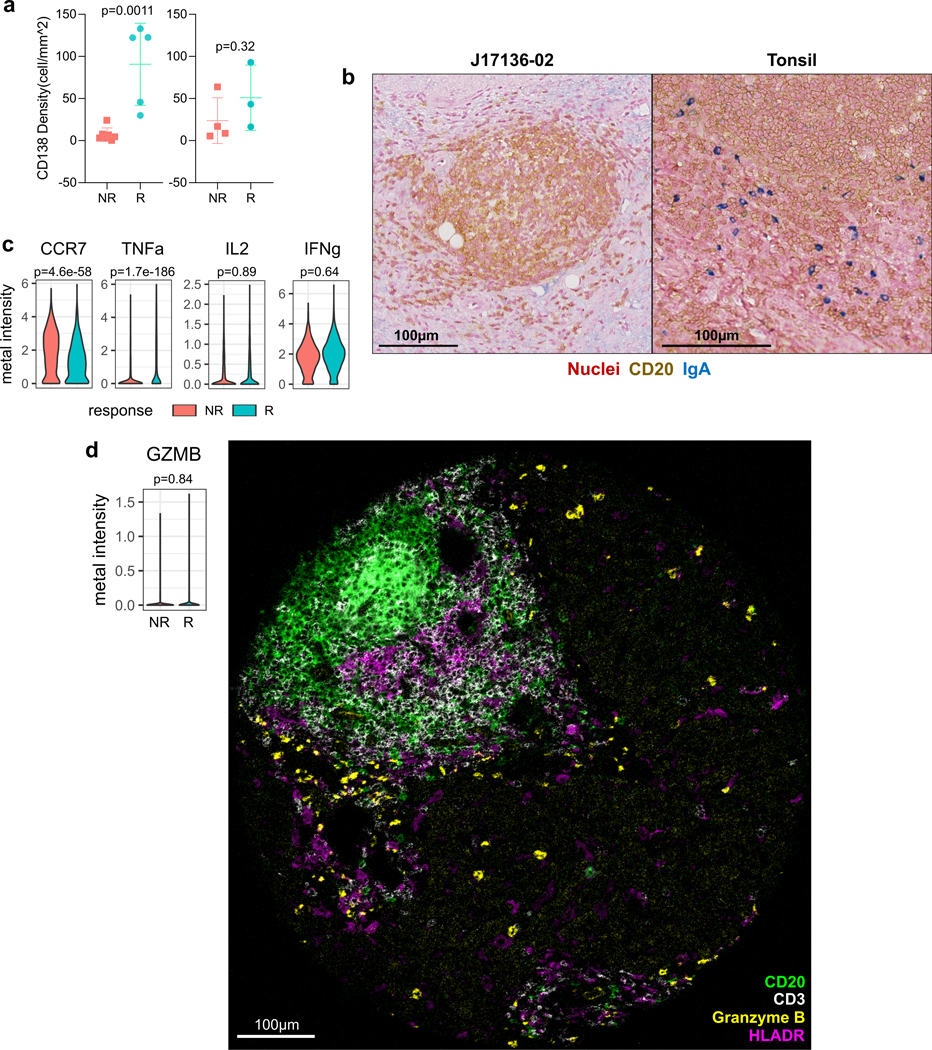
Given the unique observation related to tumor-infiltrating B cells, we functionally phenotyped the B cells within tumor samples in greater detail using immunohistochemistry and CyTOF. Immunohistochemistry revealed that responder samples exhibited a significantly higher density of CD138+ cells within the tumor regions only (Extended Data Fig. 9a), suggesting the involvement of B cell maturation and antibody-secreting function in the antitumor immunity. These B cells were also negative for IgA, the expression of which would have signified an immunosuppressive function33 (Extended Data Fig. 9b). CyTOF analysis of B cells from the dissociated tumor samples demonstrated that CCR7 expression, which inversely correlates with activation and MHC-II expression34, was lower in the responders. In addition, whereas TNFα, IL2, and IFNγ were all expressed, only TNFα was significantly different, with B cells from responders showing higher levels (Extended Data Fig. 9c). Given the spatial proximity of B cells to one another, TNFα may confer greater paracrine immunostimulatory effects in responder TME to promote the spatial structure35 and antibody production36. In examining the cytolytic function, expression of granzyme B in the tumor-infiltrating B cells was generally not detectable by CyTOF or IMC (Extended Data Fig. 9d). Collectively, our findings suggest that a distinct aggregation of B cells is a hallmark of response to cabozantinib and nivolumab and that they indirectly support the antitumor immune response by producing both antibodies and pro-inflammatory cytokines.
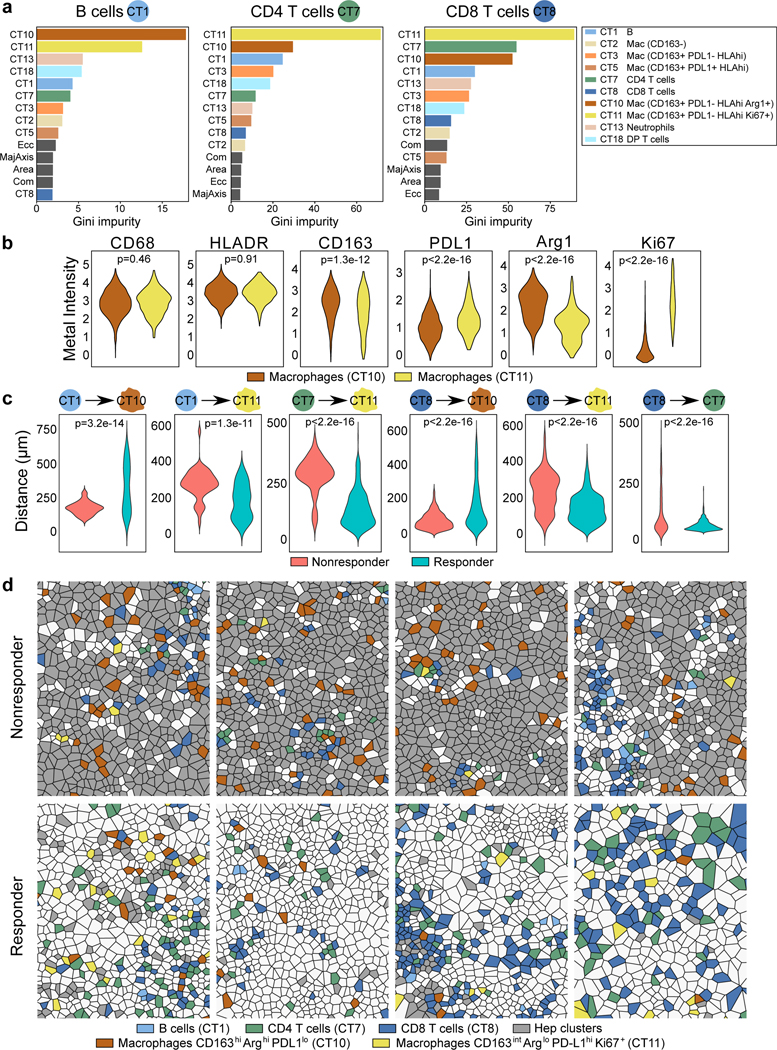
To better understand how each cell type may be spatially related to one another, we generated a simplified network of cell types using a minimum spanning tree algorithm based on the minimum Euclidean distances from each cell type to all other cell types (Fig. 4c). This network analysis generates nodes associated with cell types and edges that summarize the average spatial inter-relationship between distinct cell types. In non-responder TMEs, most nodes in the network associated with HCC cells (nodes 9, 14, 16, and 17) were generally distant from the effector immune cell types. Notably, CD8+ T cells were surrounded by macrophage nodes (nodes 5, 10, and 11). On the other hand, nodes associated with HCC cells, including caspase-3+ apoptotic HCC cells (nodes 12 and 16), were closely linked with CD8+ T cells. In contrast to the non-responders, the nodes associated with HCC cells are spatially separated from the nodes for CD163+ macrophages. B cells (node 1), in both networks, were close to T cells (nodes 7 and 8) and apoptotic HCC cells (node 16). Next, to discern which spatial relationships associated with B and T cells may be the most critical determinant of response, we applied the random forest algorithm onto the single-cell level dataset containing the minimum distances from each individual immune cell to all other immune cell types. For all minimum distance relationships, we then computed the Gini impurity statistic, which signifies the probability of incorrectly classifying a variable if assigned at random as response or non-response. Based on Gini impurity statistic, we discovered that from a given B cell, CD4+ or CD8+ T cell, the minimum distances to “cell type 10” (CT10) and “cell type 11” (CT11) macrophages stood out as the two most critical predictors of response (Fig. 5a). In characterizing the two macrophage cell types more precisely, we observed that CT10 macrophages exhibited higher CD163 and arginase-1 (Arg) compared to CT11 macrophages and that CT11 macrophages had greater Ki-67 and PD-L1 expression (Fig. 5b). For CD8+ T cells specifically, their minimum distance to CD4+ T cells was also a strong predictor of response. Interestingly, responder relationships were defined by longer minimum distances to CT10 macrophages but shorter minimum distances to CT11 macrophages (Fig. 5c). As expected, the minimum distances between CD8+ T and CD4+ T cells were shorter in responders (Fig. 5c). These key spatial relationships were visually confirmed by Voronoi diagrams of B cells, CD4+ T and CD8+ T cells, CD163hiArghi macrophages, and CD163intArglo macrophages (Fig. 5d). Thus, these data suggest that the proximity of B and T cells to macrophages that exert immunosuppression by arginase-1 is a critical feature of tumors that resist cabozantinib and nivolumab, whereas the proximity of B and T cells to macrophages that are proliferative and expressing higher levels of PD-L1 is a key characteristic of tumors that respond to cabozantinib and nivolumab.
Figure 5.
Proximity between lymphoid and macrophage subtypes are key determinants of response to cabozantinib and nivolumab. a, Results from random forest algorithm evaluating minimum Euclidean distances among immune cell types shown as Gini impurity statistics. Distances to all other immune cell types from B cells (“CT1”, left box), CD4+ T cells (“CT7”, middle box), and CD8+ T cells (“CT8”, right box) are ranked by order of importance in response prediction. Data for panels a-c are representative of all evaluable n=12 patients.b, Metal intensities of functional markers for the two macrophage subtypes (indicated are FDR-adjusted P values, linear modeling) n=1452 CT10 vs. 359 CT11. c, Most important minimum Euclidean distances from each index cell type (B, CD4+ T, or CD8+ T; shown as the circle on the left) to other cell types are shown at the per-cell level as violin plots (indicated are FDR-adjusted P values, linear modeling). R vs. NR: n=73 vs. 103 B cells, n=349 vs. 172 CD4+ T cells, n=598 vs. 401 CD8+ T cells. d, Voronoi diagrams visualizing spatial relationships among B cells, CD4+ T cells, CD8+ T cells, and the two macrophage subtypes for non-responders and responders (represents four unique patient samples for each group). Hep clusters are depicted in grey. Abbreviations: Com, compactness; DP, double-positive; Ecc, eccentricity; Mac, macrophage; MajAxis, major axis diameter.
Taken together, our results indicate that (i) cabozantinib and nivolumab promote T cell-mediated antitumor immunity locally and systemically, (ii) tumor infiltration of B-cells in a unique spatial orientation is a salient feature of the HCC immune response, and (iii) close proximity of arginase-1 expressing myeloid cells to T and B cells associates with lack of response to therapy.
Discussion
This study advances clinical progress for HCC treatment, demonstrating the use of a targeted therapy in combination with an immune checkpoint inhibitor in the neoadjuvant setting. It also establishes prospective use of modern systemic therapies to attempt to downstage HCC outside of traditional resection criteria, including patients with very large tumors, multinodular disease, or portal vein involvement. Although there is a critical need for perioperative systemic therapy in HCC to improve on disease-free and overall survival rates, there is currently no standard of care for neoadjuvant or adjuvant therapy for patients with HCC. The present study demonstrates that neoadjuvant cabozantinib and nivolumab, followed by surgical resection, is feasible and can result in margin-negative resections, pathologic responses, and long-term (>6 months) disease-free survival in a subset of patients outside of standard resection criteria. Long term disease-free survival was particularly notable in resected patients who achieved major pathologic responses, with all of these patients achieving disease free survival intervals of over 230 days thus far.
Since the present study was initiated, the use of combination VEGF- and PDL1-targeted therapy with bevacizumab and atezolizumab became a new standard of care option for unresectable HCC23, and multiple other combinations are under active investigation in the frontline setting including cabozantinib plus anti-PDL1 therapy18. However, it is still unclear exactly how the two modalities affect one another. CXCL1 is a chemokine ligand of CXCR2 with an increasingly established role in immunoresistance and T cell restriction in the TME37,38. We have shown that cabozantinib alone is associated with decreased CXCL1 within the TME accompanied by systemic promotion of T cell activation. Previous studies have shown that CXCL1 expression is mediated by VEGF signaling39–41. Thus, these observations together suggest one potential axis by which cabozanitinib exerts an immunostimulatory effect that can synergize with nivolumab. These data also need to be interpreted in the context of a rapidly evolving treatment landscape for HCC. Both bevacizumab and cabozantinib inhibit VEGF and may cause bleeding and complicate wound healing, but bevacizumab has a more prolonged half-life, potentially making it more challenging to utilize in the neoadjuvant setting. Although no systemic therapy is approved in the perioperative setting for HCC, multiple phase 3 studies of adjuvant PD(L)1 immunotherapy are ongoing18. However, neoadjuvant administration of systemic therapy may have certain advantages over adjuvant therapy. For example, neoadjuvant therapy has the potential to downstage tumors, potentially expanding the number of patients who are eligible for resection, as was achieved in the present study. Our study is consistent with the observations of Kaseb and colleagues42, who recently reported a high rate of pathologic responses in resectable HCC treated with neoadjuvant immunotherapy. However, our study differs because we included patients who would otherwise not have been offered potentially curative resection, again demonstrating the potential for HCC systemic therapies to expand the resection criteria. Also, neoadjuvant immunotherapy may be advantageous because an antitumor immune response is dependent upon interactions between T cells, antigen presenting cells, and tumor cells, and such responses are more likely to occur when a primary tumor is still present43.
The use of systemic therapy in the neoadjuvant setting offers a tremendous research opportunity to better elucidate mechanisms of tumor response in HCC. The observation of increased IFNγ+ effector memory CD4+ and granzyme B+ effector CD8+ T cells in responding tumors was not unexpected. However, we also observed enhanced B cell infiltration, higher TNFα expression, CD138+ plasma cell infiltration, and tertiary lymphoid structures consisting of B cells and T cells in the pathologic responders indicative of an organized B-cell contribution to antitumor immunity. The contribution of B cells to immune checkpoint inhibitor therapeutic responses is supported by the recent observation across multiple tumor types that tumor infiltrating B cells are an important biomarker for the antitumor immune response44–46. The distinct mechanisms through which B cells contribute to anti-tumor immunity are incompletely understood. It is unlikely that B cells are killing tumor cells through granule exocytosis, as the expression of granule-associated enzymes in these cells were similarly low in responders and nonresponders. Given our findings related to B cells in our study, B cells may augment T cell immunity through the secretion of cytokines and chemokines47, expression of co-stimulatory signals48, and can serve as the predominant APCs to initiate CD4 T cell responses under some physiological conditions49. The observation of mature CD138+ plasma cells in responders, which were rare or non-existent in non-responders, also suggests that B-lineage cells contribute to anti-tumor immunity through the secretion of anti-tumor antibodies.
Our study also implicates myeloid cells, specifically tumor-associated macrophages, in modulating the therapeutic response to cabozantinib and nivolumab. First, we observed a significant presence of PD-L1hi, CD163+ macrophages near T and B cells in line with known immunosuppressive effects mediated by PD-L1 expressed on macrophages50. Consistent with a recent finding that Ki-67+ denotes proliferative macrophages, which are rare in normal tissue microenvironment but contribute to malignant progression and invasiveness in TMEs51, our data also recapitulated the relevance of Ki-67+ CD163+ macrophages as a subtype of macrophages that neighbor T cells within the non-responder HCC TME. Notably, upregulation of PD-L1hi in macrophages occurs in response to IFNγ released by effector immune cells52 and can be overcome by PD1 inhibition53, as was observed in responder patients on our trial. Our data suggested that the presence of a key subtype of CD163+ macrophages characterized by relatively higher arginase-1 expression, however, is a critical determinant of resistance to cabozantinib and nivolumab. Arginase-1 alters the metabolic environment to impair antitumor immunity, and may therefore confer resistance to inhibitors of the PD1/PD-L1 signaling axis54. Future studies validating arginase-1 myeloid cells as a therapeutic target in HCC are warranted.
In summary, neoadjuvant combination therapy with cabozantinib plus nivolumab is feasible and is associated with a pathologic responses in a subset of patients. Our multiomic analysis of resected hepatocellular carcinoma specimens treated with this combination supports a role for B cells and plasma cells in the antitumor immune response, and arginase-1 expressing CD163+ macrophages in resistance to therapy. These findings may lead to the development of novel therapeutic combinations that can improve or overcome resistance to current therapeutic options in HCC. Strengths of this study include the use of in-depth profiling of the tumor immune microenvironment using both imaging and suspension mass cytometry to extensively characterize the tumor immune microenvironment in responding and non-responding surgical resection tumor tissue. Limitations of our study include but are not limited to the relatively small patient sample size and short post-operative follow up period, precluding precise interpretation of clinical response rates and the impact of responses on disease free survival. We are also unable to definitively conclude that the observed changes within the immune TME are in fact responsible for the clinical responses, and spatial analyses of immune populations in responder and non-responder samples may be confounded by the presence of greater numbers of HCC tumor cells in the non-responder samples. Another limitation of this work is our inability to attribute clinical and pathologic findings to either cabozantinib or nivolumab, as these agents were administered concurrently. Larger studies of neoadjuvant systemic therapy are warranted to determine whether this approach can improve overall survival in HCC. Additional neoadjuvant studies across multiple tumor types are needed to confirm the applicability of these findings to more diverse disease settings.
Methods
Study Oversight, Ethics, and Drug Supply
All patients provided written informed consent prior to enrollment, and the trial was registered under ClinicalTrials.gov as NCT03299946. The protocol was approved by the Institutional Review Board (IRB) at Johns Hopkins University. Cabozantinib was supplied by Exelixis and nivolumab was supplied by Bristol-Myers Squibb.
Patients and eligibility criteria
Eligible patients were 18 years of age or older, had an Eastern Cooperative Oncology Group performance-status score of 0 or 1 (on a 5-point scale in which higher numbers reflect greater disability), adequate hematologic, renal, and hepatic function with a Child-Pugh score of A. Eligible patients had locally advanced or borderline resectable HCC, defined in the protocol as a solitary tumor >5 cm; or unilobar multifocal disease (either with >3 tumors or one tumor >3 cm); or bilobar disease; or high risk features (tumor >3 cm with macrovascular invasion). Patients with extrahepatic spread or with bilateral left and right branch portal vein involvement were excluded. Patients who received prior systemic therapy for HCC, or active autoimmune disease, or uncontrolled intercurrent illness were also excluded.
Study design
This open-label, single institution, single arm phase 1b study was conducted at Johns Hopkins in Baltimore, MD. All cases were reviewed at the Johns Hopkins Sidney Kimmel Comprehensive Cancer Center Liver Cancer Multidisciplinary Clinic. Eligible patients received a total of 8 weeks of cabozantinib at a dose of 40 mg oral daily. After a two-week lead-in of cabozantinib monotherapy, patients received concurrent nivolumab at a dose of 240 mg IV every two weeks, for a total of four treatment doses. Two weeks after completing neoadjuvant therapy consisting of 8 weeks of cabozantinib and 4 doses of nivolumab, patients received a restaging scan and surgical evaluation. Patients determined to be eligible for surgical resection proceeded on to a definitive surgical resection. In order to mitigate risk of bleeding from cabozantinib, the surgical resection was scheduled at least 28 days after the last dose of cabozantinib therapy.
The primary endpoint focused on safety and feasibility, which was defined in the protocol by the proportion of patients who experienced a treatment-related AE that precludes continuing on to surgery within 60 days of the planned date for surgical evaluation. The proportion with failure, the primary outcome, was calculated with exact binomial confidence intervals. Individuals who did not receive surgery due to other causes (e.g. progressive disease) were not counted as failures for the primary endpoint, since the trial enrolled a group of patients who would not have otherwise received upfront surgery. All the patients were monitored for adverse events, according to the National Cancer Institute Common Terminology Criteria for Adverse Events, Version 4.0.
Notable secondary and exploratory end points were the percentage of subjects who receive a R0 surgical resection, pathological responses, radiologic responses (based on the revised Response Evaluation Criteria in Solid Tumors (RECIST) guideline version 1.1), disease free survival, overall survival, and immunologic and/or pathological correlates of response to treatment in blood and tumor. Pathologic responses were scored by a single hepatobiliary pathologist (author R.A.A.) who was blinded to patient demographics or clinical outcomes. Primary tumors were assessed for the percentage of residual viable tumor that was identified on routine hematoxylin and eosin (H&E) staining. Complete pathologic responses were defined as no residual cancer in the surgical resection specimen. Major pathologic responses were defined as <10% residual viable tumor in the surgical resection specimen.
Sample processing and storage
Patients received core tumor biopsies prior to starting therapy and at the end of the 2-week cabozantinib monotherapy lead in. To minimize risks of bleeding in the setting of cabozantinib therapy, the paired biopsies were performed with a 20 gauge needle or smaller. Patients who underwent definitive resection following completion of neoadjuvant therapy also had bulk tumor that was preserved for subsequent analysis of the tumor microenvironment. Tissue from both the biopsies and from the tumor resection were immediately formalin-fixed using 10% neutral buffered formalin and subsequently paraffin-embedded (FFPE).
Bloods were obtained in heparinized syringes by standard phlebotomy technique and processed within 2 hours of collection. For isolation of plasma, blood was transferred into a 50 ml conical tube and placed in a centrifuge at 2000 rpm for 20 minutes with the brakes off. The plasma layer was removed, and stored in 1 ml aliquots at −80°C. PBMCs from the remaining blood were isolated using standard LeucoSep tube technique. Briefly, blood diluted in equal parts PBS was added to LeucoSep tubes preloaded with Ficoll-Paque. The tubes were then centrifuged for 20 minutes at 2000 rpm with no brake. The PBMC suspension was collected, the cells were washed in PBS, and stored in a cryovial initially at −80°C before transfer to liquid nitrogen for long-term storage.
All samples used for analysis are tabulated as Supplementary Table 3, which was based on availability and matching of samples for the indicated assays at the time of this study.
Nanostring Analysis
RNA from FFPE blocks was extracted using Qiagen AllPrep DNA/RNA FFPE kit according to the manufacturer’s instructions. Briefly, tissue curls were deparaffinized in 1mL of Xylene, vortexed for 10 seconds and spun at 14,000 rpm. The supernatant was then removed without disturbing the pellet and was washed twice with 1mL 100% ETOH. The contents were vortexed and centrifuging between the washes. Large pieces of tissue were ground using a 15ml closed tissue grinder (Fisher). The pellet was resuspended in 150uL of Buffer PKD and 10uL of proteinase K, vortexed and incubated at 56°C for 15 minutes. The tube was subsequently placed in ice for 3 minutes, and then spun 14,000 rpm for 15 minutes. The supernatant was saved for RNA purification. The supernatant was then heated at 80°C for 15 minutes and briefly centrifuged. Buffer RLT was added, contents were vortexed, followed by the addition of 100% ethanol. Contents were vortexed again. The sample was transferred to a RNeasy minElute and were processed according to the manufacturer’s protocol. Purified RNA was analyzed on the Agilent 4200 Tape Station for RIN value and concentration. Prior to loading RNA into Nanostring, RIN values acquired were used in the Nanostring FFPE RNA calculator to approximate the % length of RNA obtained. Transcript profiling was performed using nCounter® PanCancer Immune Profiling Panel55. The counts for each target was processed using the nCounter® Digital Analyzer and nSolver 4.0 software.
Tumor Dissociation
For downstream CyTOF analysis, all tumors were enzymatically dissociated into single cells upon surgical resection. Tumors were minced and dissociated in digestion medium containing 0.1% (w/v) collagenase type IV (Invitrogen) in PBS at 37°C for 30 minutes on a shaking incubator set at 60 rpm. Cell collections were enriched with Percoll 40%−80% (GE Life Sciences) at 2000 × g for 25 minutes at RT without break, eliminating debris and erythrocytes.
CyTOF Data Acquisition
Suspension mass cytometry (CyTOF) experiments were performed as previously described25. Briefly, for cytokine stimulation, single-cell samples were stimulated using a pre-mixed cocktail of PMA, ionomycin, and brefeldin A (Biolegend) for 2.5 hours at 37°C. All samples were stained for viability using palladium (Sigma) for 5 minutes at RT and quenched with complete RPMI media. Each batch of up to 10 samples were live-cell barcoded using a 5-choose-3 scheme based on CD45 antibodies tagged with 5 different isotopically enriched metals at room temperature (RT) for 10 minutes. Multiplexed batches were Fc blocked (Invitrogen) and then stained with the antibodies purchased from indicated sources and used at described dilutions (Supplementary Table 4). Chemokine receptor stains were performed first at 37°C for 10 minutes followed by all other surface markers at RT for an additional 20 minutes. Intracellular markers were stained with Cytofix/Cytoperm Kit (BD) as per manufacturer’s protocol. Stained cells were fixed with 1.6% paraformaldehyde (ThermoFisher) in PBS and stored up to 1 week at 4°C. On the day before data acquisition, all cells were stained with rhodium Cell-ID (Fluidigm). All data was acquired using Helios™ at University of Maryland School of Medicine Center for Innovative Biomedical Resources Flow Cytometry and Mass Cytometry Core Facility, Baltimore, Maryland.
CyTOF Data Analysis
CyTOF data analysis was performed as previously described25. Briefly, preprocessing (randomization, bead normalization, bead removal of data) was performed in CyTOF software (Fluidigm®) v6.7 followed by gating of cell events (rhodium vs. cell length signal) that are viable (106Pd vs. 108Pd) in FlowJo (BD) v10.5. Debarcoding was carried out by hierarchal gating for the three positive and two negative metal-labeled CD45 mAbs. For all CyTOF analyses, a computational pipeline based on diffcyt56 was employed using R. For unsupervised clustering, the FlowSOM algorithm28 was used to identify meta-clusters that were then annotated and merged into final cell subtypes based on published literature57,58. Clustering was visualized using an expression profile heatmap and two-dimensional uniform manifold approximation and projection (UMAP) dimensionality reduction algorithm59.
Imaging Mass Cytometry Data Acquisition
A tissue microarray (TMA) containing 39 cores, each 0.6 mm in diameter, were constructed; 37 of which were representative of the 12 post-treatment FFPE surgical samples based on pathologist review (RAA). For 11 of 12 samples, 3 representative cores were selected, and for one of the samples, 4 representative cores were selected. Whenever feasible, selected regions from each patient sample included two distinct tumor areas and a stroma-rich region. The correlation among the three representative cores from each patient sample was confirmed post-hoc. A normal tonsil and liver cores from a de-identified reference tissue archive at the Johns Hopkins Oncology Tissue Services were included in the TMA as controls. The TMA was dewaxed in xylene and rehydrated in an alcohol gradient. After antigen retrieval, using Antigen Retrieval Agent pH 9 (Agilent® S2367) at 96°C for 30 minutes, the slide was blocked with 3% BSA in PBS for 45 minutes at RT followed by an overnight stain at 4°C with the antibody cocktail listed in Supplementary Table 5. Cell-ID™ Intercalator-Ir (Fluidigm PN 201192A) was used for DNA labeling. Images were acquired using a Hyperion Imaging System (Fluidigm).
Imaging Mass Cytometry Data Analysis
For each core, images highlighting the nuclei based on Ir191 and Ir193, and the plasma membranes based on the IMC Cell Segmentation Kit (Fluidigm) were generated and exported using MCD™ Viewer (Fluidigm). Cell event probability maps based on the nuclei were created by applying pixel classification onto all of the images in Ilastik60. The resulting nuclei probability maps and the plasma membrane images were incorporated into CellProfiler v.3.1.861. To identify primary and secondary objects, resulting objects were converted to single-cell masks in uint16 format. Overlaying the single-cell masks onto the cores allowed for the extraction of per-cell spatial parameters and signal intensities of the cell markers. To improve the signal-to-noise ratio, all images for every channel were processed by automated LUT-enhancement using ImageJ (NIH) prior to single-cell data extraction. Finally, to remove artifacts related to antibody aggregates, cell events were gated using FlowJo™ (BD) using a biaxial plot for Histone H3 vs. Ir191 intensities. The resulting 59,453 single cells were then clustered using FlowSOM28 into metaclusters, which were then annotated into final cell types. Voronoi tessellations were performed using ggvoronoi package. Top neighbor analysis was based on the use of CellProfiler function to identify top two neighboring cells for every cell. By aggregating the top neighboring cell type data, a heatmap was generated. Simplified spatial networks specific to response criteria were generated using minimum spanning tree algorithm in igraph based on the shortest Euclidean distances from any given cell to all other cell types within responder or non-responder cores only. For response classification prediction, all immune cells were selected except for especially rare subsets (<10 cells within a response criteria). The selected predictor variables comprised the dimensions of each cell and the minimum distance from each other immune cell type. Cells missing values for any predictor were removed, leaving a subset of 9,154 cells. This was used to perform random forest modeling with the ranger package in R, using 80% of the data for training. Subset analysis was performed for each cell type. Importance analysis was conducted based on Gini impurity statistics62. A subset of the dataset containing only the distances between the immune cell types was used.
Immunohistochemistry
Automated Immunohistochemistry (IHC) staining was performed on the Leica Bond RX (Leica Biosystems) for CD3, CD8, CD20, CD138, and IgA. Briefly, 4μm-thick sections were cut from one formalin-fixed paraffin-embedded (FFPE) specimen and mounted on glass slides. Slides were baked and deparaffinized, followed by antigen retrieval. Primary antibodies were added at concentrations listed in Supplementary Table 6 after the block of endogenous peroxidase and non-specific binding proteins. Signals were developed by using the Bond Polymer Refine Kit (Leica Biosystems) online or the Tyramide Signal Amplification (TSA) system (PerkinElmer) offline with a counterstain step. Slides were scanned at a 20x objective equivalent (0.49 microns/pixel) with full slide scanner (Nano Zoomer, Hamamatsu). Each image was annotated for tumor and non-tumor regions by the study pathologist (RAA). Positive signals were detected in each region of non-necrotic tissue by digital analysis (Halo, Indicalab) and reported as density (positive cell number per mm2 tissue area). For the analysis of CD138+ plasma cells, given the cell surface staining of the hepatocytes and reactive bile duct cells upon anti-CD138 staining, manual visual inspection (RAA) and machine learning algorithm (HALO™) were performed to exclude such regions. Tertiary lymphoid aggregates (TLA) are defined histologically at low-powered magnification as tight collections of >100 lymphoid cells as previously described63. For dual CD20 and IgA staining, the sequential dual-stain was performed on the Leica Bond RX (Leica Biosystems). After online baking and wax removal, the slides were heated at 100°C for 20 min using ER1 (AR9961, Leica Biosystems). Endogenous peroxidase was blocked using BLOXALL (SP-6000–100, Vector Labs) for 15 min followed by blocking for nonspecific binding using Protein Block (X090930–2, Agilent) for 15 min. After CD20 incubation, staining was developed adding Powervision Poly-HRP anti-mouse IgG (PV6114, Leica Biosystems) for 10 minutes followed by HIGHDEF yellow (ADI-950–170-0030, Enzo Life Sciences) for 15min. Primary and secondary antibodies were stripped using ER1 at 95C for 20min. BLOXALL and Protein Block were applied again for 15min each, followed by the application of IgA antibody. Staining was developed by adding Powervision Poly-AP anti-mouse IgG (PV6110, Leica Biosystems) for 10 minutes followed by HIGHDEF blue (ADI-950–150-0030, Enzo Life Sciences) for 20min. Slides were counterstained using nuclear fast red (ab246831, abcam) for 5min, dried, mounted and coverslipped using Ecomount (5082832, Biocare Medical).
Plasma Correlate Analysis
Plasma samples were quantified by AssayGate, Inc. AXL and c-MET were tested by ELISA following standard protocols. Briefly, a 96-well microplate precoated with a monoclonal antibody against the target of interest was used to bind and immobilize the target. Biotinylated polyclonal antibody also specific for each target was then used to label the immobilized protein with a streptavidin horseradish peroxidase conjugate. Substrate solution was added to develop a color in proportion to the amount present in the sample. All other correlates were assessed by Luminex multiplex assay, which is a bead-based platform. Each target has a dedicated bead set that binds the protein in the sample and then allows for specific detection by PE-conjugated antibodies. The Luminex bead reader allows for differentiation of each target being measured by bead-specific fluorescence and the quantitation of the target by PE-derived fluorescence.
Statistics and Reproducibility
The clinical trial was a non-randomized, single-arm study for feasibility and safety assessment. Sample size selection for correlative analyses was based on sample availability. No data were excluded from the analyses. Differential expression analysis of normalized transcript counts based on the Nanostring assay was performed using DESeq2 in R64, employing a negative binomial model, with the incorporation of patient-based pairing in the formula. For differential analyses of CyTOF and IMC datasets between responder groups, negative binomial methodology was used for cell type abundance comparisons (edgeR65) and linear modeling was used for comparing mean marker intensities within a cell type and cell-cell distances (limma66). Cell densities quantified by immunohistochemistry were compared by two-tailed unpaired t-test. ELISA comparisons (baseline vs. day 14; baseline vs. day 56) were made using two-sided paired t-tests. For all statistical tests involving multiple comparisons, FDR-adjusted P <0.05 were considered significant.
Data Availability Statement
The CyTOF datasets analyzed in this study have been deposited in FlowRepository (ID: FR-FCM-Z34P; https://flowrepository.org/id/FR-FCM-Z34P). The imaging mass cytometry dataset has been deposited as part of the published Code Ocean capsule (https://doi.org/10.24433/CO.3769407.v2). Source data for this study have been provided as Source Data files. All other data supporting the findings of this study are available from the corresponding author on reasonable request.
Code Availability Statement
The developed code for all of the spatial analyses performed in this study has been published as an executable version on Code Ocean (https://doi.org/10.24433/CO.3769407.v2). The code is distributed under the MIT license https://opensource.org/licenses/MIT.
Extended Data
Extended Data Fig. 1. Cabozantinib induces changes in plasma correlates.
Concentrations (pg/ml) of VEGF-R2, VEGF-C, VEGF-A, c-MET, Angiopoietin-1, Angiopoietin-2, Tie-2, and AXL in longitudinally obtained plasma samples are shown as line graphs. AXL and c-MET are measured by ELISA assays. All other correlates were measured by Luminex multiplex assays. Data representative of two technical replicates. Each line represents an individual patient. Red and blue lines reflect pathologic non-responders and responders, respectively. Indicated are significant FDR-adjusted P values (<0.05, paired two-tailed t-tests).
Extended Data Fig. 2. T cell activation is observed in both Nanostring and CyTOF analysis.
T cell activation is observed in both Nanostring and CyTOF analysis. Pre- vs. post-cabozantinib changes in lymphoid cells, granzyme expression, and expression of IL2, IFNγ, PD1 in T cells are shown for two patients for whom the data was available. Y-axis represents a non-universal unit scale (expression levels for Nanostring and abundance levels or metal intensities for CyTOF) log2-transformed for ease of visualization. Abbreviation: N, naïve; NK, natural killer cells; ns, Nanostring; PB, peripheral blood; TIL, tumor infiltrating leukocytes.
Extended Data Fig. 3. Immunohistochemistry (IHC) analysis of immune cells.
Immunohistochemistry (IHC) analysis of immune cells. a, Each tissue section was manually annotated in image analysis software HALO™ into non-tumor and tumor regions (live, necrosis). b, Density of CD3, CD8, and CD20 in post-treatment surgical samples in the non-tumor regions by IHC (nonresponder, n=4 patients; responder, n=3 patients) (mean±s.d., all P>0.05, unpaired two-tailed t-test). c, Representative staining results of baseline core biopsies (PRE) and post-treatment surgical samples (POST) for CD3, CD8, and CD20 IHC (one patient selected from each group, representative of n=3 nonresponder, n=2 responder paired patient samples; quantitative data shown in panel b).
Extended Data Fig. 4. Workflow for imaging mass cytometry (IMC).
A tissue microarray of 37 cores was constructed from 12 total patients who underwent surgery after neoadjuvant cabozantinib and nivolumab. 5 patients were pathologic responders and 7 patients were nonresponders. This tissue microarray was then stained with a cocktail of metal-conjugated antibodies against 27 markers. Metal intensities from the stained slide are acquired by Hyperion™. The resulting images were evaluated using MCD Viewer™ and then segmented into single cell data using Ilastik and CellProfiler.
Extended Data Fig. 5. Representative IMC data.
a, Representative multicolored images for every core in the tissue microarray constructed from post-treatment surgical samples for aSMA, CD4, CD20, CD8a, and DNA, stratified by response in one set, and aSMA, Vimentin, CD16, E-Cadherin, CD68, and Ki-67, stratified by response in another. b, Abundances of major immune cell types assessed by IMC across the three representative cores from non-responder (NR) and responder (R) patient samples are shown.
Extended Data Fig. 6. Combination of cabozantinib and nivolumab promotes local T cell responses.
a, Six post-treatment surgical samples were enzymatically dissociated into single-cell tumor infiltrating leukocytes and were assayed by a 27-marker CyTOF panel dedicated to phenotyping T cells. FlowSOM algorithm was employed to generate 40 metaclusters which were annotated into 21 final clusters. Scaled expression profile for each of the clusters are shown in the heatmap and UMAP. b, Stacked bar plots show immune cell subtype distribution at the single cell level for non-responder (NR, n=79939 cells) and responder (R, n=25086 cells) samples. ***P<2.2e-16 (Chi-squared). c, Abundance of each subtype as a percentage of CD45 cells for each patient sample. Abbreviations: DNT, double-negative T; DPT, double-positive T; EFF, effector; EM, effector memory; EX, exhaustion marker positive; N, naïve; NK, natural killer; UA, unassigned. d, Comparison of CD8 T cell quantification by CyTOF, IMC, and IHC.
Extended Data Fig. 7. Combination of cabozantinib and nivolumab promotes systemic T cell responses.
a, PBMCs from eight paired pre- and post-treatment samples were assayed by a 27-marker CyTOF panel dedicated to phenotyping T cells. FlowSOM algorithm was employed to generate 30 metaclusters which were then annotated into 23 final clusters. Scaled expression profile for each of the clusters are shown in the heatmap. b, Radar plot showing average fold changes for the abundance of every T cell subtype. Color legends apply to both panels A and B. P-values (edgeR) are annotated. Abbreviations: CM, central memory, DNT, double-negative T; DPT, double-positive T; Eff, effector; EM, effector memory; EX, exhaustion marker positive; N, naïve; NK, natural killer; UA, unassigned.
Extended Data Fig. 8. Treatment alters levels of immunomodulatory chemokines in plasma.
Concentrations (pg/ml) of MIG (CXCL9), IP-10 (CXCL10), I-TAC (CXCL11), MCP-1 (CCL2), Eotaxin-3 (CCL26), Rantes (CCL5), MCP-2 (CCL8), and MIP-1a (CCL3) in longitudinally obtained plasma samples are shown as line graphs. All correlates were measured by Luminex multiplex assays. Data representative of two technical replicates. Each line represents an individual patient. Red and blue lines reflect pathologic non-responders and responders, respectively. All comparisons not statistically significant by FDR-adjusted P values (<0.05 considered significant, paired two-tailed t-tests).
Extended Data Fig. 9. B cells indirectly contribute to antitumor immune response.
a, Results from immunohistochemistry of CD138 in nonresponders (NR) and responders (R) for tumor regions (left; NR, n=7; R, n=5 patients) and non-tumor regions (right; NR, n=4; R, n=5). Data represented as mean±s.d.; P values based on unpaired two-tailed t-test. b, Representative dual CD20-IgA staining result of a responder patient (left) and a positive control tonsil tissue (right). Image selected from one of five responder patient. c, Violin plots of per-cell metal intensities for CCR7, TNFα, IL2, and IFNγ in NR vs. R samples measured by CyTOF (NR, n=2789 cells; R, n=1593 cells). Indicated are FDR-adjusted P values (linear modeling). d, Violin plot (left) of per-cell granzyme B (GZMB) metal intensity in NR (n=2789 cells) vs. R (n=1593 cells). FDR-adjusted P value (linear modeling). Representative multicolored image of IMC in a responder core exhibiting a tertiary lymphoid aggregate with a prominent focus of B cells along with CD3, HLADR, and granzyme B expression. Image selected from one of 15 responder cores.
Supplementary Material
Acknowledgements
We thank the patients and their families who participated in this research and the clinical and laboratory research teams. We also acknowledge Dr. Evelyn Wang, PhD, Dr. Ayanna Cooper, PhD, Steve Isibor, Pharm.D. for helpful discussions and technical assistance. We also acknowledge University of Maryland School of Medicine Center for Innovative Biomedical Resources Flow Cytometry and Mass Cytometry Core Facility, Baltimore, Maryland for their services with CyTOF data collection, and the support of Therapeutics Insights Services at Fluidigm for IMC data collection. Finally, we acknowledge support from the Emerson Collective Cancer Research Fund 640183 (E.M.J.), the NCI Specialized Program of Research Excellence in Gastrointestinal Cancers P50CA062924 (E.M.J.), the NCI Informatics Technologies for Cancer Research U01CA212007 (E.J.F.), the NIH Multiscale Modeling Consortium U01CA212007 (E.J.F.), Exelixis (M.Y.), Bristol Myers Squibb (M.Y.), as well as the NIH Center Core Grant P30CA006973 and Johns Hopkins Bloomberg-Kimmel Institute for Cancer Immunotherapy.
W.H. is a co-inventor of patents with potential for receiving royalties from Rodeo Therapeutics, is a consultant for Exelixis, and receives research funding from Sanofi. R.A.A. reports receiving a commercial research support from Bristol-Myers Squibb and is a consultant/advisory board member for Bristol-Myers Squibb, Merck, AstraZeneca, Incyte and RAPT Therapeutics. E.M.J. reports receiving a commercial research grant from Bristol-Myers Squibb and Aduro Biotech, and is a consultant/advisory board member for Lustgarten Foundation, Parker Institute for Cancer Immunotherapy, CStone, Dragonfly, Genocea, Achilles and Adaptive Biotechnologies, and Co-Founder of Abmeta Biotech. M.Y. reports receiving research grants from Incyte, Bristol-Myers Squibb, and Exelixis, and is a consultant for AstraZeneca, Eisai, Exelixis, and Genentech.
Footnotes
Competing Interests
The remaining authors declare no competing interests.
References
- 1.Park J-W et al. Global patterns of hepatocellular carcinoma management from diagnosis to death: the BRIDGE Study. Liver Int. 35, 2155–2166 (2015). [DOI] [PMC free article] [PubMed] [Google Scholar]
- 2.Yang JD et al. A global view of hepatocellular carcinoma: trends, risk, prevention and management. Nature Reviews Gastroenterology and Hepatology vol. 16 589–604 (2019). [DOI] [PMC free article] [PubMed] [Google Scholar]
- 3.Siegel RL, Miller KD & Jemal A. Cancer statistics, 2020. CA. Cancer J. Clin 70, 7–30 (2020). [DOI] [PubMed] [Google Scholar]
- 4.Tobe T. et al. Primary liver cancer in Japan. Clinicopathologic features and results of surgical treatment. Ann. Surg 211, 277–287 (1990). [PMC free article] [PubMed] [Google Scholar]
- 5.Parker GA et al. Intraoperative ultrasound of the liver affects operative decision making. Ann. Surg 209, 569–577 (1989). [DOI] [PMC free article] [PubMed] [Google Scholar]
- 6.Fong Y, Sun RL, Jarnagin W. & Blumgart LH An analysis of 412 cases of hepatocellular carcinoma at a Western center. in Annals of Surgery vol. 229 790–800 (Lippincott, Williams, and Wilkins, 1999). [DOI] [PMC free article] [PubMed] [Google Scholar]
- 7.Minagawa M, Ikai I, Matsuyama Y, Yamaoka Y. & Makuuchi M. Staging of hepatocellular carcinoma: Assessment of the Japanese TNM and AJCC/UICC TNM systems in a cohort of 13,772 patients in Japan. Ann. Surg 245, 909–922 (2007). [DOI] [PMC free article] [PubMed] [Google Scholar]
- 8.Belghiti J, Panis Y, Farges O, Benhamou JP & Fekete F. Intrahepatic recurrence after resection of hepatocellular carcinoma complicating cirrhosis. Ann. Surg 214, 114–7 (1991). [DOI] [PMC free article] [PubMed] [Google Scholar]
- 9.Chen MF et al. Postoperative recurrence of hepatocellular carcinoma. Two hundred five consecutive patients who underwent hepatic resection in 15 years. Arch. Surg 129, 738–42 (1994). [DOI] [PubMed] [Google Scholar]
- 10.Tabrizian P, Jibara G, Shrager B, Schwartz M. & Roayaie S. Recurrence of Hepatocellular Cancer After Resection. Ann. Surg 261, 947–955 (2015). [DOI] [PubMed] [Google Scholar]
- 11.Llovet JM et al. Sorafenib in advanced hepatocellular carcinoma. N. Engl. J. Med 359, 378–390 (2008). [DOI] [PubMed] [Google Scholar]
- 12.Bruix J. et al. Adjuvant sorafenib for hepatocellular carcinoma after resection or ablation (STORM): A phase 3, randomised, double-blind, placebo-controlled trial. Lancet Oncol. 16, 1344–1354 (2015). [DOI] [PubMed] [Google Scholar]
- 13.Adachi E. et al. Effects of preoperative transcatheter hepatic arterial chemoembolization for hepatocellular carcinoma. The relationship between postoperative course and tumor necrosis. Cancer 72, 3593–3598 (1993). [DOI] [PubMed] [Google Scholar]
- 14.Uchida M. et al. Role of preoperative transcatheter arterial oily chemoembolization for resectable hepatocellular carcinoma. World J. Surg 20, 326–331 (1996). [DOI] [PubMed] [Google Scholar]
- 15.Lee KT et al. The effect of preoperative transarterial chemoembolization of resectable hepatocellular carcinoma on clinical and economic outcomes. J. Surg. Oncol 99, 343–350 (2009). [DOI] [PubMed] [Google Scholar]
- 16.Wu C. ‐C et al. Preoperative transcatheter arterial chemoembolization for resectable large hepatocellular carcinoma: A reappraisal. Br. J. Surg 82, 122–126 (1995). [DOI] [PubMed] [Google Scholar]
- 17.Sasaki A. et al. Preoperative transcatheter arterial chemoembolization reduces long-term survival rate after hepatic resection for resectable hepatocellular carcinoma. Eur. J. Surg. Oncol 32, 773–779 (2006). [DOI] [PubMed] [Google Scholar]
- 18.Yarchoan M. et al. Recent Developments and Therapeutic Strategies against Hepatocellular Carcinoma. Cancer Res. 79, 4326–4330 (2019). [DOI] [PMC free article] [PubMed] [Google Scholar]
- 19.Pinato DJ et al. Immune-based therapies for hepatocellular carcinoma. Oncogene vol. 39 3620–3637 (2020). [DOI] [PMC free article] [PubMed] [Google Scholar]
- 20.Abou-Alfa GK et al. Cabozantinib in patients with advanced and progressing hepatocellular carcinoma. N. Engl. J. Med 379, 54–63 (2018). [DOI] [PMC free article] [PubMed] [Google Scholar]
- 21.Kudo M. Scientific rationale for combined immunotherapy with PD-1/PD-L1 antibodies and vegf inhibitors in advanced hepatocellular carcinoma. Cancers (Basel). 12, (2020). [DOI] [PMC free article] [PubMed] [Google Scholar]
- 22.Yi M. et al. Synergistic effect of immune checkpoint blockade and anti-angiogenesis in cancer treatment. Molecular Cancer vol. 18 (2019). [DOI] [PMC free article] [PubMed] [Google Scholar]
- 23.Finn RS et al. Atezolizumab plus bevacizumab in unresectable hepatocellular carcinoma. N. Engl. J. Med 382, 1894–1905 (2020). [DOI] [PubMed] [Google Scholar]
- 24.Yau T. et al. Nivolumab (NIVO) + ipilimumab (IPI) + cabozantinib (CABO) combination therapy in patients (pts) with advanced hepatocellular carcinoma (aHCC): Results from CheckMate 040. J. Clin. Oncol 38, 478–478 (2020). [Google Scholar]
- 25.Ho WJ et al. Viral status, immune microenvironment and immunological response to checkpoint inhibitors in hepatocellular carcinoma. J. Immunother. Cancer 8, e000394 (2020). [DOI] [PMC free article] [PubMed] [Google Scholar]
- 26.Goyal L. et al. A phase 2 and biomarker study of cabozantinib in patients with advanced cholangiocarcinoma. Cancer 123, 1979–1988 (2017). [DOI] [PMC free article] [PubMed] [Google Scholar]
- 27.Leibowitz-Amit R. et al. Changes in plasma biomarkers following treatment with cabozantinib in metastatic castration-resistant prostate cancer: A post hoc analysis of an extension cohort of a phase II trial. J. Transl. Med 14, (2016). [DOI] [PMC free article] [PubMed] [Google Scholar]
- 28.Van Gassen S. et al. FlowSOM: Using self-organizing maps for visualization and interpretation of cytometry data. Cytom. Part A 87, 636–645 (2015). [DOI] [PubMed] [Google Scholar]
- 29.Tokunaga R. et al. CXCL9, CXCL10, CXCL11/CXCR3 axis for immune activation – A target for novel cancer therapy. Cancer Treatment Reviews vol. 63 40–47 (2018). [DOI] [PMC free article] [PubMed] [Google Scholar]
- 30.Gregory JL et al. Macrophage Migration Inhibitory Factor Induces Macrophage Recruitment via CC Chemokine Ligand 2. J. Immunol 177, 8072–8079 (2006). [DOI] [PubMed] [Google Scholar]
- 31.Zhao L. et al. Recruitment of a myeloid cell subset (CD11b/Gr1mid) via CCL2/CCR2 promotes the development of colorectal cancer liver metastasis. Hepatology 57, 829–839 (2013). [DOI] [PubMed] [Google Scholar]
- 32.Lan Q. et al. CCL26 participates in the PRL-3-induced promotion of colorectal cancer invasion by stimulating tumor-associated macrophage infiltration. Mol. Cancer Ther 17, 276–289 (2018). [DOI] [PubMed] [Google Scholar]
- 33.Shalapour S. et al. Inflammation-induced IgA+ cells dismantle anti-liver cancer immunity. Nature 551, 340–345 (2017). [DOI] [PMC free article] [PubMed] [Google Scholar]
- 34.Förster R. et al. CCR7 coordinates the primary immune response by establishing functional microenvironments in secondary lymphoid organs. Cell 99, 23–33 (1999). [DOI] [PubMed] [Google Scholar]
- 35.Tumanov AV et al. Cellular source and molecular form of TNF specify its distinct functions in organization of secondary lymphoid organs. Blood 116, 3456–3464 (2010). [DOI] [PMC free article] [PubMed] [Google Scholar]
- 36.Boussiotis VA, Nadler LM, Strominger JL & Goldfeld AE Tumor necrosis factor α is an autocrine growth factor for normal human B cells. Proc. Natl. Acad. Sci. U. S. A 91, 7007–7011 (1994). [DOI] [PMC free article] [PubMed] [Google Scholar]
- 37.Li J. et al. Tumor Cell-Intrinsic Factors Underlie Heterogeneity of Immune Cell Infiltration and Response to Immunotherapy. Immunity 49, 178–193.e7 (2018). [DOI] [PMC free article] [PubMed] [Google Scholar]
- 38.Theivanthiran B. et al. A tumor-intrinsic PD-L1/NLRP3 inflammasome signaling pathway drives resistance to anti-PD-1 immunotherapy. J. Clin. Invest 130, 2570–2586 (2020). [DOI] [PMC free article] [PubMed] [Google Scholar]
- 39.Wei ZW et al. CXCL1 promotes tumor growth through VEGF pathway activation and is associated with inferior survival in gastric cancer. Cancer Lett. 359, 335–343 (2015). [DOI] [PubMed] [Google Scholar]
- 40.Scapini P. et al. CXCL1/Macrophage Inflammatory Protein-2-Induced Angiogenesis In Vivo Is Mediated by Neutrophil-Derived Vascular Endothelial Growth Factor-A. J. Immunol 172, 5034–5040 (2004). [DOI] [PubMed] [Google Scholar]
- 41.Wang D, Sun H, Wei J, Cen B. & DuBois RN CXCL1 is critical for premetastatic niche formation and metastasis in colorectal cancer. Cancer Res. 77, 3655–3665 (2017). [DOI] [PMC free article] [PubMed] [Google Scholar]
- 42.Kaseb A. et al. Randomized, open-label, perioperative phase II study evaluating nivolumab alone versus nivolumab plus ipilimumab in patients with resectable HCC. Ann. Oncol 30, iv112 (2019). [Google Scholar]
- 43.Topalian SL, Taube JM & Pardoll DM Neoadjuvant checkpoint blockade for cancer immunotherapy. Science vol. 367 (2020). [DOI] [PMC free article] [PubMed] [Google Scholar]
- 44.Helmink BA et al. B cells and tertiary lymphoid structures promote immunotherapy response. Nature 577, 549–555 (2020). [DOI] [PMC free article] [PubMed] [Google Scholar]
- 45.Cabrita R. et al. Tertiary lymphoid structures improve immunotherapy and survival in melanoma. Nature 577, 561–565 (2020). [DOI] [PubMed] [Google Scholar]
- 46.Petitprez F. et al. B cells are associated with survival and immunotherapy response in sarcoma. Nature 577, 556–560 (2020). [DOI] [PubMed] [Google Scholar]
- 47.Lund FE Cytokine-producing B lymphocytes-key regulators of immunity. Curr. Opin. Immunol 20, 332–8 (2008). [DOI] [PMC free article] [PubMed] [Google Scholar]
- 48.Yan J, Harvey BP, Gee RJ, Shlomchik MJ & Mamula MJ B cells drive early T cell autoimmunity in vivo prior to dendritic cell-mediated autoantigen presentation. J. Immunol 177, 4481–7 (2006). [DOI] [PubMed] [Google Scholar]
- 49.El-Khoueiry AB et al. Nivolumab in patients with advanced hepatocellular carcinoma (CheckMate 040): an open-label, non-comparative, phase 1/2 dose escalation and expansion trial. Lancet (2017) doi: 10.1016/S0140-6736(17)31046-2. [DOI] [PMC free article] [PubMed]
- 50.Liu Y. et al. Immune cell PD-L1 colocalizes with macrophages and is associated with outcome in PD-1 pathway blockade therapy. Clin. Cancer Res 26, 970–977 (2020). [DOI] [PMC free article] [PubMed] [Google Scholar]
- 51.Giurisato E. et al. Extracellular-Regulated Protein Kinase 5-Mediated Control of p21 Expression Promotes Macrophage Proliferation Associated with Tumor Growth and Metastasis. Cancer Res. 80, 3319–3330 (2020). [DOI] [PMC free article] [PubMed] [Google Scholar]
- 52.Lane RS et al. IFNγ-activated dermal lymphatic vessels inhibit cytotoxic T cells in melanoma and inflamed skin. J. Exp. Med 215, 3057–3074 (2018). [DOI] [PMC free article] [PubMed] [Google Scholar]
- 53.Tang H. et al. PD-L1 on host cells is essential for PD-L1 blockade–mediated tumor regression. J. Clin. Invest 128, 580–588 (2018). [DOI] [PMC free article] [PubMed] [Google Scholar]
- 54.Rodriguez PC et al. Arginase I production in the tumor microenvironment by mature myeloid cells inhibits T-cell receptor expression and antigen-specific T-cell responses. Cancer Res. 64, 5839–5849 (2004). [DOI] [PubMed] [Google Scholar]
Methods-only References
- 55.Cesano A. nCounter® PanCancer Immune Profiling Panel (NanoString Technologies, Inc., Seattle, WA). J. Immunother. Cancer 3, (2015). [DOI] [PMC free article] [PubMed] [Google Scholar]
- 56.Weber LM, Nowicka M, Soneson C. & Robinson MD diffcyt: Differential discovery in high-dimensional cytometry via high-resolution clustering. Commun. Biol 2, (2019). [DOI] [PMC free article] [PubMed] [Google Scholar]
- 57.Mahnke YD, Brodie TM, Sallusto F, Roederer M. & Lugli E. The who’s who of T-cell differentiation: Human memory T-cell subsets. European Journal of Immunology vol. 43 2797–2809 (2013). [DOI] [PubMed] [Google Scholar]
- 58.Hartmann FJ et al. Comprehensive Immune Monitoring of Clinical Trials to Advance Human Immunotherapy. Cell Rep. 28, 819–831.e4 (2019). [DOI] [PMC free article] [PubMed] [Google Scholar]
- 59.Becht E. et al. Dimensionality reduction for visualizing single-cell data using UMAP. Nat. Biotechnol 37, 38–47 (2019). [DOI] [PubMed] [Google Scholar]
- 60.Berg S. et al. ilastik: interactive machine learning for (bio)image analysis. Nat. Methods 16, 1226–1232 (2019). [DOI] [PubMed] [Google Scholar]
- 61.Carpenter AE et al. CellProfiler: Image analysis software for identifying and quantifying cell phenotypes. Genome Biol. 7, (2006). [DOI] [PMC free article] [PubMed] [Google Scholar]
- 62.Nembrini S, König IR & Wright MN The revival of the Gini importance? Bioinformatics 34, 3711–3718 (2018). [DOI] [PMC free article] [PubMed] [Google Scholar]
- 63.Taube JM et al. Association of PD-1, PD-1 ligands, and other features of the tumor immune microenvironment with response to anti-PD-1 therapy. Clin. Cancer Res 20, 5064–5074 (2014). [DOI] [PMC free article] [PubMed] [Google Scholar]
- 64.Love MI, Huber W. & Anders S. Moderated estimation of fold change and dispersion for RNA-seq data with DESeq2. Genome Biol. 15, 550 (2014). [DOI] [PMC free article] [PubMed] [Google Scholar]
- 65.Robinson MD, McCarthy DJ & Smyth GK edgeR: A Bioconductor package for differential expression analysis of digital gene expression data. Bioinformatics 26, 139–140 (2009). [DOI] [PMC free article] [PubMed] [Google Scholar]
- 66.Ritchie ME et al. limma powers differential expression analyses for RNA-sequencing and microarray studies. Nucleic Acids Res. 43, e47–e47 (2015). [DOI] [PMC free article] [PubMed] [Google Scholar]
Associated Data
This section collects any data citations, data availability statements, or supplementary materials included in this article.
Supplementary Materials
Data Availability Statement
The CyTOF datasets analyzed in this study have been deposited in FlowRepository (ID: FR-FCM-Z34P; https://flowrepository.org/id/FR-FCM-Z34P). The imaging mass cytometry dataset has been deposited as part of the published Code Ocean capsule (https://doi.org/10.24433/CO.3769407.v2). Source data for this study have been provided as Source Data files. All other data supporting the findings of this study are available from the corresponding author on reasonable request.


