Abstract
DNA methylation, a key epigenetic driver of transcriptional silencing, is universally dysregulated in cancer. Reversal of DNA methylation by hypomethylating agents, such as the cytidine analogs decitabine or azacytidine, has demonstrated clinical benefit in hematologic malignancies. These nucleoside analogs are incorporated into replicating DNA where they inhibit DNA cytosine methyltransferases DNMT1, DNMT3A and DNMT3B through irreversible covalent interactions. These agents induce notable toxicity to normal blood cells thus limiting their clinical doses. Herein we report the discovery of GSK3685032, a potent first-in-class DNMT1-selective inhibitor that was shown via crystallographic studies to compete with the active-site loop of DNMT1 for penetration into hemi-methylated DNA between two CpG base pairs. GSK3685032 induces robust loss of DNA methylation, transcriptional activation and cancer cell growth inhibition in vitro. Due to improved in vivo tolerability compared with decitabine, GSK3685032 yields superior tumor regression and survival mouse models of acute myeloid leukemia.
DNA methylation is an epigenetic modification that contributes to transcriptional regulation during normal development. The DNA methyltransferase (DNMT) family is comprised of the catalytically active DNMT1, DNMT3A, and DNMT3B, which methylate cytosines within CpG dinucleotides, as well as DNMT3L, which lacks catalytic activity and serves as a regulatory factor. Using S-adenosyl-l-methionine (SAM) as the methyl donor, DNMT3A and −3B establish the DNA methylation pattern de novo while DNMT1 is primarily responsible for propagation of this methylation pattern to daughter strands following DNA replication1–3. Thus, DNMT1 preferentially binds to and methylates DNA containing a hemi-methylated CpG dinucleotide.
In human cancers, DNA methylation is universally dysregulated leading to focal hypermethylation and subsequent transcriptional silencing of CpG island-associated gene promoters4–6. The reversibility of these epigenetic modifications makes targeting DNMTs an attractive strategy for the treatment of cancer. Indeed, traditional DNA hypomethylating agents (HMAs) such as decitabine (DAC) and azacytidine (AZA) have shown clinical benefit for the treatment of hematologic malignancies. These HMAs, first synthesized over 50 years ago7, were linked to DNA methylation8 in the 1980s and obtained regulatory approval in the early 2000s for the treatment of myelodysplastic syndrome, acute myeloid leukemia (AML) and chronic myelomonocytic leukemia9–12. Despite this initial success, there is notable room for improvement. Mechanistically, these nucleoside analogs resemble cytidine and are incorporated into DNA where they covalently trap DNMT1, −3A and −3B to DNA resulting in DNA damage and dose-limiting toxicities13–16. These compounds also suffer from chemical instability and exhibit poor pharmacokinetic properties, leading to limited target engagement in peripheral tissues16,17. These combined properties may limit the clinical potential of current HMAs, highlighting a need for a DNA methylation inhibitor with improved pharmacological properties and decreased toxicity.
While several groups have identified noncovalent small-molecule DNMT inhibitors, none of these inhibitors effectively combine potency, selectivity and translatability between in vitro and in vivo activity. RG-108 was one of the first non-nucleoside DNMT inhibitors reported to show potent inhibition of the bacterial M.SssI CpG DNMT (half maximal inhibitory concentration (IC50) = 0.012 μM)18,19; however, a later report revealed a substantial reduction in potency when tested against human DNMT1 (half maximal effective concentration (EC50) = 390 μM)20. Quinoline-based derivatives, such as SGI-1027 and its regioisomer MC3343, contained low μM activity against both DNMT1 and −3A with no reported DNMT3B data20–23. In addition to changes in cellular growth and DNA methylation levels, MC3343 also showed some delay in tumor growth in vivo when tested against an osteosarcoma patient-derived xenograft20.
Herein we report the identification of small molecules that potently and reversibly inhibit DNMT1 without affecting the de novo DNMTs (DNMT3A and DNMT3B). These DNMT1-selective inhibitors elicit various cellular responses including robust DNA hypomethylation, up-regulation of many messenger RNAs and endogenous retroviruses, differentiation, and inhibition of cancer cell growth. Furthermore, due to improved in vivo tolerability compared with DAC, GSK3685032 achieves greater DNA hypomethylation in leukemic tumor models leading to tumor regression and improved survival in both subcutaneous and disseminated mouse models of AML. These data demonstrate that selective, noncovalent inhibitors of DNMT1 may provide benefit in the clinic over traditional HMAs.
Results
Discovery of DNMT1-selective inhibitors.
A high-throughput enzymatic activity assay was utilized to screen over 1.8 million small molecules for their ability to inhibit DNMT1 (Supplementary Data Table 1). This assay monitored the activity of truncated DNMT1 (601–1600) using a scintillation proximity assay (SPA) that measured the transfer of a [3H]-methyl group from the methyl donor 3H-SAM to a cytidine contained within a hemi-methylated DNA substrate. Single-shot actives (30% inhibition at 10 μM) progressed to full curve confirmation. Compounds with an IC50 <100 μM in the primary assay were triaged for nuisance mechanisms (such as assay interference and nonspecific DNA binding) and evaluated using an orthogonal fluorescence-coupled breaklight assay employing full-length DNMT. This led to the identification of GW623415X (Supplementary Data Table 2). GSK3484862, derived from GW623415X, potently inhibited DNMT1 enzymatic activity (IC50 = 0.23 ± 0.02 μM, n = 34), but showed no inhibition of the family members DNMT3A/3L and DNMT3B/3L, or the assay coupling enzyme Gla1 when tested up to 50 μM (Fig. 1a,b; Gla1 IC50 > 50 μM, n = 40). This compound was chemically stable, did not bind DNA nonspecifically, and resulted in rapidly reversible inhibition of DNMT1 (Extended Data Fig. 1a–c). This suggests that GSK3484862 does not covalently bind DNMT1, making it mechanistically distinct from traditional DNA HMAs.
Fig. 1 |. Biochemical and cellular engagement of DNMT1 by GSK3484862.
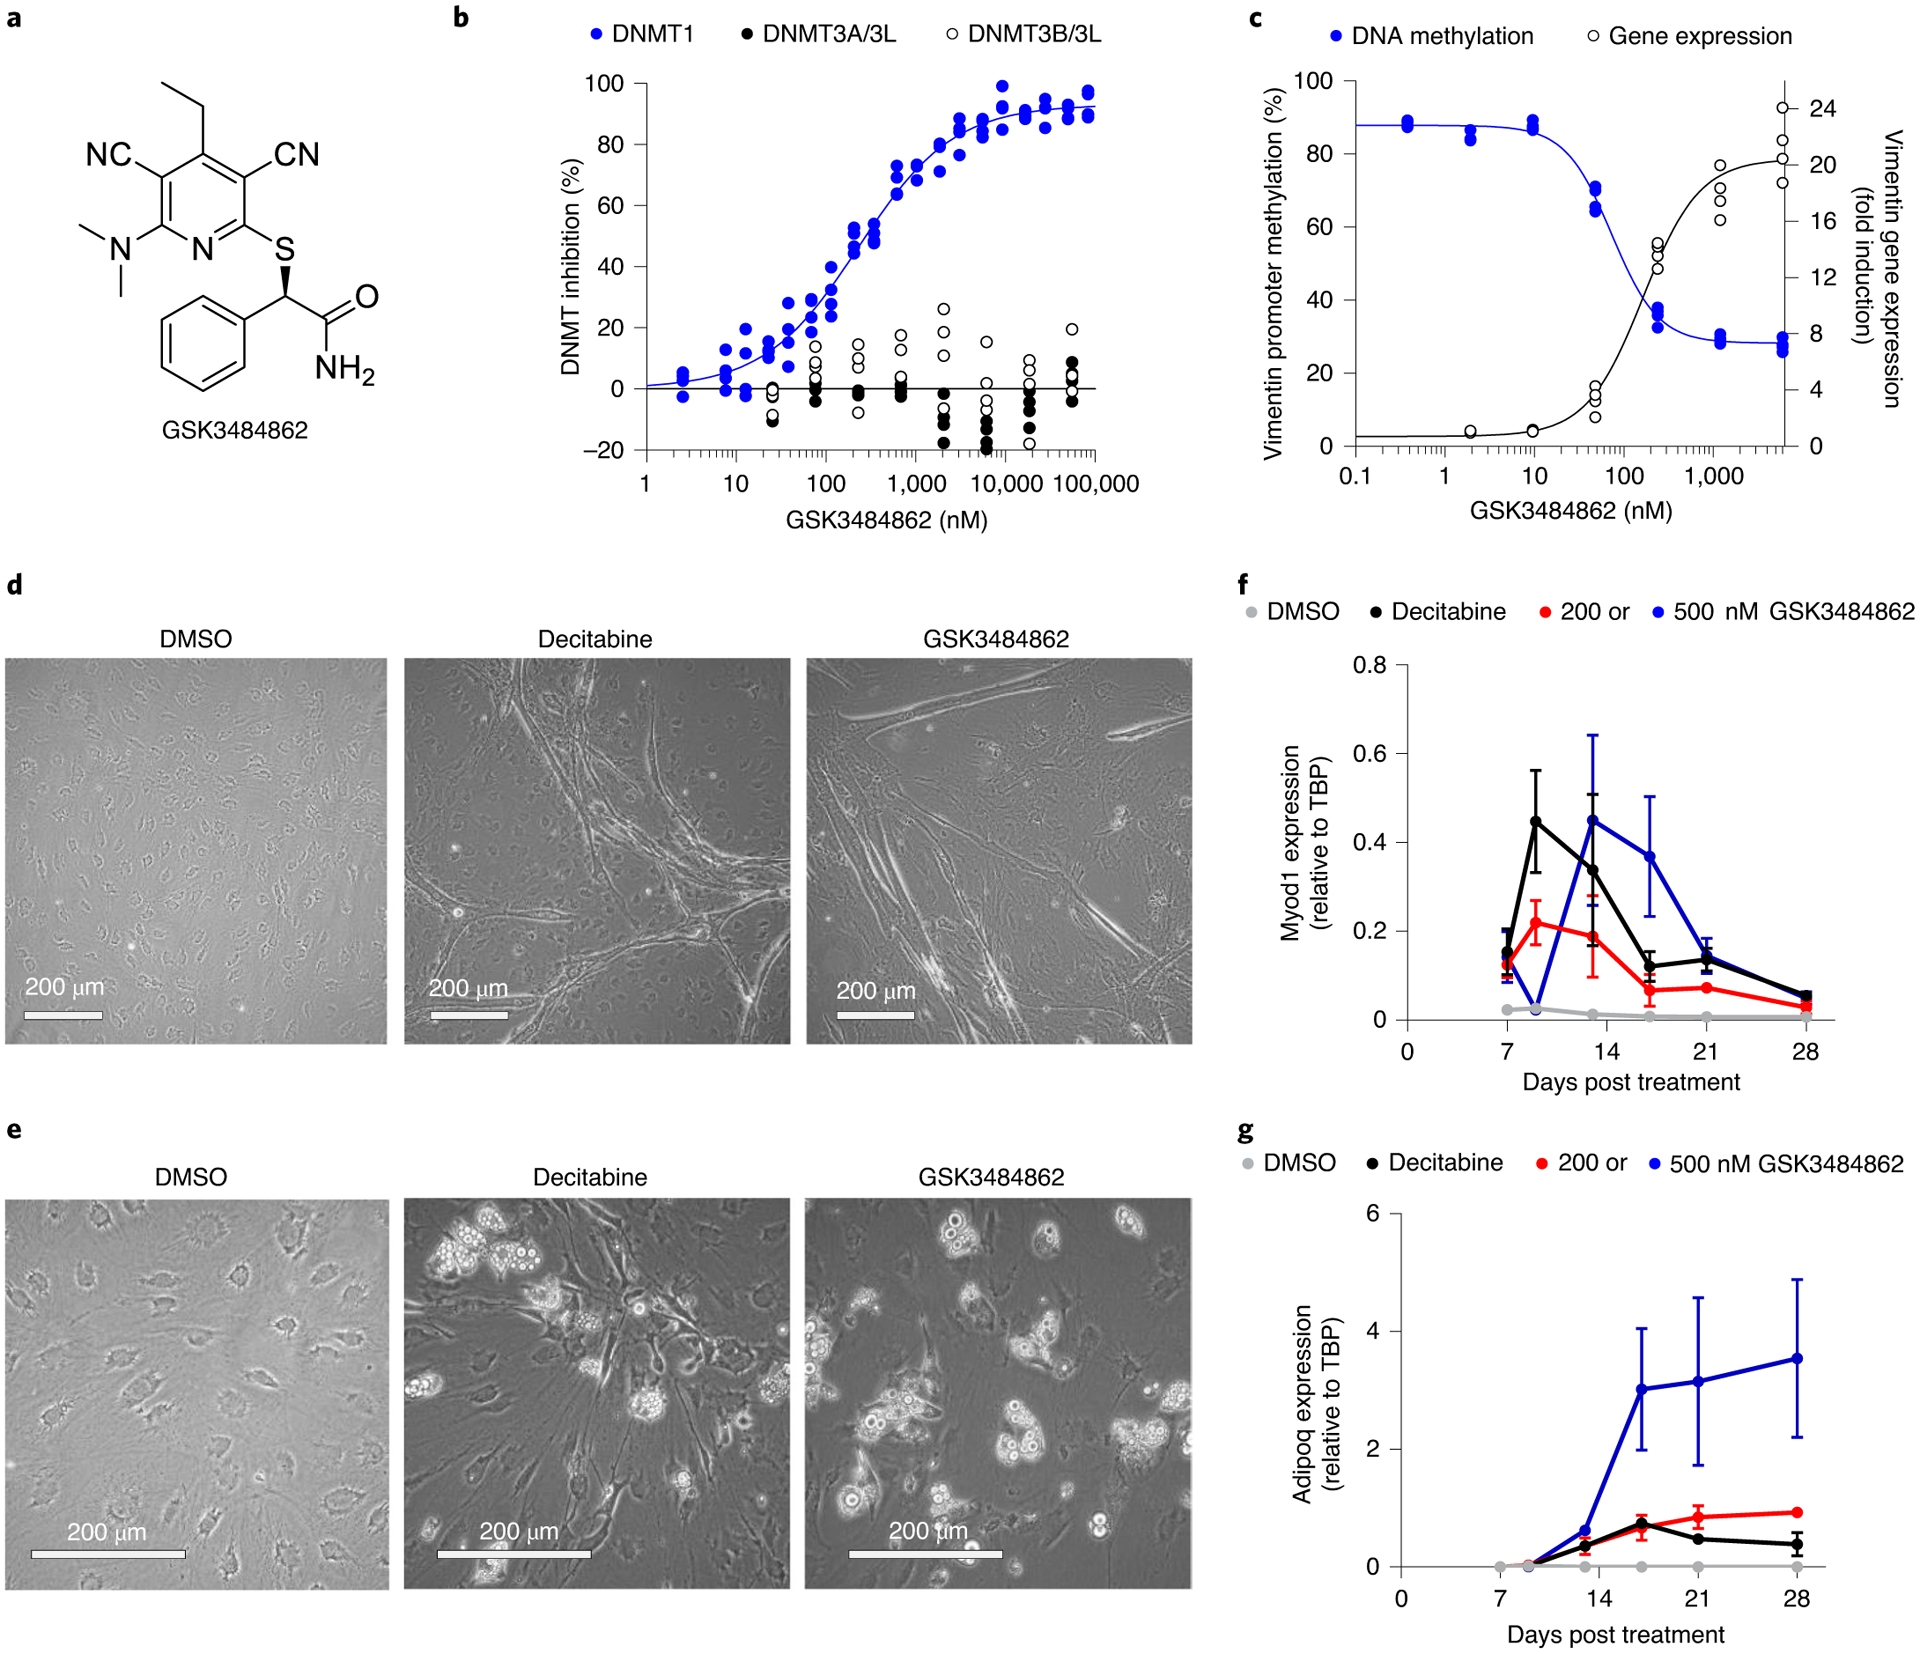
a, GSK3484862 structure. b, GSK3484862 dose–response curves for the DNMT family generated using a fluorescence-coupled breaklight assay (n = 2 biologically independent experiments with two technical replicates each). c, Dose-dependent relationship between promoter methylation and gene expression of vimentin after treatment of DNMT3B −/− HCT-116 cells with GSK3484862 (n = 2 biologically independent experiments with two technical replicates each). d,e, Mouse embryonic fibroblast C3H/10T1/2 cells showing myotube formation after treatment with DAC (200 nM, 24 h, imaged at day 15) or GSK3484862 (2,000 nM, 72 h, imaged at day 28) (d) or adipocyte formation (imaged at day 28) after treatment with DAC (300 nM, 24 h) or GSK3484862 (200 nM, 72 h) (e). The phase-bright droplets have been previously shown to contain lipids26. Dimethylsulfoxide (DMSO) control shows nondifferentiated, monolayered cells (imaged at day 28). Representative data from three independent experiments. f,g, Gene expression (n = 3 biologically independent samples; mean ± s.e.m.) of the muscle-specific differentiation factor Myod1 (f) or the adipocyte-specific differentiation factor Adipoq (g) in C3H/10T1/2 cells collected on the indicated days after treatment.
Cellular engagement of DNMT1 by GSK3484862 resulted in a dose-dependent loss of promoter DNA methylation and marked transcriptional up-regulation of vimentin (VIM), a gene often hypermethylated in colon24 and gastrointestinal25 cancers (Fig. 1c). When compared with DAC, GSK3484862 demonstrated a similar maximal fold-induction of vimentin gene expression in both wild-type and DNMT3B −/− HCT-116 (Extended Data Fig. 1d,e). Additionally, as was originally shown for DAC almost 40 years ago8,26, treatment of mouse embryonic fibroblast C3H/10T1/2 cells with GSK3484862 reprogrammed these cells into functional muscle or fat cells as evidenced by expression of the Myod1 or Adipoq differentiation marker genes (Fig. 1d,g).
Compound binding and inhibition of DNMT1.
Medicinal chemistry optimization to improve potency, solubility and lipophilicity led to the synthesis of a structurally related compound termed, GSK3685032 (Supplementary Data Table 2 and Fig. 2a). Similar to GSK3484862, GSK3685032 is a non-time-dependent, highly selective enzymatic inhibitor of DNMT1 (IC50 = 0.036 ± 0.001 μM, n = 70, SPA) over DNMT3A/3L and DNMT3B/3L (>2,500-fold) and was further confirmed to be noncovalent using intact protein mass spectrometry (Fig. 2b and Extended Data Fig. 1f,g). GSK3685032 is also selective for DNMT1 when compared to broad panels of other methyltransferases (n = 34) or kinases (n = 369) where GSK3685032 exhibited IC50 values > 10 μM (Extended Data Fig. 1h,i and Supplementary Data Table 3). Thermal stability studies revealed that these compounds preferentially bind DNMT1 in the presence of a hemi-methylated, but not unmethylated, DNA substrate (Fig. 2c). This behavior was distinct from a closely related inactive analog (GSK3510477; Supplementary Data Table 2) that failed to stabilize DNMT1 under any condition (Fig. 2c). An alternative thermal shift assay confirmed cellular target engagement through the stabilization of DNMT1 upon treatment with GSK3685032 in HepG2 cells (Extended Data Fig. 1j). Enzymatic assays recapitulated the observed preference for hemi-methylated DNA where a 15-fold reduction in GSK3685032 potency against DNMT1 was detected using an unmethylated poly(dIdC) DNA substrate (Extended Data Fig. 1k). This observation was unique for this series of DNMT1-selective inhibitors and was not seen with the product inhibitor S-adenosyl-l-homocysteine (SAH; Extended Data Fig. 1k).
Fig. 2 |. Biochemical and biophysical characterization of DNMT1-selective inhibitors.
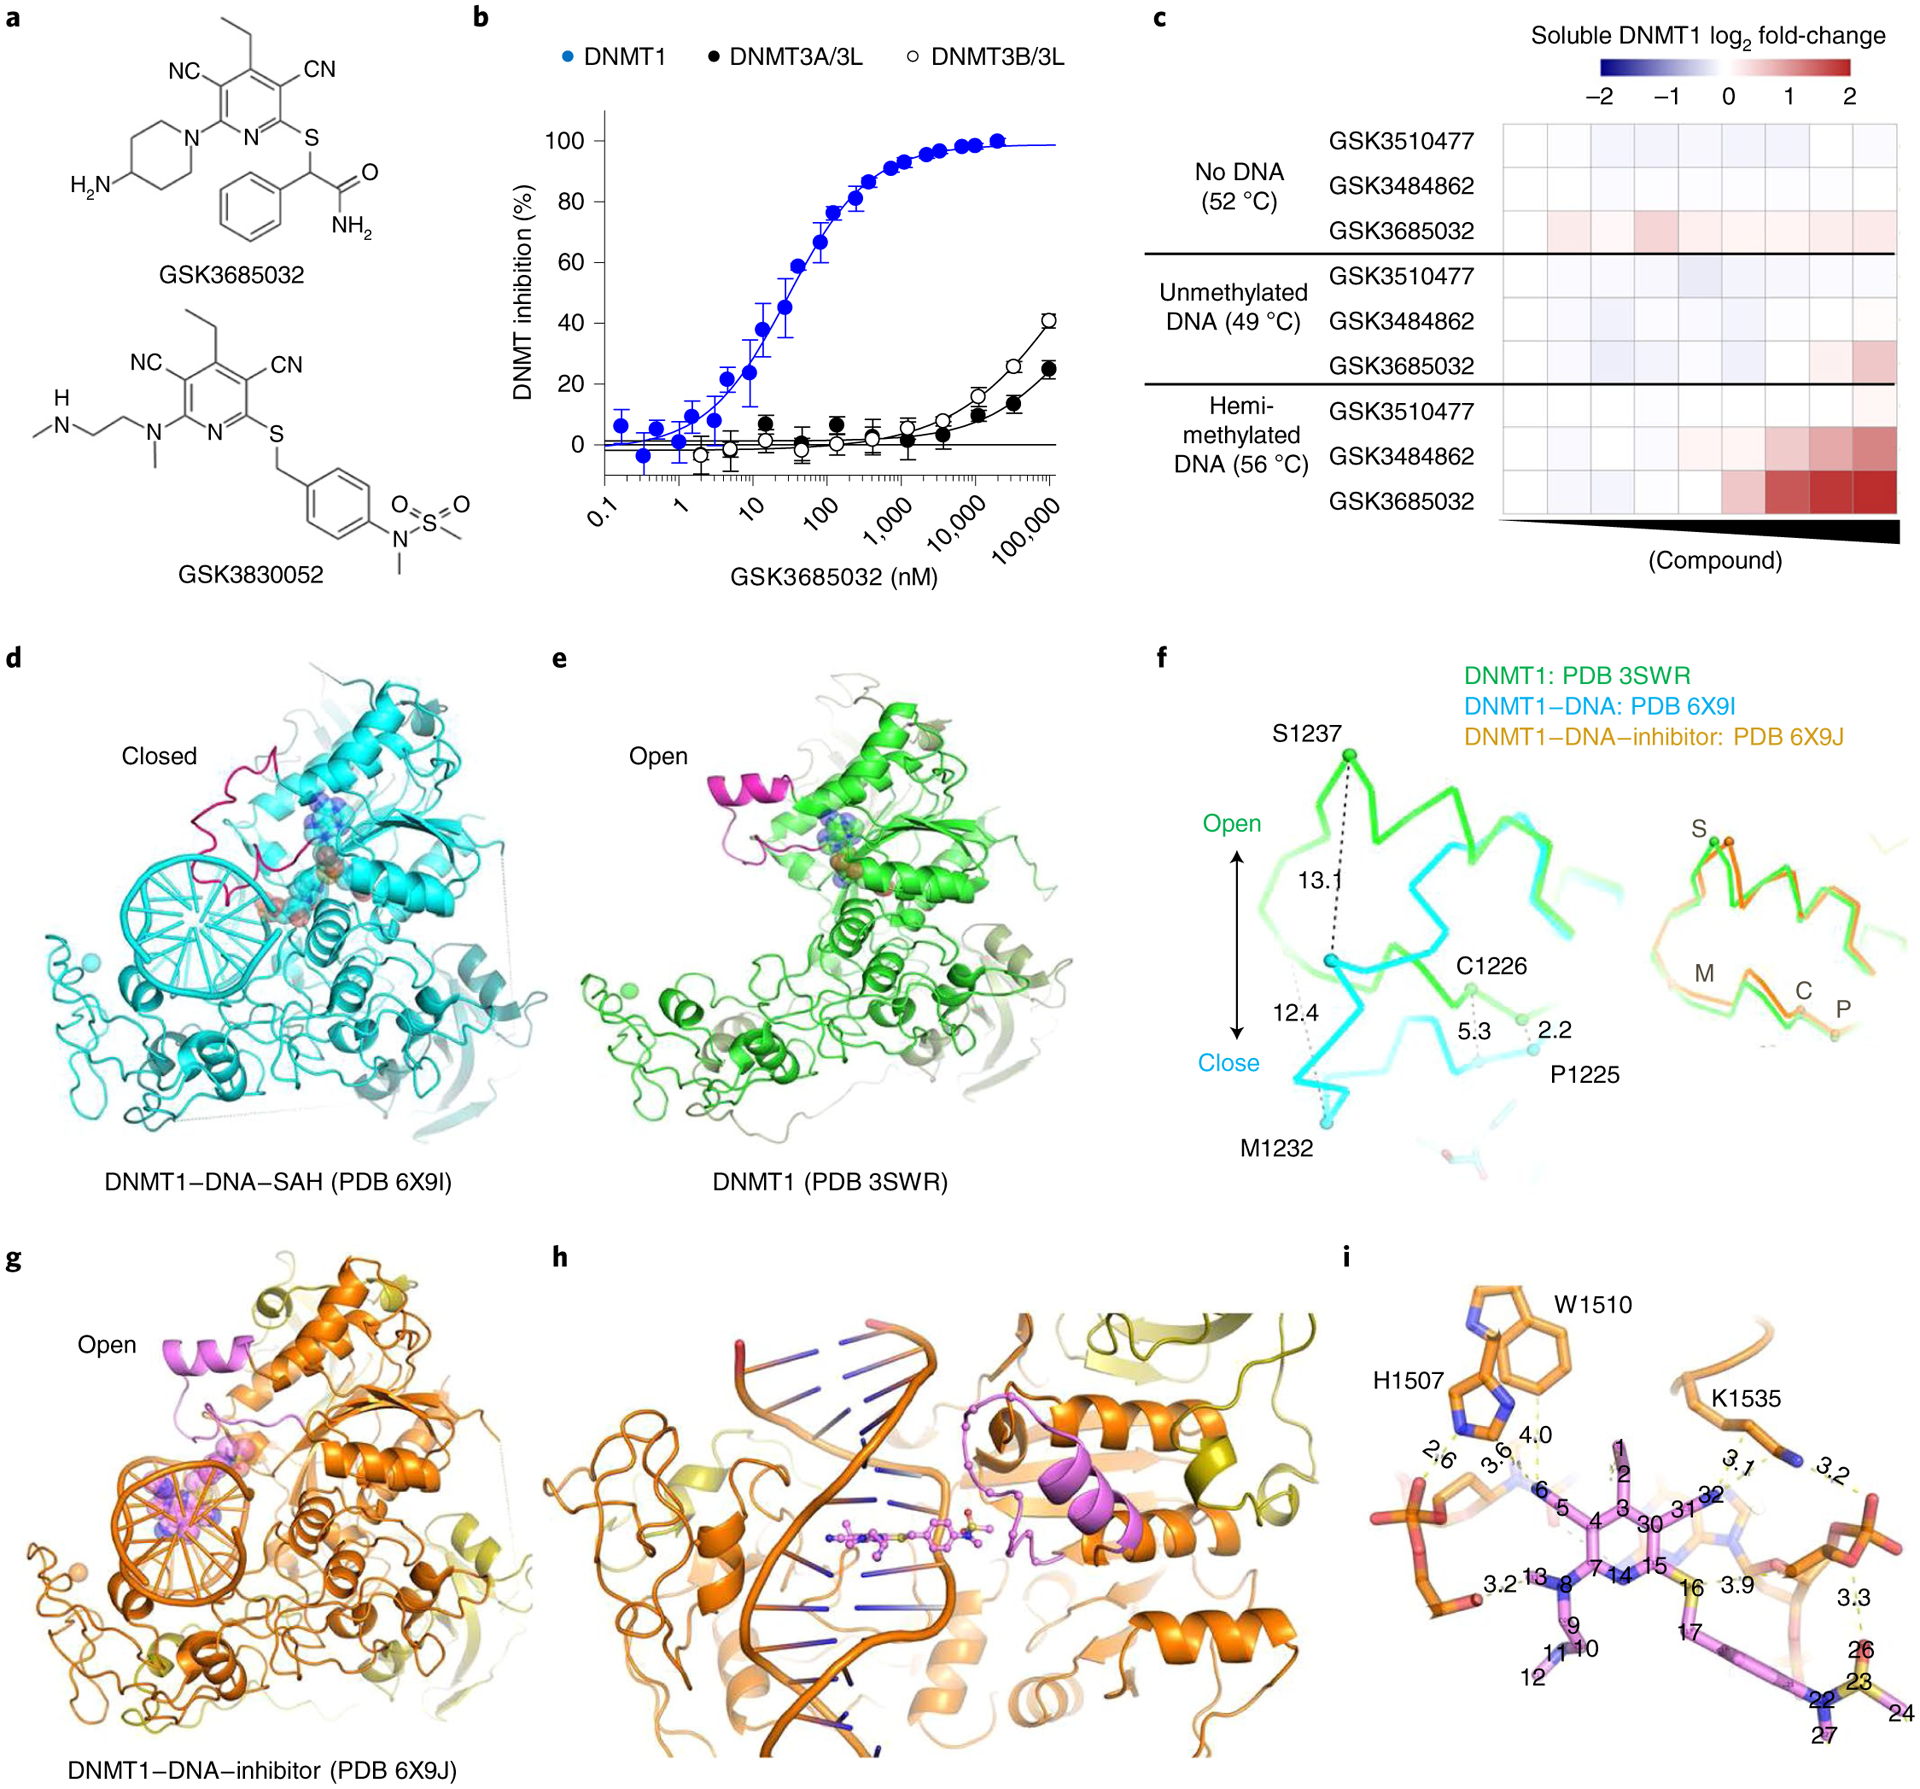
a, GSK3685032 and GSK3830052 structures. b, GSK3685032 dose–response curves for the DNMT family generated using a radioactive SPA (n = 4 biologically independent samples; average ± s.d.). c, Thermal stabilization of recombinant DNMT1 (601–1600) upon compound treatment (0.13–50,000 nM) in the presence of 40-mer hemi-methylated DNA or unmethylated DNA, or in the absence of DNA. d, Structure of DNMT1–DNA where the DNA contains zebularine in place of the target cytidine (PDB 6X9I). e, DNMT1 in the absence of bound DNA (PDB 3SWR). f, Conformational changes of the active-site loop (residues 1224–1245). Left panel, DNMT1 with and without DNA. Right panel, DNMT1 in the absence of DNA or as part of the DNMT1–DNA–inhibitor complex. C, Cys1226; M, Met1232; P, Pro1225; S, Ser1237. g, Structure of DNMT1–DNA complex in the presence of GSK3830052 (PDB 6X9J). h, Close-up view of the inhibitor in the minor groove. i, Inhibitor-mediated interactions with residues in the DNA major groove side.
DNMT1 residues important for compound binding and inhibition were identified using three approaches: photoaffinity labeling, site-directed mutagenesis, and co-crystallization of ternary complexes containing DNMT1, DNA, and inhibitor. Modified analogs of GSK3685032 with photoreactive tags labeled two residues (mouse Ser1233 and Gly1234 corresponding to human Ser1230 and Gly1231; Extended Data Fig. 2a–c). These residues fall within the DNMT1 active-site loop that spans 22 residues from Pro1224-Asn1245 (human) and contains the catalytic cysteine (Cys1226; Extended Data Fig. 3). Site-directed mutagenesis studies focusing on the target recognition domain (TRD)27,28, a region within DNMT1 that has minimal homology to DNMT3A or −3B, identified 14 residues that when mutated to alanine promoted cell survival in the presence of a DNMT1 inhibitor and notably reduced inhibition of cell growth by GSK3685032 (Extended Data Figs. 2d and 3). While these mutations reduced the sensitivity of cells to GSK3685032, they had no diminishing effect on the activity of DAC thus providing further evidence that these compounds work through distinct mechanisms and binding sites (Extended Data Fig. 2d). Interestingly, a subset (6) of these mutations resides within the DNMT1 pocket that detects the methylated cytosine on the nontarget, parent DNA strand (Extended Data Fig. 3)29.
Based on the finding that these compounds preferentially bind DNMT1 in the presence of hemi-methylated DNA, co-crystallization attempts with the inhibitor were conducted using a DNMT1–DNA complex (Supplementary Data Table 4). The hemi-methylated DNA used for crystallization experiments contained zebularine in place of the target cytidine as it is known to form high-affinity complexes with DNMTs30,31. The human DNMT1–DNA–SAH ternary complex (resolution of 2.2 Å; Protein Data Bank (PDB) 6X9I; Fig. 2d) is highly similar to that of the previously solved human DNMT1 structure in the absence of DNA (PDB 3SWR; root mean squared deviation = 0.52 Å against 646 pairs of Cα atoms; Fig. 2e) with the exception of the active-site loop (colored magenta). This loop intercalates into DNA from the minor groove, whereas in the absence of DNA the loop adopts an open conformation (Fig. 2f). Key interactions between DNA and the DNMT1 active-site loop involve Met1232, Gly1231, and Ser1230 (Extended Data Fig. 4a).
DNMT1–DNA complexes containing GSK3685032 (Extended Data Fig. 4b–d) and its derivative GSK3830052 (DNMT1 IC50 = 0.11 ± 0.02 μM, n = 9, SPA; Fig. 2a and Extended Data Fig. 4e) were solved to a resolution of 2.65 Å and 1.79 Å, respectively. The inhibitor binding modes are very similar; however, focus will be given to the inhibitor-mediated interactions in the context of GSK3830052 as it had the highest observed resolution. The DNMT1–DNA–inhibitor bound complex structure revealed three unique features. First, the active-site loop is in an open conformation (Fig. 2g,h), nearly identical to what was observed in the absence of DNA, with the inhibitor now occupying the space that active-site loop residues Gly1228–Arg1234 occupied in the closed conformation (Fig. 2f and Extended Data Fig. 4f). Second, the inhibitor intercalates into the DNA between the two C:G base pairs (G:zebularine pair and 5-methylcytosine (5mC):G pair; Extended Data Fig. 4g). Third, the pyrimin-2(1H)-one of zebularine remains intrahelical and forms two hydrogen bonds with the paired guanine (the third hydrogen bond is lost due to the lack of the 4-amino group; Extended Data Fig. 4h). The bound inhibitor makes the majority of its interactions with DNA via pi-stacking and additional van der Waals contacts with both protein and DNA as highlighted in Fig. 2i and Extended Data Fig. 4i,j. Focusing on the interactions between the inhibitor and DNMT1, residues from the TRD (Lys1535, His1507, and Trp1510) and from the active-site loop (Cys1226, Gln1227, and Phe1274) all appear to contribute to compound binding. While the DNMT1–DNA–inhibitor structure only represents a snapshot of the complex captured by co-crystallization, these findings provide evidence that the inhibitor competes with the active-site loop of DNMT1 for penetrating into hemi-methylated DNA.
The importance of DNMT1 residue His1507 for compound binding (crystallography) and inhibition (site-directed mutagenesis) was further validated in enzymatic inhibition studies. GSK3685032 displayed a >350-fold reduction in the inhibition of recombinant H1507Y mutant protein when compared with wild-type DNMT1 (Extended Data Fig. 2e). This loss of potency was unique to this series of DNMT1-selective inhibitors and was not observed with the product inhibitor SAH.
Taken together, all of these studies highlight the importance of (1) a hemi-methylated DNA substrate; (2) concerted movement of the DNMT1 active-site loop; and (3) residues that fall within the DNMT1 TRD with specific emphasis on those that recognize methylated cytosine on the nontarget, parent strand with regard to compound binding and inhibition of DNMT1. In summary, these observations clearly establish that GSK3685032 engages DNMT1 specifically in both biochemical and cellular contexts and can be used to investigate the biological mechanisms associated with DNMT1 inhibition.
Selective inhibition of DNMT1 slows cancer cell growth.
The effect of selective DNMT1 inhibition by GSK3685032 on cell growth and survival was evaluated in a panel of 51 hematologic cancer cell lines comprising 15 leukemia, 29 lymphoma and 7 multiple myeloma cell lines. The majority of these cell lines were dependent on DNMT1 activity for their growth with a median growth IC50 (gIC50) value of 0.64 μM (Fig. 3a). Additionally, a subset of cell lines (29%) exhibited net decreases in cell number at day 6 relative to the number of cells at the start of drug treatment, represented by a negative growth–death index (GDI), indicating that they were also dependent on DNMT1 activity for survival. More detailed studies focused on a subset of AML lines that showed a range of sensitivity to GSK3685032 (Extended Data Fig. 5a). Growth inhibition exhibited a relatively slow onset (≥3 d) with increasing potency (decreasing gIC50) observed throughout a 6 d time course (Fig. 3b,c). Induction of caspase 3 activity was also observed in a dose- and time-dependent manner with marked activation occurring by day 4 (Fig. 3d). Consistent with its improved biochemical potency, GSK3685032 showed an enhanced anti-proliferative effect compared with GSK3484862, while a closely related inactive analog (GSK3510477) from the same chemical series showed no changes in cell growth or caspase activity, confirming that the observed phenotypic effects are dependent on DNMT1 inhibition (Fig. 3e and Extended Data Fig. 5b).
Fig. 3 |. Phenotypic response following treatment with DNMT inhibitors in hematologic cancer cell lines.
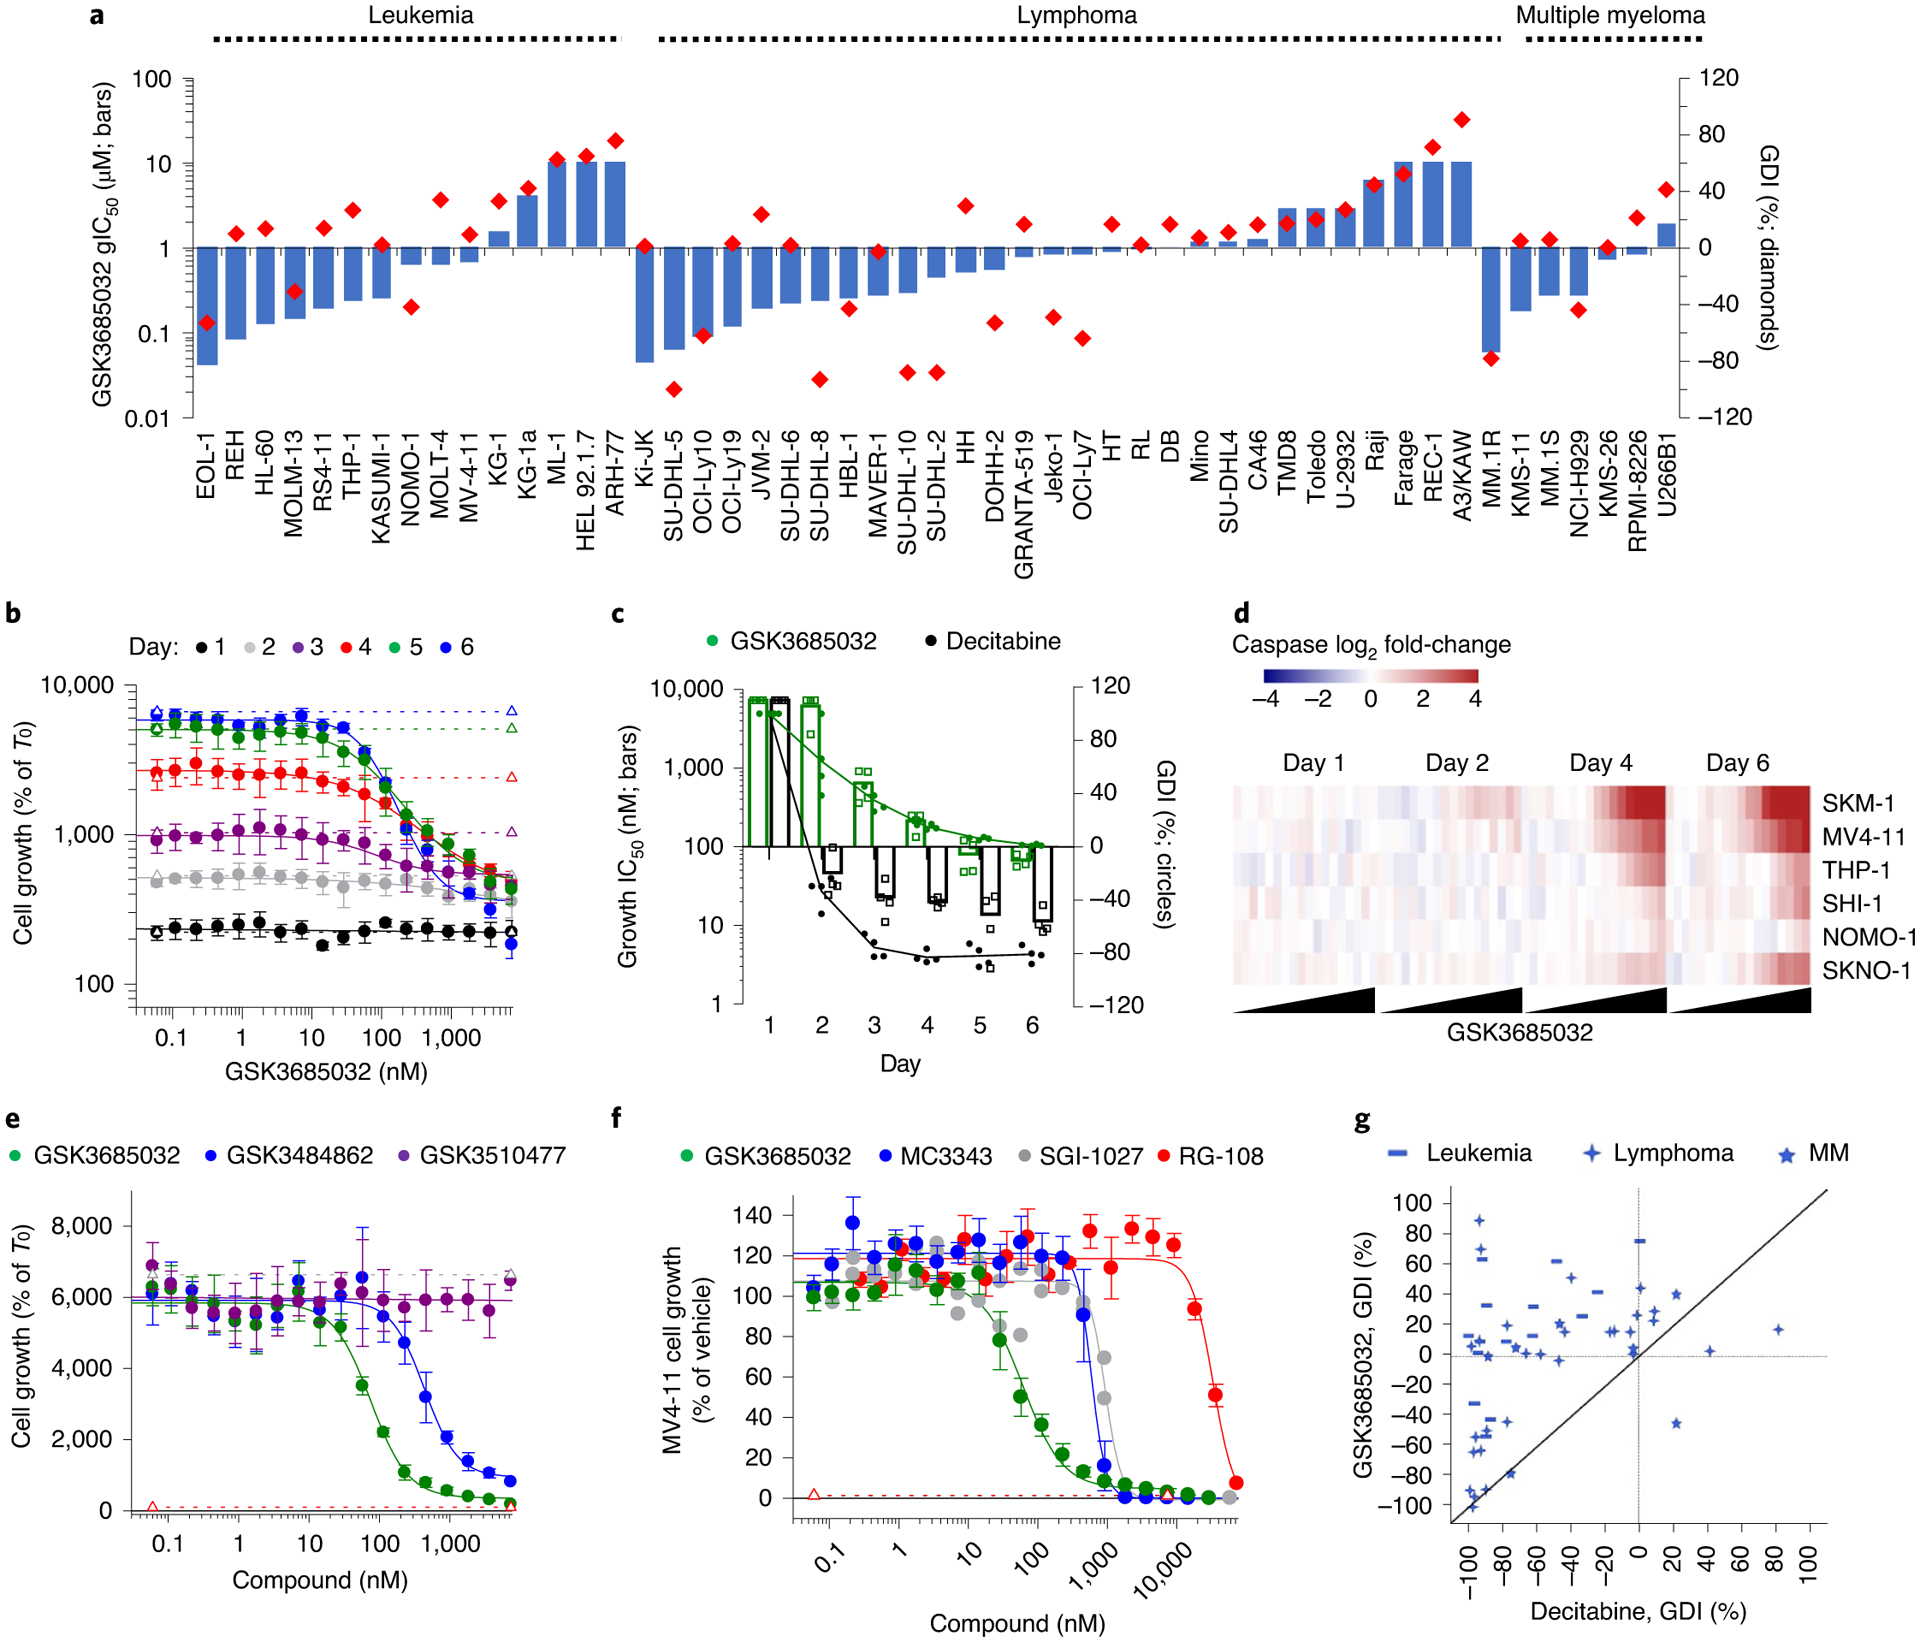
a, GSK3685032 gIC50 and GDI values in a 6-d proliferation assay for 51 hematologic cell lines. b, Proliferation dose–response curves for MV4–11 cells treated with GSK3685032 spanning days 1–6 (n = 4 biologically independent experiments; average ± s.d.). Dotted lines represent cell growth of the vehicle control for each day. c, Potency (gIC50) and GDI values for MV4–11 cells treated with GSK3685032 or DAC over time (n = 4 biologically independent experiments; mean). d, Heatmap showing induction of caspase-glo 3/7 activity (Promega, log2; average of n = 2 biologically independent experiments) in a panel of AML cell lines following treatment with GSK3685032 (0.06–7,340 nM). e, Day 6 MV4–11 proliferation dose–response curves (n = 4 biologically independent experiments; average ± s.d.) for GSK3510477, GSK3484862 and GSK3685032. Dotted line represents starting cell number (T0) or vehicle growth (T6). f, MV4–11 proliferation dose–response curves at day 6 treated with a panel of DNMT inhibitors (GSK3685032 n = 7, MC3343 n = 6, SGI-1027 n = 2, RG-108 n = 3; n = biologically independent experiments; if n > 3, shown as average ± s.e.m.). Dotted line represents starting cell number (T0). g, Correlation plot of the day 6 GDI values (%) in 51 hematologic cell lines following treatment. MM, multiple myeloma.
Compared with GSK3685032, previously reported non-nucleoside DNMT inhibitors, RG-108, SGI-1027, and MC3343, were enzymatically less potent and showed nonselective inhibition across the DNMT family members (Extended Data Fig. 5c,d). Surprisingly, despite a lack of dose-responsive global DNA methylation decreases in cells, MC3343 and SGI-1027 inhibited cell growth, suggesting that off-target effects may contribute to the cellular activity of these compounds (Fig. 3f and Extended Data Fig. 5d).
In contrast to the slower onset and generally cytostatic growth inhibitory effects of GSK3685032, DAC exhibited a predominantly cytotoxic response with a relatively fast onset (2 d) of cell death indicated by a negative GDI (Fig. 3c). To more broadly compare the activity of GSK3685032 with DAC, DAC was evaluated against the same panel of hematologic cancer cell lines (n = 51). A comparison of GDI values confirmed a highly cytotoxic profile for DAC where 80% of the cell lines displayed a negative GDI value compared with 29% observed with GSK3685032 (Fig. 3g).
GSK3685032 induces DNA hypomethylation and gene activation.
Treatment of AML cell lines with GSK3685032 caused extensive DNA hypomethylation and robust transcriptional activation in a time- and dose-dependent manner (Fig. 4a–d). Consistent with DNA methylation loss occurring primarily through a passive DNA replication-dependent mechanism, the majority of changes occurred during the first 2 d of treatment after which time the rate of DNA methylation decrease slowed dramatically, coinciding with the onset of growth inhibition (Fig. 4a). Transcriptional responses were slightly delayed relative to methylation changes with differential gene expression increasing markedly 2–4 d post-treatment (Fig. 4b). Agreeing with the transcriptionally repressive nature of DNA methylation within promoter CpG islands, the majority of early differential gene expression changes involved transcriptional activation (96% for MV4–11 at day 2). While the number of up-regulated genes continued to increase 4–6 d after treatment, so did the number of down-regulated genes, suggesting that many of these may be secondary transcriptional responses. Genes that harbored highly methylated promoters exhibited a striking inverse correlation between DNA methylation levels and transcriptional activation following treatment (Fig. 4e). Further confirming that these effects were due to DNMT1 inhibition, the inactive analog GSK3510477 did not induce loss of DNA methylation or extensive transcriptional changes as was observed with GSK3685032 or GSK3484862 (Fig. 4f–h). Consistent with observations from inhibitors of other epigenetic regulators (for example, EZH2 and LSD1), the majority of differentially regulated genes were unique to each cell line (Fig. 5a). Pathway analysis, however, identified consistent activation of gene signatures associated with immune responses including interferon (IFN) signaling, viral sensing and antigen presentation (Fig. 5b–f).
Fig. 4 |. GSK3685032 induces changes in DNA methylation and gene expression in treated cells.
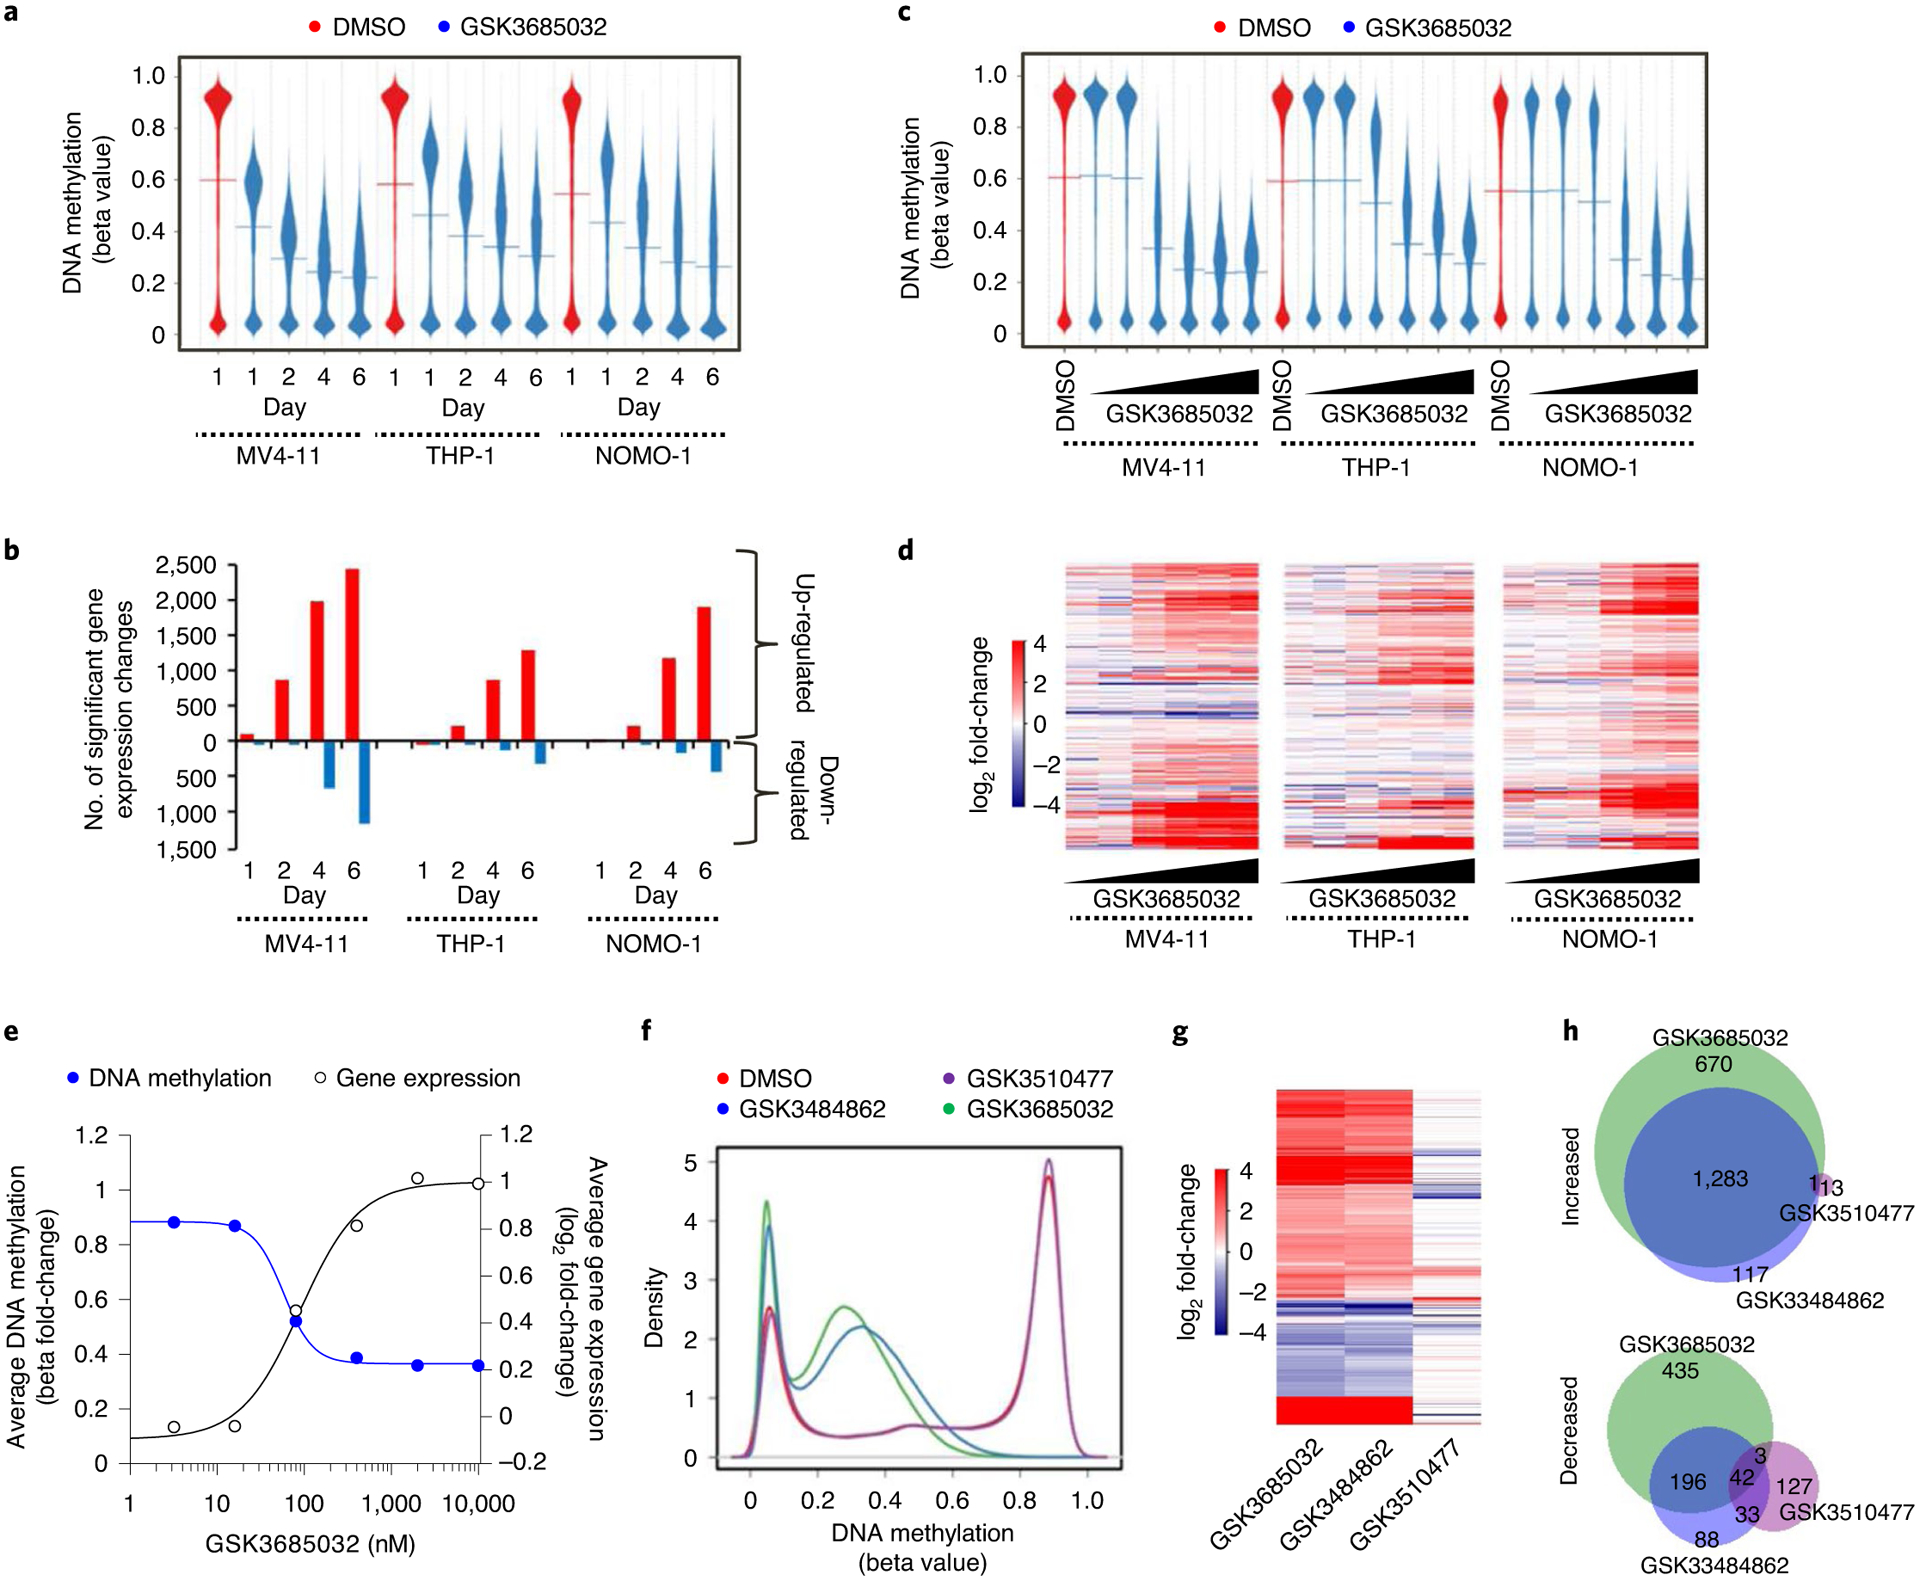
a,b, DNA methylation profile (a, Infinium Methylation EPIC, line represents the mean, n = 866,091 probes) and the number of gene expression changes (b, RNA-seq) for GSK3685032 (400 nM)-treated cells over time. c,d, DNA methylation profile (c, Infinium Methylation EPIC, line represents the mean, n = 866,091 probes) and differential gene expression log2 fold-change heatmap (d, RNA-seq, n = 13,969 genes) for GSK3685032 (3.2–10,000 nM)-treated cells at day 4. e, Fold-change in promoter methylation and gene expression following treatment in MV4–11 cells (day 4) for genes (n = 4,424) with beta values in vehicle samples ≥0.8 ± 200 bp from transcription start site (TSS). f–h, DNA methylation profile (f, Infinium Methylation EPIC, n = 866,091 probes), heatmap of significant gene expression changes (g, RNA-seq, false discovery rate (FDR) < 0.05, |log2 fold change| > 1, n = 2,970 genes) and Venn diagram (h) showing the overlap of up- and down-regulated genes in MV4–11 cells treated with dimethylsulfoxide, GSK3510477 (10,000 nM), GSK3484862 (1,000 nM) or GSK3685032 (400 nM) for 4 d.
Fig. 5 |. GSK3685032 activates immune response pathways.
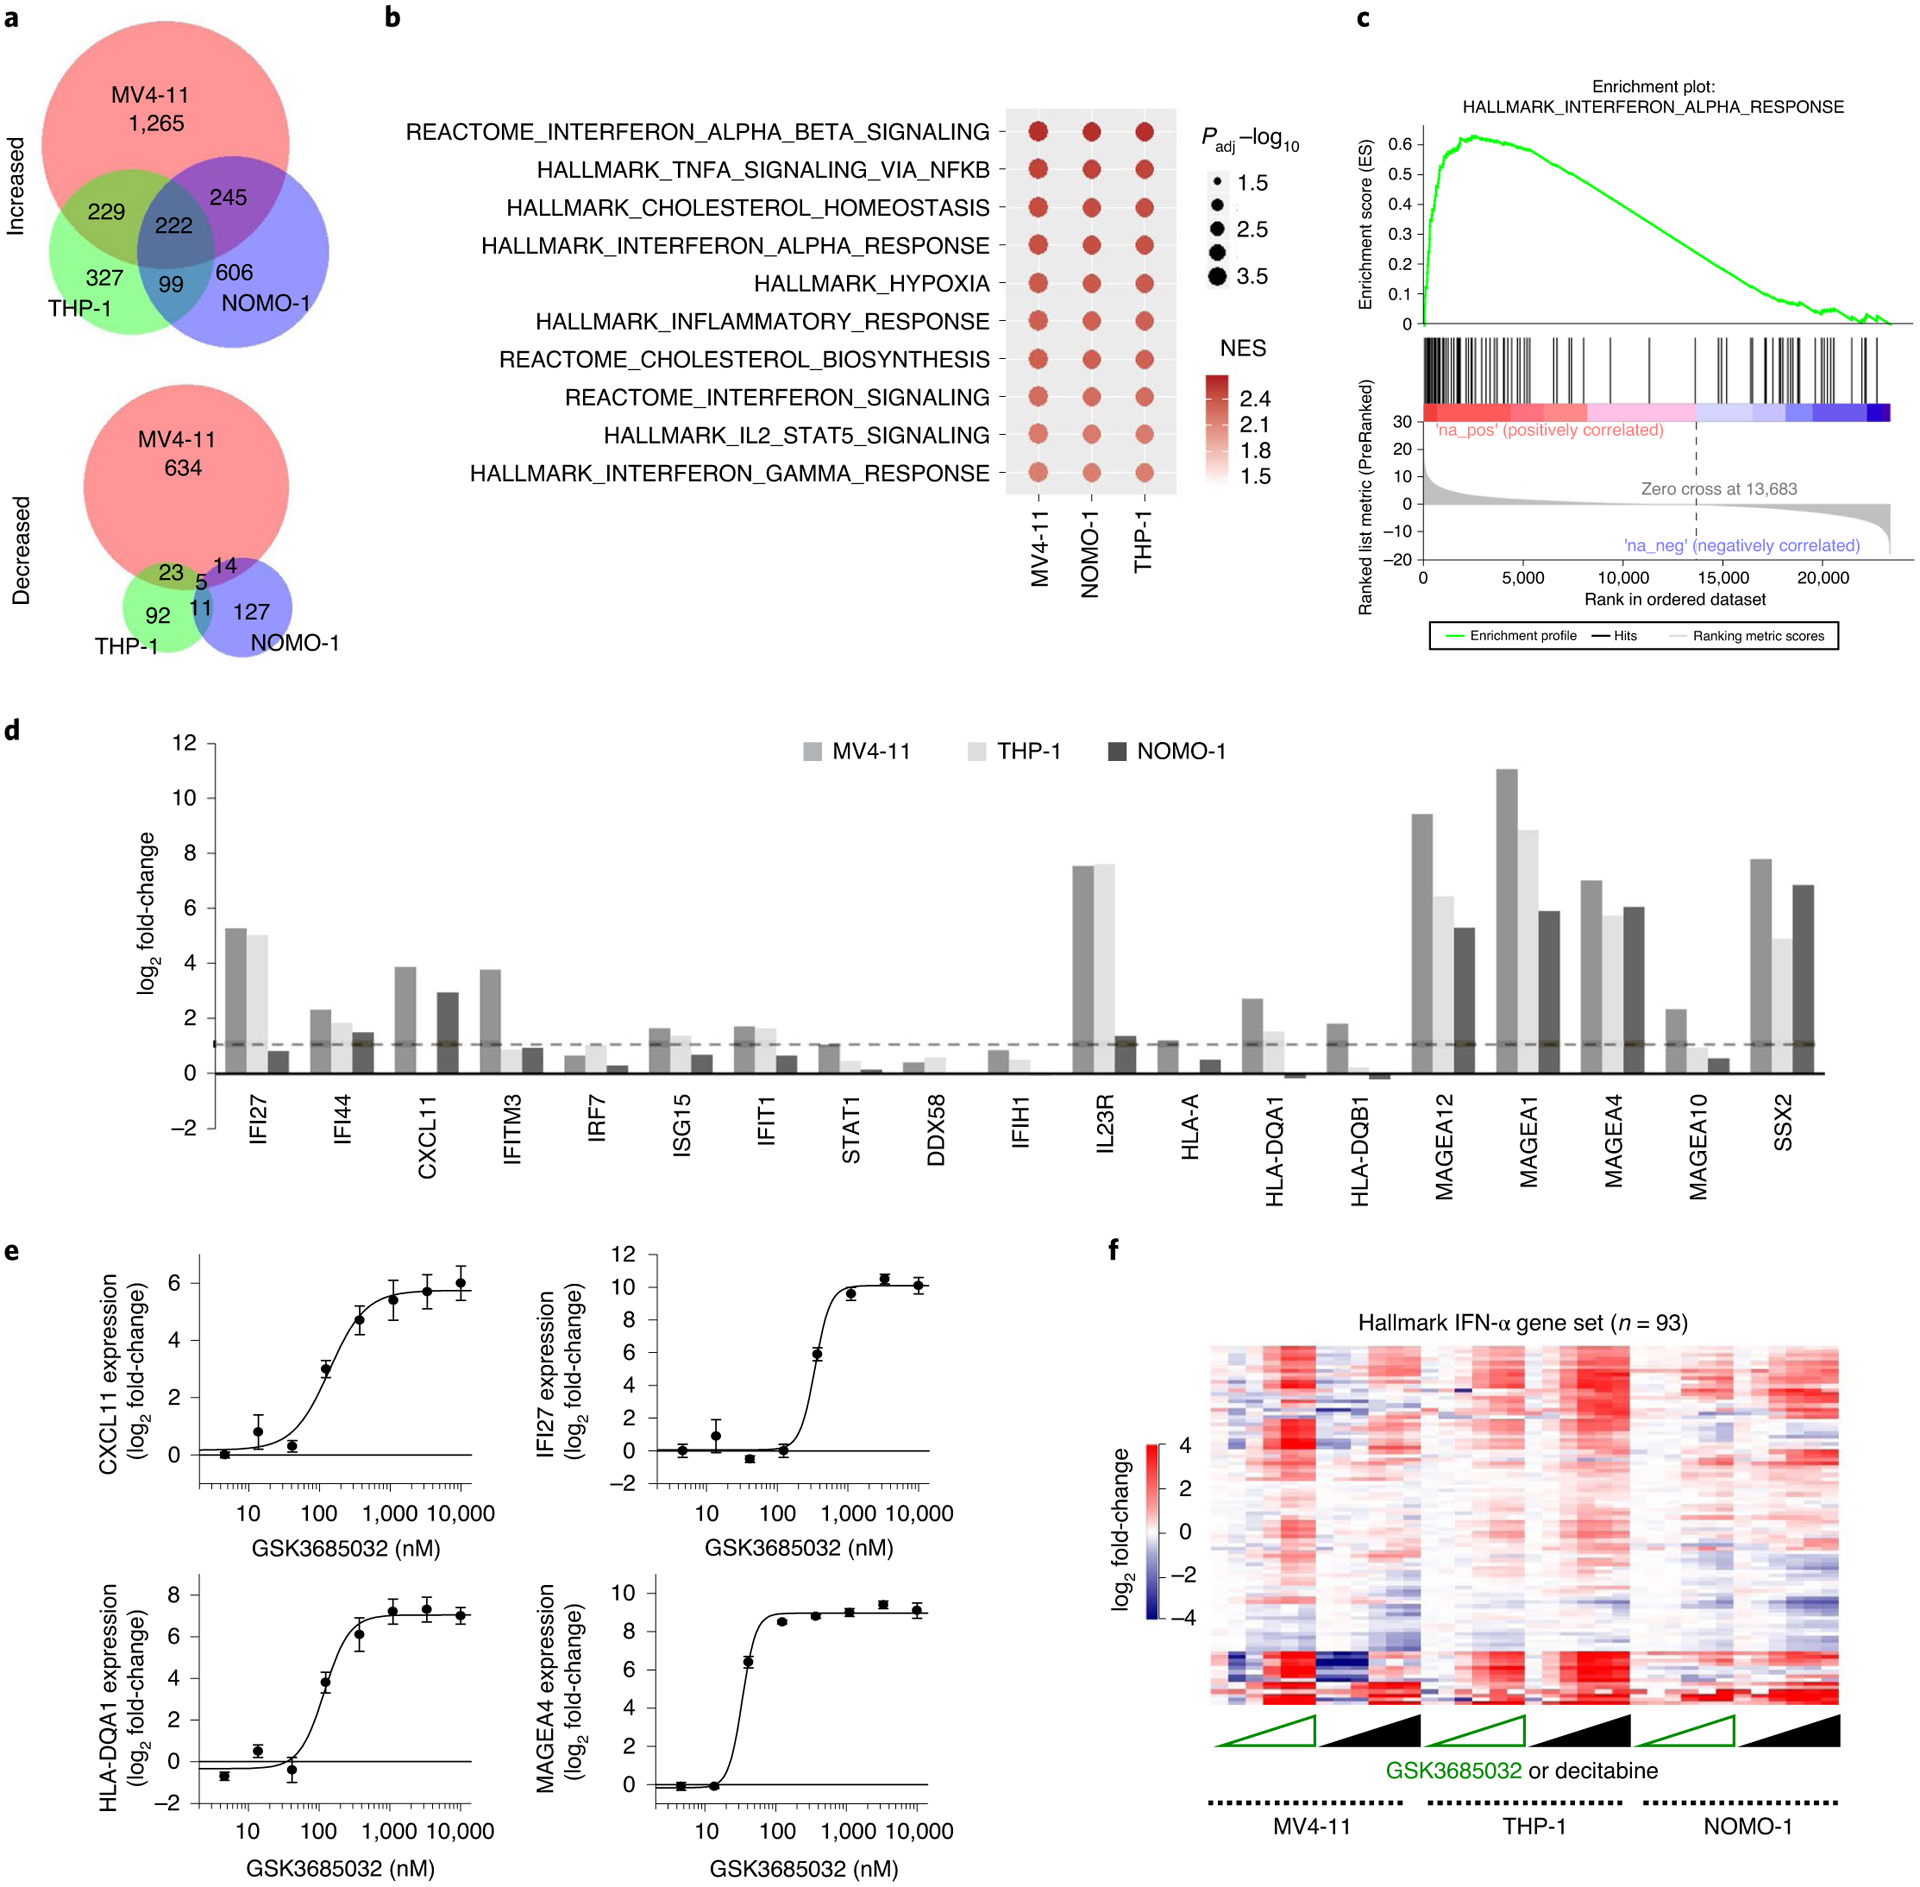
a, Venn diagram of significantly changed genes FDR < 0.05, |log2 fold-change| >1) following treatment with GSK3685032 (400 nM, day 4, RNA-seq). b, Pathway analysis of significantly increased genes (FDR < 0.05, |log2 fold-change| > 1) following GSK3685032 treatment (400 nM, day 4, RNA-seq). c, GSEA plot for the Hallmark IFN-α gene set following GSK3685032 treatment (MV4–11, day 4, 400 nM, RNA-seq). NES, normalized enrichment score. d, log2 fold-change for representative genes involved in IFN response, viral sensing and antigen presentation in GSK3685032-treated cells (day 4, 400 nM, RNA-seq). Dotted line represents a twofold increase. e, Dose-dependent induction of CXCL11, IFI27, HLA-DQA1 and MAGEA4 (RT–qPCR, day 4, n = 3 biologically independent experiments) following treatment of MV4–11 cells with GSK3685032. f, Heatmap of Euclidian clustered log2 fold-change DEseq2 differential expression from cell lines treated with GSK3685032 or DAC (3.2–10,000 nM, day 4, RNA-seq) for the Hallmark IFN-α gene set (n = 93 genes).
Among the previously reported DNMT inhibitors tested, only DAC showed robust decreases in global DNA methylation levels approaching those observed with GSK3685032A (Fig. 6a). Due to the lack of robust anti-proliferative and DNA methylation effects with the other non-nucleoside DNMT inhibitors (Extended Data Fig. 5d), additional comparisons with GSK3685032 focused solely on the nucleoside analog DAC. Interestingly, while DAC and GSK3685032 showed similar methylation EC50 values, DAC exhibited evidence of a bell-shaped response curve with inhibitory activity dropping off at doses above 1 μM (Fig. 6a). In contrast, selective DNMT1 inhibition by GSK3685032 resulted in increasing DNA hypomethylation through at least 10 μM yielding an additional 13% loss of global DNA methylation (83% versus 70% maximal response, respectively) in MV4–11 cells.
Fig. 6 |. Mechanistic evaluation of GSK3685032 and DAC in AML.
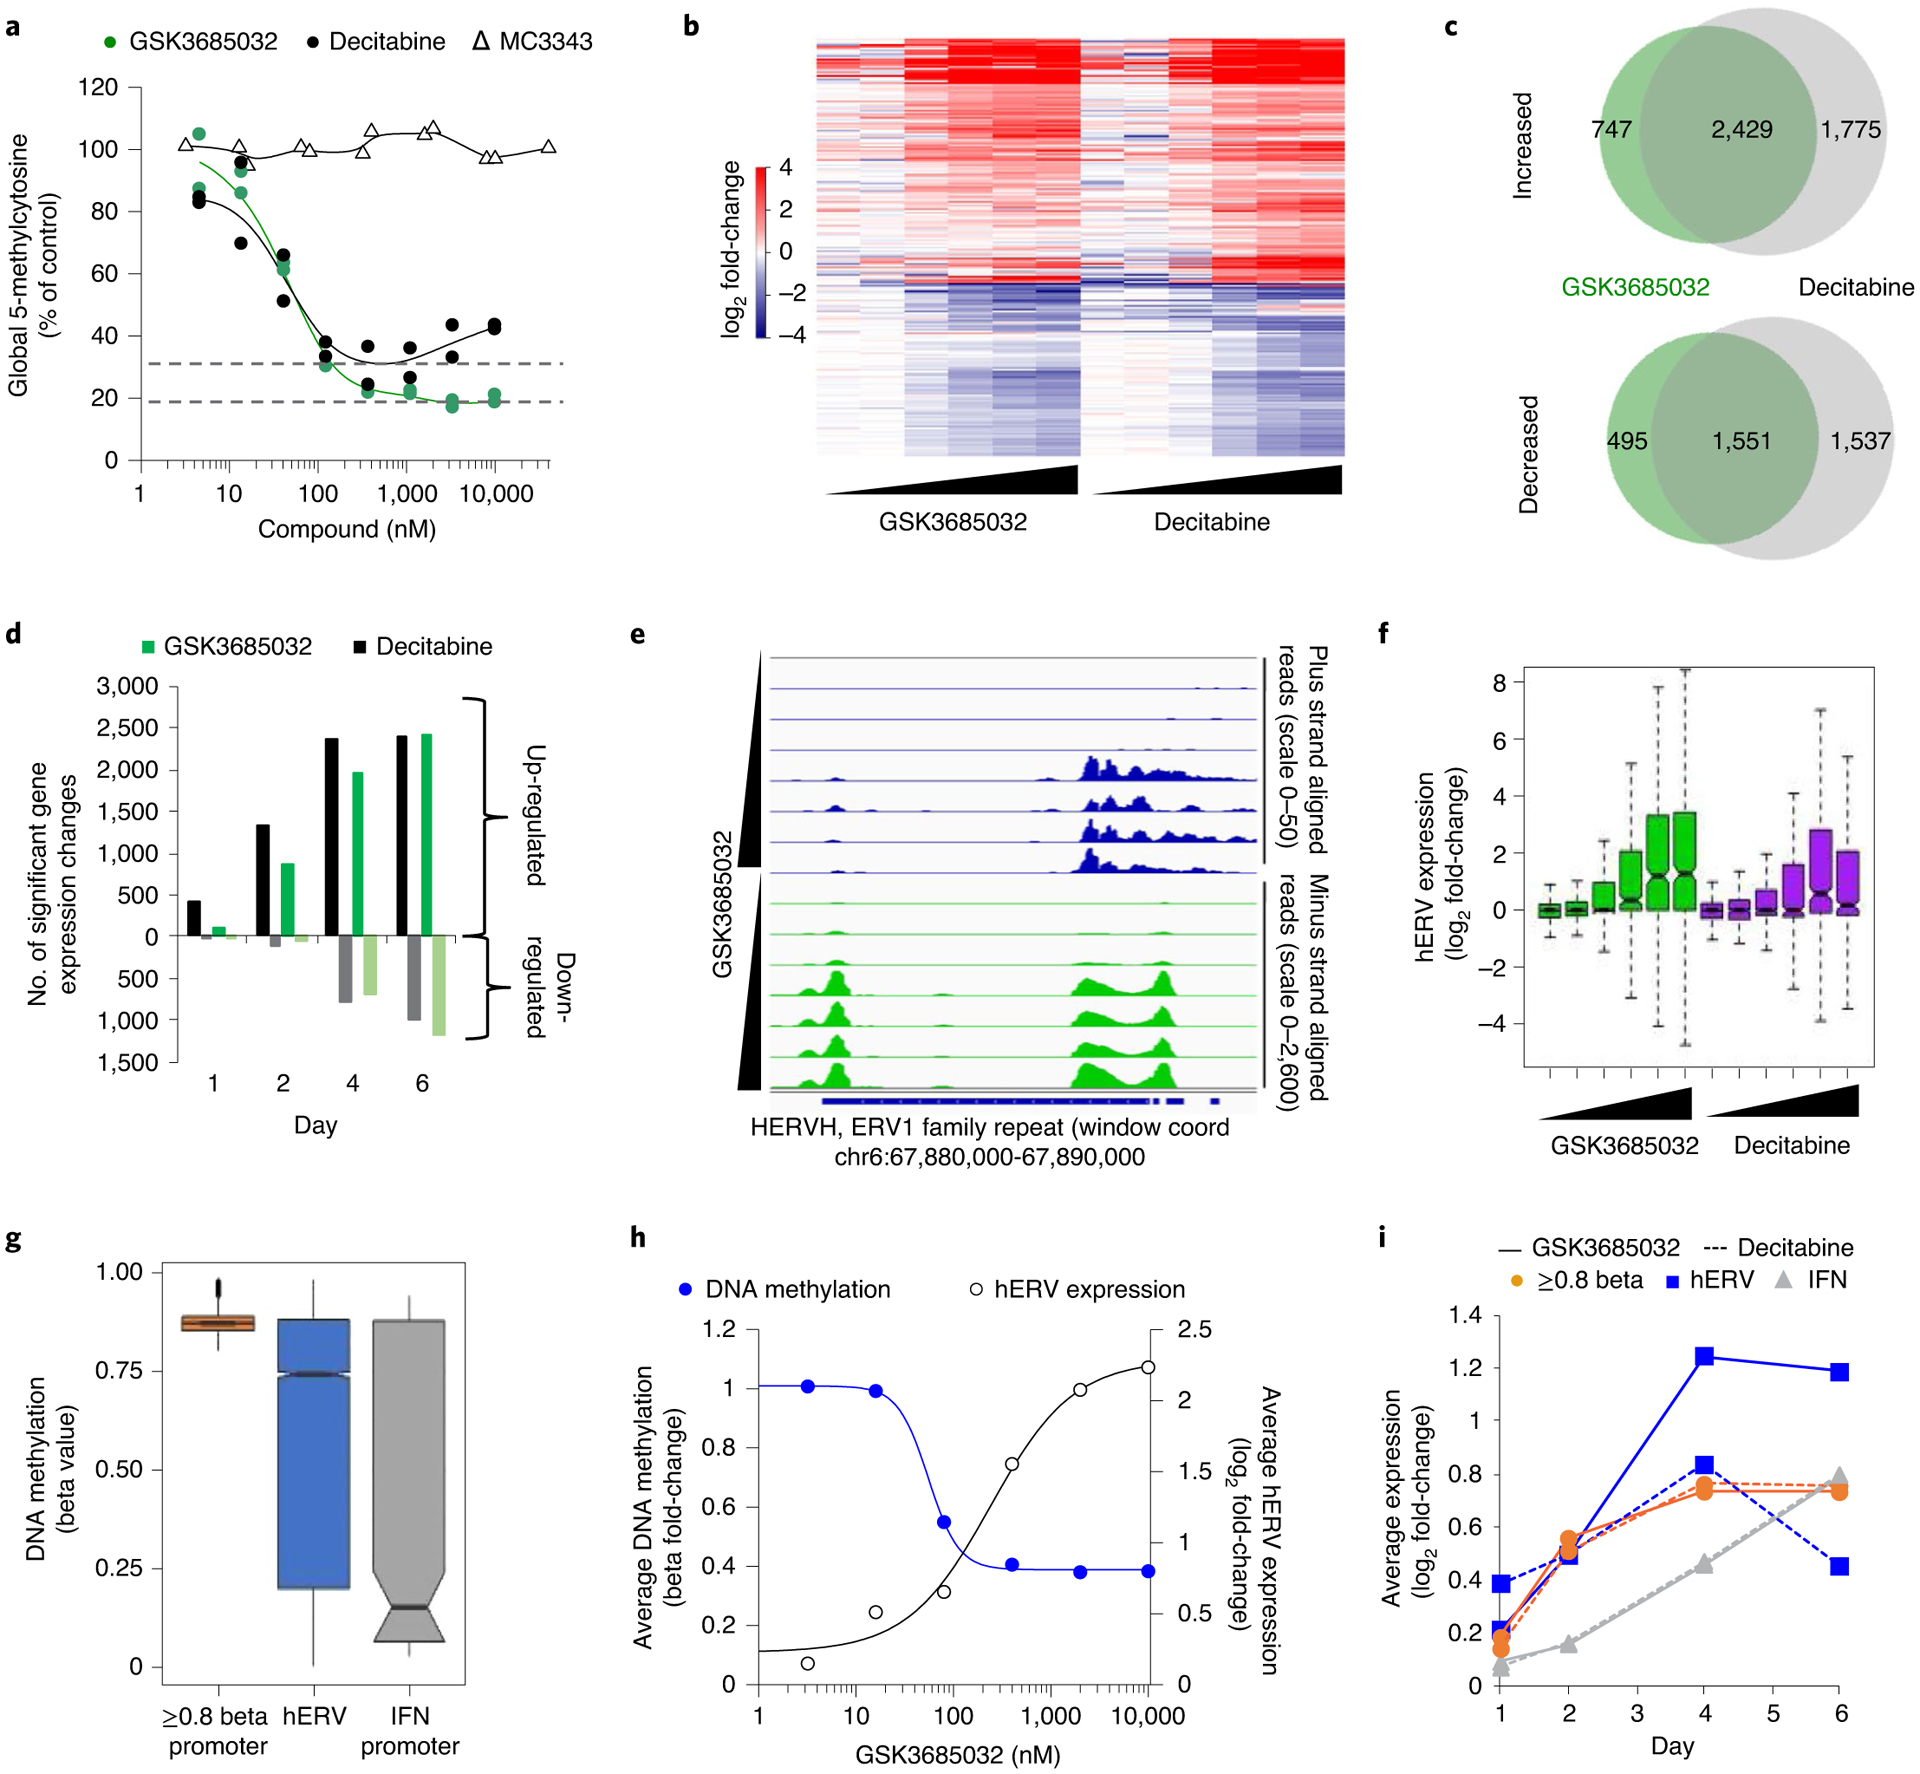
a, Changes in 5-methylcytosine (day 4, n = 2 biologically independent experiments) following treatment of MV4–11 cells. Dotted line represents the maximal average hypomethylation achieved by DAC or GSK3685032. b, Heatmap of log2 fold-change values for differentially expressed genes (n = 8,363 genes) in MV4–11 cells treated with GSK3685032 or DAC (3.2–10,000 nM, day 4, RNA-seq). c, Venn diagram showing the overlap of up- and down-regulated genes (day 4, MV4–11, RNA-seq). d, Up- and down-regulated gene expression changes (RNA-seq, FDR < 0.05, log2 fold change > 1 or < −1) in MV4–11 cells following treatment (400 nM) over time. e, Genome browser tracks of MV4–11 alignments separated by plus strand (scale, 0–50) and minus strand (scale, 0–2,600) for the human endogenous retroviral (ERV) element located within chr6:67,880,000–67,890,000 (subfamily H (HERVH), ERV1 family) demonstrating double-stranded transcripts. MV4–11 cells were treated with GSK3685032 (3.2–10,000 nM, day 4, RNA-seq). f, Dose-dependent (3.2–10,000 nM) differential hERV expression (n = 394 hERV families, log2 fold-change) in MV4–11 treated cells (day 4, RNA-seq). Box bounds show the 25th to 75th percentiles with the center at 50%, and whiskers show the 5th to 95th percentiles. g, Methylation beta values (Infinium Methylation EPIC, vehicle, day 4, MV4–11) for probes that fall at promoters with average beta value ≥0.8 (1,500 bp ± TSS, n = 13,185 probes), within an annotated hERV (n = 16,958 probes) or at promoters of combined Hallmark IFN-α and -γ genes from MsigDB (n = 205 probes). Box bounds show the 25th to 75th percentiles with the center at 50%, whiskers show the 5th to 95th percentiles and outliers are plotted as individual circles. h, Dose-dependent fold-change in hERV expression (RNA-seq, n = 394 hERV families) and methylation for all probes (n = 16,958 probes) on the Infinium Methylation EPIC array contained within an hERV (day 4, MV4–11). i, Time course of the average log2 fold-change in expression (RNA-seq) in MV4–11 cells treated with 400 nM GSK3685032 or DAC for genes with promotor beta values ≥0.8 (n = 12,352 genes), hERVs (n = 364 families) or IFN gene set (n = 219 genes).
At the transcriptional level, 76% of the genes up-regulated by GSK3685032 were also up-regulated following DAC treatment in MV4–11 cells (day 4, Fig. 6b,c). The strong bias toward up-regulated gene expression changes was comparable between DAC and GSK3685032, but DAC elicited transcriptional changes as early as 1 d after treatment (Fig. 6d). Numerous studies have discovered that, in addition to silenced tumor suppressor genes32 and cancer testis antigens33, DAC and AZA up-regulate immune-related genes34 as a result of DNA hypomethylation-mediated transcriptional activation of human endogenous retroviruses (hERVs)35,36. A similar response was herein observed in AML cells treated with either DAC or GSK3685032 (Fig. 6e,f). While DAC displayed a bell-shaped profile with hERV activation diminishing at the highest dose, GSK3685032 displayed sustained hERV activation at higher doses (Fig. 6f). Analysis of the basal DNA methylation levels suggests that the majority of CpG probes that fall within annotated hERVs are highly DNA methylated (Fig. 6g). Similar to genes that harbored highly methylated promoters (Fig. 4e), an inverse correlation was observed between methylation loss and hERV expression (Fig. 6h). In addition, hERV expression quickly reactivates upon DNA methylation loss (Fig. 6i). In contrast, IFN signature genes primarily exhibited low promoter DNA methylation levels and delayed transcriptional activation, suggesting that induction of IFN pathway genes may be a downstream consequence of hERV reactivation rather than a direct effect of DNA hypomethylation (Fig. 6g,i).
While the transcriptional response was generally comparable between DAC and GSK3685032, suggesting many of the key epigenetic effects of these two compounds are conserved (Fig. 6b,c), DAC also displays unique nonepigenetic mechanisms. For example, DAC induces DNA damage as indicated by the rapid accumulation of γH2AX at doses as low as 16 nM (Fig. 7a,b). This is consistent with its mechanism of action involving incorporation into DNA and subsequent covalent trapping of DNMTs to DNA. In contrast to the covalent binding of DAC, which robustly reduced DNMT1, −3A, and −3B protein levels, noncovalent enzymatic inhibition of DNMT1 by GSK3685032 led to a modest reduction of DNMT1 protein levels with no immediate effects on DNMT3A, DNMT3B or γH2AX (Fig. 7a,b). This highlights a key difference between traditional HMAs and selective, noncovalent, catalytic DNMT1 inhibitors. When overlaying the mechanistic and phenotypic responses observed upon treatment, GSK3685032 consistently shows sustained effects at higher doses in the mechanistic assays (Fig. 7c). In contrast, due to the cytotoxic response observed at higher concentrations of DAC, DNA hypomethylation and gene activation (n = 1,542 genes that were up-regulated by both GSK3685032 and DAC; Extended Data Fig. 5e) exhibit diminishing effects above 350 nM, suggesting DAC may not be able to fully leverage the benefits of DNA hypomethylation observed with GSK3685032 due to its nonepigenetic mechanisms (Fig. 7c). Additionally, the large separation in the concentration of DAC required to induce growth inhibition versus DNA hypomethylation and gene activation suggests that DAC’s nonepigenetic effects contribute to cancer cell growth inhibition.
Fig. 7 |. Comparison of nucleoside versus non-nucleoside DNMT inhibitors.
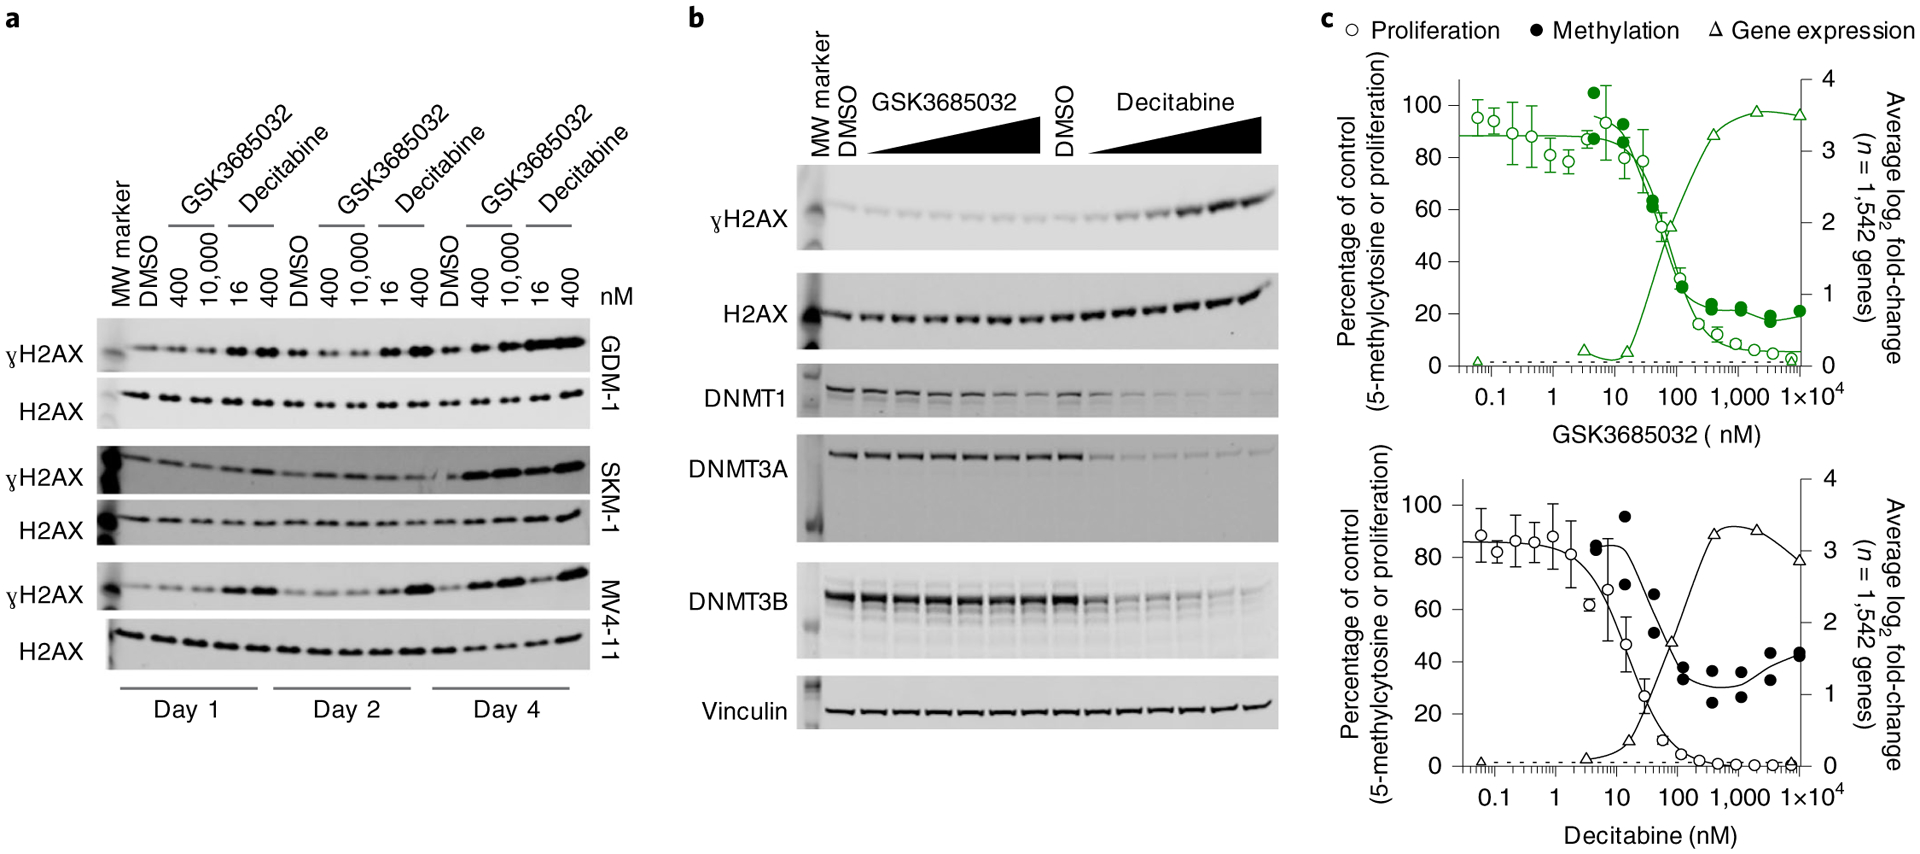
a,b, Western blots were cropped to highlight protein(s) of interest. Images shown are from a single experiment, processed in parallel, and data are representative of two independent experiments. Uncropped images can be found in the source data. MW, molecular weight. a, Induction of ɣH2AX protein levels in MV4–11, GDM-1 or SKM-1 cells treated for 1, 2 or 4 d. Total H2AX is shown as a loading control. b, Changes in ɣH2AX, DNMT1, DNMT3A and DNMT3B protein levels in GDM-1 cells treated for 2 d with a titration of GSK3685032 or DAC (3.2–10,000 nM). Total H2AX and vinculin are shown as loading controls. c, Overlay showing proliferation (day 6, n = 4 biologically independent experiments; average ± s.d.), 5-methylcytosine (day 4, n = 2 biologically independent experiments) and significant gene expression (RNA-seq, FDR < 0.05, |log2 fold-change| > 1; day 4, average of n = 1,542 overlapping genes) changes in DAC- or GSK3685032-treated MV4–11 cells.
DNMT1 inhibition by GSK3685032 displays in vivo efficacy.
When administered to mice, GSK3685032 exhibited low clearance, a moderate volume of distribution, and a blood half-life >1.8 h with dose-proportional exposure from 1 to 45 mg kg−1 (Extended Data Fig. 6a–c). Based on these in vivo absorption, distribution, metabolism and excretion properties, subcutaneous, twice daily dosing of GSK3685032 was utilized to achieve prolonged target engagement (Extended Data Fig. 6d). This dosing schedule was well tolerated with doses up to at least 45 mg kg−1 for ≥4 weeks with no gross adverse effects on either body weight or behavior and grooming (Extended Data Fig. 7a,b). On the other hand, once formulated DAC is chemically unstable and was reconstituted immediately before administration. Additionally, it exhibits poor pharmacokinetic properties as a result of spontaneous hydrolytic cleavage and rapid metabolism by cytidine deaminase16,17. Furthermore, to minimize toxicity following repeated administration, an intermittent dosing schedule was used to achieve a prolonged tolerated treatment regimen.
Subcutaneous xenograft models of MV4–11 and SKM-1 revealed statistically significant dose-dependent tumor growth inhibition with clear regression at ≥30 mg kg−1 GSK3685032 (Fig. 8a,b and Extended Data Fig. 7c–f). Furthermore, following a 4-week observation period after dosing ended, the majority (≥60%) of these animals maintained tumor volumes ≤200 mm3 while off drug (Fig. 8c,d and Extended Data Fig. 7g,h). Focusing on the 45 mg kg−1 group of GSK3685032 in the MV4–11 model, five of ten animals had tumor volumes ≤50 mm3 on the last day of dosing (day 35). Following 30 d off drug, these same five animals maintained tumor volumes ≤50 mm3, demonstrating that a subset of tumors that regressed while on treatment showed a durable response once treatment stopped (Extended Data Fig. 7g). In contrast, DAC only achieved moderate tumor growth inhibition (18% and 57% relative to the vehicle control group in SKM-1 and MV4–11, respectively) which was not statistically significant in either model (Fig. 8a,b and Extended Data Fig. 7c–f). To better replicate AML disease physiology, a disseminated AML model was also explored. Following 30 d of dosing, a statistically significant survival benefit was observed with GSK3685032 at doses of 15, 30 and 45 mg kg−1 and with DAC treatment (Fig. 8e). While DAC exhibited a 13-d survival benefit over vehicle, GSK3685032 showed a >43-d survival benefit with 50% of mice surviving nearly 7 weeks after dosing ended.
Fig. 8 |. GSK3685032 reveals improved in vivo efficacy and tolerability in AML models compared with DAC.
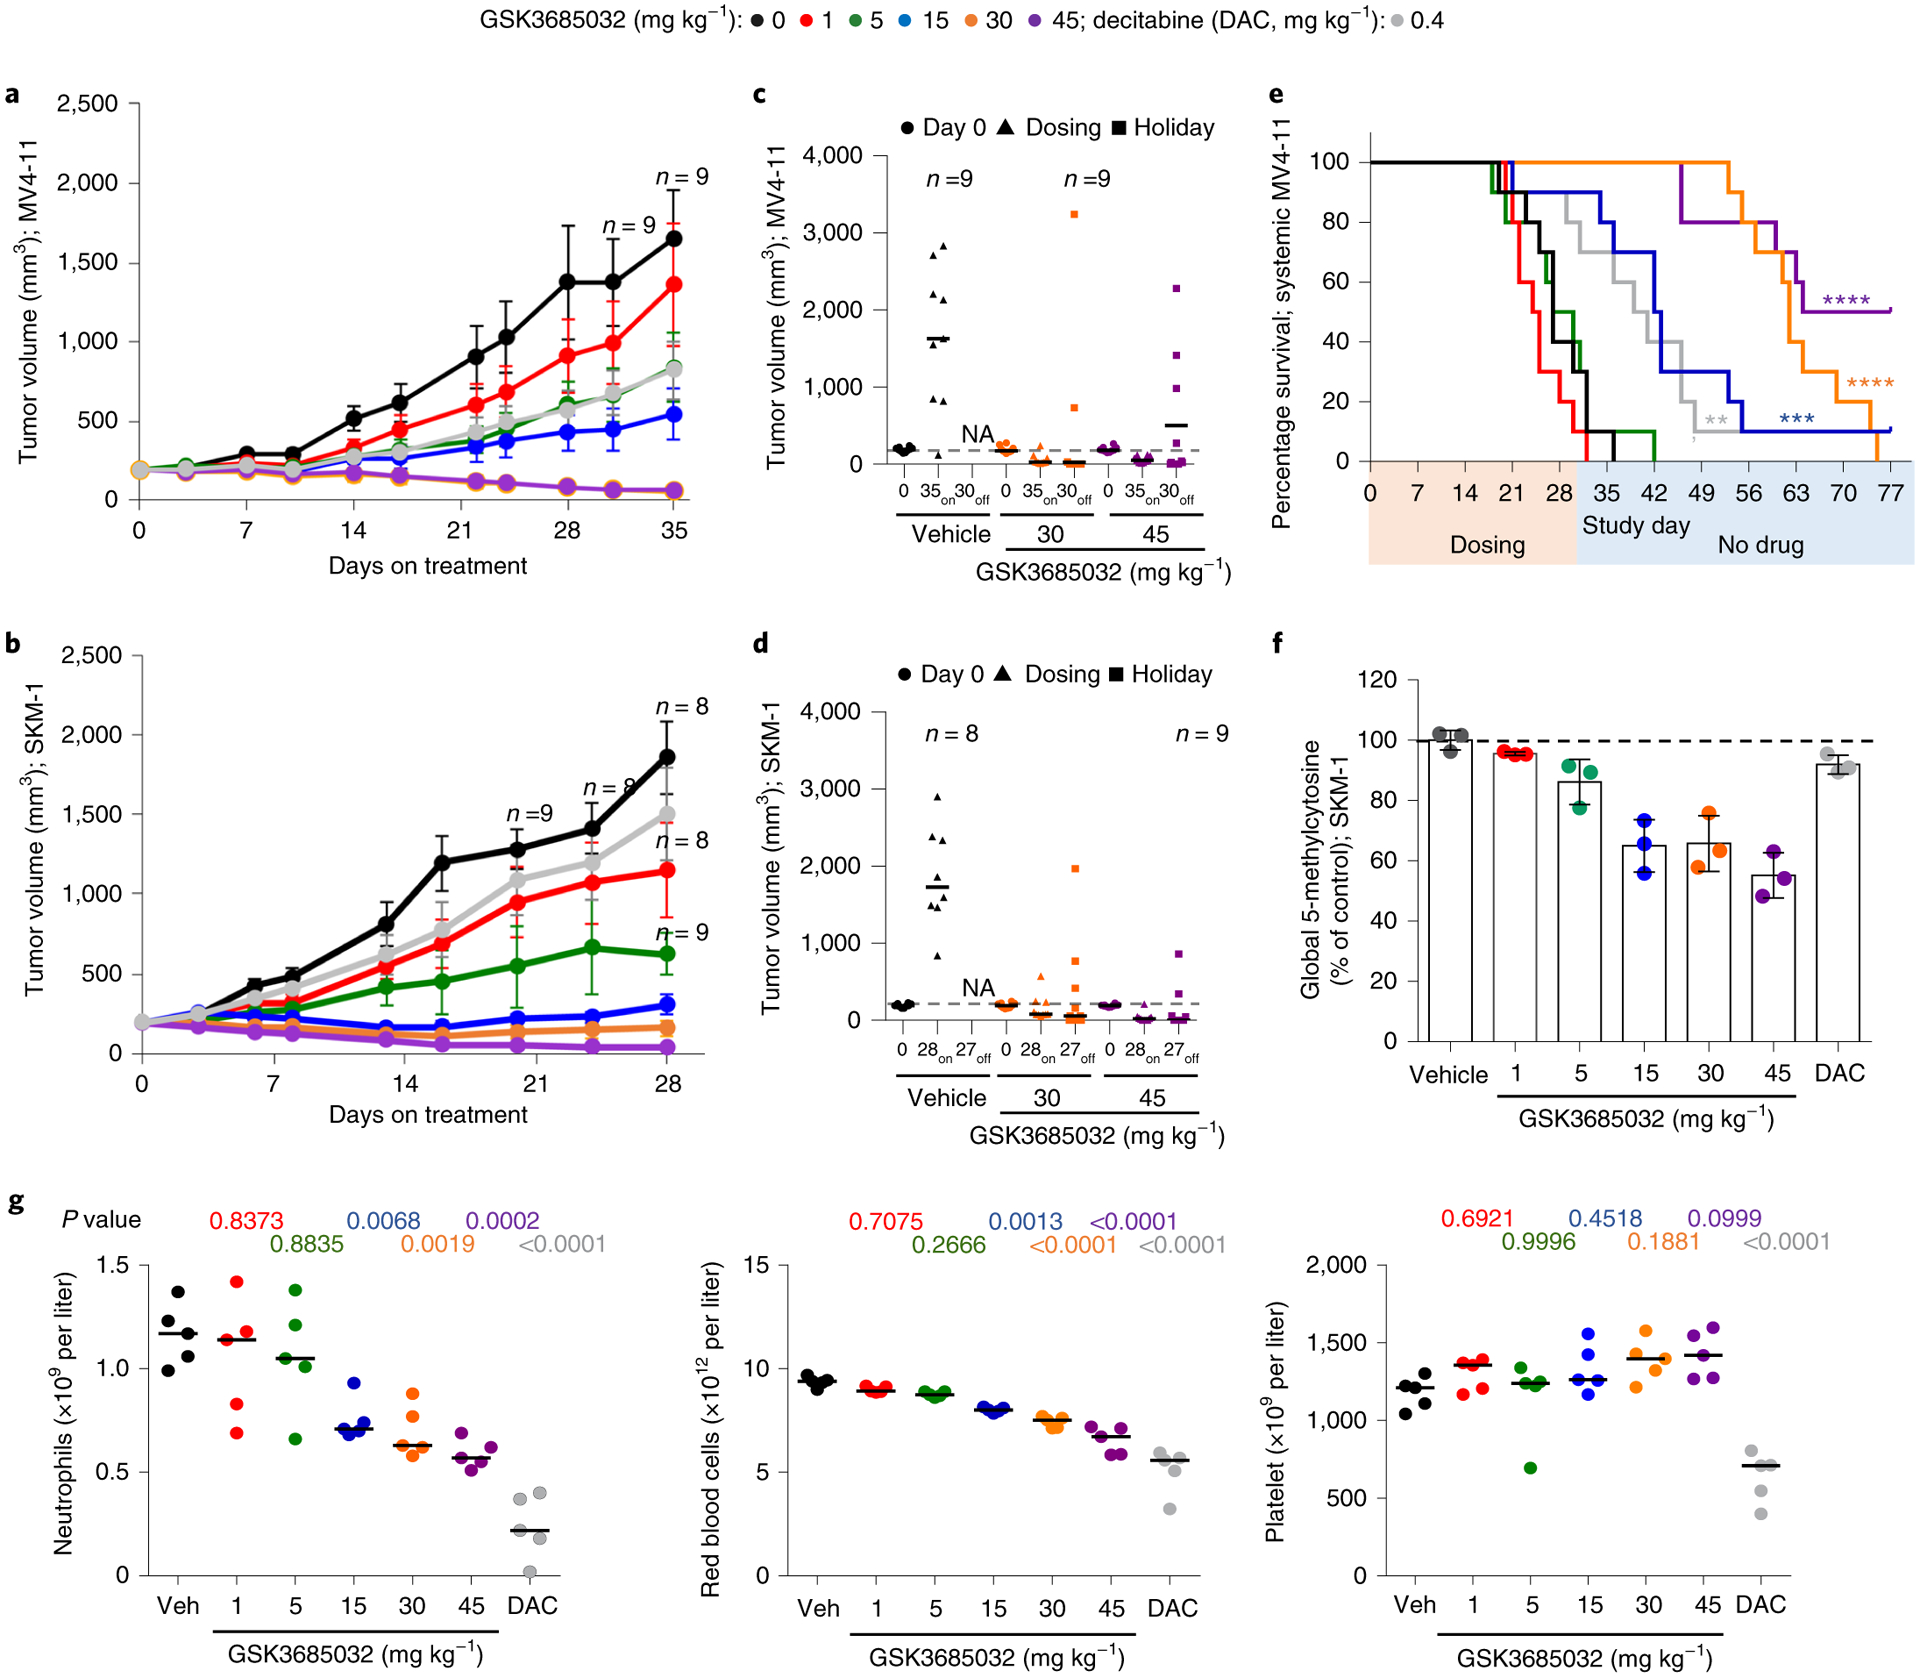
a,b, Tumor volume measurements (n = 10 animals per group at each data point unless marked; average ± s.e.m.) for a subcutaneous MV4–11 (a) or SKM-1 (b) xenograft model following treatment with GSK3685032 (subcutaneous, twice daily) or DAC (intraperitoneal, three times weekly). c,d, Tumor volume measurements at study start, at last dose, and at the end of a dosing holiday for individual animals in a subcutaneous MV4–11 (c) or SKM-1 (d) xenograft model. Solid line represents the median for each group (n = 10 animals per group unless marked). Dotted line represents the median tumor volume for vehicle at study start. No animals remained in the vehicle group at study end (NA). One animal (30 mg kg−1, MV4–11 (c) and 45 mg kg−1, SKM-1 (d)) was inadvertently taken off study at the last dose and did not undergo observation for recovery. e, Kaplan–Meier plot showing animal survival in a disseminated MV4–11 model (n = 10 animals per group) where dosing occurred during the first 30 d. Statistical significance* was calculated using the log-rank (Mantel–Cox) test yielding P values for GSK3685032 of 0.1377 (1 mg kg−1), 0.8080 (5 mg kg−1), 0.0003 (15 mg kg−1), <0.0001 (30 mg kg−1) and <0.0001 (45 mg kg−1), or 0.0034 for DAC. f, Pharmacodynamic changes, measured as global 5-methylcytosine, in SKM-1 tumors (8.5 d, n = 3 animals per group, average ± s.d.). Dotted line represents vehicle control levels of 5-methylcytosine. g, Neutrophil, red blood cell and platelet counts from day 28 of the SKM-1 xenograft study. Solid line represents the median for each group (n = 5 animals). Statistical significance, listed as adjusted P value to account for multiple comparisons, of treatment versus vehicle was calculated using one-way ANOVA, Dunnett’s multiple comparisons test. Veh, vehicle.
Following 8 d of dosing, pharmacodynamic effects were evaluated in the SKM-1 model. Dose-dependent DNA hypomethylation was observed in the tumors at all doses of GSK3685032 with a maximal loss of 46% in the 45 mg kg−1 group (Fig. 8f). In contrast, the maximum-tolerated three times weekly dose of DAC more closely resembled the 1 mg kg−1 GSK3685032 dose with regard to pharmacodynamic activity and tumor growth inhibition (Fig. 8b,f). Given the observed clinical toxicities of DAC, including neutropenia, anemia and thrombocytopenia37, the effect of dosing on peripheral blood was examined in mice. Samples were collected at the end of dosing on day 28 and again after a 27 d recovery period with no dosing (day 55). While DAC induced statistically significant decreases in neutrophils, red blood cells, platelets and a number of other blood cell components, no statistically significant changes were observed with doses of GSK3685032 (1 or 5 mg kg−1) despite achieving similar DNA hypomethylation and tumor growth inhibition (Fig. 8g and Extended Data Fig. 8a,b). While higher doses of GSK3685032 showed reductions in neutrophils and red blood cells, the magnitude of effect was still notably less than that observed with DAC despite these doses showing markedly greater DNA hypomethylation and tumor growth inhibition/regression. Importantly, when re-assessed after a 4-week dosing holiday, all blood parameters for GSK3685032-treated animals returned to normal (Extended Data Fig. 8c).
Discussion
Analogous to how genetic alterations universally accumulate in cancer, aberrant heritable DNA methylation and gene silencing progressively accumulate in cancer cells. However, unlike genetic alterations, DNA hypermethylation is readily reversible upon inhibition of DNMT1, the maintenance methyltransferase. First-generation nucleoside analog HMAs AZA and DAC function in part by reversing these epigenetic changes. Since their discovery, efforts have been ongoing to find alternative, non-nucleoside DNMT inhibitors to overcome the limitations imposed by their poor pharmacokinetic properties and dose-limiting toxicity.
Herein we describe the discovery of GSK3685032, a first-in-class, potent, non-nucleoside, reversible, selective inhibitor of DNMT1. GSK3685032 selectively engages DNMT1 through a unique interaction where the inhibitor competes with the DNMT1 active-site loop for penetration into hemi-methylated DNA and also interacts with the TRD which is distinct to DNMT1. This engagement results in rapid loss of DNA methylation and robust transcriptional activation. Overall, the kinetics of DNA hypomethylation (1–2 d) and transcriptional activation (≥2 d) following treatment with GSK3685032 suggest that the decreased growth and survival of sensitive AML cells (≥4 d) is directly linked to these earlier epigenetic changes. Coinciding with increased enzymatic inhibition of DNMT1, GSK3685032 revealed greater growth inhibition than previously reported non-nucleoside DNMT inhibitors (RG-108, SGI-1027, and MC3343).
While many similarities were observed between GSK3685032 and DAC in vitro, it should be noted that GSK3685032 showed a normal dose response that maintains DNA demethylation and transcriptional activation at higher doses and achieves greater maximal demethylation compared with DAC despite the latter being more potent phenotypically. These observations highlight that while DNA-incorporating pan-DNMT inhibitors and noncovalent, DNMT1-selective inhibitors exhibit partially overlapping effects, traditional HMAs have dose-limiting toxicity related to their nonepigenetic mechanisms of action. Additionally, the level of target engagement for these two classes of compounds differed substantially in vivo due to the limited tolerability of DAC. The greater amount of target engagement and DNA hypomethylation achievable with GSK3685032 clearly translated into greater anti-tumor activity with complete tumor regression and enhanced overall survival in multiple models of AML. Thus, GSK3685032 provides a well-tolerated small molecule suitable to investigate the downstream consequence of selective DNMT1 inhibition in vivo without the complicating toxicity observed with DAC. These DNMT1-selective inhibitors display reduced toxicity with improved tolerability and pharmacokinetics thus providing enhanced clinical opportunity in AML while also offering the potential to expand into additional tumor types, including solid tumor indications, where traditional HMAs have shown limited activity.
Methods
High-throughput screen.
Compounds (100% dimethylsulfoxide) were pre-stamped into a Greiner (782075) plate at a final concentration of 10 μM for single-shot testing or as an 11-point, twofold serial dilution for IC50 determination (100 μM top concentration). A subset of wells contained 100% dimethylsulfoxide only (high and low controls.) DNA duplex was acquired from IDT (5ʹ-CCTCTTCTAACTGCCAT5 me-dCGATCCTGATAGCAGGTGCATGC-3ʹ with complement strand 3ʹ-GGAGAAGATTGACGGTAGCTAGGACTATCGTCCACGTACG-5ʹ) and is referred to as 40-mer hemi-methylated DNA for subsequent methods. Final assay conditions consisted of 10 nM DNMT1 (601–1600, Gene ID 1786, Proteros Biostructures), 1,000 nM SAM (13.3% 3H-SAM, American Radiolabeled Chemicals, ART-0288) and 200 nM DNA in 50 mM HEPES pH 8.0, 2 mM MgCl2, 1 mM dithiothreitol, 0.01% BSA and 1% dimethylsulfoxide. Substrate mix (2×) was added to the reaction plate followed by DNMT1 (2×) to all wells except for the low controls (1× assay buffer). Reactions were incubated for 40 min at room temperature, quenched with cold SAM (0.5 mM) and captured using PEI PS Imaging Beads (1 mg ml−1, PerkinElmer RPNQ0098). Plates were read on a ViewLux (PerkinElmer) using a 613/655-nm emission filter. Data were fit in ActivityBase (IDBS) to yield IC50 or percentage inhibition values.
Recombinant DNMT protein generation.
Sf9 cells were infected with recombinant baculoviruses encoding the desired protein and grown for 72 h at 27 °C. Cells were lysed and purified using column chromatography at a purity of ≥90%. Flag-6His-tev-DNMT1 (full-length, Gene ID 1786) was purified using Nickel-nitrilotriacetic acid (Ni-NTA), Source 15Q and Superdex 200. Both truncated Flag-6His-tev-DNMT1 (601–1600) and mutated Flag-6His-tev-DNMT1 (H1507Y) were purified using Ni-NTA and Superdex 200. Co-expressed 6His-MBP-tev-DNMT3B (568–853; Gene ID 1789) and 6His-GST-tev-DNMT3L (160–368; Gene ID 29947) or 6His-MBP-tev-DNMT3A (627–912; Gene ID 1788) and 6His-GST-tev-DNMT3L (160–368; Gene ID 29947) were purified via glutathione Sepharose and amylose. Murine DNMT1 (mDNMT1) with an N-terminal Flag-6H-tev tag (731–1602; Gene ID 13433) was purified via Ni-NTA, Heparin and Superdex 200. For mDNMT1, the tag was removed, and the protein was dephosphorylated overnight at 4 °C with lambda phosphatase and subsequently purified via heparin and gel filtration. For crystallization, human DNMT1 (729–1600) with an N-terminal 6His-SUMO tag was expressed in Escherichia coli and purified via three-column chromatography (GE HisTrap, HiTrap Q and HiTrap Heparin High Performance)38. The 6His-SUMO tag was cleaved with ULP1 (ubiquitin-like protease 1).
Fluorescence-coupled breaklight assay.
The activity of DNMTs using a hemi-methylated hairpin oligonucleotide was examined as previously described39. Final assay concentrations consisted of 125 nM DNA oligonucleotide with (1) 40 nM full-length DNMT1, 2 μM SAM; (2) 600 nM DNMT3A/3L, 2.5 μM SAM; or (3) 300 nM DNMT3B/3L, 0.15 μM SAM. Reactions were quenched after 40 min (26 °C) for DNMT1 and after 120 min (37 °C) for DNMT3A/3L and DNMT3B/3L. Compounds (10-point, threefold serial dilution, 100% dimethylsulfoxide) were pre-stamped in black reaction plates (2% dimethylsulfoxide final). A Gla1 counter screen was run by replacing the DNMT reaction with a 1:4 ratio of fully/hemi-methylated hairpin oligonucleotides (5ʹ-FAM-ATCTAG5 me-dCG5me-dCATCAGTTTTCTGATG5me-dCG5me-dCTAGAT-Dabcyl-3ʹ and 5ʹ-FAM-ATCTAGCG5me-dCATCAGTTTTCTGATG 5me-dCG5me-dCTAGAT-Dabcyl-3ʹ custom synthesized by ATDBio). For reversibility studies, following a 20-min preincubation of DNMT1 with compound (10× IC50), the complex was rapidly diluted 100-fold upon the addition of substrates. Recovery of DNMT1 activity was assessed over 70 min by quenching at different time points following dilution. Data were fit to a fixed steady-state velocity equation as noted by Ariazi et al.40.
DNA binding assay.
The ability of compounds to bind to the hemi-methylated hairpin oligonucleotide was assessed using differential scanning fluorimetry. A PCR plate containing 100 μM compound and 200 nM DNA in 20 mM MES pH 6.5, 25 mM NaCl, 0.5 mM MgCl2, 0.01% Triton X-100, 1 mM dithiothreitol and 2% dimethylsulfoxide was exposed to temperature increases at 1 °C min−1 between 25 °C and 95 °C with a fluorescent measurement taken after each increase (Mx3005P thermocycler). DNA oligonucleotide melting temperature (Tm) for each compound relative to dimethylsulfoxide was determined.
Compound synthesis.
GW623415X (Supplementary Data Table 2) can be purchased (CAS 184530-72-1) or prepared according to Dyachenko et al.41. Synthetic preparation of additional compounds within Supplementary Data Table 2 can be found in patent WO2017216727A1 based on the following key: GSK3482364, Example 3; GSK3484862, Example 64 while GSK3484861 is the second eluting enantiomer from the preparative chiral HPLC resolution of GSK3482364; GSK3730808, Example 147; and GSK3685032, Example 143. GSK3510477 can be prepared by using methylamine in lieu of ammonium hydroxide in the synthetic preparation used in WO2017216727A1 Example 3 Step 4. See Example 471 in WO2017216727A1 for the preparation of GSK3830052 (Fig. 2a). GSK3844831 (Extended Data Fig. 2a) can be prepared from commercially available 4-benzoylbenzaldehyde, via formation and subsequent oxidation of the α-aminonitrile, then condensation with the product of WO2017216727A1 Example 244 Step 6. GSK3901839 (Extended Data Fig. 2a) can be prepared from commercially available 2-amino-2-(4-bromophenyl)acetic acid after Boc protection of the amine and esterification via conversion of the bromide to the 2,2,2-trifluoroacetyl, and subsequent conversion to the trifluoromethyl-3H-diazirine based on the precedented synthetic methods42 followed by condensation of the resulting product with the product of WO2017216727A1 Example 244 Step 6. Analytical characterization data that demonstrate purity and establish the identity of compounds described can be found in the Supplementary Data Table 5.
Compound solubility (fasted state simulated intestinal fluid (FaSSIF)).
The solubility of solid compounds in FaSSIF was determined at pH 6.5 after 4 h of equilibration at room temperature as previously described43.
Compound lipophilicity (chromLogD).
The chromatographic hydrophobicity index (CHI)44,45 values were measured using a reversed-phase HPLC column (50 × 2 mm2 3 μM Gemini-NX C18, Phenomenex) with fast acetonitrile gradient at starting mobile phase of pH values 2, 7.4 and 10.5. CHI is linearly transformed into chromLogD46 by least-square fitting of experimental CHI values to calculated cLogP values for over 20,000 GSK research compounds using the following formula: chromLogD = 0.0857CHI − 2.00.
Radioactive SPA.
All assays used 40-mer hemi-methylated DNA unless specified and SAM was typically made up of 32% 3H-SAM (PerkinElmer NET155H001MC). Final buffer conditions were 20 mM Tris pH 7.5, 1 mM dithiothreitol, 1 mM EDTA, 5% glycerol and 2.4% dimethylsulfoxide for full-length DNMT1 or 20 mM Tris pH 8.0, 1 mM dithiothreitol, 1 mM EDTA, 25 mM NaCl, 1 mM CHAPS, 0.02% pluronic F127 and 2.4% dimethylsulfoxide for DNMT3A/3L and DNMT3B/3L. Depending on the condition or enzyme tested, final assay concentrations were as follows: (1) 30 nM DNMT1, 80 nM DNA and 1.7 μM SAM; (2) 30 nM DNMT1, 0.25 μg ml−1 poly(dIdC) (Sigma P4929) and 2.5 μM SAM; (3) 80 nM H1507Y DNMT1, 120 nM DNA and 4.3 μM SAM; (4) 25 nM DNMT3A/3L, 60 nM DNA and 0.165 μM SAM; or (5) 12 nM DNMT3B/3L, 60 nM DNA and 0.33 μM SAM. Compounds (typically 10-point, threefold serial dilution) were dissolved in dimethylsulfoxide and pre-stamped into a 96-well plate (Corning, 3884). The order of addition varied if a preincubation step was included; however, typically 2× substrate mix was added followed by 2× enzyme to initiate the reaction. Reactions were incubated for 30 min (or 60 min if using poly(dIdC)) at room temperature for DNMT1 or at 37 °C for DNMT3A/3L and DNMT3B/3L, quenched with SAH and captured using PEI PVT SPA beads (2 mg ml−1, PerkinElmer RPNQ0097). Plates were read on a MicroBeta (PerkinElmer). Data were fit using a three-parameter dose–response equation in GraFit (Erithacus Software) to yield IC50 values.
Histone methyltransferase and kinase selectivity.
Inhibitor selectivity was assessed at Reaction Biology Corp. (Malvern, PA, USA) using proprietary HotSpot technology for methyltransferases47 and kinases48. GSK3685032 was tested at a single concentration (10 μM) against the kinase panel. The methyltransferase panel plus PIM1, PKD2/PRKD2 and DYRK2 were tested in IC50 format (10-point, threefold serial dilution).
Investigation of covalent adduct.
Murine DNMT1 (731–1602, 5.6 μM) was incubated with 14-mer hemi-methylated DNA (25 μM) in 20 mM Tris pH 7.5, 50 mM NaCl, 5 mM dithiothreitol, 20% glycerol and 2.5% dimethylsulfoxide in the absence or presence of GSK3685032A (25 μM) for 20 h. Aliquots were then diluted fivefold in a 0.05% TFA, 0.1% formic acid solution and 20 pmol of protein sample was injected for intact mass analysis on an Agilent 6224 TOF LC–MS instrument and possible detection of covalent adducts. The 14-mer hemi-methylated DNA duplex was purchased from IDT (5ʹ-GGAGGC5me-dCGCCTGCT-3ʹ with complement strand 3ʹ-CCTCCGGCGGACGA-5ʹ).
Photoaffinity labeling.
Murine DNMT1 (731–1602, 5.7 μM) was incubated with 14-mer hemi-methylated DNA (25 μM) in 20 mM Tris pH 7.5, 50 mM NaCl, 5 mM dithiothreitol, 20% glycerol, 2.5% dimethylsulfoxide in the presence of 25 μM photoreactive inhibitor (GSK3844831 or GSK3901839). Photolysis was carried out for 45 min under ultraviolet light (λ = 350 nm). Intact mass analysis was used to monitor the level of photolabeling incorporation. Photolabeled mDNMT1 underwent proteolytic digest with pepsin and factor-XIII. Labeled protein fragments were identified by differential mapping relative to unlabeled mDNMT1 and the labeled amino acids determined using liquid chromatography (LC) with tandem mass spectrometry (MS/MS) based sequencing (Thermo Orbitrap LTQ-XL). The MS/MS data were searched against an internal protein sequence database with Mascot v.2.6 (Matrix Science) to identify the location of covalent labeling.
DNMT1–DNA–inhibitor complex formation.
The DNMT1–DNA complex was prepared by incubating DNMT1–DNA–SAH in a molar ratio of ~1:5:10 for 2 h, and further purified via a GE HiTrap Heparin HP column. The duplex DNA (5ʹ-GAGGCMGCCTGC-3ʹ and 5ʹ-GCAGGZGGCCTC-3ʹ, where M, 5-methylcytosine; and Z, zebularine) contains 12-base-pair hemi-methylated oligonucleotides with zebularine in place of target cytidine (synthesized by New England Biolabs). Before crystallization, the purified DNMT1–DNA complex was incubated for 1 h at 4 °C with inhibitor (GSK3685032 or GSK3830052 in dimethylsulfoxide) in a ~1:8 molar ratio of protein-DNA to inhibitor.
Crystallization.
Crystals of DNMT1–DNA complexes, in the absence and presence of inhibitor, were grown via the sitting drop vapor diffusion method using an Art Robbins Gryphon Crystallization Robot at room temperature (~19 °C). The crystallization conditions contained 14–18% polyethylene glycol (PEG) 3350 and 0.1 M citric acid (pH 5.1). Crystals usually appeared overnight and were picked up and flash frozen in mother liquor supplemented with 20% ethylene glycol.
Structure determination and refinement.
X-ray diffraction datasets were collected at the SER-CAT beamline 22ID of the Advanced Photon Source at the Argonne National Laboratory with X-ray wavelength of 1.0000 Å. The complex structures of DNMT1–DNA, in the absence or presence of inhibitor, were solved by molecular replacement of the PHENIX PHASER module49 utilizing the truncated protein coordinates from PDB 3SWR and DNA coordinates from PDB 4DA4 as search models. The crystals with bound inhibitor were isomorphous to the native complex; the difference electron density maps were used for locating bound inhibitor molecules. SMILES strings were input into the PHENIX eLBOW module50 to generate and optimize inhibitor restraints and supply its structure in PDB format. PHENIX REFINE31 was used for all refinements which had 5% randomly chosen reflections for validation by the R-free value. COOT51 was used for inhibitor placement and model corrections between refinement rounds. Structure quality was analyzed during PHENIX refinements and later validated by the PDB validation server.
Protein sequence alignment.
DNMT family sequence alignment was conducted using BioEdit Sequence Alignment Editor for Windows (Tom Hall, Ibis Therapeutics) based on DNMT1 (NP_001124295), DNMT3A (NP_072046) and DNMT3B (NP_008823).
Cell culture.
Cell lines were obtained from the American Type Culture Collection, the Deutsche Sammlung von Mikroorganismen und Zellbulturen or Horizon Discovery and maintained in the recommended cell culture media at 37 °C in 5% CO2.
Compound stability.
MV4–11 cells or media were plated in 10-cm dishes 24 h before treatment with 100 or 1000 nM compound and incubated at 37 °C. Samples were collected at the indicated time point and analyzed using specific and sensitive HPLC–MS/MS methods to quantify compound. Individual samples were protein precipitated with acetonitrile and analyzed on a Waters Acquity uPLC followed by MS/MS analysis on a Sciex API5000 employing positive-ion electrospray ionization. The methods had a lowest limit of quantification of 2.50 and 1.00 ng ml−1 for DAC and GSK3484862, respectively. Unless stated otherwise, cells lines were re-dosed with DAC (MP Biomedicals) every 48 h for all subsequent studies due to compound instability.
Differentiation of mouse embryonic fibroblast cells.
C3H/10T1/2 cells (CCL-226) were seeded between the 9th and 15th passage at 2,000 cells per plate in 60-mm dishes, and treated for 24 h with DAC (200 or 300 nM) or for 72 h with GSK3484862 (200 or 2,000 nM). Cells were observed daily for 40 d for muscle formation (between days 12 and 20) then fat formation (between days 21 and 30), which both occurred within the same dishes. Images were acquired with an ACCU-SCOPE Excelis camera on a Motic AE31E Microscope and captured using the program CaptaVision. Application of greyscale was done in ImageJ (https://imagej.nih.gov/ij/). Brightness and contrast were adjusted equally for all images in Adobe Photoshop CC 2017. For gene expression studies, C3H/10T1/2 cells were seeded as described and treated with either DAC (200 nM) for 24 h or GSK3484862 (200 nM or 500 nM) for 72 h followed by media exchange after specified treatment time and then subsequently every 3 d. Cells were collected on indicated days (7–28) from the start of drug treatment. The Direct-zol RNA MiniPrep Plus kit (Zymo Research, R2072) with DnaseI digestion was used to extract RNA according to the manufacturer’s protocol. The iScript gDNA Clear cDNA Synthesis Kit (Bio-Rad, 1725035) was used to generate complementary DNA with 600 ng to 1 μg input RNA, depending on RNA yield. One microliter of cDNA was used in a 20-μl quantitative PCR (qPCR) reaction with 250 nM primers and 10 μl of KAPA SYBR FAST qPCR Master Mix (2×) (Kapa Biosystems, KK4618). Primers for mouse RNA transcripts Myod1 (forward: 5ʹ-GGT GTC GTA GCC ATT CTG CC-3ʹ; reverse: 5ʹ-CTA CAG TGG CGA CTC AGA TGC-3ʹ), Adipoq (forward: 5ʹ-TGT TGC AGT AGA ACT TGC CAG-3ʹ; reverse: 5ʹ-GTT CCC AAT GTA CCC ATT CGC-3ʹ) and TATA-box-binding protein (Tbp) (forward: 5ʹ-GCA GGA GTG ATA GGG GTC AT-3ʹ; reverse: 5ʹ-CCC CAC AAC TCT TCC ATT CT-3ʹ) were used to measure gene expression. The conditions of qPCR were as follows: 95 °C for 3 min, following by 45 cycles of 95 °C for 10 s, 60 °C for 20 s and 72 °C for 30 s. All targets had cycle threshold (Ct) values between 22 and 26 cycles. Displayed values are delta-delta quantification cycle (ΔΔCq) values normalized to Tbp expression.
Cell growth–death assay.
Cell proliferation assays were performed using CellTiter-Glo (Promega) as previously described52. Cells were treated with 0.15% dimethylsulfoxide vehicle control or an 18-point, twofold serial dilution of compounds. Plates were read on a BioTek Synergy Neo microplate reader. GDI was calculated as previously described53 and is utilized as a measure of cell growth and represents the number of cells remaining following treatment ranging from −100 (complete cell death) to 100 (no inhibition).
Proliferation data for the 51 hematological cancer cell lines were acquired at Horizon Discovery Ltd using their 2D OncoSignature Cell Panel Screening Service (10-point, threefold serial dilution tested in triplicate). ATP levels were measured following 6 d of treatment using CellTiter-Glo (Promega). All data points are collected via automated processes and are subject to quality control and analyzed using Horizon’s proprietary software.
Directed mutagenesis.
Expression plasmids were made containing full-length DNMT1 with directed mutations (GeneArt, Thermo) resulting in alanine substitutions affecting 49 residues spanning amino acids 1230–1578 of DNMT1 (NM_001379.3, see Supplementary Table 6). DNMT1 mutants were transfected into HEK293T cells that were then grown under sustained double selection (400 ng ml−1 G418 and 10 μM of a racemic mixture of GSK3484862) for 4 weeks. For comparison, HEK293T cells transfected with wild-type DNMT1 plasmid were under G418 selection only. Following selection, 14 DNMT1 mutants (noted in Extended Data Fig. 4d) survived and were profiled in a cell growth–death assay. DAC was not re-dosed in the 6-d proliferation assay using these cells.
Thermal shift assay.
A thermal shift assay examining recombinant DNMT1 (601–1600) was performed as described previously54. The stability of DNMT1 in the presence of compound (0.13–50,000 nM, fivefold serial dilution) or dimethylsulfoxide was assessed at 52 °C (DNMT1 Tm + 1 °C). Isothermal dose–response curves were also generated with a ternary mixture of DNMT1, DNA duplex and compound at 49 °C (40-mer unmethylated) or 56 °C (40-mer hemi-methylated). Heatmap visualization was generated using an R (v.3.5.1) package called pheatmap (v.1.0.12). The cellular thermal shift assay was conducted as described previously55, where HepG2 cells were incubated for 90 min with compound (4.88–20,000 nM, fourfold serial dilution) or dimethylsulfoxide. Cells were heated in a thermal cycler (55.5 °C, 3 min) and lysed and the soluble protein fraction was proteolytically digested. The relative DNMT1 abundance was determined with TMT-10 plex (Thermo Fisher) and quantitative mass spectrometry56.
Vimentin promoter methylation.
Methylation changes at the highlighted CpG site (CGCCCACCCTCCCCGCTTCTCGCTAGGTCCCTATTGGCTGGCGCGCTCCGCG) within the vimentin promoter were assessed using methylation pyrosequencing. DNMT3B −/− HCT-116 (Horizon Discovery R02–023) cells were seeded at 175,000 cells per well per 3 ml in 6-well tissue-culture (TC)-treated plates. After 6 h, media was replaced with fresh media containing compound (7-point, fivefold serial dilution). At 72 h, genomic DNA was extracted using the Quick-gDNA MiniPrep Kit (Zymo, D3006) according to the manufacturer’s instructions followed by bisulfite treatment using EZ DNA Methylation-Gold Kit (Zymo, D5005). Using 10 ng of bisulfite DNA template, PCR conditions were as follows: 95 °C for 15 min, 45 cycles of 94 °C for 30 s, 60 °C for 30 s and 72 °C for 30 s, where the final cycle ended at 72 °C for 10 min (primers: forward: 5ʹ-AGTATTTTAGGGTGAGTTTAGTTTAGAT-3′; reverse: biotin-5ʹ-AAATCCCCTCCCACTACCA-3′). Pyrosequencing was performed using PyroMark Q24 (Qiagen; sequencing primer: 5′-GTTTTTATTTTAT-3′).
Vimentin gene expression.
DNMT3B −/− HCT-116 cells were seeded at 10,000 cells per well per 100 μl in 96-well TC-treated plates. After 6 h, media was replaced with fresh media containing compound (7-point, fivefold serial dilution). After 48 h, RNA lysates were isolated using the FastLane Cell Multiplex Kit (Qiagen, 216513) per manufacturer’s protocol, except using reduced volumes. Lysate was incubated at 75 °C (5 min), on ice (5 min) and then briefly centrifuged. RNA (4 μl, diluted 1:32) was transferred to a 384-well PCR plate with 8.5 μl per well of qPCR with reverse transcription (RT–qPCR) master mix (6.25 μl of 2× Quantitect Probe RT–PCR master mix, 0.625 μl of primer (Thermo Fisher; ACTB, Hs01060665_g1 and VIM, Hs00185584_m1), 0.125 μl of Quantitect RT mix and 0.875 μl of nuclease-free water). qPCR conditions were 50 °C for 30 min, 95 °C for 15 min, followed by 40 cycles of 94 °C for 15 s and 60 °C for 1 min. The assay was modified slightly, including miniaturization, to assess wild-type HCT-116 cells. Cells were seeded at 2,000 cells per well per 30 μl in 384-well TC-treated plates pre-stamped with compound (100 nl, 11-point, threefold serial dilution).
Western blotting.
Cells were plated in 15-cm dishes 24 h before treatment with 0.1% dimethylsulfoxide or compound (6-point, fivefold serial dilution). Cells were lysed with 4% SDS and homogenized using QIAshredder columns (Qiagen). Proteins were separated on 4–12% Bis-Tris gels (Invitrogen) and transferred to nitrocellulose membranes (Invitrogen). Membranes were blocked with 5% milk and probed with primary antibodies against DNMT1 (1:1,000, Cell Signaling Technology, 5032), DNMT3A (1:1,000, Cell Signaling Technology, 3598), DNMT3B (1:1,000, Cell Signaling Technology, 67259), Phospho-Histone H2A.X (1:1,000, Cell Signaling Technology, 9718), Histone H2A.X (1:1,000, Cell Signaling Technology, 2595) or Vinculin (1:100,000, Sigma, SAB4200080). After washing, membranes were probed with IRDye secondary antibodies (LI-COR), washed again and imaged using a LI-COR Odyssey CLx Imager.
Caspase 3/7 assay.
Caspase 3/7 activity was measured using Caspase-Glo 3/7 (Promega) as per the manufacturer’s instructions. Cells were cultured in 384-well plates, treated with 0.15% dimethylsulfoxide or compound (18-point, twofold serial dilution), and read on a BioTek Synergy Neo microplate reader. Values were normalized to CellTiter-Glo (Promega) levels at each time point. Heatmap visualization was generated using an R package called pheatmap using log2-transformed fold-shift values.
Global DNA methylation (5-methylcytosine) assay.
Cells were plated in 10-cm dishes 24 h before treatment with 0.1% dimethylsulfoxide or compound (8-point, threefold serial dilution). DNA was isolated from cells or SKM-1 tumors using the Quick-DNA Miniprep Kit (Zymo Research) according to the manufacturer’s instructions. For each sample, DNA Degradase Plus (Zymo Research) was added according to the manufacturer’s instructions to 1,250 ng of DNA to generate single nucleosides. For each sample, 10 μl of Degradase-treated DNA was combined with 190 μl of acetonitrile/water/ammonium hydroxide (90:10:0.1) solution containing 100 ng ml−1 2ʹ-deoxycytidine-13C,15N2 (Toronto Research Chemicals) labeled standard. An HPLC–MS/MS57 was optimized to quantify 2-deoxycytidine and 5-methyl-2-deoxycytidine was optimized to quantify 2-deoxycytidine and 5-methyl-2-deoxycytidine. The analytes and labeled standard were separated by HILIC (hydrophilic interaction liquid chromatography) using an Acquity BEH Amide, 1.7 μm, 2.1 × 50 mm2 column on a Waters Acquity UPLC followed by MS/MS analysis on a Sciex API5000 employing positive-ion turbo spray ionization. Concentrations of 2-deoxycytidine and 5-methyl-2-deoxycytidine were determined using standard curves generated from pure 2ʹ-deoxycytidine (Sigma-Aldrich) and 5-methyl-2ʹ-deoxycytidine (Santa Cruz Biotechnology). Concentrations of 5-methylcytosine were normalized to total cytosine concentrations to determine percentage of 5-methylcytosine. Values from treated samples were normalized to vehicle control values.
RT–qPCR.
Cells were plated in 10-cm dishes 24 h before treatment with 0.1% dimethylsulfoxide or compound (8-point, threefold serial dilution). RNA was isolated from cells using the RNeasy Mini Kit (Qiagen) according to the manufacturer’s instructions. For each sample, 2,500 ng of RNA was reverse transcribed using the High Capacity cDNA Reverse Transcription kit (Applied Biosystems) according to the manufacturer’s instructions. Additionally, standard curves were generated from reverse-transcribed serially diluted pooled RNA. The cDNA was diluted in TaqMan Fast Advanced Master Mix (Applied Biosystems) and TaqMan gene expression assays (Applied Biosystems; ACTB, Hs99999903_m1; GAPDH, Hs99999905_m1; IFI27, Hs01086373_g1; CXCL11, Hs00171138_m1; MAGEA4, Hs00751150_s1; HLA-DQA1, Hs03007426_mH) according to the manufacturer’s instructions. Samples were amplified using a QuantStudio Flex 7 Real-Time PCR System (Applied Biosystems) according to manufacturer’s instructions. Ct values were converted to RNA concentrations using standard curves then normalized to reference genes. Data are expressed as fold-change over control.
Genomic methylation studies.
Cells were plated in 6-well or 10-cm dishes 24 h before treatment with 0.1% dimethylsulfoxide, GSK3484862 (1 μM), GSK3510477 (10 μM), GSK3685032 (400 nM or 6-point, fivefold serial dilution) or DAC (400 nM or 6-point, fivefold serial dilution). Cells were treated for 24–144 h before sample collection. DNA was isolated using Quick-DNA Miniprep Kit (Zymo Research). DNA was bisulfite converted and methylation levels were quantified using Methylation EPIC BeadChip kits (Illumina) at the NYU Genome Technology Center. Idat files from Illumina Methylation EPIC BeadChip arrays were Swan normalized using the minfi R package v.1.28.0 in R v.3.5.2. Normalized beta values were reported for each sample and annotated using the IlluminaHumanMethylationEPICanno.ilm10b2.hg19 R package v.0.6.0. All methylation probes overlapping hERVs were identified using the BEDTools v.2.26.0 intersect function with the annotation file and EPIC array annotation.
Genomic gene expression studies.
Cells were plated in 6-well or 10-cm dishes 24 h before treatment with 0.1% dimethylsulfoxide, GSK3484862 (1 μM), GSK3510477 (10 μM), GSK3685032 (400 nM or 6-point, fivefold serial dilution) or DAC (400 nM or 6-point, fivefold serial dilution). Cells were treated for 24–144 h before sample collection. For RNA sequencing (RNA-seq), RNA was isolated according to the manufacturer’s instructions using the RNeasy Mini Kit (Qiagen). Quality and concentration of RNA were determined with an Agilent Bioanalyzer and Nanodrop (Thermo Fisher), respectively. RNA libraries were prepared from 1,000 ng of input using a TruSeq Stranded Total RNA Library Prep Gold kit (Illumina) with 11 cycles of amplification before sequencing on a NovaSeq 6000 sequencing system (Illumina; ~100 M 2 × 150 bp per sample) at NYU Genome Technology Center. Quality control of FastQ sequencing files was performed with FastQC v.0.11.8 to assess the quality per base and overall sequence quality (http://www.bioinformatics.babraham.ac.uk/projects/fastqc/). RNA-seq FastQ files were aligned to GENCODE GRCh38.v23 using STAR v.2.5.2b two-pass aligner for transposable element expression58 allowing for a max 100 alignments in the genome with the –outFilterMultimapNmax 100 –outFilterMultimapNmax 100 flags for downstream input into Tetranscripts v.2.0.2 (ref.59). Quality control of alignments was performed using RSeQC v.2.6.6. Mitochondrial, ribosomal and poor-quality alignments were removed using RSeQC split_bam function for each bam alignment60. Reports of all tested features for all samples from FastQC Salmon and RSeQC were made using MultiQC v.1.7 (ref.61). All sequencing and alignment files passed quality control. Transcript quantification was performed using Salmon v.0.12.0 (ref.62) with the –gcBias flag raised, and output files were imported into DEseq2 v.1.22.2 using the tximport function v.1.10.1 (ref.63) for differential expression. Differential expression of each time point and dose comparison was performed with DEseq2, a Bayesian statistics algorithm, using default settings for priors and other parameters normalized for plate preparation batch effects64. Expression changes with Benjamini–Hochberg65-adjusted P values (FDR) < 0.05 and |log2 fold-change| > 1 were considered significant. Pre-ranked gene set enrichment analysis (GSEA) of the Hallmark, Canonical pathways, Biocarta and Reactome gene sets from MSigDB was performed using fGSEA v.1.8.0 with DEseq2 outputs sorted by t statistic. Venn diagrams were generated using bioVenn webtool66. Heatmaps of log2 fold-changes from DEseq2 were generated using the heatmap.2 function from the R package gplots v.3.0.1. For transposable element differential expression, multimapped alignment files were used as input for TEtranscripts count table generation using the gtf annotation of transposable elements provided by the TEtoolkit website (Hammell laboratory). Boxplots were generated using the TEtranscripts and DEseq2 log2 fold-change of all transposable elements reported in the sample comparison. Unique STAR alignment files were divided by strand and each strand alignment loaded into Integrative genomics view (IGV) genome browser v.2.4 (ref.67) for viewing individual loci.
In vivo studies.
All studies were conducted in accordance with the GSK Policy on the Care, Welfare and Treatment of Laboratory Animals and were reviewed either by the Institutional Animal Care and Use Committee at GSK or by the ethical review process at the institution where the work was performed. Animals were group housed in polycarbonate boxes on a 12-h light cycle at 68 –79 °F and 30–70% humidity. Data capture and analysis were conducted using Study Director Software v.3.1.399.8 (Studylog Systems). At Charles River Laboratories (NC), mice were housed on irradiated Enrich-o’cobs Laboratory Animal Bedding in static microisolators on a 12-h light cycle at 68–72 °F and 40–60% humidity.
GSK3685032 or vehicle (10% captisol adjusted to pH 4.5–5 with 1 M acetic acid, stored for up to 1 week at 4 °C) was administered subcutaneously, twice daily, at a dosing volume of 10 ml kg−1 (0.2 ml per 20 g of body weight). DAC (Sun Pharmaceutical Industries) was administered by intraperitoneal injection, three times per week, at a dosing volume of 10 ml kg−1. DAC was reconstituted with the appropriate amount of manufacturer’s diluent (68 mg of monobasic potassium phosphate and 11.6 mg of sodium hydroxide in 10 ml of water) to yield a dosing solution of 0.04 mg ml−1 immediately before administration (final dose of 0.4 mg kg−1).
For subcutaneous models, MV4–11 or SKM-1 cells in 50% Matrigel (BD Biosciences), 50% Dulbecco’s phosphate-buffered saline (DPBS) were implanted in female CD1-Foxn1<nu> mice, 12 weeks of age at start of study, or NOD. CB17-Prkdc<scid>1NCrCrl mice, 8–11 weeks of age at start of study, respectively. Tumors were measured with digital calipers, and stratified block randomized according to tumor size (P value > 0.999) into treatment groups. Mice were monitored twice weekly for body weight and tumor size. A maximal tumor burden of 2,500 mm3 for two consecutive measurements was not exceeded during the studies.
The pharmacokinetic and pharmacodynamic study in the SKM-1 model used a total of 24 mice, 3 mice per group. Tumor and blood samples were collected from euthanized mice 6 h post last dose on day 8.5. Following protein precipitation with acetonitrile, blood concentrations of GSK3685032 were determined by HPLC–MS/MS (Waters Acquity uPLC, Sciex API5000). Tumor samples were assessed using the global DNA methylation (5-methylcytosine) assay.
For the efficacy studies, a total of 70 animals were used for each study with 10 mice per group. Dosing was initiated once the tumor volumes were approximately 189 mm3 in the MV4–11- and 193 mm3 in the SKM-1-bearing animals. For peripheral blood analyses in the SKM-1 study, blood was collected via submandibular venipuncture from mice on day 28 and day 56. Blood was immediately placed into a Microtainer EDTA tube (BD) and gently mixed by inverting. A complete blood count analysis was conducted using the Advia 2120 hematology analyzer (Siemens Medical Solutions) using multi-species software as per the manufacturer’s instructions.
Efficacy of GSK3685032 in an MV4–11 human systemic AML model in female NOD.CB17-Prkdcscid/NCrCrl mice was evaluated at Charles River Laboratories. To ablate bone marrow, animals (10 weeks old) were dosed with cyclophosphamide (150 mg kg−1) starting 3 d before injection of MV4–11 cells intravenously into the tail vein. Randomization by body weight and dosing commenced 21 d after implant. Animals (10 per group, 70 total) were dosed over 30 study days, where GSK3685032 or vehicle was administered subcutaneously twice daily while DAC was dosed intraperitoneally two times per week. Body weight measurements were taken three times per week. After a single observation of >30% body weight loss or consecutive measurements of >25% body weight loss, the animal was euthanized. Clinical signs associated with tumor progression such as impairment of hind limb function or ocular proptosis also resulted in euthanasia. The study endpoint was 76 d.
A separate pharmacokinetic study was conducted in naïve animals (3 mice per group, 9 mice total), where mice received a single intravenous or subcutaneous dose of 2 mg kg−1 (intravenously, male CD-1 mice), 2 mg kg−1 (subcutaneously, male C57/BL6 mice) or 30 mg kg−1 (subcutaneously, female Nu/Nu mice) GSK3685032 and composite blood samples were collected over 24 h post-dose. Blood concentrations were determined by HPLC–MS/MS and pharmacokinetic parameters were estimated from the mean blood concentration–time profiles using noncompartmental analysis with Phoenix WinNonlin v.6.3 (Certara). Area under the blood concentration–time curve was calculated using the linear trapezoidal rule for each incremental trapezoid up to the maximal concentration (Cmax), and the linear or log interpolation rule for each trapezoid thereafter. The dose-normalized area under the curve (AUC) was calculated by dividing the AUC0–8 h by the dose.
Statistics and reproducibility.
For the in vitro studies, no statistical method was used to predetermine sample size but most studies were executed with a minimum of two independent datasets. Data generated using each method were excluded if they did not pass standard quality control measures for that methodology. The experiments were not randomized since a homogeneous mixture of cells and/or enzyme reactions were used and allocated (that is, added to plate) before treatment. The investigators were not blinded to allocation during experiments and outcome assessment as most steps were typically conducted by the same person. For the in vivo studies, sample sizes were chosen in accordance with the Institutional Animal Care and Use Committee protocol, which was reviewed by a GSK statistician examining historical internal data and the implementation of power calculations. No data were excluded from the analyses. Efficacy studies were randomized by tumor volume using a stratified block method or body weight for the systemic model. Investigators were not blinded to allocation during experiments and outcome assessment since GSK’s institutional standard operating procedures and policies did not require blinding as a normal practice at that time.
For RNA-seq studies, see Genomic gene expression studies. Statistical analyses for the in vivo studies were conducted using GraphPad Prism (v.7.0.2). For multiple comparisons, statistical significance (adjusted P values) was calculated using the one-way analysis of variance (ANOVA), Dunnett’s multiple comparisons test. When examining overall survival, statistical significance was calculated using the log-rank (Mantel–Cox) test. Results are reported as nonsignificant at P > 0.05, and with increasing degrees of significance symbolized by the number of asterisks: *0.01 < P ≤ 0.05, **0.001 < P ≤ 0.01, ***0.0001 < P ≤ 0.001 and extremely significant ****P ≤ 0.0001.
Reporting Summary.
Further information on research design is available in the Nature Research Reporting Summary linked to this article
Data availability
All data generated to support the findings of this study are available. The functional genomics data have been deposited in the NCBI Gene Expression Omnibus (GEO) and are accessible through the GEO SuperSeries accession number: GSE135207 (https://www.ncbi.nlm.nih.gov/geo). The atomic coordinates and structure factors of DNMT1–DNA (zebularine)–SAH (PDB 6X9I), DNMT1–DNA–GSK3830052 (PDB 6X9J) and DNMT1–DNA–GSK3685032 (PDB 6X9K) have been deposited in the Protein Data Bank (http://www.rcsb.org). Source data are provided with this paper. All other data are available from the corresponding authors upon reasonable request.
Code availability
The code generated to analyze Infinium Methylation EPIC array, RNA-seq gene expression and hERV expression data (Figs. 4–6 and Extended Data Fig. 5) can be found at https://github.com/ShawnWFoley-GSK/Pappalardi_et_al_2021. A detailed list of software and package versions can be found in the Methods section.
Extended Data
Extended Data Fig. 1 |. Characterization of GSK3484862 and GSK3685032.
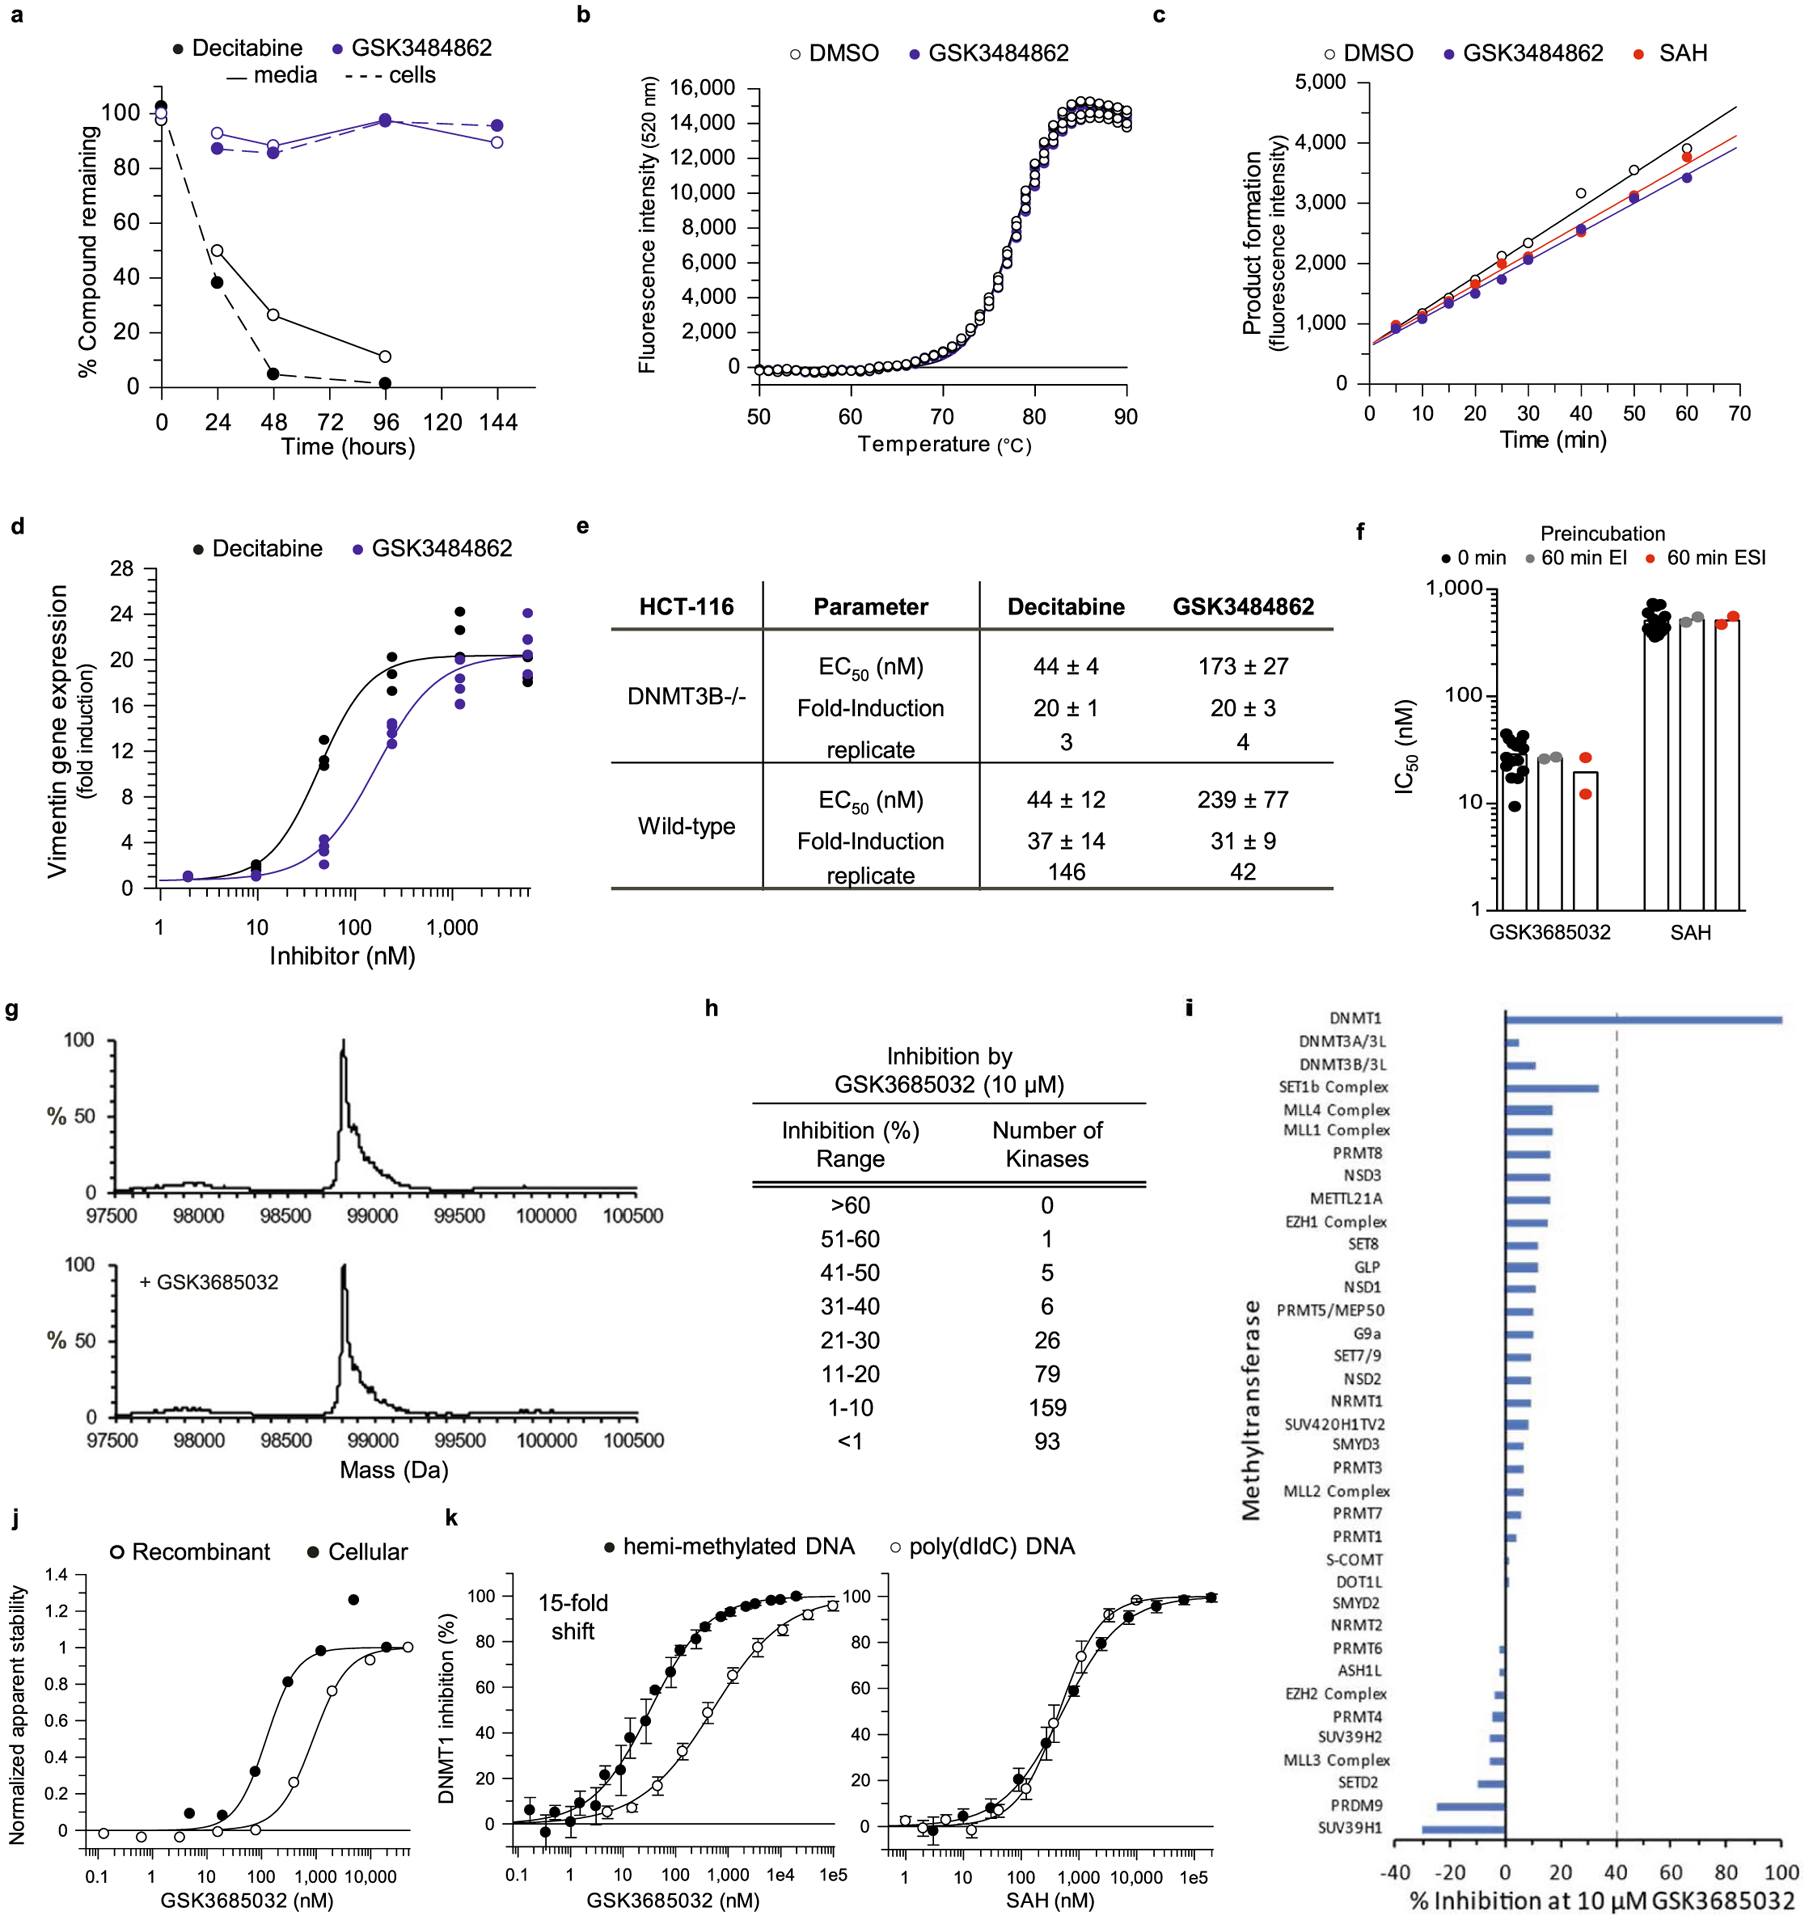
a, Stability of GSK3484862 (1,000 nM) as determined by LC-MS/MS in media without or with cells (MV4–11) at 37 °C versus decitabine (1,000 nM). b, Thermal profile (Tm, 77.5 °C, n = 2 biologically independent experiments with two technical replicates each) of the hemi-methylated hairpin oligonucleotide with DMSO or GSK3484862 (100 μM). c, DNMT1 activity (average of technical replicates, data is representative of two biologically independent experiments) for uninhibited reaction (DMSO, n = 2) and recovery of inhibited enzyme activity following rapid dilution (100-fold) of pre-complexed DNMT1:GSK3484862 (n = 3) or DNMT1:SAH (n = 3). d, Dose-dependent increase in vimentin expression (n = 2 biologically independent experiments with two technical replicates each) following treatment of DNMT3B −/− HCT-116 cells with GSK3484862 or decitabine. e, Table summarizing up-regulation of vimentin expression in wild-type or DNMT3B −/− HCT-116 cells after treatment with GSK3484862 or decitabine (average ± s.d.; n = independently fitted EC50 values). f, IC50 values (bar represents average, n = biologically independent determinations) following a 0-minute (n = 15), 60-minute DNMT1:Inhibitor (EI, n = 2), or 60-minute DNMT1:Inhibitor:hemi-methylated DNA (ESI, n = 2) preincubation. g, Intact protein mass spectrometry for mDNMT1 (731–1602) following incubation with hemi-methylated DNA in the absence or presence of GSK3685032 showed no covalent adduct. h, Inhibition of a kinase panel (n = 369) by 10 μM GSK3685032. i, Inhibition of a methyltransferase panel by 10 μM GSK3685032. j, Isothermal dose-response curves for DNMT1 following treatment with GSK3685032 in a recombinant system (DNMT1 601–1600 in the presence of 40-mer hemi-methylated DNA) or in a cellular system (HepG2). k, Dose response curves (average ± s.d., n = biologically independent samples) for full-length DNMT1 using a 40-mer hemi-methylated or poly(dIdC) DNA substrate in a radioactive SPA assay with GSK3685032 (n = 4 or 5, respectively) or SAH (n = 4 or 6), respectively).
Extended Data Fig. 2 |. DNMT1 residues important for compound binding and inhibition.
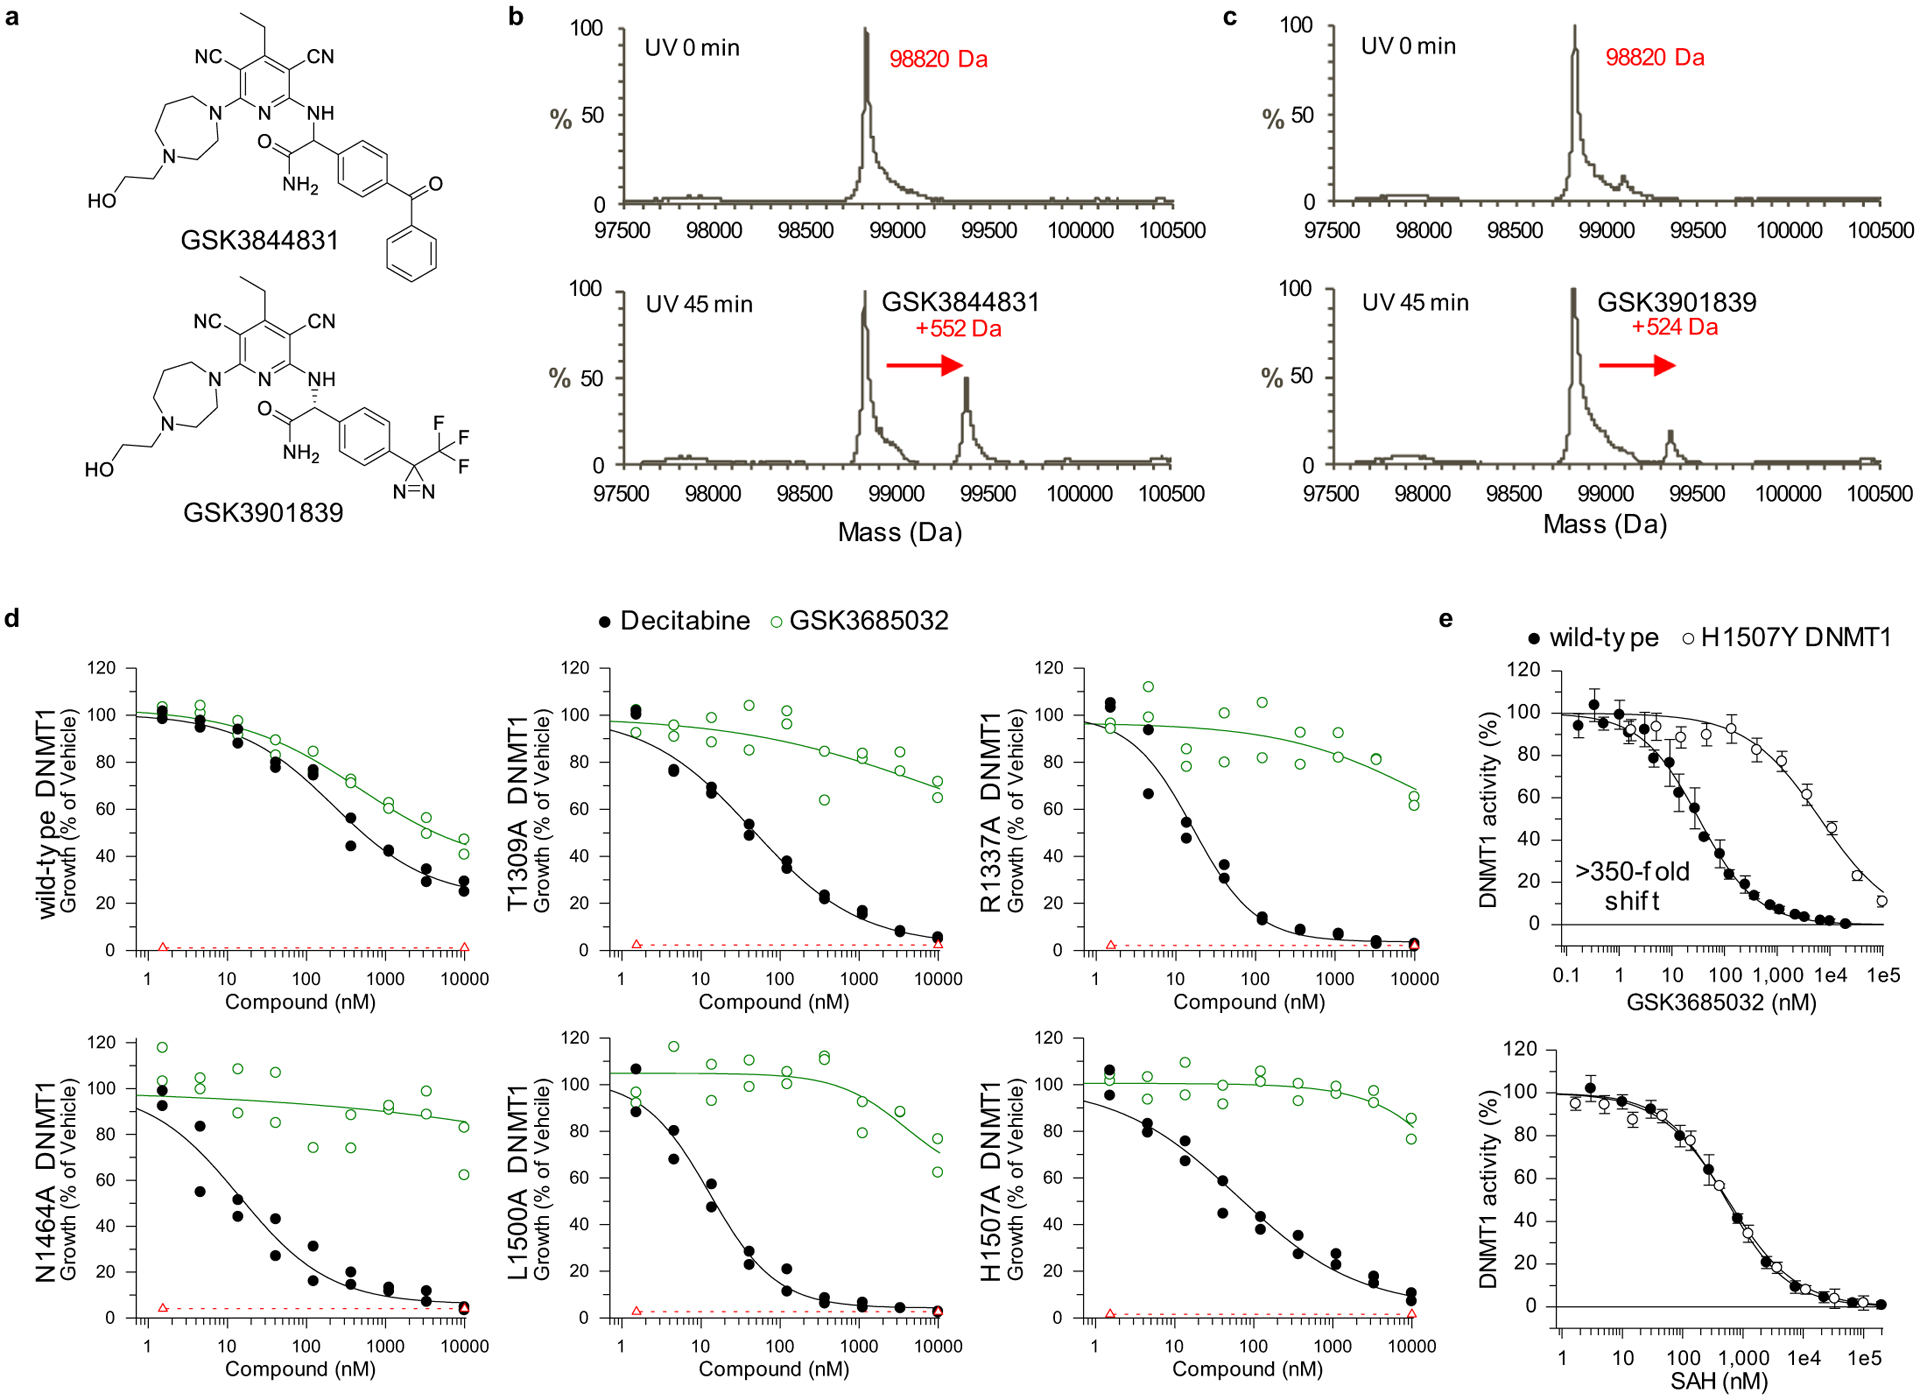
a, Analogues containing a photoreactive benzophenone or diazerine moiety. b, c, Murine DNMT1 (731–1602) spectra in the absence or presence of a 45-minute photolysis step with 14-mer hemi-methylated DNA and GSK3844831 (b) or GSK3901839 (c). d, Dose response curves for HEK293 cells expressing either wild-type or site-directed alanine mutant DNMT1 (n = 2; technical replicates) treated for 6 days with decitabine or GSK3685032. Dashed line represents starting cell number (T0). e, Dose response curves (n = 4 biologically independent samples; average ± s.d.) for full-length wild-type or H1507Y DNMT1 activity in a radioactive SPA assay.
Extended Data Fig. 3 |. Sequence alignment of the methyltransferase domains of human DNMT1, DNMT3A, and DNMT3B.
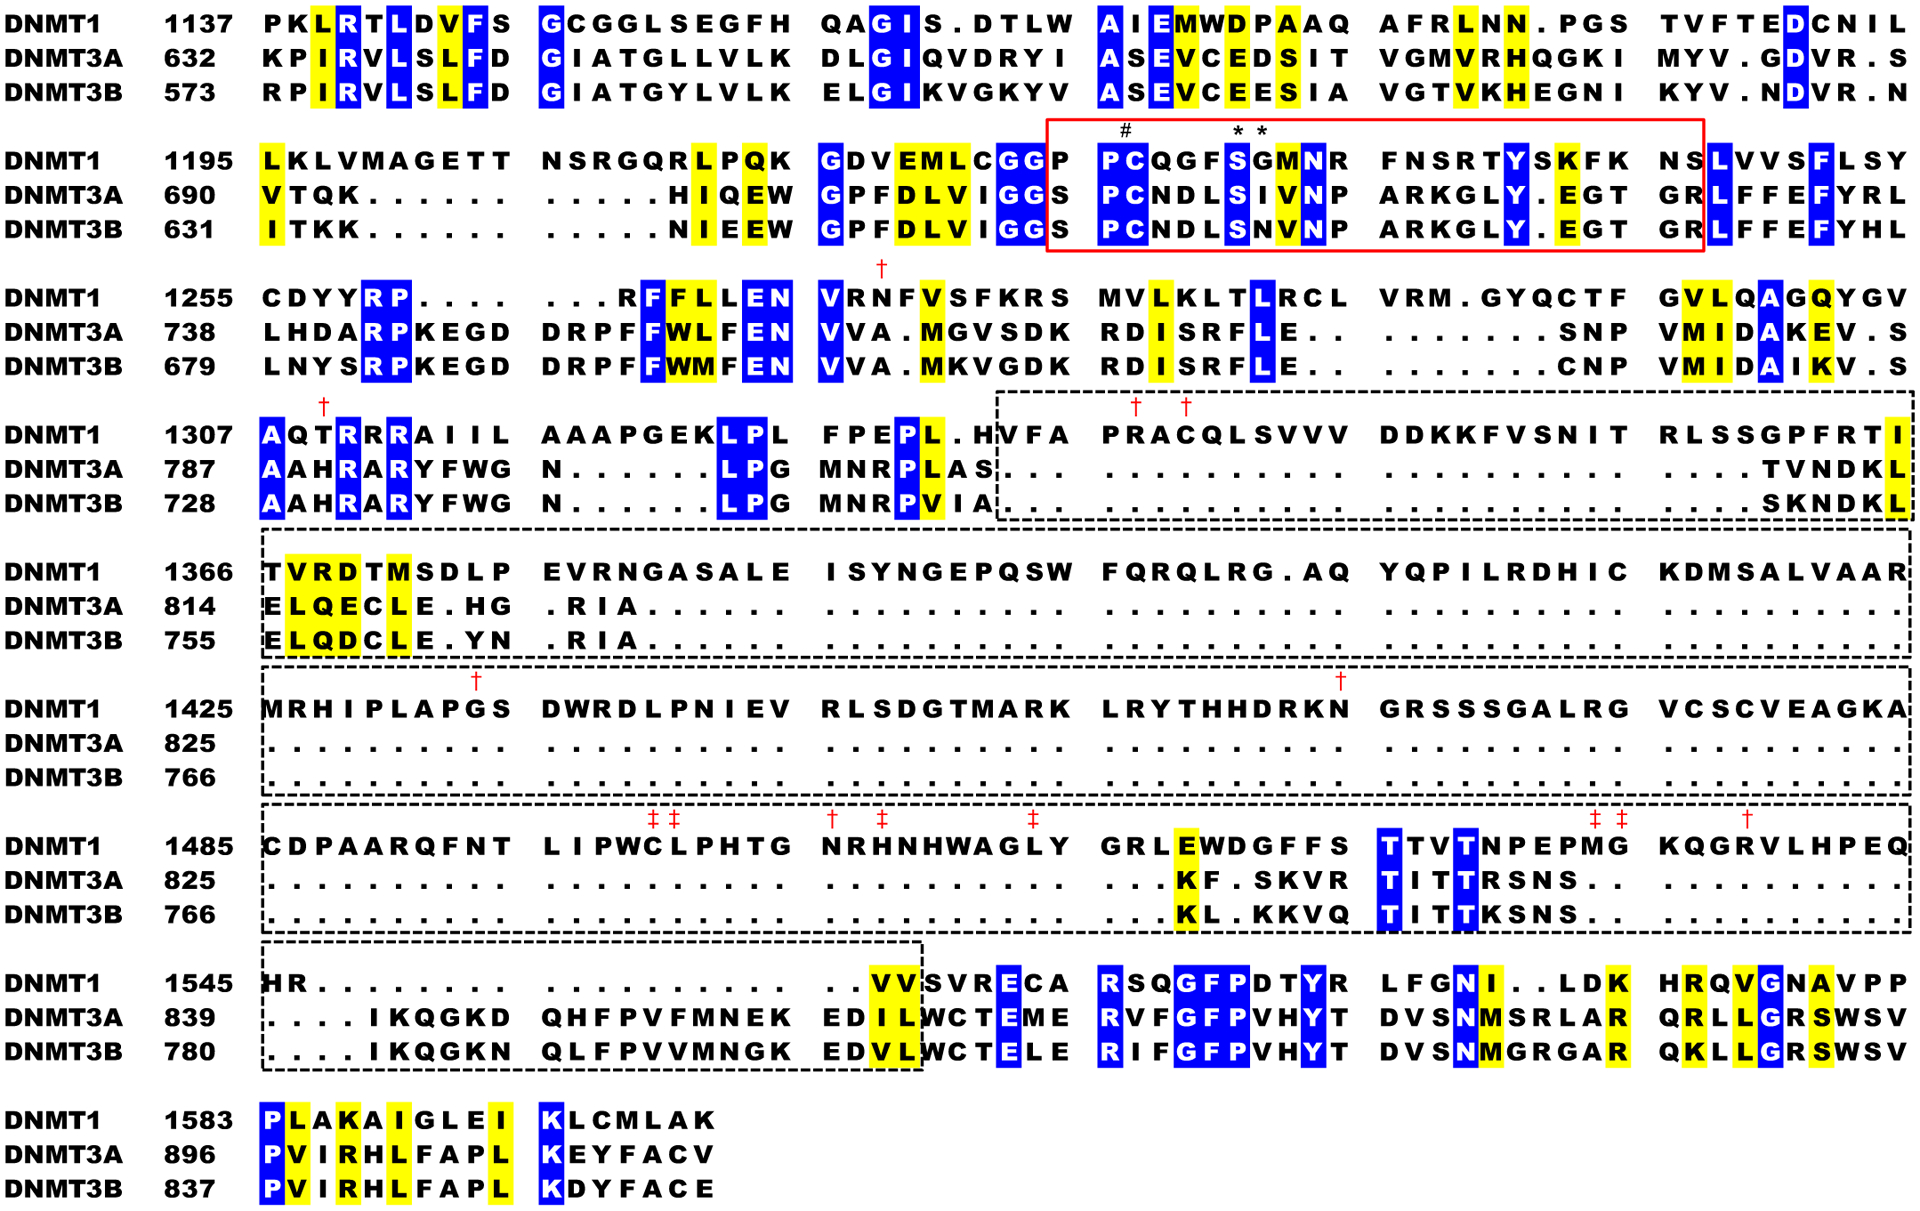
Identical residues are shaded blue while similar residues are shaded yellow. The boxes indicate the target recognition domain of DNMT1 (dashed, black) and the active-site loop (solid, red). Residues that were photoaffinity labeled*, residues that conferred resistance to GSK3685032 upon mutation to alanine (gIC50 > 10 μM)† and are reported to be involved in recognition of the methylated cytosine‡, or the catalytic cysteine (C1226)♯ are marked within the DNMT1 sequence.
Extended Data Fig. 4 |. Crystal structure of DNMT1-DNA in complex with DNMT1 inhibitor.
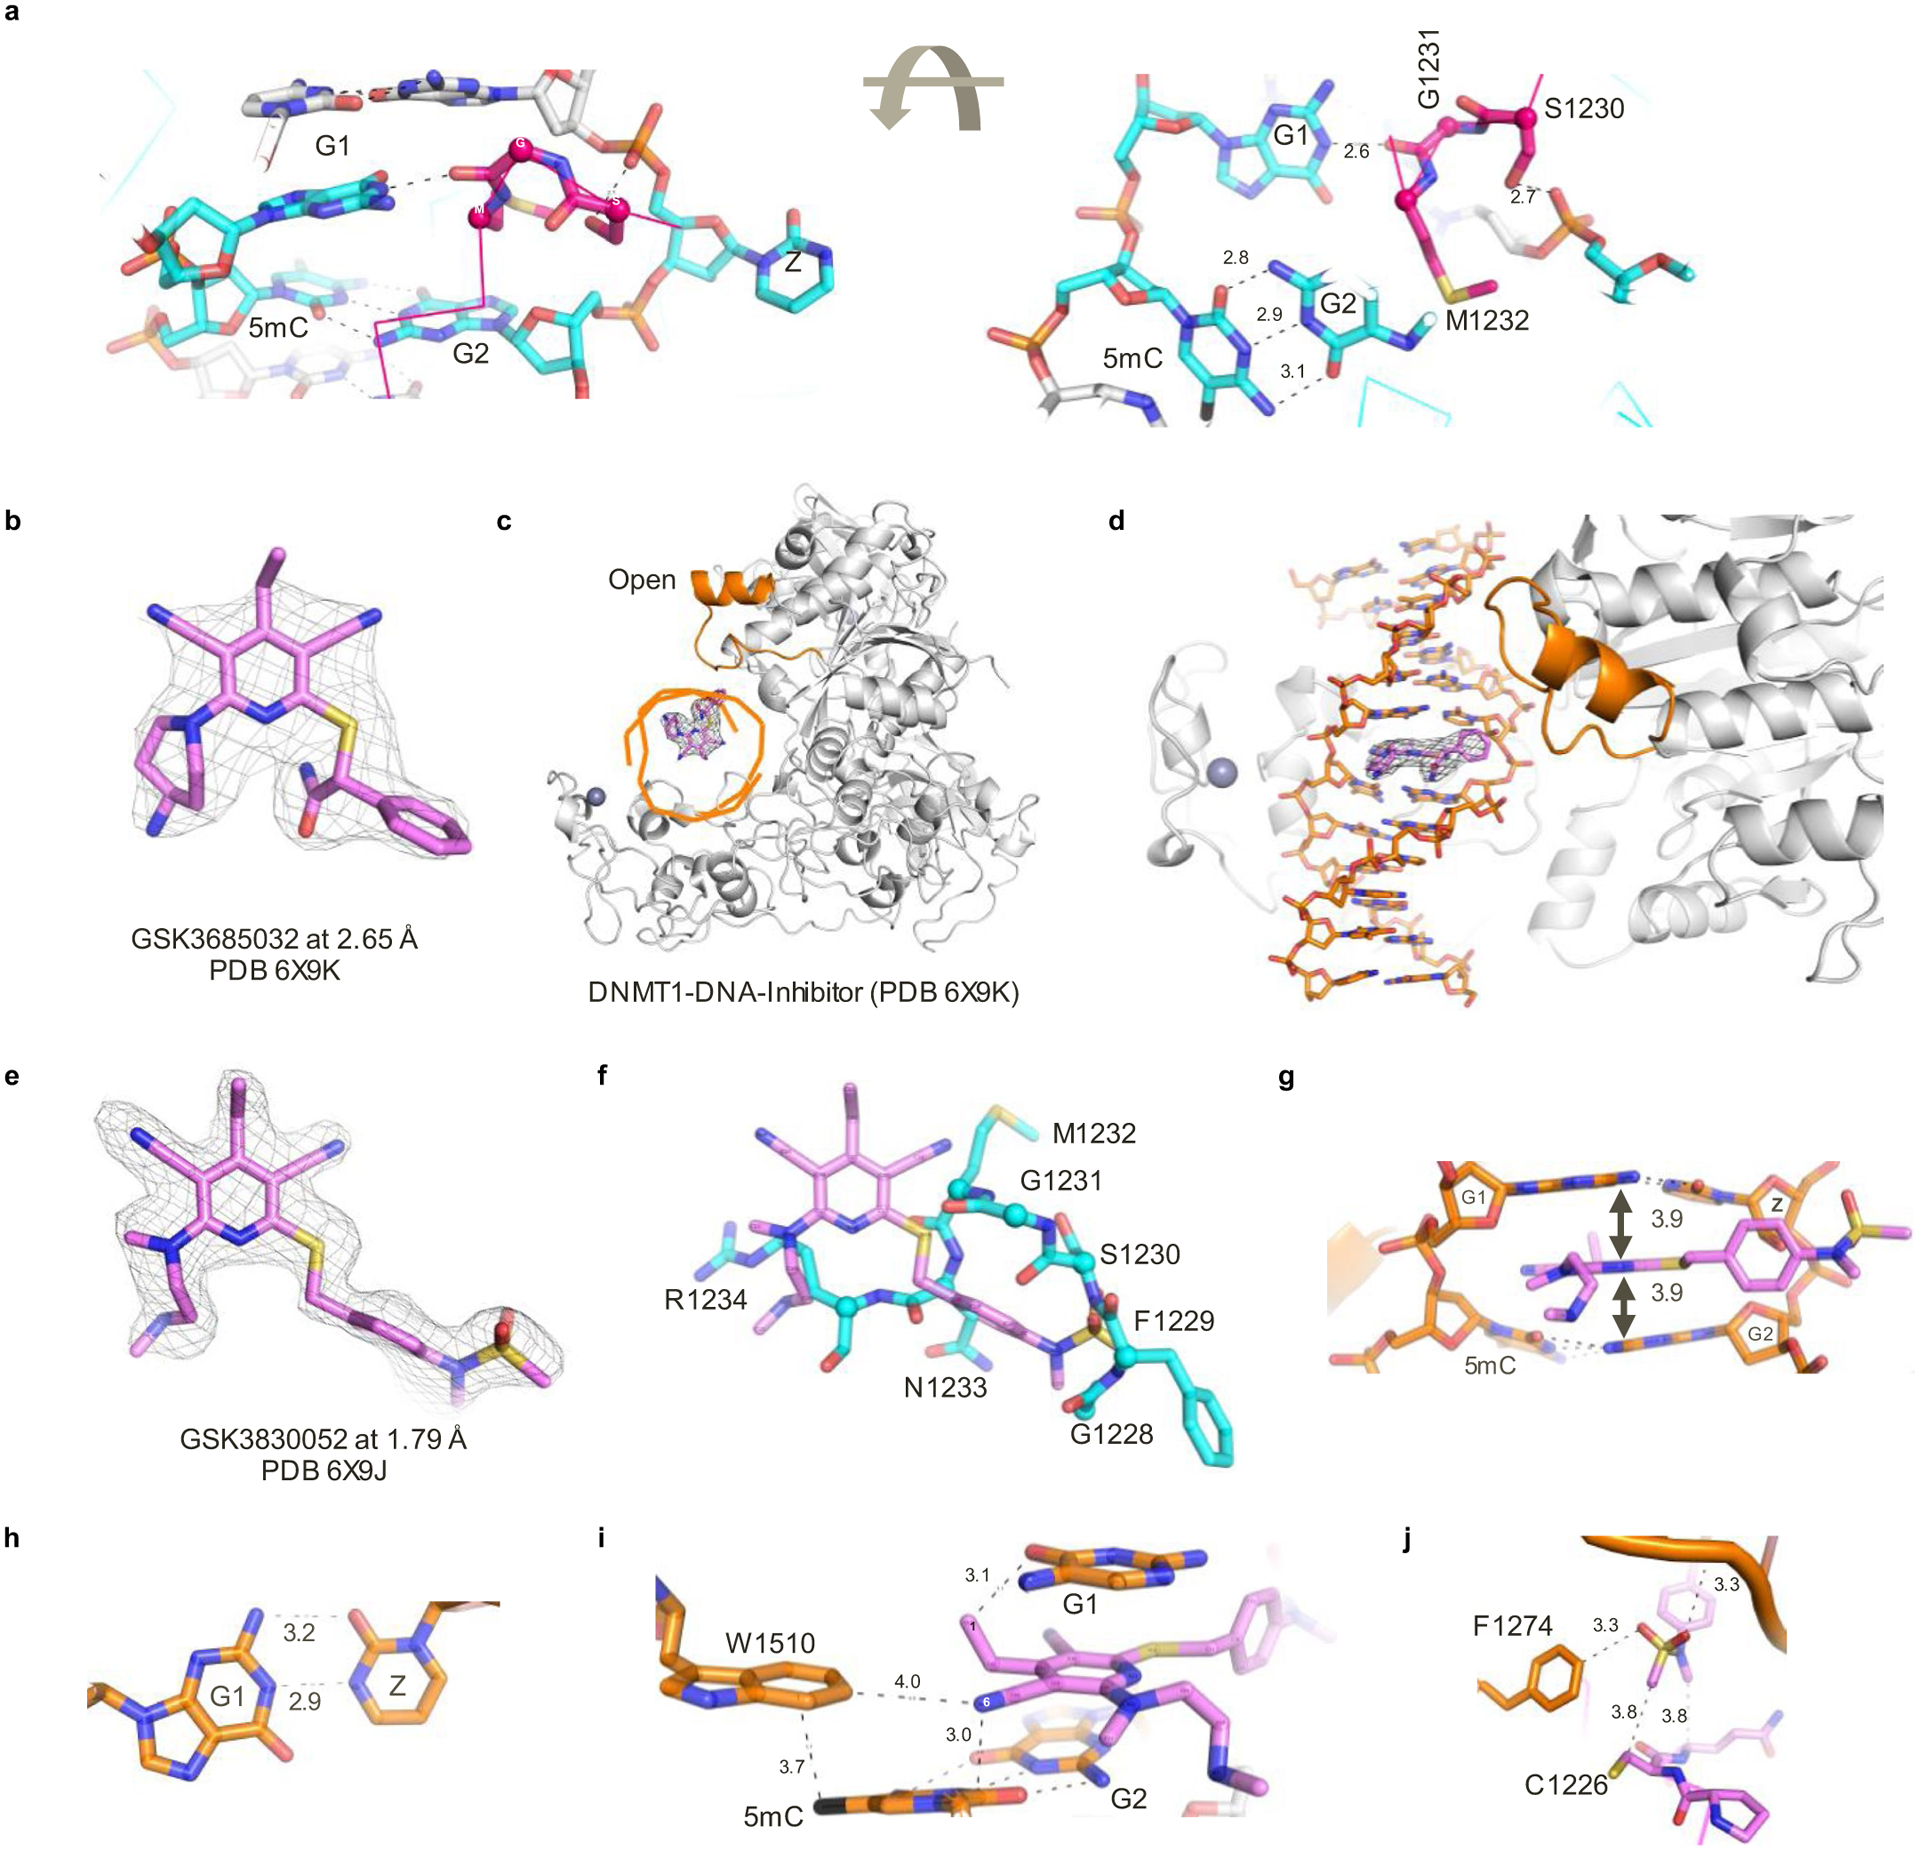
a, View of the active-site loop bound in the space left by the flipped-out zebularine in the DNMT1-DNA complex. b, The omit electron density map in mesh for GSK3685032 contoured at 4σ above the mean. c, d, Orthogonal views of DNMT1-DNA in the presence of GSK3685032. The active-site loop is colored brown and adopts an open conformation. e, The omit electron density map in mesh for GSK3830052 contoured at 4σ above the mean. f, Superimposition of inhibitor (pink) and the active-site loop in the native complex (cyan). g, The inhibitor intercalates into DNA between two G:C base pairs. h, Two hydrogen bonds formed between G1 and zebularine. i, Inhibitor interacts with 5-methylcytosine (5mC) of the parent DNA strand and Trp1510 of DNMT1. j, The end of the inhibitor N-methyl-N-phenylmethanesulfonamide moiety is close to the DNMT1 active-site Cys1226.
Extended Data Fig. 5 |. Biochemical, phenotypic, and mechanistic activity of DNMT inhibitors.
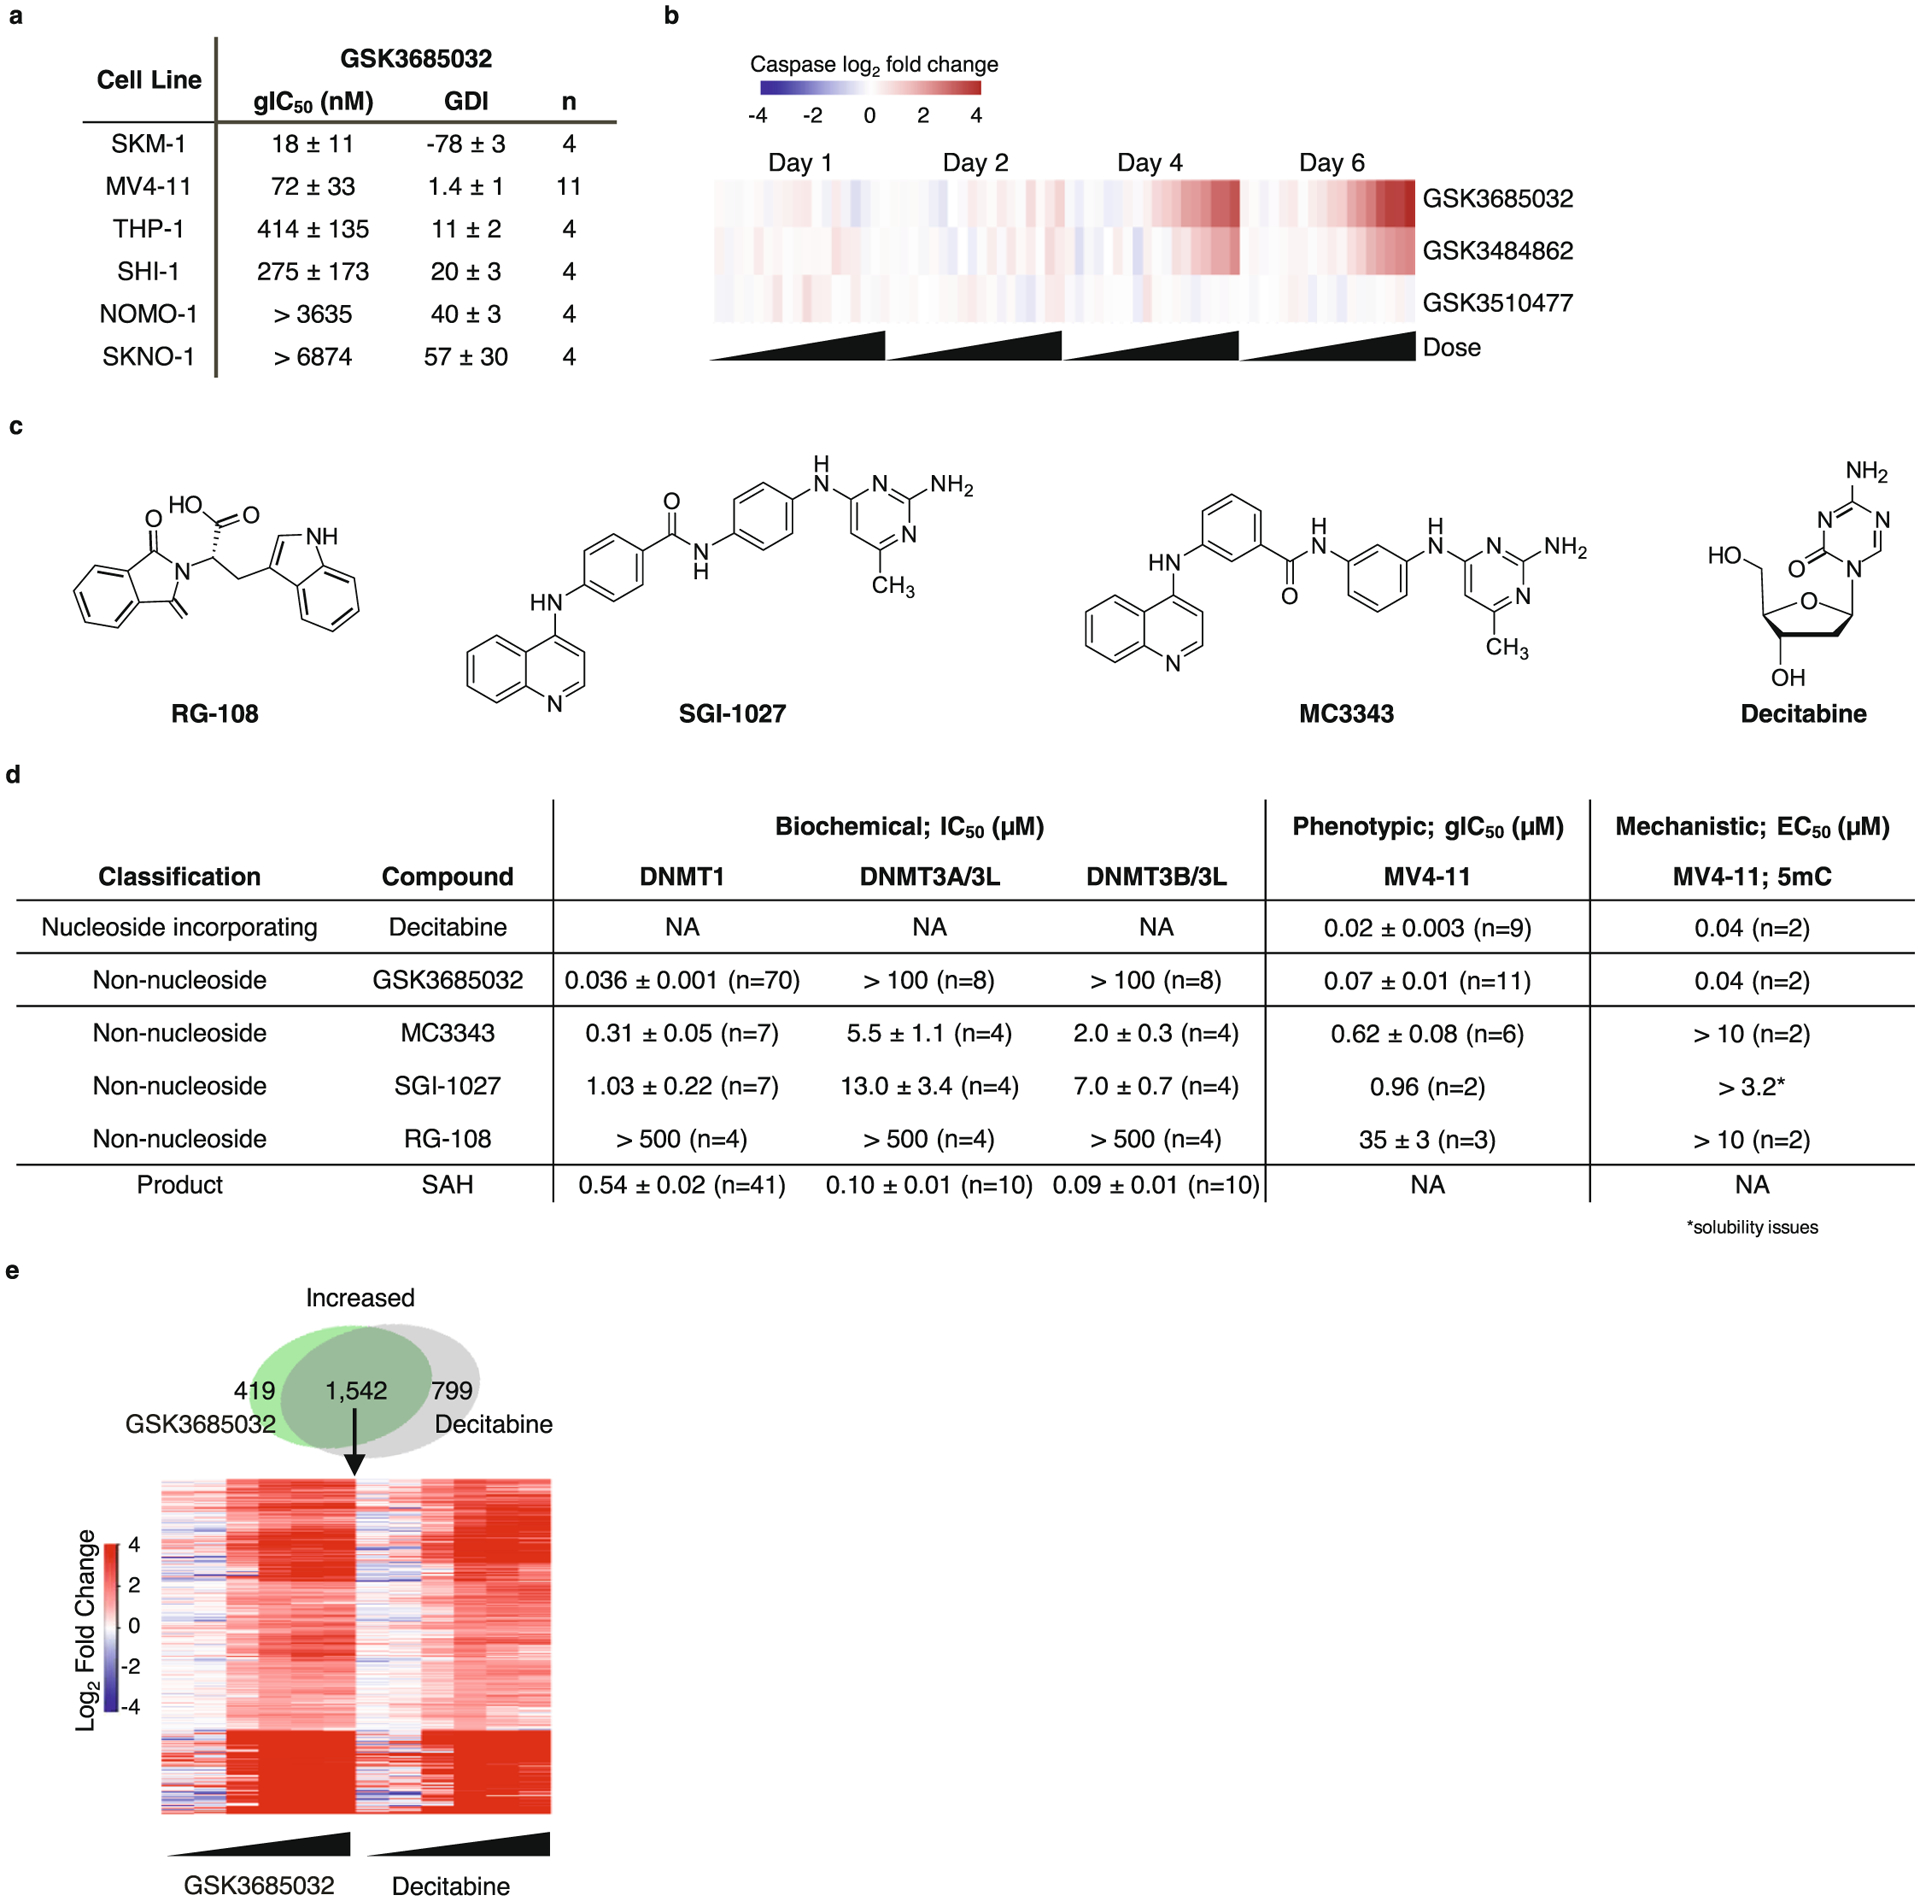
a, Table reporting GSK3685032 activity in a panel of AML cell lines (day 6, average ± s.d., n = biologically independent experiments). b, Heatmap showing induction of caspase-glo 3/7 activity (Promega, average log2 fold change, n = 2 biologically independent experiments) in MV4–11 cells following treatment with GSK3510477, GSK3484862 (with 2 technical replicates), or GSK3685032 at days 1, 2, 4 & 6 (0.06–7,340 nM). c, Compound structures for reported DNMT inhibitors. d, Table containing output parameters (average ± SEM, n = biologically independent experiments) following biochemical, phenotypic (MV4–11, day 6) or mechanistic (MV4–11, day 4) assessment using a panel of DNMT inhibitors. NA, not applicable to assay format. 5mC, 5-methylcytosine. e, Top, Venn diagram for significantly increased genes in MV4–11 (RNA-seq, FDR < 0.05, |log2 fold-change| > 1, day 4, 400 nM) following treatment with GSK3685032 or decitabine. Bottom, Heatmap of log2 fold change differential expression (RNA-seq, day 4) following treatment with GSK3685032 or decitabine (3.2–10,000 nM) for overlapping genes (n = 1,542) from the Venn diagram.
Extended Data Fig. 6 |. Pharmacokinetic evaluation of GSK3685032.
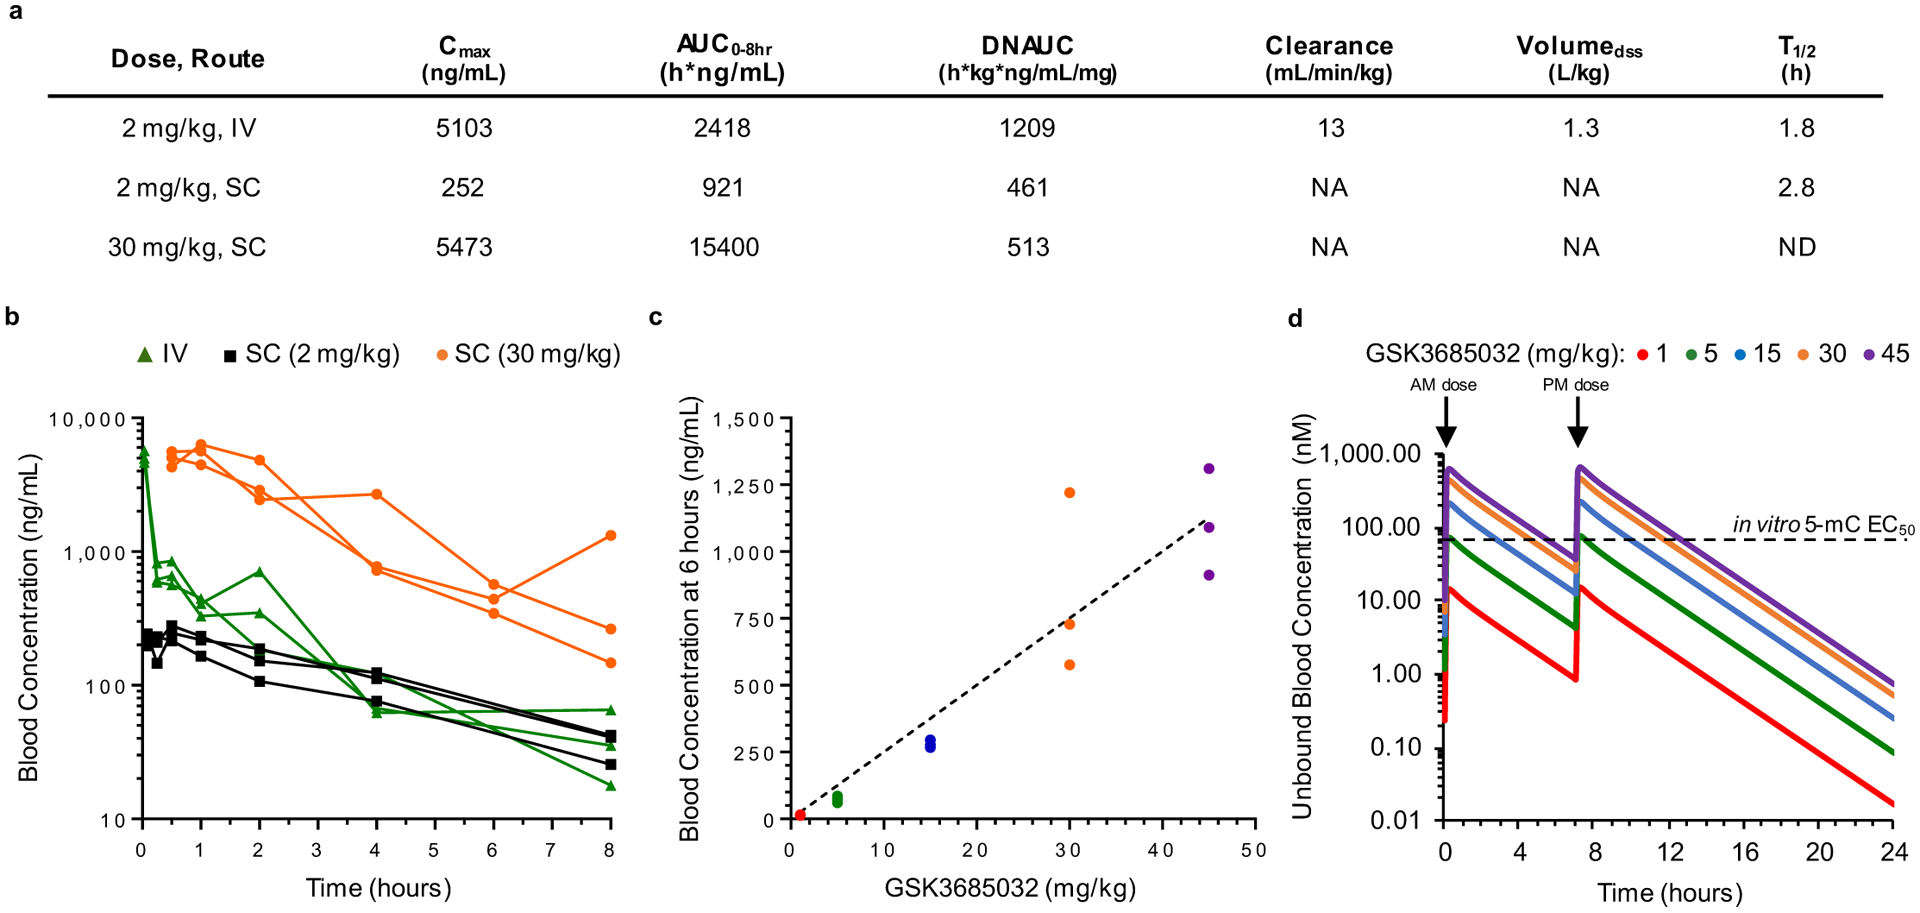
a, Summary of mouse pharmacokinetic parameters for GSK3685032. NA, not applicable to dosing route. ND, value not determined. IV, intravenous. SC, subcutaneous. b, Blood concentration of GSK3685032 at multiple timepoints following a single dose of 2 mg/kg IV (male CD-1 mice), 2 mg/kg SC (male C57/BL6 mice), or 30 mg/kg SC (female Nu/Nu mice). Individual data shown (n = 3 animals/group). c, Dose proportional blood concentration of GSK3685032 following twice daily subcutaneous dosing for 8.5 days in a SKM-1 subcutaneous xenograft model (NOD-scid) collected 6 hours post last dose. Individual concentrations (n = 3 animals/group) with linear regression (R square = 0.9780) fit to the mean concentration for each group. d, Simulated profile of GSK3685032 over a 24 hour time frame adjusted for unbound fraction (2.5%) in the blood following twice daily subcutaneous dosing. 5-mC, 5-methylcytosine.
Extended Data Fig. 7 |. Compound effect in subcutaneous MV4–11 and SKM-1 xenograft models.
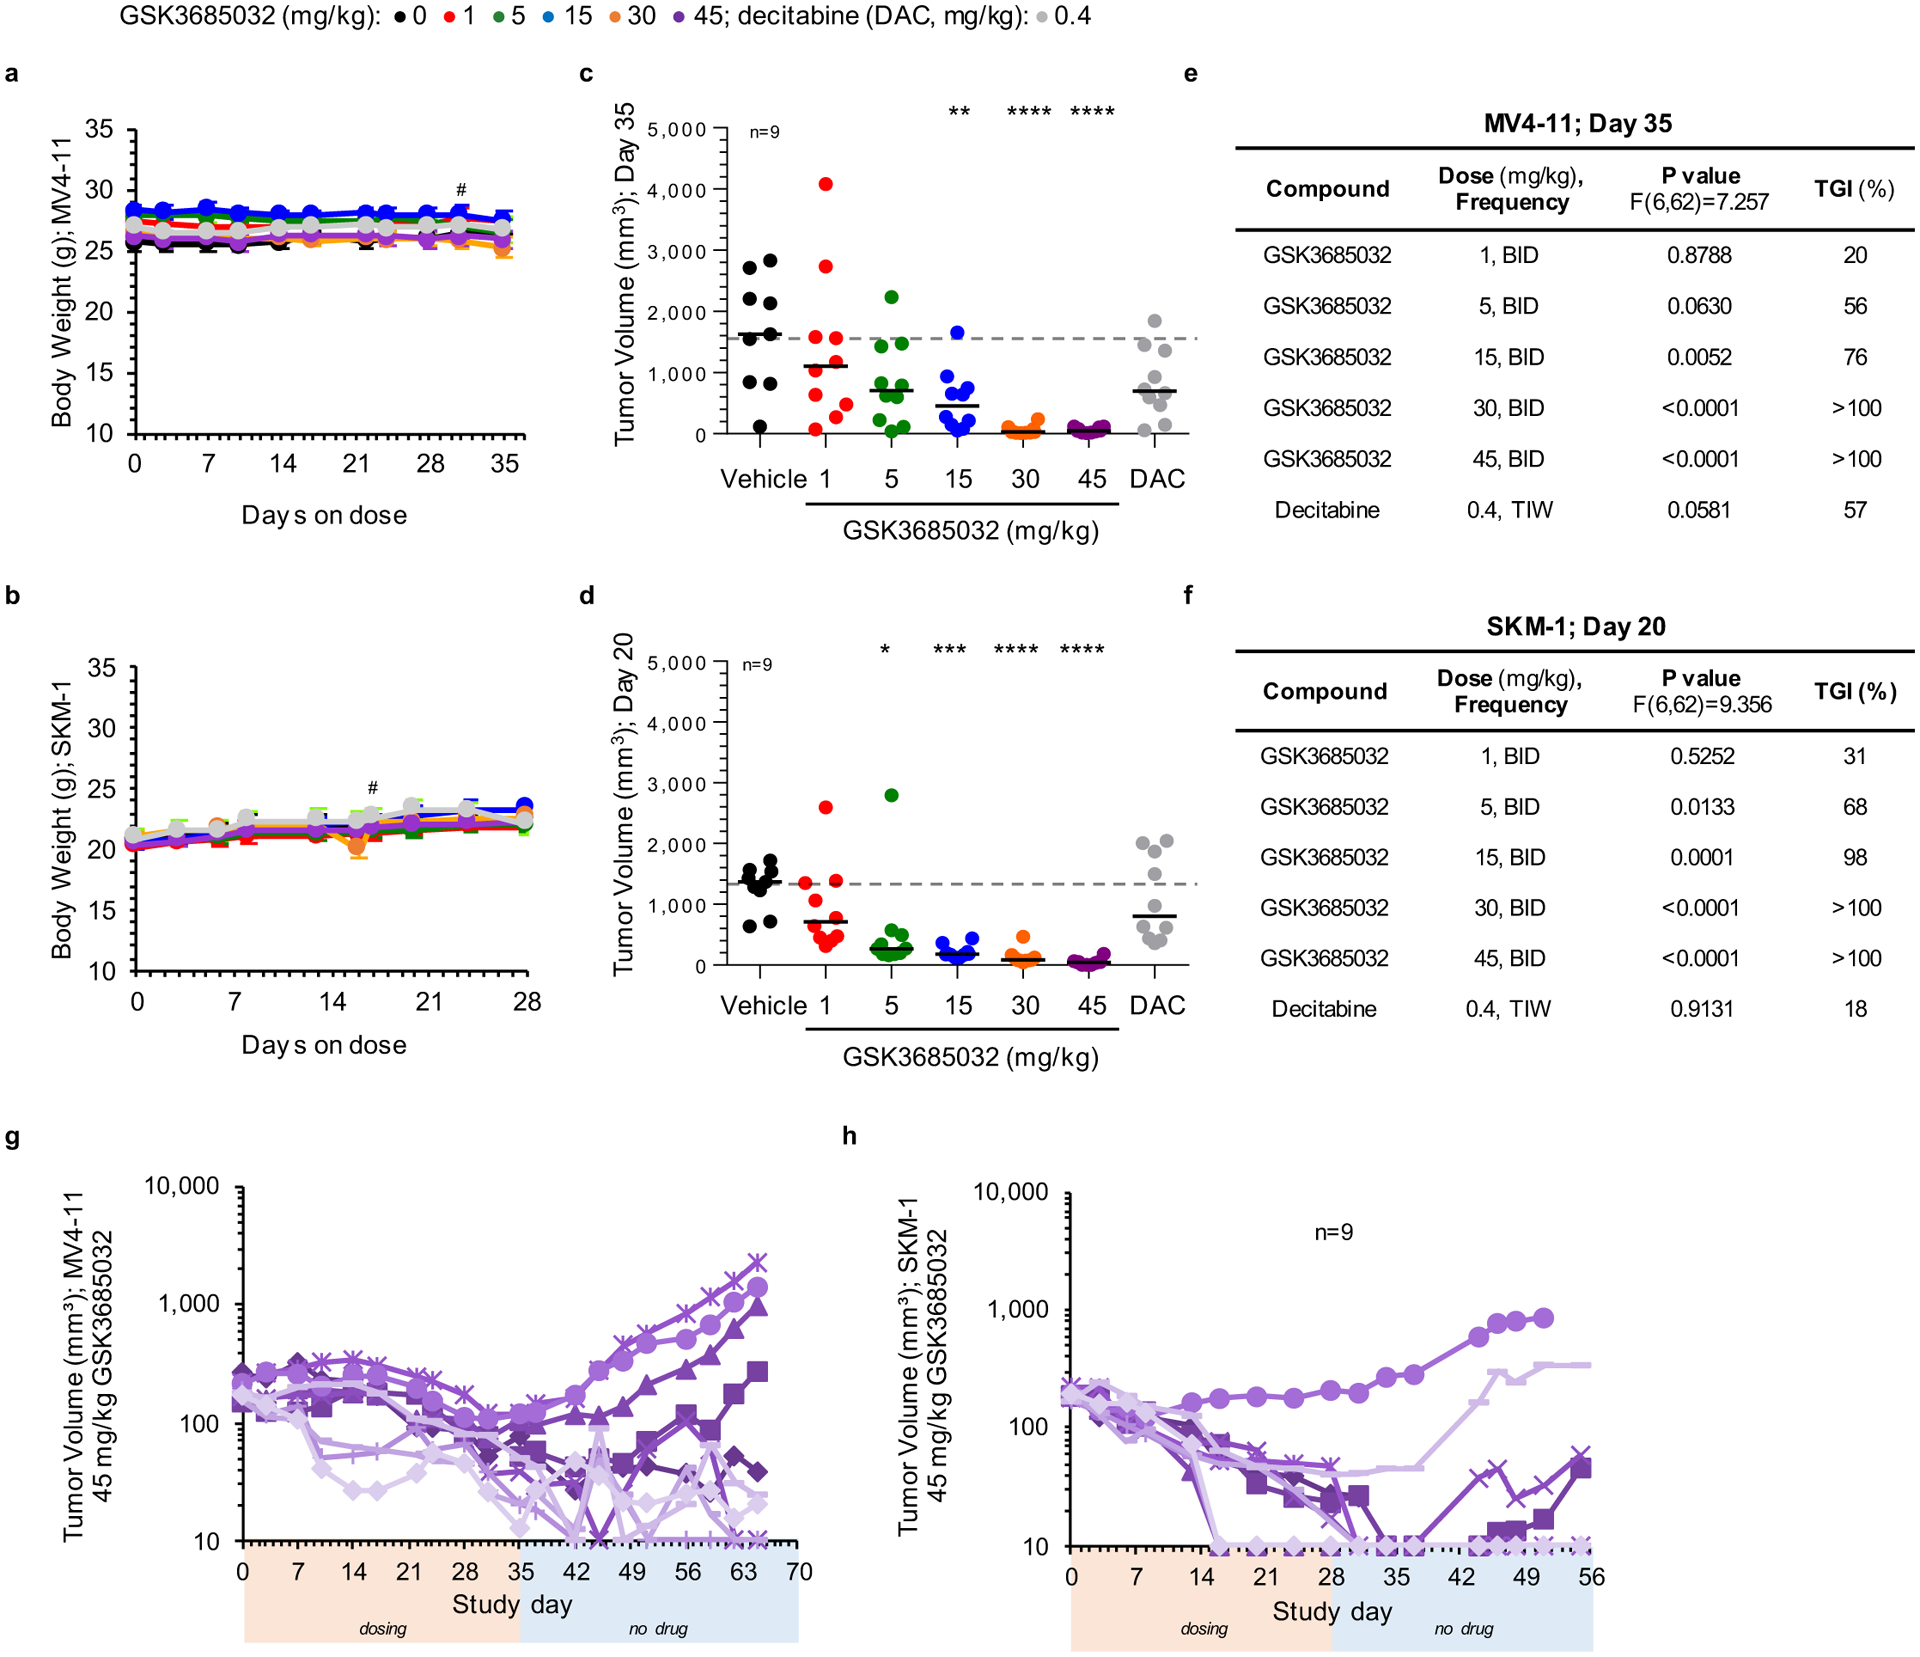
a, b, Animal body weight measurements for MV4–11 (a) or SKM-1 (b) xenograft models spanning the dosing duration of the study (average ± s.d.; n = 10 animals/group, # represents day first animal came off study due to tumor volume). c-f, Individual tumor volume measurements for MV4–11 (c, day 35) or SKM-1 (d, day 20). Solid line represents the median for each group (n = 10 animals unless noted). Dotted line represents the median tumor volume for vehicle. Statistical significance* of treatment versus vehicle was calculated using one-way ANOVA, Dunnett’s multiple comparisons test. Table summarizes adjusted P values to account for multiple comparisons and corresponding tumor growth inhibition (TGI) values for each group within the MV4–11 (e) or SKM-1 (f) xenograft models. g, h, Individual tumor volume measurements for the 45 mg/kg GSK3685032 group in MV4–11 (g) or SKM-1 (h) xenograft models during the dosing segment (orange bar) and continuing for ≥ 27 days off drug (blue bar) to monitor durability (n = 10 animals unless noted). The minimum measurable tumor volume was set to 10 mm3.
Extended Data Fig. 8 |. Effects of GSK3685032 and decitabine on complete blood cell counts.
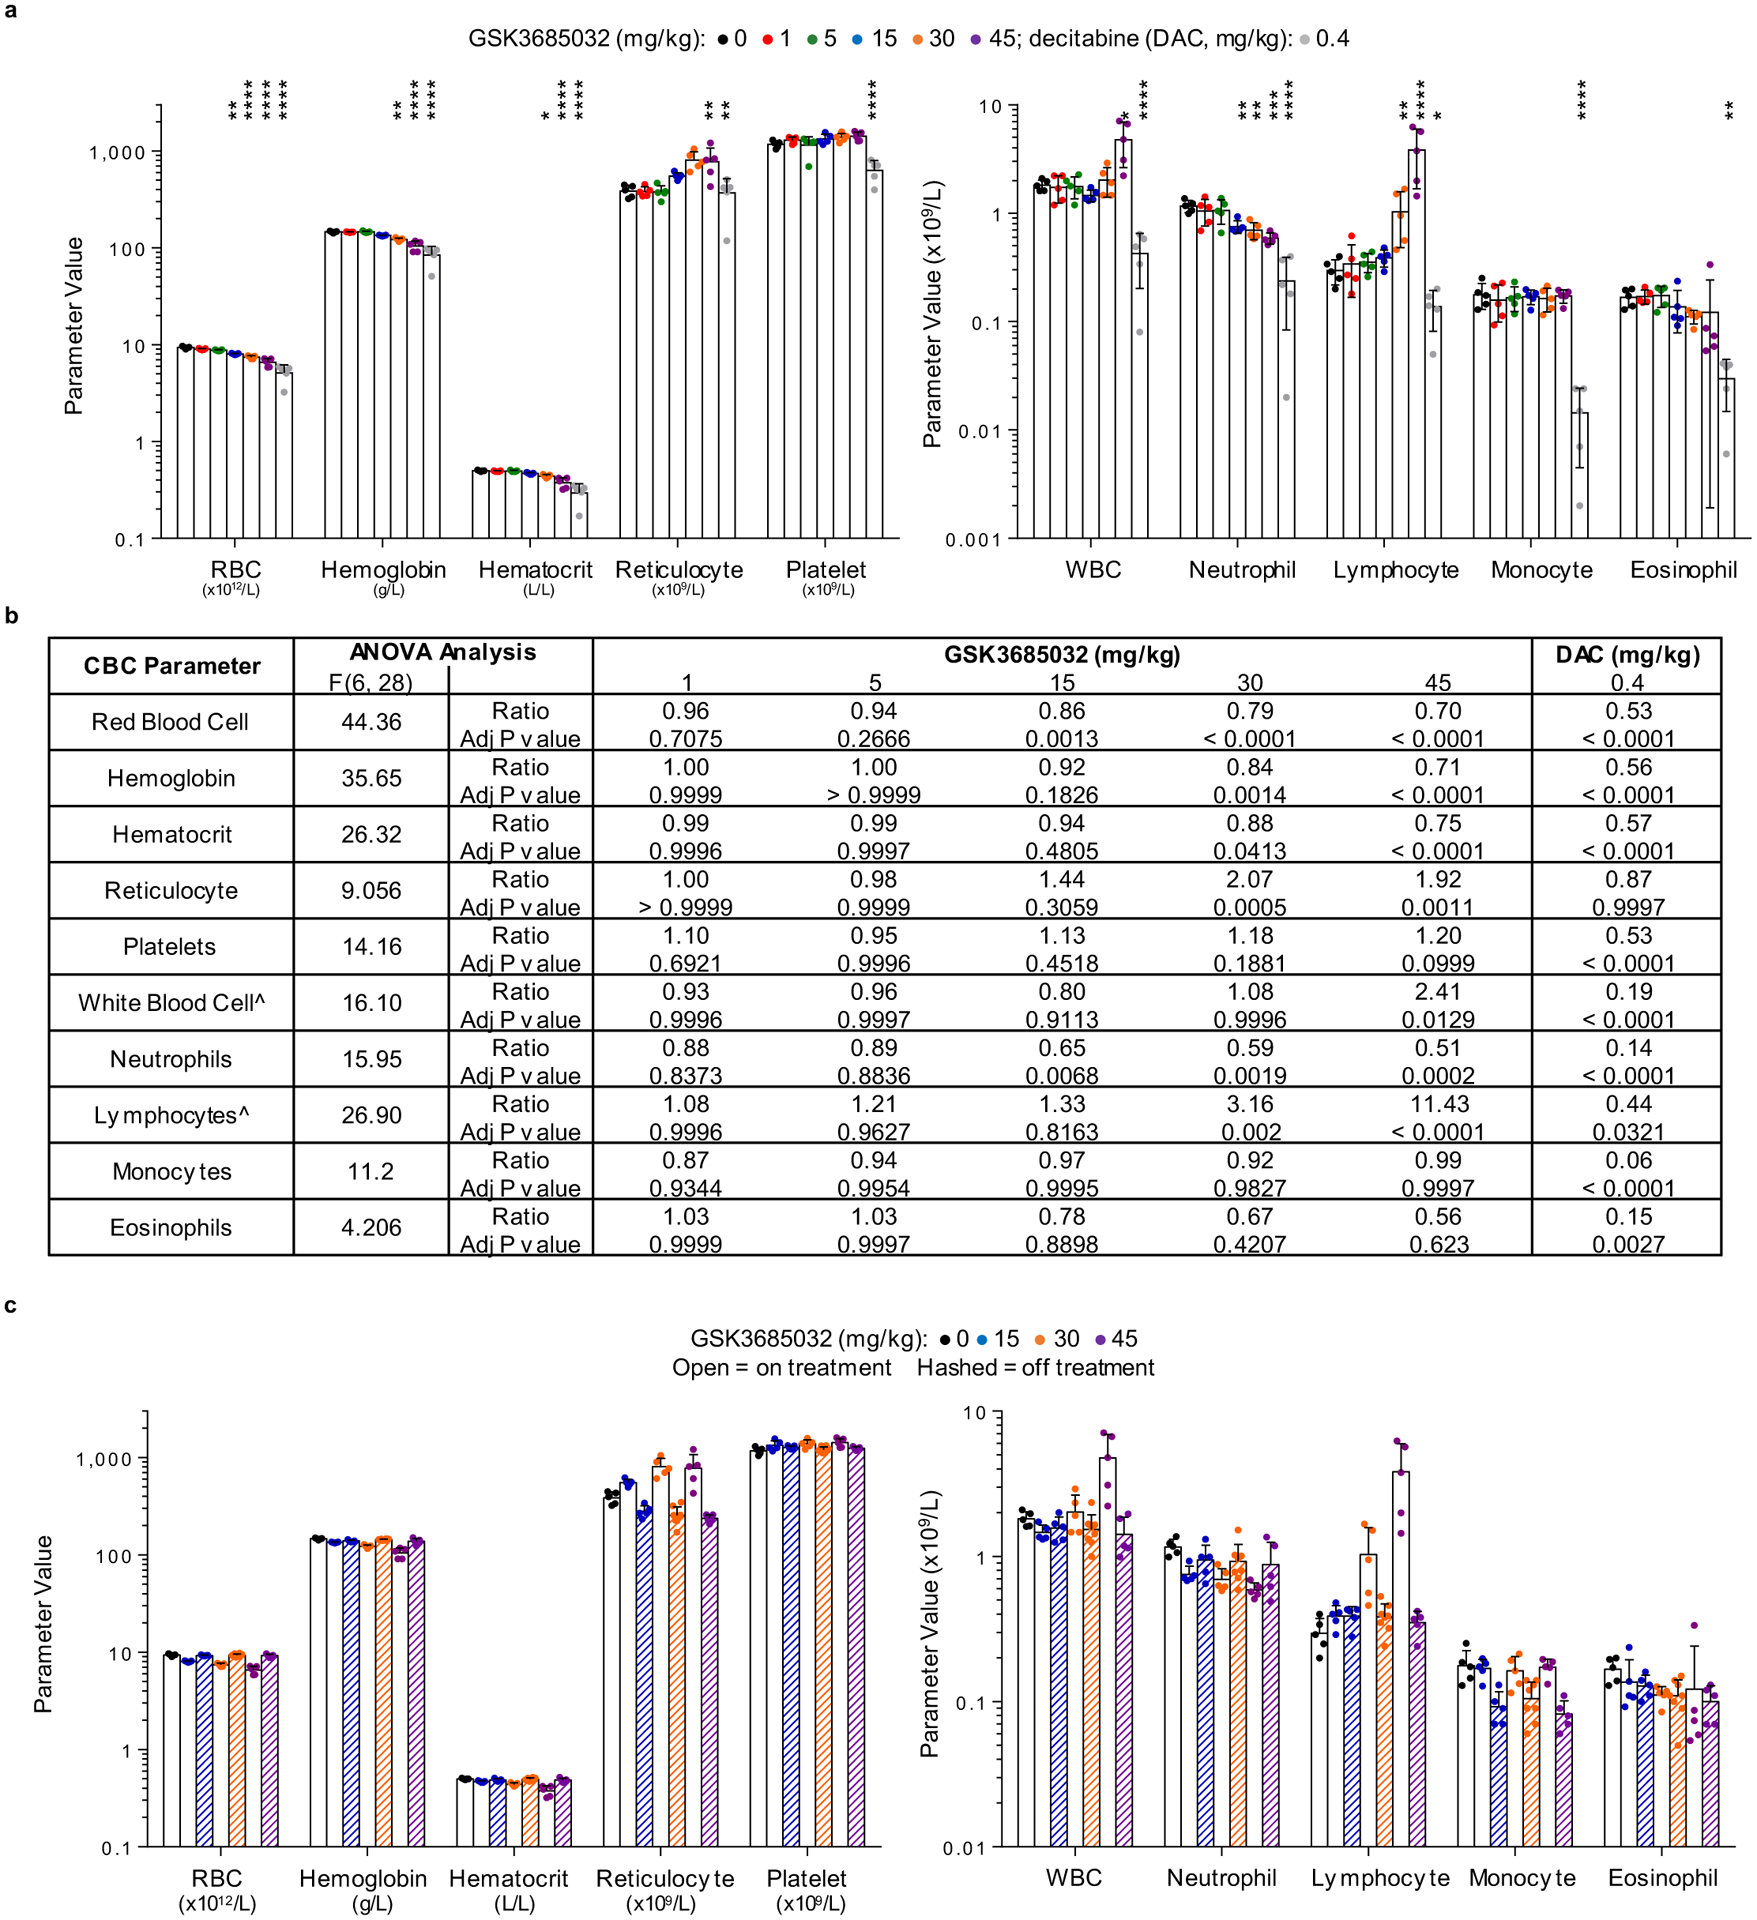
a, b, Complete blood cell count (a) at day 28 across all dose groups (n = 5 animals/group; mean ± s.d.). Statistical significance* of treatment versus vehicle was calculated using one-way ANOVA, Dunnett’s multiple comparisons test. Each P value was adjusted to account for multiple comparisons. Table (b) showing output parameters following statistical analysis. Ûsed log10 transformed values due to unequal variance between groups. Ratio represents treatment group normalized to vehicle. c, Complete blood cell count (mean ± s.d.) at day 28 on treatment (n = 5 animals/group) followed by 27 days off treatment (n = 5 animals/group for 15 and 45 mg/kg or n = 8 animals for 30 mg/kg group) with GSK3685032.
Supplementary Material
Acknowledgements
We thank T. Tomaszek and P. Keller for their contributions toward the high-throughput screen, K. Morasco and D. Depagnier for execution of the CBC panel, D. Cooper and H. Tran for input regarding statistical analysis, and S. Rajapurkar for assistance with genomics data analysis and visualization. We also thank A.C. Wong for original development of the DNA-binding and fluorescence-coupled breaklight assays, B. Waszkowycz for early computational design input and H. Hashimoto for his effort preparing initial human DNMT1 constructs and protein for the crystallization studies. Lastly, we thank S. Pessagno, D. Wilson and M. Bottomley for alliance oversight. Work conducted at the Cancer Research UK Manchester Institute was wholly funded by Cancer Research UK (grant nos. C480/A11411 and C5759/A17098). Work at the MD Anderson Cancer Center was supported by the Cancer Prevention Research Institute of Texas (CPRIT) grant no. RR160029 and National Institutes of Health (NIH) grant no. R35GM134744 to X.C., who is a CPRIT Scholar in Cancer Research. Work at the Van Andel Research Institute (P.A.J.) was supported by National Cancer Institute grant no. R35CA209859 and by the Van Andel Research Institute-Stand Up to Cancer Epigenetics Dream Team. Stand Up to Cancer is a division of the Entertainment Industry Foundation, administered by AACR.
Footnotes
Competing interests
M.B.P., K.K., W.A.K., C.S., K.W., J.B., M.S., A.G., C.F.M., N.C., A.P.G., T.W., L.R., D.T.F., C.Z., J.L.H., M.Muliaditan, M.Mebrahtu, J.P.J., D.E.M., H.C.E., A.N.T., T.H., S.M., S.W.F., A. Rutkowska, M.L., S.P.R., M.B., A.J.J., E.M., P.G., M.P., A.B.B., H.P.M., A.G.G., R.K.P., C.C., D.H., B.W.K., J.I.L., R.G.K. and M.T.M. are/were employees and/or shareholders of GlaxoSmithKline (GSK). The remaining authors declare no competing interests.
Extended data is available for this paper at https://doi.org/10.1038/s43018-021-00249-x.
Supplementary information The online version contains supplementary material available at https://doi.org/10.1038/s43018-021-00249-x.
References
- 1.Okano M, Bell DW, Haber DA & Li E DNA methyltransferases Dnmt3a and Dnmt3b are essential for de novo methylation and mammalian development. Cell 99, 247–257 (1999). [DOI] [PubMed] [Google Scholar]
- 2.Pradhan S, Bacolla A, Wells RD & Roberts RJ Recombinant human DNA (cytosine-5) methyltransferase. I. Expression, purification, and comparison of de novo and maintenance methylation. J. Biol. Chem 274, 33002–33010 (1999). [DOI] [PubMed] [Google Scholar]
- 3.Bird A DNA methylation patterns and epigenetic memory. Genes Dev. 16, 6–21 (2002). [DOI] [PubMed] [Google Scholar]
- 4.Jones PA & Laird PW Cancer epigenetics comes of age. Nat. Genet 21, 163–167 (1999). [DOI] [PubMed] [Google Scholar]
- 5.Baylin SB & Herman JG DNA hypermethylation in tumorigenesis: epigenetics joins genetics. Trends Genet. 16, 168–174 (2000). [DOI] [PubMed] [Google Scholar]
- 6.Ting AH, McGarvey KM & Baylin SB The cancer epigenome— components and functional correlates. Genes Dev. 20, 3215–3231 (2006). [DOI] [PubMed] [Google Scholar]
- 7.Sorm F, Piskala A, Cihak A & Vesely J 5-Azacytidine, a new, highly effective cancerostatic. Experientia 20, 202–203 (1964). [DOI] [PubMed] [Google Scholar]
- 8.Jones PA & Taylor SM Cellular differentiation, cytidine analogs and DNA methylation. Cell 20, 85–93 (1980). [DOI] [PubMed] [Google Scholar]
- 9.Silverman LR et al. Randomized controlled trial of azacitidine in patients with the myelodysplastic syndrome: a study of the cancer and leukemia group B. J. Clin. Oncol 20, 2429–2440 (2002). [DOI] [PubMed] [Google Scholar]
- 10.Oki Y, Jelinek J, Shen L, Kantarjian HM & Issa JP Induction of hypomethylation and molecular response after decitabine therapy in patients with chronic myelomonocytic leukemia. Blood 111, 2382–2384 (2008). [DOI] [PMC free article] [PubMed] [Google Scholar]
- 11.Fenaux P et al. Efficacy of azacitidine compared with that of conventional care regimens in the treatment of higher-risk myelodysplastic syndromes: a randomised, open-label, phase III study. Lancet Oncol. 10, 223–232 (2009). [DOI] [PMC free article] [PubMed] [Google Scholar]
- 12.Lubbert M et al. Low-dose decitabine versus best supportive care in elderly patients with intermediate- or high-risk myelodysplastic syndrome (MDS) ineligible for intensive chemotherapy: final results of the randomized phase III study of the European Organisation for Research and Treatment of Cancer Leukemia Group and the German MDS Study Group. J. Clin. Oncol 29, 1987–1996 (2011). [DOI] [PubMed] [Google Scholar]
- 13.Agrawal K, Das V, Vyas P & Hajduch M Nucleosidic DNA demethylating epigenetic drugs—a comprehensive review from discovery to clinic. Pharmacol. Ther 188, 45–79 (2018). [DOI] [PubMed] [Google Scholar]
- 14.Gnyszka A, Jastrzebski Z & Flis S DNA methyltransferase inhibitors and their emerging role in epigenetic therapy of cancer. Anticancer Res. 33, 2989–2996 (2013). [PubMed] [Google Scholar]
- 15.Issa JP & Kantarjian HM Targeting DNA methylation. Clin. Cancer Res 15, 3938–3946 (2009). [DOI] [PMC free article] [PubMed] [Google Scholar]
- 16.Stresemann C & Lyko F Modes of action of the DNA methyltransferase inhibitors azacytidine and decitabine. Int. J. Cancer 123, 8–13 (2008). [DOI] [PubMed] [Google Scholar]
- 17.Chabot GG, Bouchard J & Momparler RL Kinetics of deamination of 5-aza-2ʹ-deoxycytidine and cytosine arabinoside by human liver cytidine deaminase and its inhibition by 3-deazauridine, thymidine or uracil arabinoside. Biochem. Pharmacol 32, 1327–1328 (1983). [DOI] [PubMed] [Google Scholar]
- 18.Brueckner B et al. Epigenetic reactivation of tumor suppressor genes by a novel small-molecule inhibitor of human DNA methyltransferases. Cancer Res. 65, 6305–6311 (2005). [DOI] [PubMed] [Google Scholar]
- 19.Stresemann C, Brueckner B, Musch T, Stopper H & Lyko F Functional diversity of DNA methyltransferase inhibitors in human cancer cell lines. Cancer Res. 66, 2794–2800 (2006). [DOI] [PubMed] [Google Scholar]
- 20.Manara MC et al. A quinoline-based DNA methyltransferase inhibitor as a possible adjuvant in osteosarcoma therapy. Mol. Cancer Ther 17, 1881–1892 (2018). [DOI] [PubMed] [Google Scholar]
- 21.Datta J et al. A new class of quinoline-based DNA hypomethylating agents reactivates tumor suppressor genes by blocking DNA methyltransferase 1 activity and inducing its degradation. Cancer Res. 69, 4277–4285 (2009). [DOI] [PMC free article] [PubMed] [Google Scholar] [Retracted]
- 22.Valente S et al. Selective non-nucleoside inhibitors of human DNA methyltransferases active in cancer including in cancer stem cells. J. Med. Chem 57, 701–713 (2014). [DOI] [PMC free article] [PubMed] [Google Scholar]
- 23.Gros C et al. New insights on the mechanism of quinoline-based DNA methyltransferase inhibitors. J. Biol. Chem 290, 6293–6302 (2015). [DOI] [PMC free article] [PubMed] [Google Scholar]
- 24.Shirahata A et al. Vimentin methylation as a marker for advanced colorectal carcinoma. Anticancer Res. 29, 279–281 (2009). [PubMed] [Google Scholar]
- 25.Cong H et al. DNA hypermethylation of the vimentin gene inversely correlates with vimentin expression in intestinal- and diffuse-type gastric cancer. Oncol. Lett 11, 842–848 (2016). [DOI] [PMC free article] [PubMed] [Google Scholar]
- 26.Constantinides PG, Jones PA & Gevers W Functional striated muscle cells from non-myoblast precursors following 5-azacytidine treatment. Nature 267, 364–366 (1977). [DOI] [PubMed] [Google Scholar]
- 27.Song J, Rechkoblit O, Bestor TH & Patel DJ Structure of DNMT1-DNA complex reveals a role for autoinhibition in maintenance DNA methylation. Science 331, 1036–1040 (2011). [DOI] [PMC free article] [PubMed] [Google Scholar]
- 28.Song J, Teplova M, Ishibe-Murakami S & Patel DJ Structure-based mechanistic insights into DNMT1-mediated maintenance DNA methylation. Science 335, 709–712 (2012). [DOI] [PMC free article] [PubMed] [Google Scholar]
- 29.Joshi M, Rajpathak SN, Narwade SC & Deobagkar D Ensemble-based virtual screening and experimental validation of inhibitors targeting a novel site of human DNMT1. Chem. Biol. Drug Des 88, 5–16 (2016). [DOI] [PubMed] [Google Scholar]
- 30.Zhou L et al. Zebularine: a novel DNA methylation inhibitor that forms a covalent complex with DNA methyltransferases. J. Mol. Biol 321, 591–599 (2002). [DOI] [PMC free article] [PubMed] [Google Scholar]
- 31.Afonine PV et al. Towards automated crystallographic structure refinement with phenix.refine. Acta Crystallogr. D 68, 352–367 (2012). [DOI] [PMC free article] [PubMed] [Google Scholar]
- 32.Jones PA & Baylin SB The fundamental role of epigenetic events in cancer. Nat. Rev. Genet 3, 415–428 (2002). [DOI] [PubMed] [Google Scholar]
- 33.Siebenkas C et al. Inhibiting DNA methylation activates cancer testis antigens and expression of the antigen processing and presentation machinery in colon and ovarian cancer cells. PLoS ONE 12, e0179501 (2017). [DOI] [PMC free article] [PubMed] [Google Scholar]
- 34.Li H et al. Immune regulation by low doses of the DNA methyltransferase inhibitor 5-azacitidine in common human epithelial cancers. Oncotarget 5, 587–598 (2014). [DOI] [PMC free article] [PubMed] [Google Scholar]
- 35.Chiappinelli KB et al. Inhibiting DNA methylation causes an interferon response in cancer via dsRNA including endogenous retroviruses. Cell 162, 974–986 (2015). [DOI] [PMC free article] [PubMed] [Google Scholar]
- 36.Roulois D et al. DNA-demethylating agents target colorectal cancer cells by inducing viral mimicry by endogenous transcripts. Cell 162, 961–973 (2015). [DOI] [PMC free article] [PubMed] [Google Scholar]
- 37.Saba HI Decitabine in the treatment of myelodysplastic syndromes. Ther. Clin. Risk Manag 3, 807–817 (2007). [PMC free article] [PubMed] [Google Scholar]
- 38.Hashimoto H et al. Recognition and potential mechanisms for replication and erasure of cytosine hydroxymethylation. Nucleic Acids Res. 40, 4841–4849 (2012). [DOI] [PMC free article] [PubMed] [Google Scholar]
- 39.Gilmartin AG et al. In vitro and in vivo induction of fetal hemoglobin with a reversible and selective DNMT1 inhibitor. Haematologica 10.3324/haematol.2020.248658 (2020). [DOI] [PMC free article] [PubMed] [Google Scholar]
- 40.Ariazi JL et al. Discovery and preclinical characterization of GSK1278863 (daprodustat), a small molecule hypoxia inducible factor-prolyl hydroxylase inhibitor for anemia. J. Pharmacol. Exp. Ther 363, 336–347 (2017). [DOI] [PubMed] [Google Scholar]
- 41.Dyachenko VDK, Krivokolysko SG & Litvinov VP Synthesis and transformations of 6-amino-3,5-dicyano-4ethylpyridine-2(1H)-thione. Chem. Heterocycl. Compd 32, 942–946 (1996). [Google Scholar]
- 42.Stromgaard K et al. Ginkgolide derivatives for photolabeling studies: preparation and pharmacological evaluation. J. Med. Chem 45, 4038–4046 (2002). [DOI] [PubMed] [Google Scholar]
- 43.Sou T & Bergstrom CAS Automated assays for thermodynamic (equilibrium) solubility determination. Drug Discov. Today Technol 27, 11–19 (2018). [DOI] [PubMed] [Google Scholar]
- 44.Valko K, Bevan C & Reynolds D Chromatographic hydrophobicity index by fast-gradient RP-HPLC: a high-throughput alternative to log P/log D. Anal. Chem 69, 2022–2029 (1997). [DOI] [PubMed] [Google Scholar]
- 45.Bunally SY & Robert JY The role and impact of high throughput biomimetic measurements in drug discovery. ADMET DMPK 6, 74–84 (2018). [Google Scholar]
- 46.Young RJ, Green DV, Luscombe CN & Hill AP Getting physical in drug discovery II: the impact of chromatographic hydrophobicity measurements and aromaticity. Drug Discov. Today 16, 822–830 (2011). [DOI] [PubMed] [Google Scholar]
- 47.Horiuchi KY et al. Assay development for histone methyltransferases. Assay Drug Dev. Technol 11, 227–236 (2013). [DOI] [PMC free article] [PubMed] [Google Scholar]
- 48.Anastassiadis T, Deacon SW, Devarajan K, Ma H & Peterson JR Comprehensive assay of kinase catalytic activity reveals features of kinase inhibitor selectivity. Nat. Biotechnol 29, 1039–1045 (2011). [DOI] [PMC free article] [PubMed] [Google Scholar]
- 49.McCoy AJ et al. Phaser crystallographic software. J. Appl. Crystallogr 40, 658–674 (2007). [DOI] [PMC free article] [PubMed] [Google Scholar]
- 50.Moriarty NW, Grosse-Kunstleve RW & Adams PD electronic Ligand Builder and Optimization Workbench (eLBOW): a tool for ligand coordinate and restraint generation. Acta Crystallogr. D 65, 1074–1080 (2009). [DOI] [PMC free article] [PubMed] [Google Scholar]
- 51.Emsley P & Cowtan K Coot: model-building tools for molecular graphics. Acta Crystallogr. D 60, 2126–2132 (2004). [DOI] [PubMed] [Google Scholar]
- 52.McCabe MT et al. EZH2 inhibition as a therapeutic strategy for lymphoma with EZH2-activating mutations. Nature 492, 108–112 (2012). [DOI] [PubMed] [Google Scholar]
- 53.Fedoriw A et al. Anti-tumor activity of the type I PRMT inhibitor, GSK3368715, synergizes with PRMT5 inhibition through MTAP loss. Cancer Cell 36, 100–114 e125 (2019). [DOI] [PubMed] [Google Scholar]
- 54.Savitski MM et al. Multiplexed proteome dynamics profiling reveals mechanisms controlling protein homeostasis. Cell 173, 260–274 e225 (2018). [DOI] [PMC free article] [PubMed] [Google Scholar]
- 55.Franken H et al. Thermal proteome profiling for unbiased identification of direct and indirect drug targets using multiplexed quantitative mass spectrometry. Nat. Protoc 10, 1567–1593 (2015). [DOI] [PubMed] [Google Scholar]
- 56.Werner T et al. Ion coalescence of neutron encoded TMT 10-plex reporter ions. Anal. Chem 86, 3594–3601 (2014). [DOI] [PubMed] [Google Scholar]
- 57.Le T, Kim KP, Fan G & Faull KF A sensitive mass spectrometry method for simultaneous quantification of DNA methylation and hydroxymethylation levels in biological samples. Anal. Biochem 412, 203–209 (2011). [DOI] [PMC free article] [PubMed] [Google Scholar]
- 58.Dobin A et al. STAR: ultrafast universal RNA-seq aligner. Bioinformatics 29, 15–21 (2013). [DOI] [PMC free article] [PubMed] [Google Scholar]
- 59.Jin Y, Tam OH, Paniagua E & Hammell M TEtranscripts: a package for including transposable elements in differential expression analysis of RNA-seq datasets. Bioinformatics 31, 3593–3599 (2015). [DOI] [PMC free article] [PubMed] [Google Scholar]
- 60.Wang L, Wang S & Li W RSeQC: quality control of RNA-seq experiments. Bioinformatics 28, 2184–2185 (2012). [DOI] [PubMed] [Google Scholar]
- 61.Ewels P, Magnusson M, Lundin S & Kaller M MultiQC: summarize analysis results for multiple tools and samples in a single report. Bioinformatics 32, 3047–3048 (2016). [DOI] [PMC free article] [PubMed] [Google Scholar]
- 62.Patro R, Duggal G, Love MI, Irizarry RA & Kingsford C Salmon provides fast and bias-aware quantification of transcript expression. Nat. Methods 14, 417–419 (2017). [DOI] [PMC free article] [PubMed] [Google Scholar]
- 63.Soneson C, Love MI & Robinson MD Differential analyses for RNA-seq: transcript-level estimates improve gene-level inferences. F1000Res 4, 1521 (2015). [DOI] [PMC free article] [PubMed] [Google Scholar]
- 64.Love MI, Huber W & Anders S Moderated estimation of fold change and dispersion for RNA-seq data with DESeq2. Genome Biol. 15, 550 (2014). [DOI] [PMC free article] [PubMed] [Google Scholar]
- 65.Benjamini Y, Drai D, Elmer G, Kafkafi N & Golani I Controlling the false discovery rate in behavior genetics research. Behav. Brain Res 125, 279–284 (2001). [DOI] [PubMed] [Google Scholar]
- 66.Hulsen T, de Vlieg J & Alkema W BioVenn—a web application for the comparison and visualization of biological lists using area-proportional Venn diagrams. BMC Genomics 9, 488 (2008). [DOI] [PMC free article] [PubMed] [Google Scholar]
- 67.Robinson JT et al. Integrative genomics viewer. Nat. Biotechnol 29, 24–26 (2011). [DOI] [PMC free article] [PubMed] [Google Scholar]
Associated Data
This section collects any data citations, data availability statements, or supplementary materials included in this article.
Supplementary Materials
Data Availability Statement
All data generated to support the findings of this study are available. The functional genomics data have been deposited in the NCBI Gene Expression Omnibus (GEO) and are accessible through the GEO SuperSeries accession number: GSE135207 (https://www.ncbi.nlm.nih.gov/geo). The atomic coordinates and structure factors of DNMT1–DNA (zebularine)–SAH (PDB 6X9I), DNMT1–DNA–GSK3830052 (PDB 6X9J) and DNMT1–DNA–GSK3685032 (PDB 6X9K) have been deposited in the Protein Data Bank (http://www.rcsb.org). Source data are provided with this paper. All other data are available from the corresponding authors upon reasonable request.


