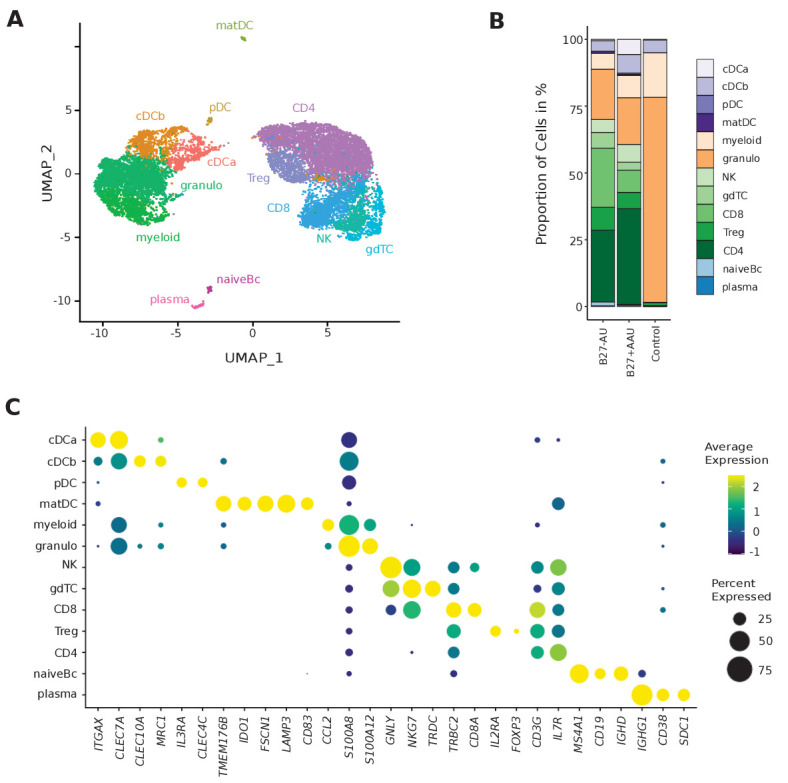
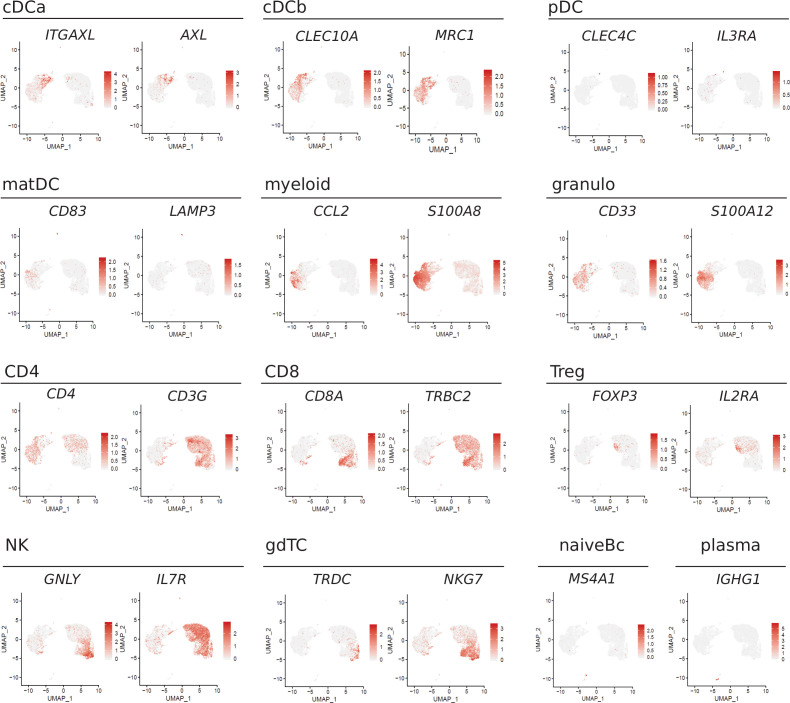
Figure 1. Single-cell transcriptomics reconstructs leukocyte subsets infiltrating the eye.
(A) Uniform manifold approximation and projection (UMAP) projection of seven pooled samples (control n = 1; B27-AU n = 2; B27+ AAU n = 4). The single-cell (sc) transcriptomes were manually annotated to cell types based on marker gene expression and distinguished in 13 cell clusters (color-coded; each dot represents one cell). (B) The mean proportion of cells (%) in each cluster per group is depicted in a stacked bar plot. (C) Dot plot of selected marker genes grouped by cluster. The average gene expression level is color-coded, and the circle size represents the percentage of cells expressing the gene. Threshold was set to a minimum of 10% of cells in the cluster expressing the gene. DC: dendritic cell, pDC: plasmacytoid DC, matDC: mature DC; granulo: granulocytes, NK cells: natural killer cells, gdTC: γδ T cells, Treg cells: regulatory T cells, Bc: B cells.


