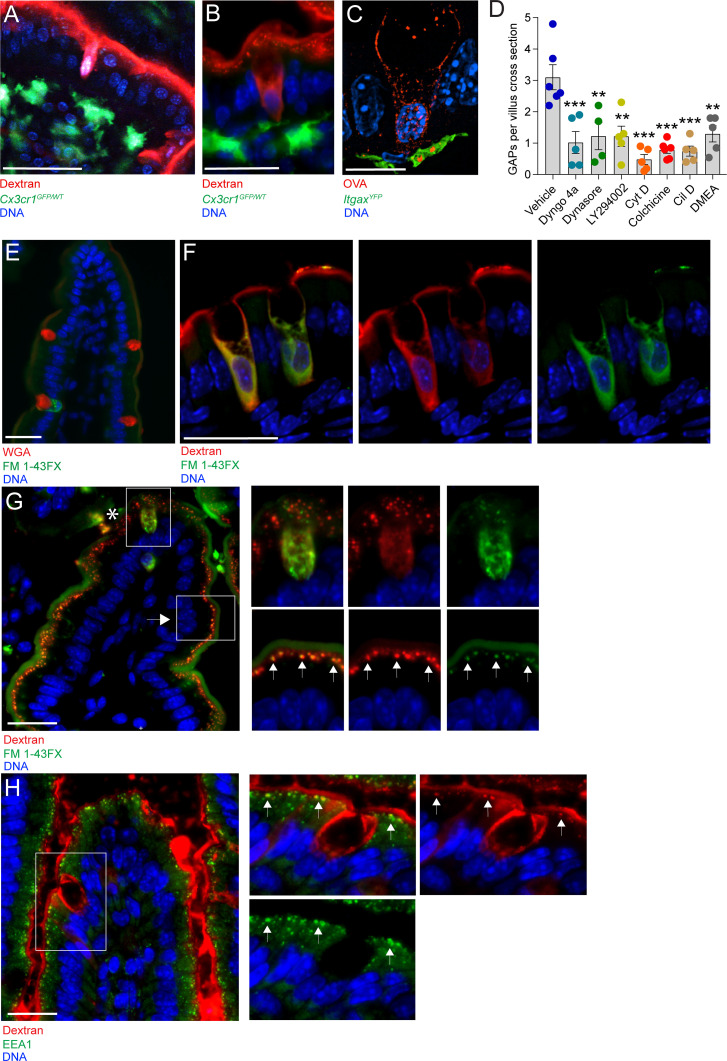
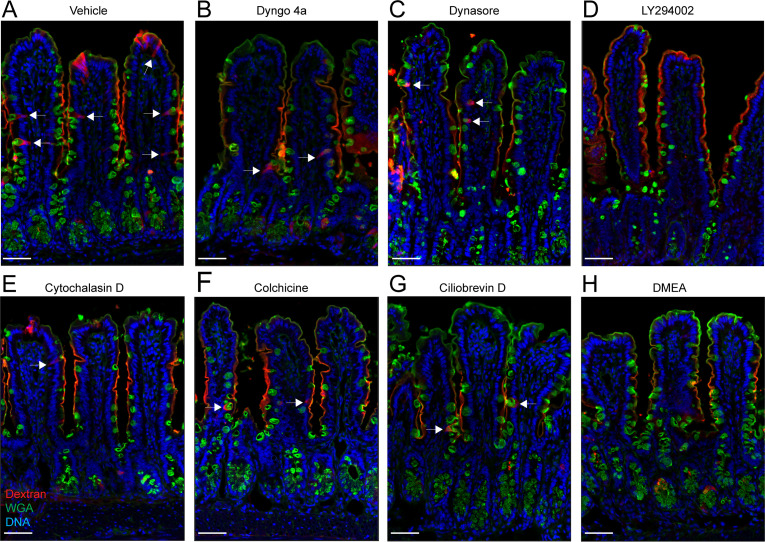
Figure 1. Goblet cell associated antigen passage (GAP) formation is an active endocytic process dependent on actin polymerization, microtubule transport, and phosphoinositide three kinase (PI3K).
(A) Intravital two-photon imaging, (B) wide-field fluorescent imaging, and (C) super-resolution structured illumination microscopy (SIM) imaging of the small intestine (SI) of CX3CR1GFP (green) or ItgaxYFP (green) reporter mice following luminal administration of 10 kDa tetramethylrodamine (TRITC)-dextran (red) or Texas Red-Ovalbumin (OVA; red). (D) Quantification of GAPs per SI villus cross section in mice treated with vehicle (n = 6), Dyngo 4a (n = 5), dynasore (n = 4), LY294002 (n = 5), cytochalasin D (Cyt D, n = 5), colchicine (n = 6), ciliobrevin D (Cil D, n = 5), or dimethylenastron (DMEA, n = 5) followed by intraluminal administration of 10 kDa TRITC-dextran. (E) Wide-field fluorescent imaging of the SI following intraluminal administration of FM 1–43FX (green) for 1 hr. Goblet cells are visualized by wheat germ agglutinin (WGA-Texas Red) (red). (F) Confocal fluorescent imaging of the SI following intraluminal administration of FM 1–43FX (green) and dextran-Alexa647 (red). (G) Wide-field fluorescent imaging of the SI following intraluminal administration of FM 1–43FX (green) and dextran-Alexa647 (red). Asterisk denotes goblet cell, arrow denotes enterocyte, arrows in zoomed in pictures denotes endosomal structures double positive for FM 1–43FX and dextran-Alexa647 in enterocytes. (H) Wide-field fluorescent imaging of the SI following intraluminal administration of TRITC-dextran (red) stained for early endosome protein 1 (EEA1) (green). Arrows denote endosomal structures double positive for TRITC-dextran and EEA1 in enterocytes. Data are presented as mean ± SEM. **p < 0.01, ***p < 0.001 as compared to vehicle treated mice. Scale bar: (A) 50 µm, (B) 25 µm, (C) 10 µm, (E–H) 25 µm. (C and F) represent 3D projections of obtained z-stacks. Statistical analysis was performed using a one-way ANOVA followed by Dunnet’s post-hoc test. A–B, E, G–H n = 6, C, F n = 4. Each point in panel D represents the average number of GAPs from 25 villi in one mouse.


