

Abstract
We characterized the size of the premarket safety population for 278 small-molecule new molecular entities (NMEs) and 61 new therapeutic biologics (NTBs) approved by FDA between October 1, 2002 and December 31, 2014, evaluating the relationship of premarket safety population size to regulatory characteristics and postmarket safety outcomes. The median size of the safety population was 1,044, and was lower for NTBs than NMEs (median: 920 vs. 1,138, p=0.04), orphan products than non-orphan products (393 vs. 1,606, p<0.001), and for products with fast track designation (617 vs. 1,455, p<0.001), priority review (630 vs. 1,735, p<0.001), and accelerated approval (475 vs. 1,164, p<0.001), than products without that designation. The median number of postmarket safety label updates and issues added to the label were higher with larger premarket exposure among non-orphan products, but not among orphan products. Products with accelerated approval using a surrogate endpoint had a higher median number of safety issues added to the label than those with full approval, but this did not vary with the size of the safety population; fast-track and priority review were not associated with the number of safety issues added to the label. A smaller safety population size was associated with a longer time to first safety outcome for non-orphan products but not orphan products. For orphan and non-orphan products combined, smaller premarket safety population size is not associated with the number or timing of postmarket safety outcomes, regardless of expedited program participation.
Keywords: premarket patient exposure, safety, labeling, regulatory, postmarket, pharmacovigilance
INTRODUCTION:
The relationship between the number of patients studied in drug development programs and the identification of new safety issues after approval is not well understood. The U.S. Food and Drug Administration (FDA) bases approval on adequate and well-controlled studies,1 with the number of patients studied generally driven by efficacy considerations and adequate exposure to examine safety and tolerability. International Council for Harmonization of Technical Requirements for Pharmaceuticals for Human Use (ICH) guidelines recommend at least 1,500 subjects be exposed to drugs intended for long-term treatment, with at least 300 exposed for at least 6 months and at least 100 for at least 12 months.2
Most studies of this relationship have examined limited indications3 or compared rare diseases to common diseases4 and found that small premarket safety populations were not associated with an excess number of postmarketing safety actions,4 that the extent of pre-approval exposure was not associated with the risk of safety issues,5 and that larger pre-approval exposure was associated with more serious safety issues postmarket.6 Most drugs intended for chronic use in Europe met the ICH recommendations for 6 and 12 months of exposure.7
We sought to characterize the size of the premarket safety population for new molecular entities (NMEs) and new therapeutics biologics (NTBs) and its relationship to postmarket safety outcomes and a product’s clinical and regulatory review characteristics.
METHODS:
We retrospectively reviewed all postmarket safety outcomes for prescription NME and NTBs approved by the FDA Center for Drug Evaluation and Research (CDER) between October 1, 2002, and December 31, 2014. We excluded non-NMEs, generic drugs, biosimilars, and over-the-counter products. We used publicly available information to identify the size of the pre-approval safety population8 and orphan drug status.9
We used the clinical review to determine the size of the safety population, generally including all patients who received at least one dose of the investigational drug.8 We excluded healthy volunteers and patients receiving placebo or comparator treatment. Patients enrolled in early phase trials who were “rolled into” later phase trials were counted once. Patients in continued-access studies, safety updates, published studies, and marketing experience outside the U.S. were included when their data were included in the clinical review. Advisory committee presentations and internal records were used to clarify ambiguities for less than five percent of products.
For products intended for long-term use, defined as chronic or repeated intermittent use for longer than 6 months, we assessed the number of patients who received study treatment for at least 6 and 12 months. For products used intermittently or when exposure was reported as the number of treatment cycles, we could not determine the 6- or 12-month exposure. Products initially approved with multiple indications were classified as non-orphan if any of the indications was not granted orphan designation. Drugs were assigned to a Prescription Drug User Fee Act (PDUFA) cohort corresponding to the initial application submission date.10 We recorded pharmacologic class using the Anatomical Therapeutic Chemical (ATC) Classification System.11 We recorded regulatory and review characteristics, including expedited programs.12 (Table S1) For each product, we recorded all postmarket safety outcomes from the product’s date of approval through June 30, 2018. A postmarket safety outcome was defined as withdrawal of the product from the market due to safety concerns, or an update to the product’s label that included the addition of a new safety-related issue in any of the following safety-related sections of the label: Boxed Warning, Contraindications, Warnings and Precautions, Adverse Reactions, or Drug Interactions. The date of the label update was defined as the date of the approval letter for the corresponding label update and the date of withdrawal was defined as the date in when FDA received a letter from the sponsor requesting withdrawal. Postmarket safety outcomes did not include editorial or formatting changes to the label, a change in the frequency of a known safety issue, addition of an attribute indicating an increased severity of a known safety issue, or additional information related to safety and effective use of the drug related only to treatment of new indications.
We assessed five postmarket safety-related outcomes, defined as safety-related withdrawals or safety-related updates to varying combinations of the Boxed Warning, Contraindications, Warnings and Precautions, Adverse Reactions or Drug Interactions sections of the label (Table S1).
We conducted a sensitivity analysis to test the robustness of our results using an alternative measure of the pre-approval safety population: the focused safety review, defined as exposed patients included in the safety review of the efficacy population.
Statistical analysis:
Descriptive analyses were performed using univariate statistics. For variables that were not normally distributed, median and range were also reported. We used the Wilcoxon test to analyze continuous variables; bivariable logistic regression to evaluate the relationship of quartiles of the safety population, regulatory pathways and postmarket safety outcome; multivariable logistic regression to adjust for potential confounders; chi-square test for trend and Wilcoxon tests to evaluate temporal trends; and Kaplan-Meier analyses to examine the association between time to first safety outcome and other factors. Because orphan drugs are known to have smaller development programs,3,7 we present results for orphan and non-orphan products separately as well as combined.
RESULTS
Our cohort included 339 products, 278 NMEs and 61 NTBs, approved between October 1, 2002 and December 31, 2014. Most (92%) were indicated for serious or life-threatening diseases and conditions and 69.7% were for long-term use. Sixty-four percent of the products were first approved in the U.S. and 68.3% were first marketed in the U.S. (Table 1). One-hundred-sixty-one (47.5%) products were designated for priority review; 115 (33.9%) received fast track designation. Thirty-seven (10.9%) were approved via the accelerated approval pathway using a surrogate endpoint, 70% of which were for oncologic indications. The most frequent ATC classifications for NMEs were ‘antineoplastic and immunomodulation agents’ (20.5%), ‘nervous system’ (14.0%), and ‘anti-infective for systemic use’ (13.0%); for NTBs, they were ‘antineoplastic and immunomodulation agents’ (55.8%), ‘alimentary tract and metabolism’ (16.4%), and ‘musculoskeletal system’ (8.2%). One-hundred-seven (31.6%) had orphan drug status. A higher percentage of NTBs received orphan drug designation compared to NMEs (47.5% vs. 28.1%, respectively) (Table 1).
Table 1:
Characteristics of New Molecular Entities (NME) and New Therapeutic Biologics (NTB) approved by the CDER between October 1, 2002 and December 31, 2014
| Variables | New Therapeutic Biologic (NTB) | New Molecular Entity (NME) | All | ||||||
|---|---|---|---|---|---|---|---|---|---|
| Orphan N=29 |
Non-orphan N=32 |
Total N=61 |
Orphan N=78 |
Non-orphan N=200 |
Total N=278 |
Orphan N=107 |
Non-orphan N=232 |
Total N=339 |
|
| n (%) | n (%) | n (%) | n (%) | n (%) | n (%) | n (%) | n (%) | n (%) | |
| Mean ± standard deviation | 494 ± 396 | 1,654 ± 919 | 1,103 ± 922 | 600 ± 714 | 2,605 ± 2,919 | 2,042 ± 2,660 | 571 ± 644 | 2,474 ± 2,750 | 1,873 ± 2,466 |
| Median | 360 | 1,516 | 920 | 400 | 1,653 | 1138 | 393 | 1,606 | 1,044 |
| Minimum-Maximum | 55–1,524 | 357–4,050 | 55–4,050 | 0–3,865 | 0–20,561 | 0–20,561 | 0–3,865 | 0–20,561 | 0–20,561 |
| Interquartile range (IQR) | 160–753 | 948–2,180 | 360–1,564 | 205–642 | 876–3,334 | 511–2,612 | 201–700 | 888–3,029 | 485–2,380 |
| n (%) | n (%) | n (%) | n (%) | n (%) | n (%) | n (%) | n (%) | n (%) | |
| Regulatory pathways | |||||||||
| Priority review designation (n (%)) | |||||||||
| Yes | 28 (96.6%) | 14 (43.8%) | 42 (68.9%) | 55 (70.5%) | 64 (32.0%) | 119 (42.8%) | 83 (77.6%) | 78 (33.6%) | 161 (47.5%) |
| No | 1 (3.4%) | 18 (56.2%) | 19 (31.1%) | 23 (29.5%) | 136 (68.0%) | 159 (57.2%) | 24 (22.4%) | 154 (66.4%) | 178 (52.5%) |
| Fast-track designation (n (%)) | |||||||||
| Yes | 22 (75.9%) | 8 (25.0%) | 30 (49.2%) | 48 (61.5%) | 37 (18.2%) | 85 (30.6%) | 70 (65.4%) | 45 (19.4%) | 115 (33.9%) |
| No | 7 (24.1%) | 24 (75.0%) | 31 (50.8%) | 30 (38.5%) | 163 (81.5%) | 193 (69.4%) | 37 (34.6%) | 187 (80.6%) | 224 (66.1%) |
| Accelerated approval using a surrogate endpoint (n (%)) | |||||||||
| Yes | 6 (20.7%) | 3 (9.4%) | 9 (14.8%) | 20 (25.6 %) | 8 (4.0%) | 28 (10.1%) | 26 (24.3%) | 11 (4.7%) | 37 (10.9%) |
| No | 23 (79.3%) | 29 (90.6%) | 52 (85.2%) | 58 (74.4%) | 192 (96.0%) | 250 (89.9%) | 81 (75.7%) | 221 (95.3%) | 302 (89.1%) |
| Breakthrough therapy designationa (n (%)) | |||||||||
| Yes | 4 (50.0%) | 0 (0%) | 4 (30.8%) | 5 (31.2%) | 3 (11.1%) | 8 (18.6%) | 9 (37.5%) | 3 (9.4%) | 12 (21.4%) |
| No | 4 (50.0%) | 5 (100%) | 9 (69.2%) | 11 (68.8%) | 24 (88.9%) | 35 (81.4%) | 15 (62.5%) | 29 (90.6%) | 44 (78.6%) |
| Indicated for serious or life-threatening disease (n (%)) | |||||||||
| Yes | 29 (100%) | 32 (100%) | 61 (100%) | 78 (100%) | 173 (86.5%) | 251 (90.3%) | 107 (100%) | 205 (88.4%) | 312 (92.0%) |
| No | 0 (0%) | 0 (0%) | 0 (0%) | 0 (0%) | 27 (13.5%) | 27 (9.7%) | 0 (0%) | 27 (11.6%) | 27 (8.0%) |
| Orphan drug (n (%)) | |||||||||
| Yes | 29 (100%) | - | 29 (47.5%) | 78 (100%) | - | 78 (28.1%) | 107 (100%) | - | 107 (31.6%) |
| No | - | 32 (100%) | 32 (52.5%) | - | 200 (100%) | 200 (71.9%) | - | 232 (100%) | 232 (68.4%) |
| Long-term use drug (n (%)) | |||||||||
| Yes | 22 (75.9%) | 25 (78.1%) | 47 (77.1%) | 63 (80.8%) | 126 (63.0%) | 189 (68.0%) | 85 (79.4%) | 151 (65.1%) | 236 (69.7%) |
| No | 7 (24.1%) | 7 (21.9%) | 14 (22.9%) | 15 (19.2%) | 74 (37.0%) | 89 (32.0%) | 22 (20.6%) | 81 (34.9%) | 103 (30.3%) |
| Approved 1st Cycle (n (%)) | |||||||||
| Yes | 21 (72.4%) | 21 (65.6%) | 42 (68.8%) | 64 (82.0%) | 125 (62.5%) | 189 (68.0%) | 85 (79.4%) | 146 (62.9%) | 231 (68.0%) |
| No | 8 (27.60%) | 11 (34.4%) | 19 (31.2%) | 14 (18.0%) | 75 (37.5%) | 89 (32.0%) | 22 (20.6%) | 86 (37.1%) | 108 (31.9%) |
| First-in-class (n (%)) | |||||||||
| Yes | 20 (69.0%) | 14 (43.8%) | 34 (55.7%) | 37 (47.4%) | 59 (29.5%) | 96 (34.5%) | 57 (53.3%) | 73 (31.5%) | 130 (38.4%) |
| No | 9 (31.0%) | 18 (56.2%) | 27 (44.3%) | 41 (52.6%) | 141 (70.5%) | 182 (65.5%) | 50 (46.7%) | 159 (68.5%) | 209 (61.6%) |
| First approved in U.S. (n (%)) | |||||||||
| Yes | 24 (82.8%) | 18 (56.2%) | 42 (68.8%) | 53 (68.0%) | 123 (61.5%) | 176 (63.3%) | 77 (72.0%) | 141 (60.8%) | 218 (64.3%) |
| No | 5 (17.2%) | 14 (43.8%) | 19 (31.2%) | 25 (32.0%) | 77 (38.5%) | 102 (36.7%) | 30 (28.0%) | 91 (39.2%) | 121(35.7%) |
| First marketed in U.S.b (n (%)) | |||||||||
| Yes | 25 (86.2%) | 20 (62.5%) | 45 (73.8%) | 57 (73.1%) | 129 (64.8%) | 186 (67.1%) | 82 (76.6%) | 149 (64.2%) | 231 (68.3%) |
| No | 4 (13.8%) | 12 (37.5%) | 16 (26.2%) | 21 (26.9%) | 70 (35.2%) | 91 (32.9%) | 25 (23.4%) | 82 (35.3%) | 107 (31.7%) |
| Approved with Boxed Warning (n (%)) | |||||||||
| Yes | 14 (48.3%) | 17 (53.1%) | 31 (50.8%) | 19 (24.4%) | 55 (27.5%) | 74 (26.6%) | 33 (30.8%) | 72 (31.0%) | 105 (30.0%) |
| No | 15 (51.7%) | 15 (46.9%) | 30 (49.2%) | 59 (75.6%) | 145 (72.5%) | 204 (73.4%) | 74 (69.2%) | 160 (69.0%) | 234 (70.0%) |
| Prescription Drug User Fee Act (PDUFA) c | |||||||||
| PDUFA 1 | 0 (0%) | 0 (0%) | 0 (0%) | 0 (0%) | 1 (0.5%) | 1 (0.4%) | 0 (0%) | 1 (0.4%) | 1 (0.3%) |
| PDUFA 2 | 3 (10.3%) | 5 (15.6%) | 8 (13.1%) | 5 (6.4%) | 29 (14.5%) | 34 (12.2%) | 8 (7.5%) | 34 (14.7%) | 42 (12.4%) |
| PDUFA 3 | 5 (17.26%) | 10 (31.2%) | 15 (24.6%) | 27 (34.6%) | 71 (35.5%) | 98 (35.2%) | 32 (29.9%) | 81 (34.9%) | 113 (33.3%) |
| PDUFA 4 | 13 (44.8%) | 13 (40.6%) | 26 (42.6%) | 34 (43.6%) | 76 (38.0%) | 110 (39.6%) | 47 (43.9%) | 89 (38.4%) | 136 (40.1%) |
| PDUFA 5 | 8 (27.6%) | 4 (12.5%) | 12 (19.7%) | 12 (15.4%) | 23 (11.5%) | 35 (12.6%) | 20 (18.7%) | 27 (11.6%) | 47 (13.9%) |
| Anatomical Therapeutic Chemical (ATC) Classification | |||||||||
| ‘Alimentary tract and metabolism’ | 8 (27.6%) | 2 (6.3%) | 10 (16.4%) | 8 (10.3%) | 27 (13.5%) | 35 (12.6%) | 16 (15.0%) | 29 (12.5%) | 45 (13.3%) |
| ‘Blood and blood forming organs’ | 2 (6.9%) | 1 (3.1%) | 3 (4.9%) | 4 (5.1%) | 11 (5.5%) | 15 (5.4%) | 6 (5,6%) | 12 (5.2%) | 18 (5.3%) |
| ‘Cardiovascular system’ | - | - | - | 6 (7.7%) | 14 (7.0%) | 20 (7.2%) | 6 (5.6%) | 14 (6.0%) | 20 (5.9%) |
| ‘Dermatological’ | - | - | - | - | 8 (4.0%) | 8 (2.9%) | - | 8 (3.4%) | 8 (2.4%) |
| ‘Genito-urinary system and sex hormones’ | - | - | - | - | 14 (7.0%) | 14 (5.0%) | - | 14 (6.0%) | 14 (4.1%) |
| ‘Systemic hormonal preparations, excluding sex hormones and insulins’ | - | - | - | 5 (6.4%) | 2 (1.0%) | 7 (2.5%) | 5 (4.7%) | 2 (0.9%) | 7 (2.1%) |
| ‘Anti-infective for systemic use’ | 1 (3.4%) | - | 1 (1.6%) | 1 (1.3%) | 35 (17.5%) | 36 (13.0%) | 2 (1.9%) | 35 (15.1%) | 37 (10.9%) |
| ‘Antineoplastic and immunomodulation agents’ | 14 (48.3%) | 20 (62.5%) | 34 (55.8%) | 37 (47.4%) | 20 (10.0%) | 57 (20.5%) | 51 (47.7%) | 40 (17.2%) | 91 (26.8%) |
| ‘Musculo-skeletal system’ | 2 (6.9%) | 3 (9.4%) | 5 (8.2%) | - | 2 (1.0%) | 2 (0.7%) | 2 (1.9%) | 5 (2.2%) | 7 (2.1%) |
| ‘Nervous system’ | - | - | - | 7 (9.0%) | 32 (16.0%) | 39 (14.0%) | 7 (6.5%) | 32 (13.8%) | 39 (11.5%) |
| ‘Antiparasitic products, insecticides and repellents’ | - | - | - | 2 (2.6%) | 2 (1.0%) | 4 (1.4%) | 2 (1.9%) | 2 (0.9%) | 4 (1.2%) |
| ‘Respiratory system’ | - | 1 (3.1%) | 1 (1.6%) | 1 (1.3%) | 9 (4.5%) | 10 (3.6%) | 1 (0.9%) | 10 (4.3%) | 11 (3.2%) |
| ‘Sensory organs’ | - | 3 (9.4%) | 3 (4.9%) | 0 (0%) | 9 (4.5%) | 9 (3.2%) | 0 (0%) | 12 (5.2%) | 12 (3.5%) |
| ‘Various systems’ | 2 (6.9%) | 2 (6.2%) | 4 (6.6%) | 7 (9.0 %) | 15 (7.5%) | 22 (7.9%) | 9 (8.4%) | 17 (7.3%) | 26 (7.7%) |
| Met International Council for Harmonization (ICH) Guidelines for 1,500 exposed | |||||||||
| Yes | 1 (3.4%) | 16 (50.0%) | 17 (27.9%) | 7 (9.0%) | 107 (53.5%) | 114 (41.0%) | 8 (7.5%) | 123 (53.0%) | 131 (38.6%) |
| No | 28 (96.6%) | 16 (50.0%) | 44 (72.1%) | 71 (91.0%) | 93 (46.5%) | 164 (59.0%) | 99 (92.5%) | 109 (47.0%) | 208 (61.4%) |
n=57, Available only for NMEs and NTBs filed on or after July 9, 2012.
n=338, Excludes one NME that was approved but never marketed.
PDUFA 5, includes NTBs and BLAs received 10/1/2012 to 12/31/2014. PDUFA 1 includes only products received between 10/1/2002 (start of our study) and 09/30/1997
The median number of patients in the safety population was 1044 (IQR 485–2,380) (Table 1) and was significantly smaller for orphan products compared to non-orphan products (393 vs. 1,606, p<0.001), for NTBs compared to NMEs (920 vs. 1,138, p=0.04), and for products first approved (882 vs. 1,514, p<0.001) and marketed in the US (925 vs. 1,468, p<0.001) (Figure 1). The median size of the safety population was smaller for products developed or approved under fast track designation (617 vs. 1,455, p<0.001), priority review (630 vs. 1,751, p<0.001), and accelerated approval (475 vs. 1,164, p<0.001) than for those without that designation (Figure 1a); when examined by orphan drug status, this finding was true for non-orphan products (Figure 1c) but not for orphan products (Figure 1b).
Figure 1:


Size of the safety population by regulatory and review characteristics
*Available only for new molecular entities (NMEs) and new therapeutic biologics (NTBs) received on or after July 9, 2012.
The Wilcoxon test was used to compare the differences in median safety population size for each regulatory characteristic.
The median size of the safety population was the highest for the ‘genito-urinary system and sex hormones’ ATC (median 3,308) and the lowest for ‘systemic hormonal preparations, excluding sex hormones and insulins’ (median 205). In most ATC classes the median safety population size was smaller for orphan than for non-orphan products (Figure S1).
Twenty-two drugs were submitted under Section 505(b)(2) (Table S1), nine of which had no new patient clinical data submitted, and thus safety populations of zero; one of these had a postmarket safety label change (Table S2).
One-hundred-thirty-one (38.6%) products had at least 1,500 subjects in the safety population. Eight (7.5%) orphan products met the ICH recommended 1,500 target, as did 123 (53.0%) non-orphan products (Table 1). There was wide variation among non-orphan products in the percentages meeting this recommendation across ATC classifications. Less than 10% of orphan products met this ICH recommendation in most ATC classifications, though there was some variation (Table S3).
For the 236 products intended for long-term use, data on length of exposure during clinical development were available for 176 and 171 products at 6 and 12 months, respectively. Of these, most non-orphan products met the ICH Guidelines for 6-and 12-month exposure (91% and 90% respectively); for orphan products the percentages were 24% and 37% (Figure S2).
The size of the safety population did not decrease over successive PDUFA cohorts for both orphan and non-orphan products, though there was some cohort-to-cohort variation (Figure S3).
The median number of postmarket safety label updates and issues added to the label were higher with larger premarket exposure among non-orphan products, but not among orphan products (Figure 2). Fast-track, priority review, approval under any expedited program, and first-in-class status did not impact the median number of safety issues (Table 2). Products with accelerated approval using a surrogate endpoint had a higher median number of safety issues than those with full approval (19 vs. 7, Table 2) during both the first 3.5 years of follow-up (6 vs. 1, Table 2) and after 3.5 years of follow-up (7 vs. 3, Table 2) across all safety population quartiles.
Figure 2:

Boxplots of the number of label updates and issues during follow-up. This figure illustrates the mean and median number of label updates (left) and new safety issues (right) during follow-up. The interquartile range (IQR) (difference between the 25th and 75th percentile) and minimum and maximum number of label updates and new safety issues are graphically represented
Table 2:
Number of issues added to labels by regulatory pathway
| Full study follow-up | ||||||||||||||||||
|---|---|---|---|---|---|---|---|---|---|---|---|---|---|---|---|---|---|---|
| Variable | All | Q1 (Safety population 0–485) |
Q2 (Safety population 486–1044) |
Q3 (Safety population 1045–2380) |
Q4 (Safety population ≥ 2381) |
|||||||||||||
| N | Mean (Standard Deviation) | Median (IQR) | Minimum-Maximum | n | Mean (Standard Deviation) | Median (IQR) | n | Mean (Standard Deviation) | Median (IQR) | n | Mean (Standard Deviation) | Median (IQR) | n | Mean (Standard Deviation) | Median (IQR) | |||
| All | Total | 339 | 12 (14.2) | 7 (2, 18) | 0–91 | 85 | 12.2 (16.8) | 5 (0, 18) | 85 | 10.6 (14.4) | 5 (1, 15) | 85 | 11.5 (13.3) | 8 (3, 14) | 84 | 13.6 (11.8) | 11 (5, 19.5) | |
| Fast Track | No | Total | 224 | 11.5 (13.5) | 7 (2, 17) | 0–61 | 41 | 7.3 (11.1) | 3 (0, 8) | 45 | 9.9 (15.1) | 4 (0, 13) | 63 | 12.3 (15) | 7 (3, 19) | 75 | 14.1 (11.9) | 11 (5, 21) |
| Yes | Total | 115 | 12.9 (15.3) | 8 (2, 19) | 0–91 | 44 | 16.8 (19.7) | 9.5 (1, 27) | 40 | 11.3 (13.7) | 6.5 (1, 16.5) | 22 | 9.3 (6.3) | 10 (4, 11) | 9 | 9.8 (10.1) | 7 (3, 12) | |
| Priority | No | Total | 178 | 11.2 (12.6) | 7 (2, 16) | 0–61 | 23 | 8.2 (9.5) | 5 (0, 15) | 35 | 9 (15.1) | 4 (0, 8) | 53 | 11.5 (13) | 7 (3, 14) | 67 | 13.2 (11.5) | 11 (4, 20) |
| Yes | Total | 161 | 12.8 (15.7) | 7 (1, 19) | 0–91 | 62 | 13.7 (18.6) | 5 (0, 21) | 50 | 11.6 (13.9) | 6 (1, 18) | 32 | 11.5 (13.9) | 9.5 (3, 12) | 17 | 15.4 (13.1) | 12 (7, 19) | |
| Accelerated Approval | No | Total | 302 | 10.5 (12.3) | 7 (1, 15) | 0–61 | 66 | 8.7 (11.9) | 4 (0, 16) | 74 | 8.5 (12.6) | 5 (0, 9) | 79 | 10.8 (12.6) | 7 (3, 13) | 83 | 13.4 (11.7) | 11 (5, 19) |
| Yes | Total | 37 | 23.9 (21.3) | 19 (6, 35) | 0–91 | 19 | 24.3 (24.6) | 16 (5, 44) | 11 | 24.4 (18.3) | 21 (3, 42) | 6 | 20.8 (20) | 15 (10, 20) | 1 | 30 (−) | 30 (30, 30) | |
| Any Expedited | No | Total | 157 | 11.8 (13) | 8 (2, 17) | 0–61 | 15 | 7.4 (9) | 5 (0, 8) | 28 | 9.8 (16.5) | 4 (0, 9) | 49 | 12 (13.4) | 7 (3, 19) | 65 | 13.5 (11.5) | 11 (5, 20) |
| Yes | Total | 182 | 12.1 (15.1) | 7 (1, 18) | 0–91 | 70 | 13.2 (17.9) | 5 (0, 20) | 57 | 10.9 (13.3) | 6 (1, 17) | 36 | 10.9 (13.3) | 9 (3, 11) | 19 | 13.9 (13.1) | 9 (4, 19) | |
| First-in-class | No | Total | 209 | 11.5 (13.4) | 7 (2, 16) | 0–61 | 46 | 10.4 (13.2) | 5 (0, 17) | 49 | 12.4 (16.6) | 6 (1, 17) | 54 | 10.4 (13.2) | 6.5 (2, 11) | 60 | 12.5 (10.7) | 10 (5, 17.5) |
| Yes | Total | 130 | 12.8 (15.3) | 7 (1, 20) | 0–91 | 39 | 14.3 (20.2) | 5 (0.5, 27) | 36 | 8.1 (10.3) | 4.5 (1, 12) | 31 | 13.5 (13.4) | 10 (4, 24) | 24 | 16.4 (14.1) | 14 (4.5, 23.5) | |
| Orphan | No | Total | 232 | 11.9 (13.4) | 7 (3, 18) | 0–61 | 25 | 7.8 (12.1) | 4 (0, 8) | 51 | 10.9 (15) | 5 (0, 18) | 75 | 11.8 (13.9) | 7 (3, 14) | 81 | 13.8 (11.9) | 11 (5, 20) |
| Yes | Total | 107 | 12.1 (15.8) | 6 (1, 18) | 0–91 | 60 | 14 (18.1) | 6.5 (0, 20.5) | 34 | 10 (13.5) | 5.5 (1, 10) | 10 | 9.5 (7.7) | 9 (3, 14) | 3 | 8 (3.6) | 7 (5, 12) | |
| Within three and half years of follow-up | ||||||||||||||||||
| Variable | All | Q1 (Safety population 0–485) |
Q2 (Safety population 486–1044) |
Q3 (Safety population 1045–2380) |
Q4 (Safety population ≥ 2381) |
|||||||||||||
| N | Mean (Standard Deviation) | Median (IQR) | Minimum-Maximum | n | Mean (Standard Deviation) | Median (IQR) | n | Mean (Standard Deviation) | Median (IQR) | n | Mean (Standard Deviation) | Median (IQR) | n | Mean (Standard Deviation) | Median (IQR) | |||
| All | Total | 339 | 5.1 (8.3) | 2 (0, 7) | 0–51 | 85 | 5.1 (10.1) | 1 (0, 5) | 85 | 4 (7.4) | 1 (0, 5) | 85 | 5.3 (8.2) | 2 (0, 6) | 84 | 6.2 (7.3) | 3 (1, 9) | |
| Fast Track | No | Total | 224 | 5.2 (8.7) | 1 (0, 6) | 0–51 | 41 | 4.2 (9.7) | 0 (0, 2) | 45 | 4 (9.1) | 0 (0, 4) | 63 | 5.6 (9.2) | 1 (0, 5) | 75 | 6.2 (7.5) | 3 (1, 9) |
| Yes | Total | 115 | 4.9 (7.6) | 3 (0, 7) | 0–48 | 44 | 5.8 (10.6) | 1 (0, 6.5) | 40 | 4.1 (4.9) | 3 (0, 7) | 22 | 4.4 (4.6) | 3 (1, 7.) | 9 | 6 (6.3) | 4 (1, 9) | |
| Priority | No | Total | 178 | 4.8 (7.4) | 2 (0, 6) | 0–48 | 23 | 3.6 (5.2) | 1 (0, 6) | 35 | 4.1 (9) | 1 (0, 4) | 53 | 4.9 (7.7) | 1 (0, 5) | 67 | 5.5 (7) | 3 (1, 9) |
| Yes | Total | 161 | 5.5 (9.3) | 2 (0, 7) | 0–51 | 62 | 5.6 (11.4) | 0 (0, 5) | 50 | 4 (6.1) | 1 (0, 6) | 32 | 6 (9) | 3 (0.5, 7.5) | 17 | 8.9 (8.3) | 7 (3, 11) | |
| Accelerated Approval | No | Total | 302 | 4.3 (6.9) | 1 (0, 6) | 0–48 | 66 | 2.5 (4.5) | 0 (0, 2) | 74 | 3.5 (7.4) | 1 (0, 5) | 79 | 4.7 (7.2) | 2 (0, 6) | 83 | 6.2 (7.4) | 3 (1, 9) |
| Yes | Total | 37 | 11.8 (14.3) | 6 (1, 15) | 0–51 | 19 | 14.1 (17.2) | 6 (0, 21) | 11 | 7.5 (6.8) | 8 (1, 12) | 6 | 12.7 (15.7) | 5 (5, 19) | 1 | 11 (−) | 11 (11, 11) | |
| Any Expedited | No | Total | 157 | 5 (7.7) | 2 (0, 6) | 0–48 | 15 | 3 (4.8) | 1 (0, 6) | 28 | 4.5 (10) | 0 (0, 4.5) | 49 | 5.1 (8) | 1 (0, 5) | 65 | 5.7 (7) | 3 (1, 9) |
| Yes | Total | 182 | 5.2 (8.9) | 1.5 (0, 7) | 0–51 | 70 | 5.5 (10.9) | 0.5 (0, 5) | 57 | 3.8 (5.8) | 1 (0, 5) | 36 | 5.6 (8.6) | 3 (0, 6.5) | 19 | 7.9 (8.3) | 6 (2, 11) | |
| First-in-class | No | Total | 209 | 4.4 (6.9) | 2 (0, 6) | 0–48 | 46 | 3.2 (5) | 0 (0, 6) | 49 | 4.2 (8) | 1 (0, 5) | 54 | 4.6 (7.2) | 2 (0, 5) | 60 | 5.3 (6.7) | 3 (1, 8) |
| Yes | Total | 130 | 6.4 (10.2) | 2 (0, 9) | 0–51 | 39 | 7.2 (13.7) | 1 (0, 5) | 36 | 3.8 (6.6) | 1 (0, 5) | 31 | 6.5 (9.7) | 3 (0, 8) | 24 | 8.5 (8.3) | 7.5 (1.5, 15) | |
| Orphan | No | Total | 232 | 5.3 (7.9) | 2 (0, 7) | 0–48 | 25 | 2.5 (4.1) | 0 (0, 4) | 51 | 5 (9) | 1 (0, 7) | 75 | 5.4 (8.5) | 2 (0, 6) | 81 | 6.2 (7.4) | 3 (1, 9) |
| Yes | Total | 107 | 4.8 (9.2) | 1 (0, 5) | 0–51 | 60 | 6.1 (11.6) | 1 (0, 6.5) | 34 | 2.6 (3.4) | 1 (0, 5) | 10 | 4.4 (5.9) | 3 (0, 6) | 3 | 5.3 (5.1) | 4 (1, 11) | |
| After three and half years of follow-up | ||||||||||||||||||
| Variable | All | Q1 (Safety population 0–485) |
Q2 (Safety population 486–1044) |
Q3 (Safety population 1045–2380) |
Q4 (Safety population ≥ 2381) |
|||||||||||||
| N | Mean (Standard Deviation) | Median (IQR) | Minimum-Maximum | n | Mean (Standard Deviation) | Median (IQR) | n | Mean (Standard Deviation) | Median (IQR) | n | Mean (Standard Deviation) | Median (IQR) | n | Mean (Standard Deviation) | Median (IQR) | |||
| All | Total | 339 | 6.8 (9.7) | 3 (0, 10) | 0–59 | 85 | 7.1 (11.4) | 2 (0, 10) | 85 | 6.5 (10.6) | 2 (0, 9) | 85 | 6.2 (8.5) | 3 (0, 9) | 84 | 7.4 (8.1) | 5.5 (1, 11) | |
| Fast Track | No | Total | 224 | 6.3 (8.6) | 3 (0, 8.5) | 0–59 | 41 | 3 (5.2) | 0 (0, 4) | 45 | 5.9 (10.2) | 2 (0, 7) | 63 | 6.7 (9.2) | 3 (0, 9) | 75 | 7.8 (8.1) | 6 (1, 12) |
| Yes | Total | 115 | 7.9 (11.6) | 3 (0, 11) | 0–50 | 44 | 11 (14,.1) | 5.5 (0, 13.5) | 40 | 7.2 (11.2) | 2 (0, 9) | 22 | 5 (6.2) | 2 (0, 10) | 9 | 3.8 (7.5) | 1 (0, 3) | |
| Priority | No | Total | 178 | 6.4 (8.6) | 3 (0, 9) | 0–59 | 23 | 4.6 (6.1) | 2 (0, 6) | 35 | 4.9 (10.5) | 1 (0, 6) | 53 | 6.7 (8.6) | 3 (0, 9) | 67 | 7.6 (8.2) | 6 (1, 11) |
| Yes | Total | 161 | 7.3 (10.9) | 3 (0, 10) | 0–50 | 62 | 8.1 (12.6) | 2.5 (0, 11) | 50 | 7.7 (10.7) | 3 (0, 10) | 32 | 5.5 (8.6) | 2.5 (0, 6) | 17 | 6.5 (7.8) | 3 (1, 12) | |
| Accelerated Approval | No | Total | 302 | 6.2 (8.8) | 3 (0, 9) | 0–59 | 66 | 6.3 (10) | 1.5 (0, 8) | 74 | 5 (8.7) | 1 (0, 7) | 79 | 6.1 (8.6) | 3 (0, 9) | 83 | 7.3 (8) | 5 (1, 11) |
| Yes | Total | 37 | 12.1 (14.6) | 7 (0, 16) | 0–44 | 19 | 10.2 (15.3) | 4 (0, 12) | 11 | 16.9 (16.3) | 10 (0, 34) | 6 | 8.2 (7.5) | 8 (0, 15) | 1 | 19 (.) | 19 (19, 19) | |
| Any Expedited | No | Total | 157 | 6.8 (8.9) | 4 (0, 9) | 0–59 | 15 | 4.4 (6.7) | 2 (0, 6) | 28 | 5.3 (11.4) | 1.5 (0, 6.5) | 49 | 6.9 (8.8) | 3 (0, 9) | 65 | 7.8 (8.3) | 6 (1, 11) |
| Yes | Total | 182 | 6.9 (10.4) | 3 (0, 10) | 0–50 | 70 | 7.7 (12.2) | 3 (0, 11) | 57 | 7.1 (10.3) | 3 (0, 9) | 36 | 5.3 (8.2) | 2.5 (0, 6) | 19 | 6 (7.6) | 3 (1, 12) | |
| First-in-class | No | Total | 209 | 7.1 (10.2) | 3 (0, 9) | 0–59 | 46 | 7.2 (11.4) | 2.5 (0, 8) | 49 | 8.2 (13) | 2 (0, 10) | 54 | 5.8 (8.7) | 3 (0, 8) | 60 | 7.2 (7.7) | 5 (1, 11) |
| Yes | Total | 130 | 6.4 (9) | 3 (0, 10) | 0–50 | 39 | 7.1 (11.5) | 2 (0, 11) | 36 | 4.3 (5.6) | 0.5 (0, 8.5) | 31 | 7 (8.4) | 3 (0, 14) | 24 | 7.8 (9.1) | 6 (1, 12) | |
| Orphan | No | Total | 232 | 6.6 (8.7) | 3 (0, 9.5) | 0–43 | 25 | 5.3 (10.1) | 0 (0, 5) | 51 | 5.9 (8.9) | 2 (0, 8) | 75 | 6.4 (8.7) | 3 (0, 9) | 81 | 7.6 (8.2) | 6 (1, 11) |
| Yes | Total | 107 | 7.3 (11.7) | 3 (0, 10) | 0–59 | 60 | 7.9 (11.9) | 3 (0, 11.5) | 34 | 7.4 (13) | 2 (0, 9) | 10 | 5.1 (7.3) | 2.5 (0, 9) | 3 | 2.7 (2.9) | 1 (1, 6) | |
For orphan and non-orphan products combined, the number of safety issues was driven primarily by additions to the Warnings and Precautions and Adverse Reactions sections of the label. The most common adverse events added to the Boxed Warning or Warnings and Precautions sections of the labels of products approved under accelerated approval using a surrogate endpoint were varied and included skin and subcutaneous tissue disorders (e.g. toxic epidermal necrolysis), infections (e.g. pneumonia), and metabolism disorders (e.g. tumour lysis syndrome). For products with full approval, the most commonly added issues were angioedema, anaphylactic reaction, and hypersensitivity. The most common adverse events added to the Adverse Reactions section of the labels of products approved under accelerated approval using a surrogate endpoint were varied and included hepatobiliary disorders (e.g. hepatic failure, cholecystitis), skin and subcutaneous tissue disorders (e.g. toxic epidermal necrolysis), and hypersensitivity issues (e.g. angioedema). For products with full approval, the most commonly added issues were angioedema, anaphylactic reaction, and hypersensitivity.
Products with larger safety populations consistently had an earlier time to first postmarket safety outcome regardless of approval under an expedited pathway. A smaller premarket safety population size was not associated with earlier postmarket safety outcomes, regardless of expedited approval programs (Figure S4). There was no difference in time to first safety event for orphan and non-orphan for products meeting the ICH 1500-patient, 6-month, and 1-year patient exposure recommendations compared to those with less exposure (Figure S5).
In adjusted analyses, orphan products in the two lower quartiles of the safety population were not associated with an increased frequency of safety outcomes compared to those in the highest (Figure 3a); for some sections of the label they were associated with a significantly lower frequency, though not when examining only Boxed Warnings and withdrawals for orphan products. The same finding was true for non-orphan products, with the lowest quartile having a lower likelihood of Boxed Warnings or withdrawals than the highest quartile (Figure 3b).
Figure 3:


Association between the size of the safety population and a postmarket safety outcome comparing the 3 lowest safety population size quartiles to the highest safety population size quartile
a Adjusted for indicated for long-term use
b Adjusted for indicated for long-term use, and first approved in the US
c Adjusted for approved with a Boxed Warning
d Adjusted for indicated for serious conditions, length of follow-up, and indicated for long-term use
e Adjusted for length of follow-up, and indicated for long-term use
f Adjusted for antineoplastic and immunomodulation agent ATC, length of follow-up, and indicated for long-term use
g Adjusted for therapeutic agent type, and accelerated approval using a surrogate endpoint
BW = Boxed Warning
W&P = Warnings and Precautions
C = Contraindications
AR = Adverse Reactions
DI = Drug Interactions
Among non-orphan products, the time to first safety outcome was longer for the smaller safety population sizes for all five safety outcomes; among orphan products, the time to the first safety outcome was not different based on safety population size (Figure 4).
Figure 4:
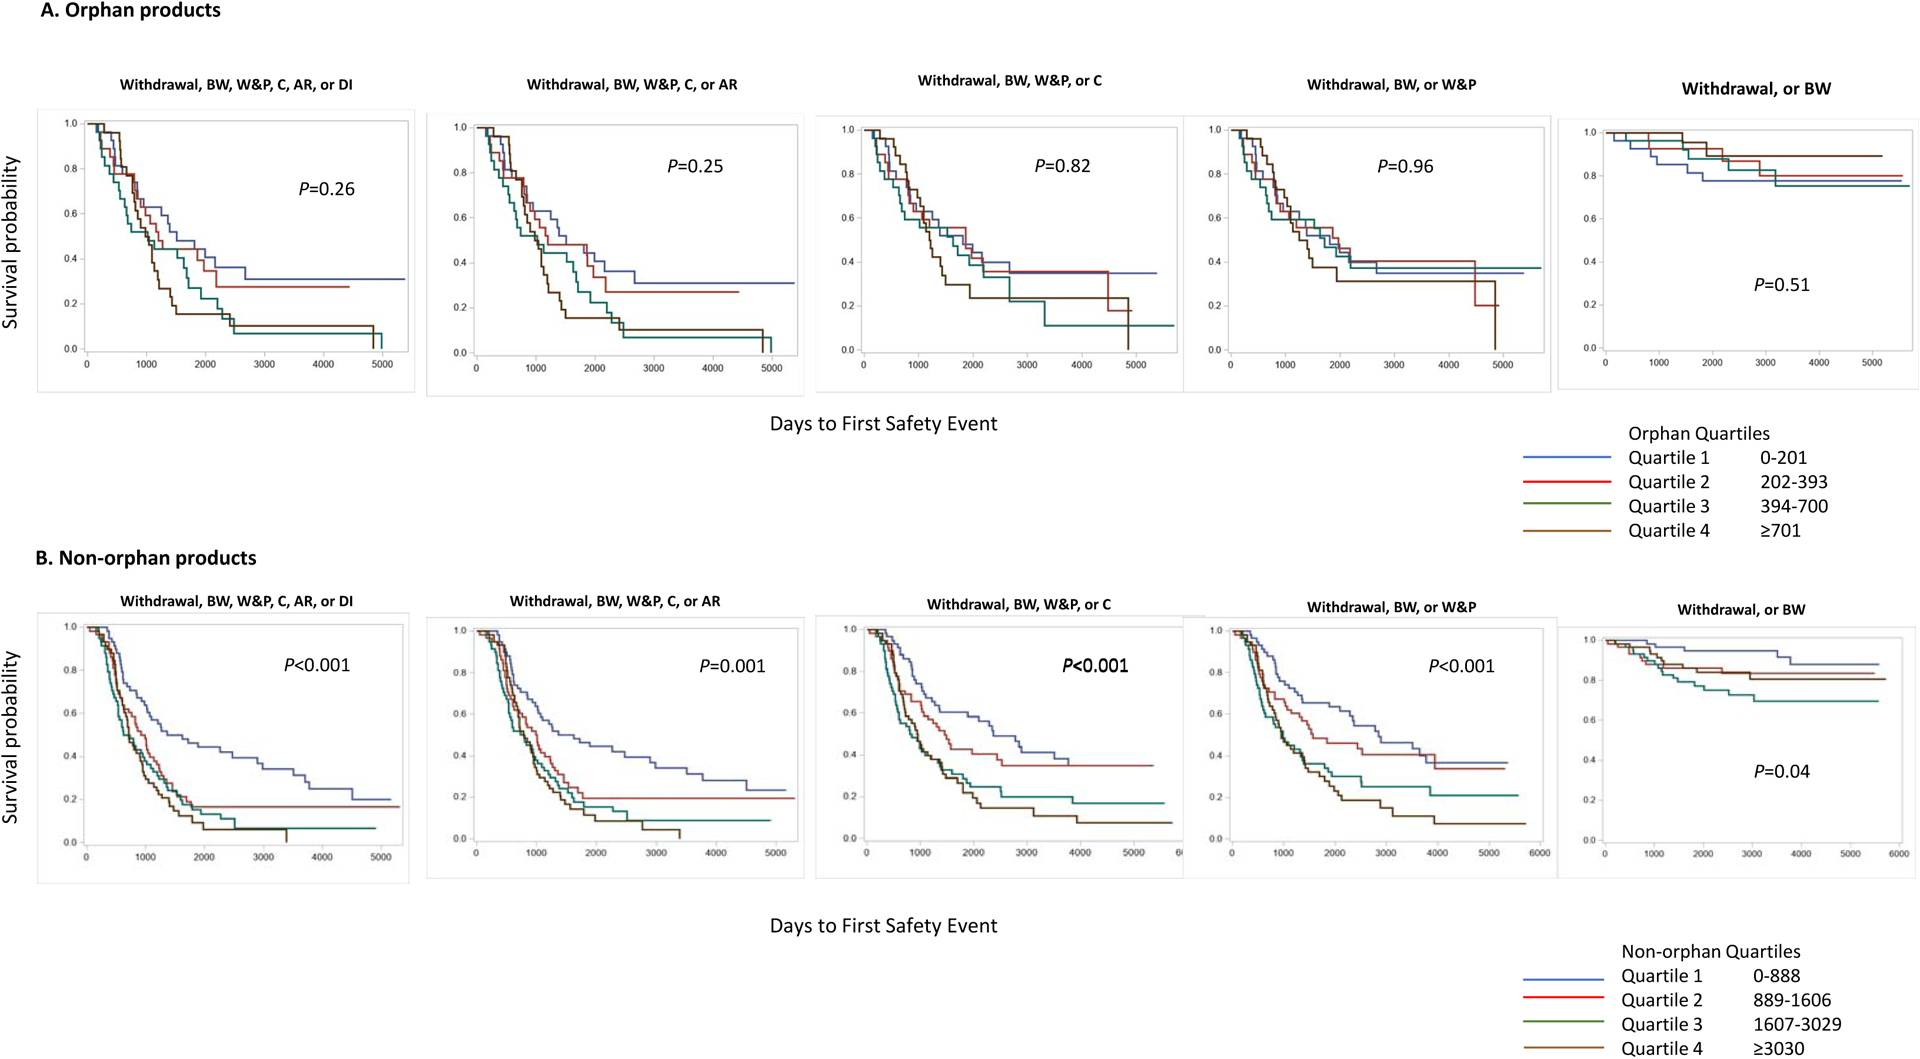
Size of the safety population by quartiles in orphan and non-orphan products and its association to postmarket safety outcome
BW=Boxed Warning; W&P=Warnings and Precautions; C=Contraindications; AR=Adverse Reactions; DI=Drug Interactions
Sensitivity analyses based on the focused safety review were similar to those of the primary analyses. For all products, the size of the safety population used in the primary analyses was equal to or larger than the focused safety review. The relationship between the covariates and focused safety review was consistent with safety population analyses (Figure S6).
DISCUSSION:
There is substantial variability in the size of the safety populations exposed to novel medicines in drug development prior to their approval in the United States. In a set of 339 NMEs and NTBs, the safety populations ranged from zero (under special circumstances) to almost 20,000 patients, with similar median values for NMEs and NTBs after accounting for orphan drug status.
Our finding that medicines with orphan designation had smaller safety populations than those without orphan designation is consistent with previous studies.4,7 The ICH recommendations acknowledge circumstances, such as a small intended treatment population, when a smaller number of patients may be acceptable.2 While FDA’s expedited programs are used more frequently with orphan products than non-orphan products,4 neither these programs nor other regulatory characteristics were associated with the size of the safety population for orphan products. These findings, coupled with the variability in the size of orphan product safety populations across ATC classifications, suggest that the relatively small size of the target population, and thus the number of patients available for clinical trials, is the primary determinant of the size of the pre-approval safety population. However, the proportions of the target populations studied in pre-approval clinical trials are higher than those for non-orphan products.4
Among non-orphan products, use of expedited programs and first approval or marketing in the U.S. were associated with smaller safety populations, while indication for long-term use and approval with a Boxed Warning were associated with larger safety populations. These findings, coupled with the variation in safety population size both across and within ATC classifications, and the variation in the percentage of products meeting the ICH premarket exposure recommendations across ATC classifications, suggest that multiple factors specific to a particular development program, such as the condition being treated, the duration of treatment, and the effect size being measured in efficacy trials, are likely determinants of the size of the safety population.3
Others have reported that the number of patients treated in efficacy trials is smaller for products under an expedited program13 and that the relatively small size may lead to more postmarket safety issues being identified after approval.14 However, the safety population within a clinical development program is generally larger than that of the efficacy population.3 Our finding that products approved under accelerated approval using a surrogate outcome, but not those approved under other expedited programs, had more postmarket safety issues than products not approved under this pathway, extends a previous finding for NTBs15 to both NTBs and NMEs. While previous findings that NMEs and NTBs approved via this pathway have a shorter time to a safety outcome than NMEs16 and NTBs15 not approved via this pathway, this finding was not observed for products approved via other expedited programs, which are also associated with smaller safety populations. Additionally, amongst products approved via accelerated approval with a surrogate outcome, the size of the safety populations across quartiles of safety population size was not associated with an increase in safety issues. If smaller safety population size were the sole reason for this increased number of postmarket safety issues, one would expect the number of safety issues to be higher in the early postmarket period and lower thereafter, since for most products this period should be sufficient to identify safety issues that would otherwise have been detected in clinical development programs. However, we found that the higher number of safety issues persisted throughout the follow-up period. Accelerated approval with a surrogate marker is reserved for drugs that treat serious conditions and that generally provide a meaningful advantage over existing therapies; it accounted for only 10% of products in our study. The use of a surrogate endpoint that is reasonably likely to predict a clinical endpoint and that can be measured earlier than the clinical endpoint allows these products to reach patients sooner than otherwise would be possible; confirmatory efficacy trials using a clinical endpoint are required for full approval. Before full approval is attained, product labels must describe any uncertainty about clinical benefits. The increase in the number of safety issues identified after approval for these products, relative to products with full approval, is consistent with this approach. Because these products are generally for chronic conditions, and because the duration of individual patient exposure during development is shortened because of use of a surrogate endpoint, it is possible that long-latency adverse events are not well identified before approval. It is also possible that the higher number of safety issues may reflect the addition of safety data from the confirmatory clinical trials. Our data were not able to address these possibilities.
While there was some variation in the median size of the safety populations across PDUFA periods, there was no trend suggestive of a decrease over time for either orphan or non-orphan products, a finding consistent with a previous report that the aggregated number of patients in efficacy trials was not different in three approval-time cohorts.13 Our finding also confirmed prior research that products under expedited pathways had smaller premarket exposure,17, 18 but conflicted with assertions that clinical trial size used to support approval has decreased over time.17, 19
Among orphan products, we found no association between the size of the safety population and the development of postmarket safety outcomes. Non-orphan products with smaller safety populations were less likely to have postmarket safety outcomes than those with larger safety populations. Because small premarket safety population sizes may reflect the availability of patients with the disease or condition under study, they may be correlated with low postmarket drug utilization.5 The influence of postmarket utilization, however, on postmarket safety outcomes remains incompletely understood.
Some have argued that the ICH clinical safety guidelines for chronic-use drugs are not sufficient to detect long-term adverse events.7 Estimates based on hypothetical models suggest the potential to limit adverse events could be an important consideration in sample-size determinations for preapproval trials.20 In our analysis, time to first safety event was not associated with meeting the ICH recommendations for long-term use. However, time to first safety events was shorter for non-orphan products with at least 1,500 patients in the safety population compared to those with fewer patients, likely reflecting a correlation between premarket exposure and postmarket utilization and early uptake of a new product, which provides the opportunity to identify new risks.
Strengths and Limitations
Our study has a number of strengths. We conducted a comprehensive review to identify the size of the safety population for NMEs and NTBs by examining all products approved over a 12-year period rather those in a single clinical area or via a single regulatory pathway. Unlike other studies,17 we assessed a full array of postmarket safety outcomes that reflect varying levels of severity, not limiting our analyses to market withdrawal and the Boxed Warning section of the label. Our analysis is not, however, a measure of the benefit-risk profile of any product, nor does it account for any changes in the benefit-risk profile of a product over time. The study does not enable us to determine if the use of safety surrogate markers could enable a reduction in size of the safety population without compromising clinical safety or if improvements in safety data collection and better analytical methods could lead to smaller safety population requirements. We were not able to assess the impact of individual indications on the development of safety outcomes because the number of products within an indication was generally small. Because our data did not include measures of postmarket drug utilization, we could not assess the influence of this factor on the number or timing of postmarket safety issues. Additionally, our data cannot measure the efficiency of identification of safety issues during clinical development or after approval.
In the context of contemporary clinical development programs, there is wide variability in the size of the safety population, which is likely explained by many product-specific factors. This variability generally does not lead to an increase in postmarket safety outcomes.
Supplementary Material
Study Highlights:
• What is the current knowledge on the topic?
The FDA bases approval on adequate and well-controlled studies, with the number of patients studied generally driven by efficacy considerations and adequate exposure to examine safety and tolerability. However, the relationship between the number of patients studied in drug development programs and the identification of new safety issues after approval is not well understood.
• What question did this study address?
Is the number of patients studied prior to FDA approval of New Molecular Entities (NMEs) and New Therapeutic Biologics (NTBs) associated with postmarket safety outcomes?
• What does this study add to our knowledge?
Smaller premarket safety population size generally does not lead to an increase in postmarket safety outcomes.
• How might this change clinical pharmacology or translational science?
In the context of contemporary clinical development programs, there is wide variability in the size of the safety population, which is likely explained by many product-specific factors. This variability generally does not lead to an increase in postmarket safety outcomes.
Acknowledgement:
SC and IB were supported by appointments to the Research Participation Program at the U.S. Food and Drug Administration Center for Drug Evaluation and Research, administered by the Oak Ridge Institute for Science and Education through an interagency agreement between the U.S. Department of Energy and the U.S. Food and Drug Administration.
Funding:
No funding was received for this work.
Footnotes
Conflict of Interest: The authors declared no competing interests for this work.
This project meets the definition of a Public Health Surveillance activity described in 45 CFR 46.102(l)(2) and is deemed not to be research under the 2018 Requirements of the Common Rule.
FDA Disclaimer: The opinions expressed in this manuscript are those of the authors and should not be interpreted as the position of the U.S. Food and Drug Administration.
Publisher's Disclaimer: Disclaimers: This manuscript includes analyses of publicly available data on CDER-regulated new molecular entity and new biologic approvals (October 2002-December 2014). The analyzed dataset is a high-level compilation of existing, publicly available data from FDA’s internal databases and document records, and to the best of our knowledge reflects the state of each application at the time of initial regulatory approval. For additional or more detailed information about an application (e.g., FDA-approved conditions of use, approval letters), consider reviewing information available on Drugs@FDA.
References
- 1.Code of Federal Regulations. §21–314.126.Title 21 ,Chapter I , Subchapter D--Drugs For Human Use.PART 314 -- Applications For FDA Approval To Market A New Drug. Subpart D--FDA Action on Applications and Abbreviated Applications. D.O.H.A.H. SERVICES, Editor. [Google Scholar]
- 2.International Conference on Harmonisation (ICH). The Extent of Population Exposure to Assess Clinical Safety: For Drugs Intended for Long-term Treatment of Non-Life-Threatening Conditions (ICH E1), Available at https://database.ich.org/sites/default/files/E1_Guideline.pdf. Accessed May 4, 2021.
- 3.Beaver JA, Howie LJ, Pelosof L, Kim T, Liu J, Goldberg KB, Sridhara R, Blumenthal GM, Farrell AT, Keegan P, Pazdur R, and Kluetz PG, A 25-Year Experience of US Food and Drug Administration Accelerated Approval of Malignant Hematology and Oncology Drugs and Biologics: A Review. JAMA Oncol. 4(6)849–856 (2018). [DOI] [PubMed] [Google Scholar]
- 4.O’Connell K and Pariser AR, Clinical trial safety population size: analysis of drug approvals for rare and common indications by FDA Center for Drug Evaluation and Research. Expert Opinion on Orphan Drugs. 2(9):869–875 (2014). [Google Scholar]
- 5.Pacurariu AC, Hoeve CE, Arlett P, Genov G, Slattery J, Sturkenboom M, and Straus S, Is patient exposure preapproval and postapproval a determinant of the timing and frequency of occurrence of safety issues? Pharmacoepidemiol Drug Saf. 27(2):168–173 (2018). [DOI] [PubMed] [Google Scholar]
- 6.Mol PG, Arnardottir AH, Motola D, Vrijlandt PJ, Duijnhoven RG, Haaijer-Ruskamp FM, de Graeff PA, Denig P, and Straus SM, Post-approval safety issues with innovative drugs: a European cohort study. Drug Saf. 36(11): 1105–15 (2013). [DOI] [PubMed] [Google Scholar]
- 7.Duijnhoven RG, Straus SM, Raine JM, de Boer A, Hoes AW, and De Bruin ML, Number of patients studied prior to approval of new medicines: a database analysis. PLoS Med, 2013. 10(3):e1001407.(2013). DOI: 10.1371/journal.pmed.1001407 [DOI] [PMC free article] [PubMed] [Google Scholar]
- 8.Drugs@FDA: FDA Approved Drug Products. Available at https://www.accessdata.fda.gov/scripts/cder/daf/. Accessed May 4, 2021.
- 9.Food and Drug Administration - Search Orphan Drug Designations and Approvals. Available at https://www.accessdata.fda.gov/scripts/opdlisting/oopd/. Accessed May 4,2021.
- 10.Food and Drug Administration. PDUFA Legislation and Background. Available at https://www.fda.gov/ForIndustry/UserFees/PrescriptionDrugUserFee/ucm144411.htm. Accessed May 4, 2021.
- 11.WHO Collaborating Centre. ATC/DDD Index 2020. Available from: https://www.whocc.no/atc_ddd_index/. Last updated: December 16, 2019.
- 12.Food and Drug Administration. Guidance for Industry Expedited Programs for Serious Conditions – Drugs and Biologics. May 2014. . Availale at https://www.fda.gov/regulatory-information/search-fda-guidance-documents/expedited-programs-serious-conditions-drugs-and-biologics. Accessed May 4, 2021.
- 13.Zhang AD, Puthumana J, Downing NS, Shah ND, Krumholz HM, and Ross JS, Assessment of Clinical Trials Supporting US Food and Drug Administration Approval of Novel Therapeutic Agents, 1995–2017. JAMA Netw Open. 3(4): e203284 (2020). DOI: 10.1001/jamanetworkopen.2020.3284. [DOI] [PMC free article] [PubMed] [Google Scholar]
- 14.Downing NS, Shah ND, Aminawung JA, Pease AM, Zeitoun J -D., Krumholz, H.M., and J. S. Ross. Postmarket safety events among novel therapeutics approved by the US Food and Drug Administration between 2001 and 2010. JAMA. 317:1854–1863 (2017). [DOI] [PMC free article] [PubMed] [Google Scholar]
- 15.Bulatao I, Pinnow E, Cherkaoui S, Kalaria M, Brajovic S, and Dal Pan G, Postmarketing safety‐related-regulatory actions for new therapeutic biologics approved in the U.S. 2002 – 2014: Similarities and differences with new molecular entities. Clin Pharmacol Ther. December;108(6):1243–1253 (2020). [DOI] [PMC free article] [PubMed] [Google Scholar]
- 16.Pinnow E, Amr S, Bentzen SM, Brajovic S, Hungerford L, St George DM, and Dal Pan G, Postmarket Safety Outcomes for New Molecular Entity (NME) Drugs Approved by the Food and Drug Administration Between 2002 and 2014. Clin Pharmacol Ther, 2018. 104(2):390–400 (2018). [DOI] [PubMed] [Google Scholar]
- 17.Wallach JD, Ross JS, and Naci H, The US Food and Drug Administration’s expedited approval programs: Evidentiary standards, regulatory trade-offs, and potential improvements. Clin Trials. 15(3):219–229 (2018). [DOI] [PubMed] [Google Scholar]
- 18.Kim J, Nair A, Keegan P, Beaver JA, Kluetz PG, Pazdur R, Chuk M, and Blumenthal GM, Evaluation of Serious Postmarket Safety Signals Within 2 Years of FDA Approval for New Cancer Drugs. Oncologist. April;25(4):348–354 (2019). [DOI] [PMC free article] [PubMed] [Google Scholar]
- 19.Darrow JJ, Avorn J, Kesselheim AS. FDA Approval and Regulation of Pharmaceuticals, 1983–2018. JAMA January 14;323(2):164–176 (2020). [DOI] [PubMed] [Google Scholar]
- 20.Reed SD, Anstrom KJ, Seils DM, Califf RM, Schulman KA. Use of larger versus smaller drug-safety databases before regulatory approval: the trade-offs. Health Affairs. Sep-Oct;27(5):w360–70. (2008) [DOI] [PubMed] [Google Scholar]
Associated Data
This section collects any data citations, data availability statements, or supplementary materials included in this article.