

Abstract
Vision requires the transport and recycling of the pigment 11-cis retinaldehyde (retinal) between the retinal pigment epithelium (RPE) and photoreceptors. 11-cis retinal is also required for light-mediated photoreceptor death in dark-adapted mouse eye, probably through overstimulation of rod cells adapted for low light. Retbindin is a photoreceptor-specific protein, of unclear function, that is localized between the RPE and the tips of the photoreceptors. Unexpectedly, young Rtbdn-KO mice, with targeted deletion (KO) of retbindin, showed delayed regeneration of retinal function after bleaching and were strongly resistant to light-induced photoreceptor death. Furthermore, bio-layer interferometry binding studies showed recombinant retbindin had significant affinity for retinoids, most notably 11-cis retinal. This suggests that retbindin mediates light damage, probably through a role in transport of 11-cis retinal. In Rtbdn-KO mice, retinal development was normal, as were amplitudes of rod and cone electroretinograms (ERG) up to 4 months, although implicit times and c-waves were affected. However, with aging, both light- and dark-adapted ERG amplitudes declined significantly and photoreceptor outer segments became disordered, However, in contrast to other reports, there was little retinal degeneration or drop in flavin levels. The RPE developed vacuoles and lipid, protein and calcium deposits reminiscent of age-related macular degeneration. Other signs of premature aging included loss of OPN4+ retinal ganglion cells and activation of microglia. Thus, retbindin plays an unexpected role in the mammalian visual cycle, probably as an adaptation for vision in dim light. It mediates light damage in the dark-adapted eye, but also plays a role in light-adapted responses and in long term retinal homeostasis.
Keywords: retina, aging, photoreceptors, retinal pigment epithelium, retinal ganglion cells, light damage
1: Introduction
Retbindin was discovered as part of the NEIBank project for ocular genomics (Wistow, 2002; Wistow et al., 2008) It was found to be retina-specific and surprisingly abundant in human retina (Wistow et al., 2002), although it had no obvious role in retina function. Retbindin transcripts were also found in all other mammalian retinas examined for NEIBank, but not in zebrafish (Vihtelic et al., 2005) or other non-mammalian vertebrates; indeed the gene appears to be mammal-specific It is distantly related to riboflavin-binding shuttle proteins involved in egg development in birds and reptiles (Wistow et al., 2002), but the sequence conservation is limited to key structural residues, particularly those involved in intramolecular disulfide bonds (Monaco, 1997), suggesting that the two families share a common folding topology but are otherwise functionally distinct.
The vertebrate retina, because of its highly specialized role in light detection, has many tissue-specific proteins which evolved for key roles in the visual cycle or in the structure of the photoreceptors. Typically, these proteins are essential for function or for normal development so that mutations in their genes lead to loss of vision, often from early development. Since all vertebrate eyes share a common evolutionary origin, most of these genes are represented across species from fish to mammals and birds. Retbindin, with its evolutionarily restricted distribution, is therefore somewhat unusual in this regard.
Recently, others described a deletion model for retbindin in which an EGFP reporter was substituted for mouse retbindin (Kelley et al., 2017). This showed photoreceptor-specific expression of the reporter and progressive photoreceptor degradation from 4 months. Retbindin protein was found to be secreted and localized to the interphotoreceptor matrix (IPM) (Kelley et al., 2015) and evidence was presented for flavin-binding by recombinant retbindin and for significantly decreased levels of flavins in the retbindin-deleted retina (Kelley et al., 2017; Sinha et al., 2021). These results led to the suggestion that retbindin has an important role in flavin pathways in the retina.
Here we report a different knockout (Rtbdn-KO) model for retbindin based on targeted deletion, with no expression of a reporter gene from the retbindin promoter. This model has a different phenotype from the previously reported reporter substitution model. The new Rtbdn-KO model exhibits age-related loss of visual function but little early loss of photoreceptors and no major difference in flavin levels. The Rtbdn-KO has an interesting RPE phenotype that seems to mimic some important features of aging diseases in humans, including age-related macular degeneration (AMD), a major cause of vision loss in aging human populations, for which better animal models are needed (Fletcher et al., 2014; Pennesi et al., 2012).
Like other neuronal tissues, the retina consists of highly differentiated cell types, many of which must maintain function for years essentially without turnover. Visual function declines with age in mice (Kolesnikov et al., 2010) and humans (Jackson et al., 2006; Messenio et al., 2013), even in the absence of obvious disease, while diseases such as age-related macular degeneration increase with age (Gehrs et al., 2006; Klein, 2007; Zarbin, 2004). Our retbindin KO model shows a number of features of aging, including the presence of deposition of lipids, proteins and minerals along Bruch’s membrane reminiscent of AMD in humans. This suggests that retbindin has a role in maintaining retinal homeostasis in aging mammals and its deletion provides a new mouse model for studies of the aging retina, without concurrent retinal degeneration.
Furthermore, young Rtbdn-KO mice show increased resistance to light-induced retinal damage, suggesting that retbindin also has an unexpected role in the visual cycle. Indeed, binding studies show that recombinant retbindin has a high affinity for the visual pigment 11-cis retinal which is required both for normal vision and for light-induced damage in dark adapted mouse eyes (Organisciak and Vaughan, 2010).
2: Materials and Methods
2.1. Targeted deletion of mouse Rtbdn
Mice in this study were handled according to National Eye Institute Animal Care and Use Committee, Animal Studies Protocol 587. The Rtbdn gene in mouse was inactivated by targeted deletion through homologous recombination (Fig S1). A targeting construct was constructed by ET recombination with a BAC clone covering the entire locus of Rtbdn gene (chr8:84946991–84956603) as described (Muyrers et al., 2004). In this targeting construct, the genomic sequence of 3.142 kb, carrying exons 2, 3 and 4 with introns 2 and 3, was replaced by a neo gene cassette which is flanked by genomic sequences of a left arm (5.137 kb) and a right arm (5.092 kb). Endotoxin-free grade DNA construct was linearized and introduced into mouse R1 ES cells (Nagy et al., 1993) by electroporation, as described (Thomas and Capecchi, 1987). Homologous recombination events in R1 ES cells were screened by long genomic PCR assays with the primer set: forward CAGGAGGAGCGGATGGACCCGCTTAGCCTC (30)/ reverse AGCTAAGGACACATGTGGCATGTGCCTGTC (30) (PCR product=5330bp). Correctly recombined R1 ES clones were expanded and microinjected into recipient blastocyst embryos (129S6/SvEvTac) to produce chimeras. Germline transmissions of the targeted allele were maintained as F1 founders which were crossed to C57Bl6/N for 6 generations, then into C57Bl6/J (Jackson Labs) to remove rd8 (Mattapallil et al., 2012). Subsequently, these mice were also bred back into the 129/S6 background for at least 6 generations for light damage experiments.
2.2. ERG recording
ERGs were recorded using the Diagnosys Espion E3 Electrophysiology System (Diagnosys, Lowell, MA). Mice were dark adapted for 16 hours. After anesthesia by intraperitoneal injection of ketamine (100 mg/kg body weight) and xylazine (6 mg/kg body weight), the pupils of the mouse were dilated with tropicamide (0.5%) and phenylephrine hydrochloride (2.5%), and corneas were anesthetized with proparacaine (1%). Gonak™ Hypromellose Solution, 2.5% (Akorn Inc., Lake Forest, IL) was used to maintain corneal hydration and electrical contact. The ERG was recorded with a gold electrode placed on the center of the cornea, a reference electrode placed in the mouth and the background electrode inserted under the skin near the tail. Body temperature was maintained by placing the mouse on a heated rodent metal platform set at 37 °C (Diagnosys LLC). Light stimulus was provided by attached ColorDome (Diagnosys LLC). For dark-adapted responses, stimulus flash intensity varied from −4.0 to 1 log cd·s/m2 with inter-stimulus interval of 10 to 60 seconds. Light-adapted ERG responses were measured in the presence of a rod-saturating background light. Flash intensity varied from −0.52 to 2 log cd·s/m2 in 6 steps. Measurements are the averages of 20 trials at each intensity. C-wave ERG responses were recorded for 12 seconds post flash with flash intensities ranging from −2 to 3 log cd·s/m2 in 6 steps, with increasing inter-stimulus intervals of 1 to 5 minutes that match with increasing stimulus intensities. Baseline drifting of the c-wave responses was corrected using the Diagnosys ERG software before data analysis.
For measurement of recovery of ERG response after photo bleaching, mice were dark-adapted for 24 hours and standard ERG response (B-wave amplitude) was recorded. After photo bleaching of mice at 5000 cd•s/m2 for 2 min (as time 0), ERG response (B-wave amplitude) was recorded under dark adaption protocol as a function of time after bleaching for 20 minutes at 1-min intervals. B-wave amplitudes were plotted with time as actual amplitudes (in micro volts) or as percentage of response before bleaching. All experiments were done with N>=5 mice with error bars representing the standard derivation of these measurements. The statistical p values were calculated from pair–wise T-test.
2.3. Light and transmission electron microscopy
WT and Rtbdn-KO eyes (three pairs each) were collected at 3- and 12-months under normal illumination. Eyes were marked with a blue tissue dye (Polysciences Inc., Warrington, PA) on the ventral side, removed and placed immediately in fixative (2.5% glutaraldehyde (GA) + 2% paraformaldehyde (PFA) in PBS) on ice. After 60 minutes, the front of the eye was cut open by removing a small piece of the cornea at the center using a dissecting microscope (Zeiss Stemi 2000-C, Carl Zeiss, Thornwood, New York) and micro-scissors. Fixation continued for another 3–4 h at 4°C. Next, the entire cornea except for a small area at the marked ventral side was excised and the lens was removed. Fixation of the remaining eye cup continued for 24 h at 4°C.
Fixed samples were washed and post fixed with 2% OsO4 (Electron Microscopy Sciences (EMS), Hatfield, PA) in PBS (0.3 ml per eye cup in 48 well plates) for two hours on ice in a fume hood. After complete removal of OsO4, the tissues were washed 3 times with deionized water, dehydrated sequentially through 30%, 50%, 70%, 85%, 95%, 100% ethanol and finally propylene oxide. The tissue was infiltrated in a solution of Embed 812, DDSA, NMA, BDMA (40:25:20:2 v/v) (EMS) according to manufacturer’s standard protocol. Tissues were then transferred to a rubber mold filled with fresh embedding medium. Tissues were oriented with the uncut cornea tissue (the ventral side of retina) positioned at the bottom to ensure proper dorsal-ventral orientation. After hardening completely, 60°C for 36–48 hours, the blocks were trimmed to the optic nerve head (center of retina). Semi-thin (1 mm thickness) and ultrathin (70–90 nm thickness) sections were cut using a histo- or ultra-diamond knife (Diatome-U.S., Hatfield, PA), respectively.
For light microscopy, the semi-thin sections were stained with the Azure B-Methylene Blue-Toluidine Blue dye mixture (at 0.25% for each dye in 0.25% sodium borate) and imaged with a Zeiss Imager Z1 light microscope (Thornwood, NY). For electron microscopy, the ultra-thin sections were counter stained sequentially with 1% uranyl acetate and 2.7% lead citrate before being imaged with a Joel 1010 Transmission Electron Microscope equipped with an AMT (5 MP) digital camera system (JEOL USA, Peabody, MA).
2.4. RNA-sequencing and data analysis
DNA-free total RNA was prepared from a pool of retinas from 5 Rtbdn-KO and from 5 age-matched C57Bl6/J control mice, using PureLink RNA Mini Kit and TRIzol Reagent (Life Technologies, Carlsbad CA) and on-column DNase treatment with PureLink DNase (Life Technologies) according to manufacturer’s instructions. RNA integrity was evaluated by 2100 Bioanalyzer (Agilent Technologies) with RIN value no less than 7. RNA-seq was performed by NIH Intramural Sequencing Center (Bethesda, MD). One paired end index library from each polyA(+)- selected RNA samples was prepared. Six samples were pooled and loaded on 2 lanes of Illumina HiSeq 2000 Sequencer and run as paired end index 100 base reads to obtain a total of 40 million base read pairs per sample. Quality of RNA-seq data in FASTQ format was accessed by use of FASTQC. Differential mRNA expression between knockout and control mice was quantified by RNA-seq data analysis using the Tuxedo package (i.e. the Tophat-Cufflinks pipeline) on the NIH Biowulf high performance computing platform. Alignment was performed using Tophat version 2.1.1 (Bowtie2) and the mouse10 reference genome (NCBI) with standard parameters. Cufflinks version 2.2.1 was used to assemble the transcriptomes and CuffDiff was used to quantify the levels of gene expression in Reads Per Kilobase of transcript per Million mapped reads (RPKM). The RNAseq data were submitted to NCBI with GEO accession number GSE139980.
2.5. In situ hybridization
To detect mRNA in situ on tissue sections we used RNAScope® (Advanced Cell Diagnostics (ACD) https://acdbio.com) assay reagents. Using mouse Rtbdn probe, Mm-Rtbdn (Cat No. 473651); mouse S-antigen probe, Mm-Sag (Cat No. 405691); and ACD’s standard positive and negative control probes (not shown), and the RNAscope® 2.5 HD Reagent Kit-RED (Cat No: 322350); we followed the manufacturer’s recommended protocol with slight modifications. Starting with thin sections of the retinas from WT and Rtbdn-KO mice, slides were baked for 1 hour at 60°C, followed by a 5min wash in PBS, followed by baking for 30 minutes at 60°C. Baking prior to hybridization helps keep the sections more firmly adhered to the slide. For counterstaining we used methyl green (Vector Laboratories, Cat. No. H-3402) or hematoxylin (Vector Laboratories, Cat. No. H-3502), or a combination of methyl green or hematoxylin and eosin.
2.6. Antibody and immunofluorescence for mouse retbindin
Antibody to mouse retbindin (anti-mRTBDN) was produced by Aldevron (Freiburg, Germany) using GENOVAC Antibody Technology, which uses a DNA vaccine approach, based on the full cDNA sequence of the protein (Brown et al., 2011). Mouse eyes were enucleated and fixed in 4% paraformaldehyde in PBS for 2 hours, cryopreserved with 10%, then 20%, sucrose in PBS for 1 hour each at room temperature. After embedding in Optimal Cutting Temperature (OCT) (Tissue-Tek, Torance, CA) with appropriate orientation to allow cutting of sagittal sections, the eye was cut into 8–10 μm thick sections. Following permeation with 0.5% Triton X-100 in PBS, the sections were blocked with ICC buffer (1x PBS with 0.2% Tween 20, 0.5% BSA, and 0.05% sodium azide) containing 5% bovine serum albumin (BSA) and 1% cold water fish gelatin (Sigma-Aldrich, St Louis MO) for 3 hours at room temperature. The sections were then incubated for 16 hours at 4°C with anti-mRTBDN [3 μg/ml in ICC buffer containing 5% BSA and 1% cold water fish gelatin]. After washing 3x with ICC buffer and 2x with PBS, the sections were labeled with dye-conjugated secondary antibodies (diluted 1:2000) and DAPI [1 μg/ml] (Sigma-Aldrich) in the same buffer as above. Sections were washed 3x with ICC buffer and 3x with PBS, then mounted in Prolong Gold mounting media (Invitrogen, CA) and imaged with Olympus Fluoview 1000 confocal microscope (Olympus, Waltham, MA).
We were not able to confirm loss of retbindin by western blot, since our antibody only works in IF, presumably because it recognizes a three-dimensional epitope of native protein. We have made numerous attempts to identify a reliable antibody for western blot, including several custom peptide antibodies and several from commercial sources. None have been successful, and all appeared to have non-specific activity (not shown).
2.7. Immunofluorescence staining of WT and Rtbdn- KO mouse retina sections for aging markers.
Mouse eyes (2 month and 18 month) were enucleated and fixed in 4% paraformaldehyde in PBS for 2 hours, cryopreserved with 10% followed by 20% sucrose in PBS for 1 hour each. The eyes were embedded in Optimal Cutting Temperature (OCT) (Tissue-Tek, Torance, CA) and cut into 8–10 μm thick sections. Following permeation with 0.2% Triton X-100 in PBS, the sections were blocked with ICC buffer (1x PBS with 0.2% Tween 20, 0.5% BSA, and 0.05% sodium azide) containing10% bovine serum albumin (BSA) for 1 hour at room temperature. Sections were then incubated with primary antibodies EFEMP-1(Fib3) (diluted 1:100) (Century Biochemicals), IBA1 (diluted 1:500) (Wako), rabbit anti-melanopsin/Opn4 (diluted 1:1000)(Advanced Targeting Systems) Biotinylated Peanut Agglutinin (PNA) (diluted 1:200) (Vector Laboratories), Ezrin (diluted 1:200) (ThermoFisher Scientific), and mouse Brn3 (diluted 1:20) (Chemicon-Millipore) overnight at 4 °C. After washing the sections, the primary antibodies were detected with dye-conjugated secondary antibodies and imaged using Zeiss LSM 880 microscope with Airyscan (Zeiss, USA).
2.8. Filipin and Oil Red O labeling for esterified and unesterified cholesterol
Mouse retina sections were stained with Oil Red O using a working solution of 3 parts of Stock Solution to 2 parts of water. The sections were incubated with Oil Red O for 10–20 minutes with continuous rotation. Oil Red O solution was discarded, and the sections were washed 2–5 times with water until no excess stain was seen. Filipin solution was prepared by dissolving 1mg filipin in 200 μl ethanol. The solution was divided into 20 μl aliquots and desiccated under argon. For use a single aliquot was diluted to 0.05 mg/ml in PBS. Diluted filipin was added to each section in the dark at room temperature for 2h. Following filipin labeling, the sections were washed once with PBS and mounted with Prolong Gold (Molecular Probes). Staining was immediately visualized using a FV1000 confocal microscope (Olympus, Waltham, MA).
2.9. Calcium phosphate staining of WT and Rtbdn -KO mouse retina sections
Mouse tissue sections were washed with distilled water prior to staining with Alizarin Red S, 2g in 100 ml distilled water adjusted to pH 4.3 with 10% ammonium hydroxide (Sigma Aldrich). Sections were incubated with Alizarin Red Solution for 2 minutes at room temperature. Excess dye was blotted, and the sections were dehydrated in acetone for 10 seconds and mounted with Prolong Gold + DAPI (Molecular Probes) and imaged using a Zeiss LSM 880 microscope with Airyscan (Zeiss, USA).
2.10. Western blot for melanopsin.
Proteins from WT and Rtbdn-KO retina were extracted using RIPA buffer (Thermo Fisher Scientific, Waltham, MA) (50 mM Tris ⁄ HCl (pH 7.4), 150 mM NaCl, 0.25% deoxycholic acid, 1% NP-40, 1 mM EDTA, and protease inhibitor cocktail (Roche Diagnostics GmbH, Mannheim, Germany)). The protein concentrations were measured using a BCA protein assay kit (ThermoFisher Scientific). After SDS-electrophoresis, the proteins were transferred to poly vinylidene difluoride membrane (PVDF), probed with rabbit anti-melanopsin/Opn4 (diluted 1:1000) (GeneTex, Alton Pkwy Irvine, CA) and incubated overnight in 4°C, followed by HRP-conjugated secondary antibodies (diluted 1:10000) for 1h in dark at room temperature. The membrane was then washed in TBS/T 3 times before scanning using the LumiGold ECL Western Blotting Detection Kit (VerII; Signagen Laboratories, Ijamsville, MD). The blots shown are representative of at least three biological repeats of each experiment. β-actin was used to normalize the signals. The relative signals were quantitated using ImageJ software (version 1.45; National Institutes of Health, Bethesda, MD).
2.11. In situ apoptosis detection assay
The apoptosis detection assay was performed using the in situ Apoptosis Detection Kit (ABCAM, Cambridge, MA). Mouse retina sections were permeabilized in dilute proteinase K [1:100 in distilled water] and incubated at room temperature for 10 minutes. Endogenous peroxidases were deactivated by incubating the sections in 30% H2O2 diluted 1:10 in methanol at room temperature for 5 minutes. The sections were then immersed in TdT equilibration buffer at room temperature for 30 minutes. TdT labeling reaction mix was added, and the sections were immediately moved to a humidified chamber at 22°C for 1.5 hours. The reaction was terminated by adding stop buffer and incubating for 5 minutes at room temperature. The sections were then blocked with the blocking buffer before adding streptavidinhorseradish peroxidase (HRP) conjugated detection reagent and incubating for 30 minutes in a humidified chamber. Fragmented DNA was stained with Diaminobenzidine (DAB) (diluted 1:30) for 15 minutes at room temperature. The sections were rinsed with distilled water and counterstained with Methyl Green solution for 3 minutes. Finally, the slides were dipped in 100% ethanol 2–4 times. Glass coverslips were mounted onto slides with Prolong Gold (Molecular Probes). Apoptosis positive cells were revealed by dark brown DAB precipitate. Quantitative analysis was performed using ImageJ software (version 1.45; National Institutes of Health, Bethesda, MD).
2.12. Rhodopsin labelling of phagocytosed ROS
The anterior chamber was removed from freshly enucleated eyes from 18-month-old WT and Rtbdn-KO mice and the posterior eye cups were fixed in 4% paraformaldehyde for 2 hours at 4 °C and then permeabilized with ice-cold acetone. After blocking in 10% FBS(v/v)/0.5% Triton X-100(v/v) in 1×phosphate buffered saline (PBS), RPE flat mounts were incubated with rhodopsin antibody, to recognize ROS, and ZO-1 (diluted 1:100)(Abcam, Cambridge, MA) overnight at 4 °C, followed by incubation with secondary antibodies conjugated to FITC or Alexa 564 (Thermo Fisher Scientific). Nuclei were counterstained with DAPI (Life Technologies). Confocal images (z-stacks, 0.3 μm steps, 30 μm in total) were captured in the central part of the RPE, using a Zeiss LSM 880 microscope with Airyscan (Zeiss, USA). The volume occupied by rhodopsin positive outer segments inside individual RPE cells was calculated using ImageJ software (version 1.45; National Institutes of Health, Bethesda, MD). Images were captured from the RPE cells of 6 animals (3 WT and 3 Rtbdn-KO animals) for a total of 12 microscope fields per group (4 images per animal). Quantification was performed using the Mann-Whitney U-test (two-tailed); significance was set to P ≤ 0.05.
2.13. LAPM-2 labeling of late endosomes and lysosomes in WT and Rtbdn-KO RPE
Mouse posterior eye cups were isolated and fixed as described above. After blocking in 5% (v/v) FBS/0.5% (v/v) Triton X-100/1×phosphate buffered saline (PBS) for 1hour at room temperature, RPE flat mounts were incubated with anti-LAMP2 antibody [H4B4] (Abcam Cambridge, MA Ca#ab25631) and ZO-1 (Abcam, Cambridge, MA) 1:100 dilution overnight at 4°C and counterstained and imaged as above. The volume occupied by LAMP2 positive organelles in individual RPE cells was calculated using ImageJ software (version 1.45; National Institutes of Health, Bethesda, MD). Images were captured from the RPE cells of 6 animals (3 WT and 3 Rtbdn-KO animals) for a total of 12 microscope fields per group (4 images per animal). Quantification was performed using the Mann-Whitney U-test (two-tailed); significance was set to P ≤ 0.05.
2.14. Lysotracker-labelling of phagolysosomes
Freshly dissected posterior eyecups were incubated at 37 °C for 15 minutes in DMEM (ThermoFisher) Nuclei were counterstained with DAPI (Life Technologies). To label acidified phagolysosomes compartments, flatmounts of the eye cups were incubated with 0.4 μM LysoTracker Red DND-99 (L7528, Life Technologies) prepared in DMEM growth medium for 15 min at 32 °C. Images were made of both live and fixed tissue. Samples were fixed with 4% PFA for 15 min at room temperature, permeabilized with 0.2% Triton X-100 in PBS-CM for 15 min at room temperature and co-labeled with antibodies and imaged as above.
2.15. Flavonoid quantitation
All steps were performed in a dark room with low red light. After 5–6 days of dark adaptation, 8–9-month old Rtbdn-KO and WT mice were enucleated and the lens squeezed out of the eye after making a cross cut on cornea with micro string scissors. The lenses were removed with minimal loss of vitreous fluid. Each aphakic eyeball was homogenized in 250 μl of 50 mM ammonium acetate buffer (pH5.5, filtered through 0.2 μm membrane filter) in a frosted microfuge tube with a motorized homogenizer and a frosted resin pestle. After complete homogenization, a 25 μl aliquot of the homogenate solution was saved for extraction with 1% Triton X-100 and BCA protein assay and protein quantification. The rest of the sample was heated to 80° C for 5 min, followed by centrifugation at 7000 rpm. The supernatant was transferred to a tube containing 1.6μl 37% HCl to bring pH to 2.0. After vortexing to mix thoroughly and incubating for 5 min at room temperature, the sample was centrifuged at 10,000 rpm for 5 min. The supernatant was transferred to a clean tube and 10 μl of the supernatant was loaded to an HPLC column. RF, FAD, FMN peaks were identified and quantified using standard compounds (Sigma-Aldrich) with known extinction coefficients. The total amounts of riboflavin, flavin adenine dinucleotide (FAD) and flavin mononucleotide (FMN) in picomoles per lens-less eye were calculated. The average measure from 4–6 mouse eyes was plotted. Error bars represent standard deviations. A pair-wise T-test was used for statistical analysis (MS Excel).
2.16. Light induced retinal damage.
Light exposure experiments were performed in standard mouse cages lined with aluminum foil. A 250 watts fluorescent bulb was held 10–20 cm above each cage with a custom-made rack system to provide a light intensity of 10,000 to 15000 lux at the inside bottom of the cage. A maximum of 2 mice per cage were treated at a time to avoid crowding. Knockout mice along with wild type control mice were dark-adapted for 7 days and divided into two groups. One group was untreated and served as the no light control group, and the others were subjected to treatment with 12,000 lux of light for 60 min after both eyes were dilated, under red light, with a mixture of tropicamide (1%) and phenylephrine hydrochloride (10%). After light treatment, the mice were returned to regular housing conditions (12-hour light and 12-hour dark cycles). After two weeks, light induced retinal damage was accessed by in vivo imaging via SD-OCT of the mouse eyes and by light microscopy of plastic sections of retina after H&E staining. Thickness of ONL was measured using images from both the OCT experiment and plastic sections and plotted as a function of the distance from optical nerve head. A pairwise two-tailed T-test was used to compare the ONL thickness of untreated and light-damaged mice.
2.17. Measurement of retinoid and flavin binding affinity.
Binding affinities of retinoids, flavonoids and control compounds to recombinant mouse RTBN protein and control proteins were determined by Bio-Layer Interferometry (BLI) (ForteBio, Fremont, CA) (Kamat and Rafique, 2017; Muller-Esparza et al., 2020). Super streptavidin sensors were used with the standard protocols. The sensors were wetted with PBS for 10 minutes. For protein loading to the sensor, 4μL of biotinylated recombinant protein at a concentration of 0.1 mg/ml were used. For substrate binding, 250 μL of substrate in PBS at concentrations ranging from 1 to 100 μM were used. For water insoluble retinoids such as 11-cis-retinal, the substrate was initially solubilized in DMSO at 1 mM concentration and then diluted to working concentrations (1–10 μM) in PBS with vigorous mixing.
BLItz Pro version 1.3 from ForteBio was used to calculate the kinetic data including the binding affinity constants. Averages from at least three experiments with standard deviations are presented. All proteins used in the binding assay were derivatized with biotin using a biotinylation kit from Pierce (Rockford, lL) with the molar ratio of biotin to protein 20 to 1. Biotinylated proteins were purified by passing the reaction mixture through mini Sephadex de-salting columns twice. Protein concentration was determined using the BCA Protein Assay kit (Pierce, Rockford, IL).
11-cis retinal, more than 95% pure by HPLC and synthesized by Dr. Rosalie Crouch, Department of Ophthalmology, Storm Eye Institute, Medical University of South Carolina, was provided under a contract with National Eye Institute. 11-cis retinol was prepared by reduction of 11-cis retinal with 10x molar excess of sodium borohydride (Sigma-Aldrich, St. Louis, MO) in ethyl alcohol for 30 min at room temperature. After addition of water to the reaction mixture, 11-cis retinol was recovered by extraction of the reaction mixture with hexane. Hexane was removed by evaporation using argon gas. This 11-cis retinol had a yield of 80% and a purity of at least 90%, as estimated by UV spectra.
11-cis retinoic acid was purchased from Santa Cruz Biotechnology (Santa Cruz, CA). 9-cis retinoic acid, 9-cis retinal, all trans retinal, riboflavin (RF), Riboflavin 5′-monophosphate sodium salt hydrate (FMN), Flavin adenine dinucleotide disodium salt hydrate (FAD) and fluorescein were purchased from Sigma-Aldrich.
Recombinant N-terminal His-tagged mouse RTBN (mRTBN) protein was purchased from LSBio (Seattle, WA). Bovine Interphotoreceptor Retinoid Binding Protein (bIRBP) was purified from bovine eyes (Duncan et al., 2006). Biotinylated mouse RTBDN and bovine IRBP were prepared using the Pierce™ Antibody Biotinylation Kit for IP (Thermo Fisher, Grand Island, NY). Proteins (100 μg) and 20-fold molar excess of NHS-PEG4-biotin were mixed in 200 μl of PBS. The solution was incubated at room temperature for 30 minutes. The biotinylated mouse RTBDN and bovine IRBP were purified by passing the reaction mixture through a desalting spin column twice. Purified biotinylated proteins, if used immediately for the binding assays, can be stored at 4 °C for up to 3 days. As controls for non-specific binding, two proteins of similar size to retbindin, mouse γS-crystallin (Chaturvedi et al., 2019) and chicken lysozyme (Sigma Aldrich) were similarly prepared and also tested for retinoid binding, showing no association (Fig S2).
2.18. Homology Modelling
Molecular modeling of the binding domain of mouse retbindin was done with free online Rosetta server, Robetta (https://robetta.bakerlab.org/). The structure was modeled from chicken riboflavin binding protein (Monaco, 1997). Residues 56–198 of chRBP were aligned with residues 80–113 of mouse retbindin. Conserved disulfide bonds were constrained.
3. Results
3.1. Deletion of mouse Rtbdn
Conventional homologous recombination methods were used to delete the coding exons of Rtbdn in ES cells (Supp Fig1). Recombined cells were injected into 129S6/SvEvTac recipients and positive F1 founders were bred into C57Bl6/N for 6 generations. When it was revealed that this strain was positive for the rd8 mutation (Mattapallil et al., 2012), the mice were additionally bred into C57Bl6/J to remove the retinal degeneration allele. Subsequently, these mice were bred back into the 129/S6 background for light damage experiments. Detailed descriptions of Rtbdn-KO phenotypes presented here are for the C57Bl6/J background. Similar results were also obtained for 129/S6.
Loss of retbindin expression was confirmed by “virtual northern” through RNASeq of pooled retinas (n=5) from 3-month wild type (WT) and knockout (Rtbdn-KO) mice. No significant effects on expression of genes of other genes from visual or metabolic pathways were evident, but Rtbdn was reduced to background levels (Supp Fig S3). The deletion of Rtbdn was also confirmed using in situ hybridization of adult WT and Rtbdn-KO retina. Retbindin mRNA was detected in photoreceptors in WT mouse but was absent from the Rtbdn-KO (Fig1A). As a control, ISH was performed for mouse S-antigen, which labelled photoreceptors in both WT and Rtbdn-KO. The antibody to full-length mouse retbindin, produced using DNA vaccine technology, was used for immunofluorescence labelling (IF) (Fig 1B) and detected native retbindin only in WT mice. The protein was localized to the interphotoreceptor matrix (IPM), between the tips of the photoreceptor outer segments and the retinal pigment epithelium (RPE). This localization accords with other observations (Kelley et al., 2015). No protein was detected in any other part of the retina in WT. We also compared retbindin localization in WT with that of another IPM protein, IRBP, but found little overlap, IRBP having a broader distribution along the outer segments (Supp Fig S4).
Figure 1: Expression of retbindin in wild type retina and its absence in the knockout mouse.
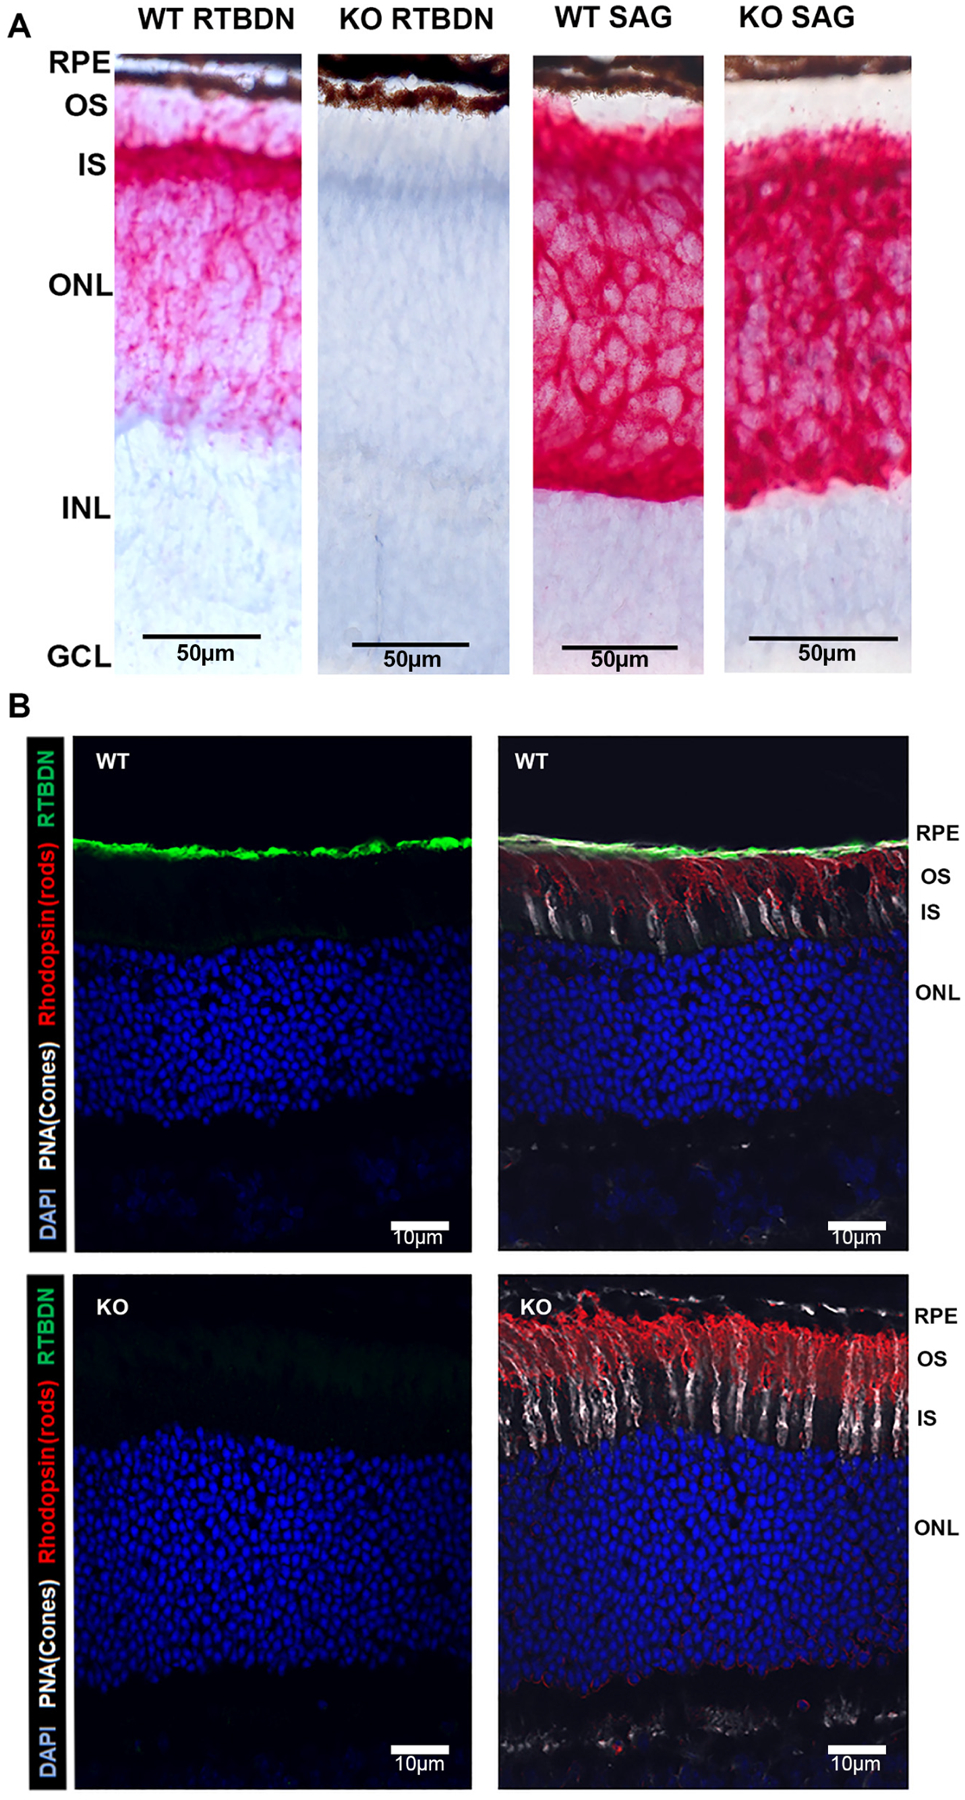
A: In situ hybridization (ISH) shows intense labelling for retbindin (RTBDN) in adult (3mo) photoreceptors in wild type (WT), mainly inner segments. Signal is absent in Rtbdn-KO (KO). ISH for S-antigen in WT and Rtbdn-KO shows similar labelling in photoreceptors. RPE: retinal pigment epithelium; OS: photoreceptor outer segments; IS: photoreceptor inner segments; ONL: outer nuclear layer (photoreceptor nuclei); INL: inner nuclear layer; GCL: ganglion cells layer. ISH signal is red, blue counter stain is hematoxylin. Scale bars represent 50μm.
B: Immunofluorescence (IF) of WT adult retina shows intense labelling for retbindin in the interphotoreceptor matrix (IPM) between tips of photoreceptors and RPE and absence of retbindin in the KO. Green: retbindin; red: opsin (rod marker); white: PNA (cone marker): blue: DAPI (nuclei). Panels on the left show label for DAPI and retbindin only. Scale bars represent 10μm.
3.2. Histology
Light microscopy of semi-thin sections showed that retina development in the Rtbdn-KO mice was normal, and in young adults aged 3 months there was no obvious difference in retinal morphology between WT and Rtbdn-KO (Fig 2A). Transmission electron microscopy (Fig 2B) confirmed this similarity with no obvious defects in OS, ONL, GCL or RPE.
Figure 2: Age related histological defects in the Rtbdn-KO retina.
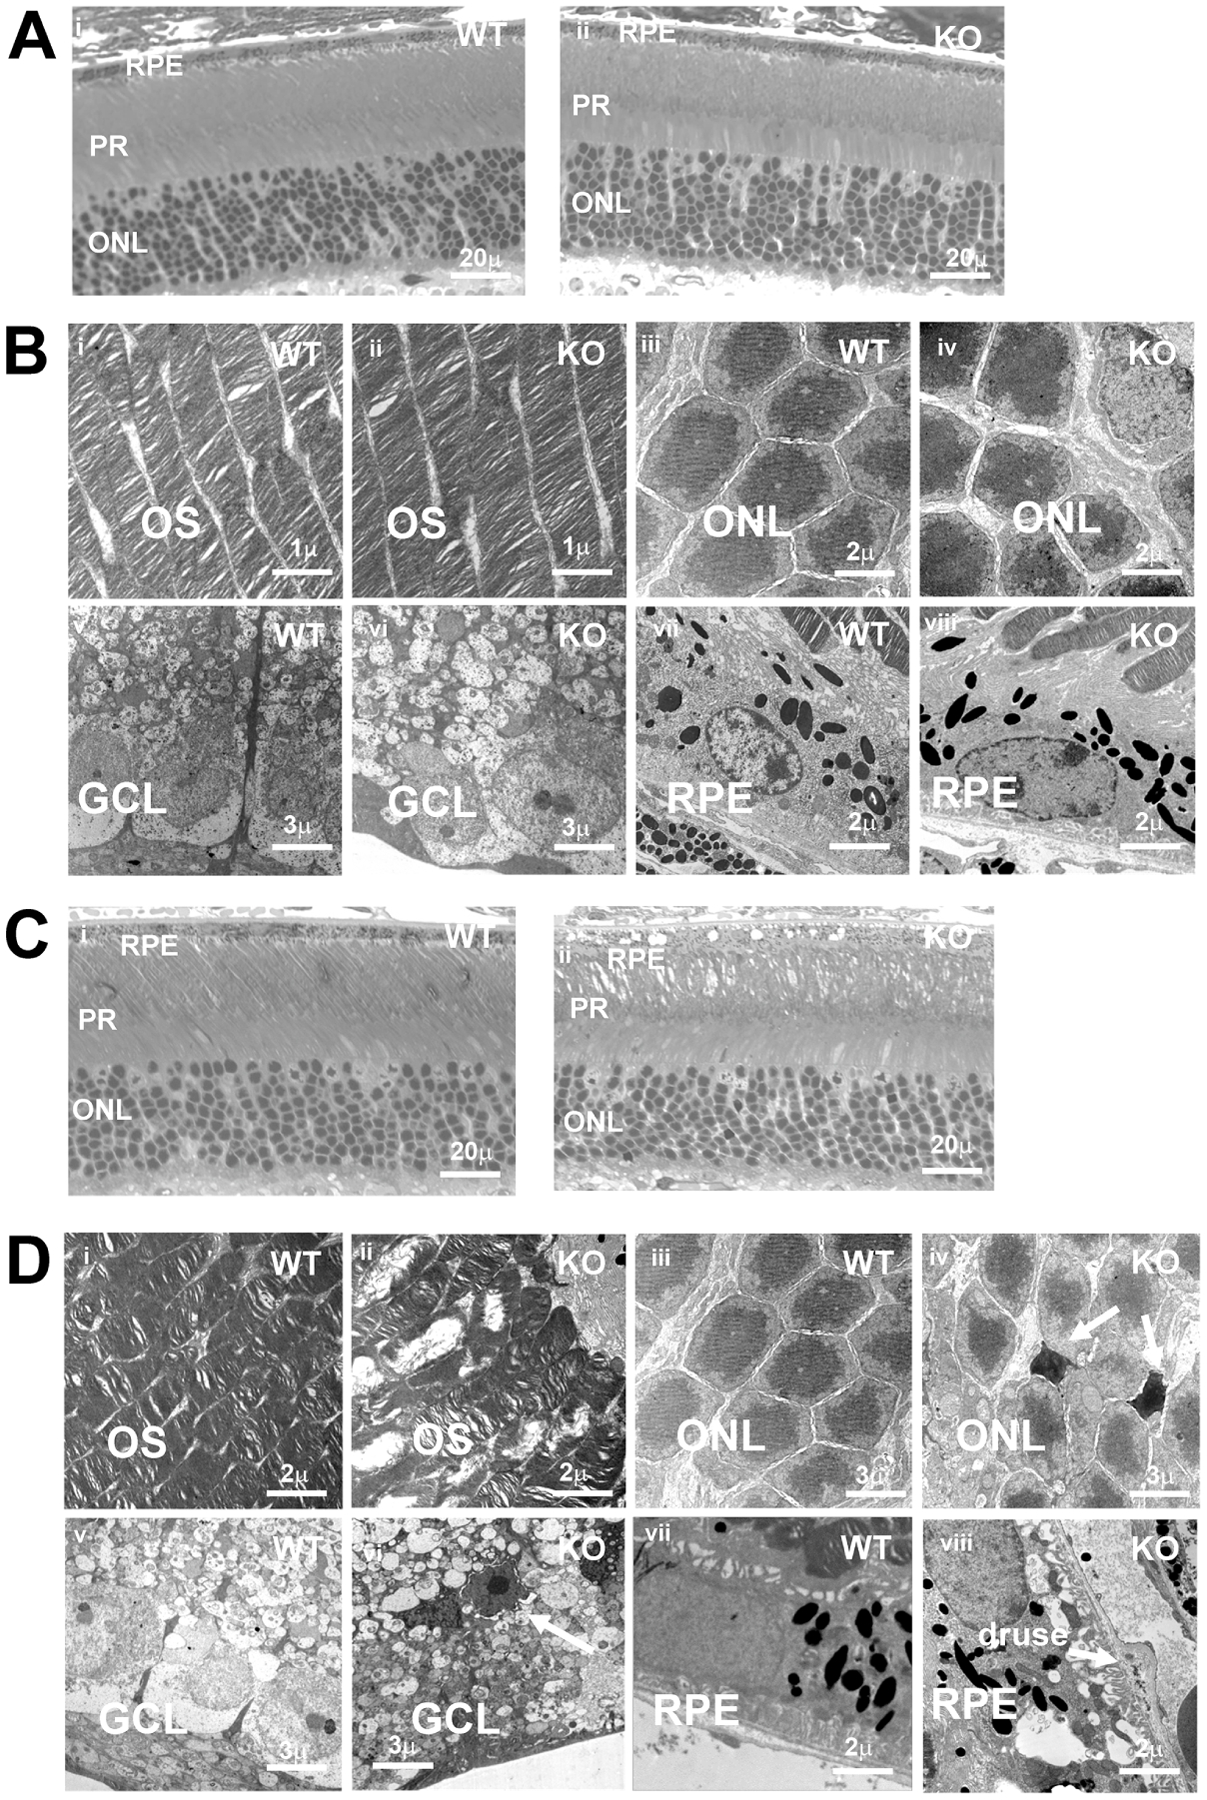
A: Light microscopy of semi-thin sections shows normal appearance of retina aged 3 months in both WT and Rtbdn-KO. Scale bars: 20μm
B: TEM of 3-month WT and Rtbdn-KO retina. OS: outer segments; ONL: outer nuclear layer; GCL: ganglion cell layer; RPE: retinal pigment epithelium. Scale bars as indicated.
C: Light microscopy of semi-thin sections of WT and Rtbdn-KO shows OS and RPE differences at 12 months. Scale bars: 20μm
D: TEM of 12-month WT and Rtbdn-KO retina. OS: outer segments; ONL: outer nuclear layer; GCL: ganglion cell layer; RPE: retinal pigment epithelium. Results show OS disorganization; isolated cell death in GCL and ONL; formation of vacuoles and deposits in REP and at Bruch’s membrane, including apparent drusen. Scale bars as indicated
However, at 12 months there were obvious differences between WT and Rtbdn-KO. Even by light microscopy, there was evident disorder in the outer retina (Fig 2C). The thickness and appearance of the ONL in the Rtbdn-KO were fairly similar to aged-matched WT, with no evidence for the widespread photoreceptor death reported in another model (Kelley et al., 2017). However, although OS lengths were similar to WT, alignment and packing of OS in Rtbdn-KO appeared disordered. In addition, the RPE showed distinct swelling and vacuolization. In the inner retina, patches of the ganglion cell layer (GCL) also showed abnormalities including vacuole formation.
These differences were confirmed by TEM comparisons of WT and Rtbdn-KO at 12 months (Fig 2D). Abnormalities in OS included disruption of disc structure (Fig 2Di, ii). Similar disorganization of discs, albeit at a younger age (15 weeks) also occurs in mice that are null for RPE65, which lack regeneration of 11-cis retinal (Redmond et al., 1998). Although there was no large-scale loss of either photoreceptors or ganglion cells, isolated condensed nuclei from dead cells were seen in both ONL (Fig 2Diii, iv) and retinal ganglion cell layers (GCL) (Fig 2Dv, vi) in old Rtbdn-KO mice. RPE cells were swollen with many large vacuoles throughout the cells, many contained what appeared to be OS disc debris (Fig 2Dvii, viii). Bruch’s membrane (BrM) was thickened and contained large basal deposits in some places that resembled drusen in the aging human eye (Fig 2Dviii)). These drusen had complex internal structures, similar to the soft drusen that are associated with AMD rather than the more common, roughly spherical hard drusen (see for example (Wyatt et al., 2013)).
3.3. Lysosomes
The defects seen in OS disc structure and RPE led us to examine lysosomes and phagosomes in flat mounts of WT and Rtbdn-KO retina at 18 months. As shown in Fig S5A–C, there was a small decrease in labelling for rhodopsin from phagocytosed discs in the Rtbdn-KO relative to WT. However, markers for lysosomes and acidified lysosomes/phagosomes were significantly reduced in Rtbdn-KO retina (Fig S5D–H), suggesting that phagocytotic activity is not normal in the aged Rtbdn-KO retina.
3.4. Expression of markers for aging and disease
In view of the age-related morphological changes in the retinas of the Rtbdn-KO mice, IF was used to examine the expression of markers particularly associated with AMD (Fig 3). EFEMP1/Fibulin 3 (Fib3) shows characteristic patterns of deposition in both wet and dry AMD and in serum-deprived ARPE-19 cells (Marmorstein et al., 2002; Rajapakse et al., 2017; Wyatt et al., 2013). Even at 4 months, the Rtbdn-KO retina showed extensive deposition of Fib3 along Bruch’s membrane and in the choroid, while no similar labelling was seen in WT control even at 18 months (Fig 3A). Another feature of human AMD is deposition of lipid-rich deposits (Curcio et al., 2011; Rajapakse et al., 2017; Wyatt et al., 2013) containing both esterified cholesterol (EC) and unesterified cholesterol (UC). At 2.5 months, both WT and Rtbdn-KO showed patchy deposits of UC along BrM, with EC mainly on the apical side of the RPE (Fig 3B). At 18 months, WT and Rtbdn-KO were different. In the Rtbdn-KO there was increased disposition of UC along the markedly thickened BrM, with little staining for EC in the RPE. In contrast, WT showed more discrete UC deposition along BrM but elevated levels of EC in RPE as well as on both sides of BrM (Fig. 3B). This is reminiscent of the pattern seen in our cell culture model, in which serum-deprived ARPE-19 cells showed increased deposition of UC, while cells in serum instead showed higher levels of EC (Rajapakse et al., 2017).
Figure 3: Increased expression of age and disease related markers in aged KO retina.
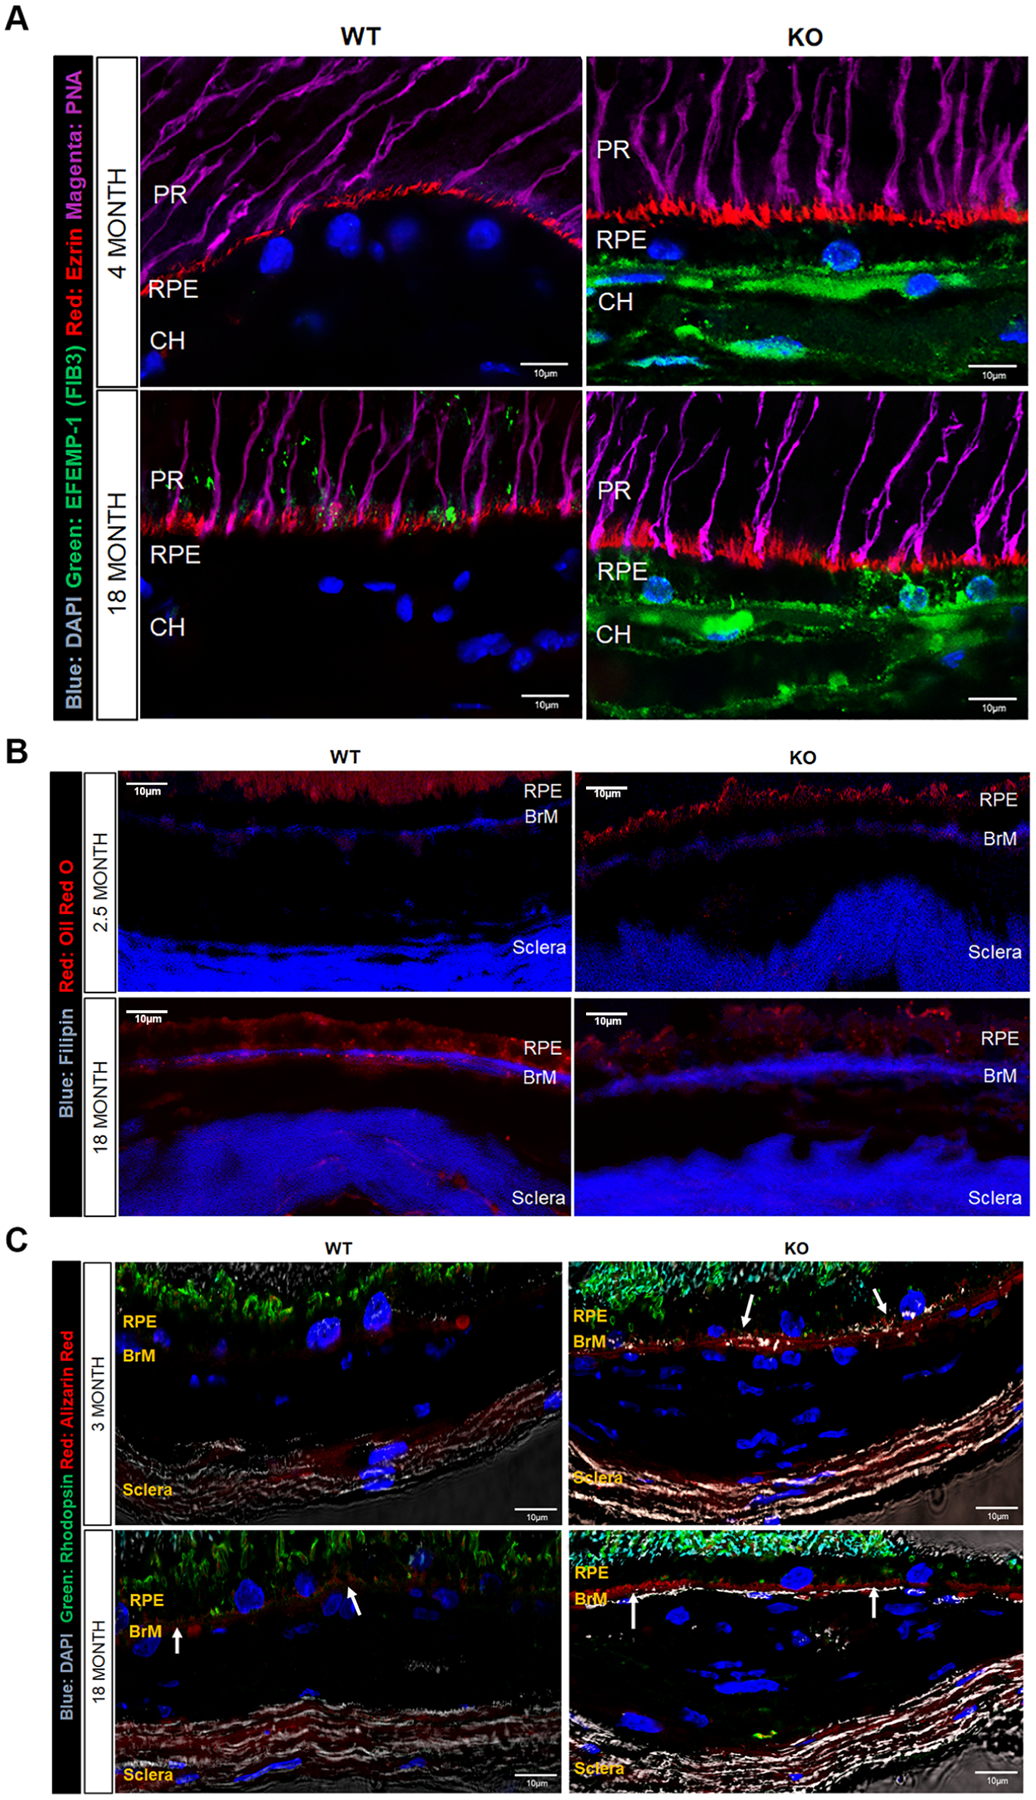
A: Increased deposition of EFEMP1/Fibulin3 at BrM and in choroid in 4- and 18-month WT and Rtbdn-KO retina.
EFEMP-1 (green), Ezrin (red), PNA- cones (magenta), DAPI nuclei (blue).
B: Rtbdn-KO shows increased UC and decreased EC deposition at BrM compared with WT. Oil red O (red), Filipin (blue).
C: Increased calcification at BrM in 3- and 18-month Rtbdn-KO retina compare to 3- and 18-month WT retina.
Rhodopsin (green), Alizarin Red- calcium phosphate (red), DAPI nuclei (blue).
AMD is also associated with calcification and formation of hydroxyapatite (HAP) deposits along BrM (Pilgrim et al., 2017; Thompson et al., 2015). In WT retina at 3 months, there was little evidence for calcium deposition in RPE or BrM, while in Rtbdn-KO at the same age there was already strong alizarin red staining for calcium deposits/HAP along BrM. By 18 months, staining along BrM increased slightly in WT but was much more intense in Rtbdn-KO (Fig 3C).
3.5. Cell death and activation of microglia
As described, although OS became disorganized in older Rtbdn-KO mice, there was little evidence for any large-scale retinal degeneration. However, since TEM showed isolated cell death in the ONL and in the GCL, retinas of WT and Rtbdn-KO mice were examined for apoptosis at 3 and 18 months by TUNEL (Fig 4A). There was no evidence for apoptosis in the 3-month WT retina, but at the same age the Rtbdn-KO retina had some apoptotic nuclei in the GCL. By 18 months, WT resembled the 3-month Rtbdn-KO, with evidence of apoptosis in the GCL. For the Rtbdn-KO, apoptosis was detected in GCL, INL and ONL.
Figure 4: Increased cell death, activation of microglia and loss of ipRGCs in Rtbdn-KO.
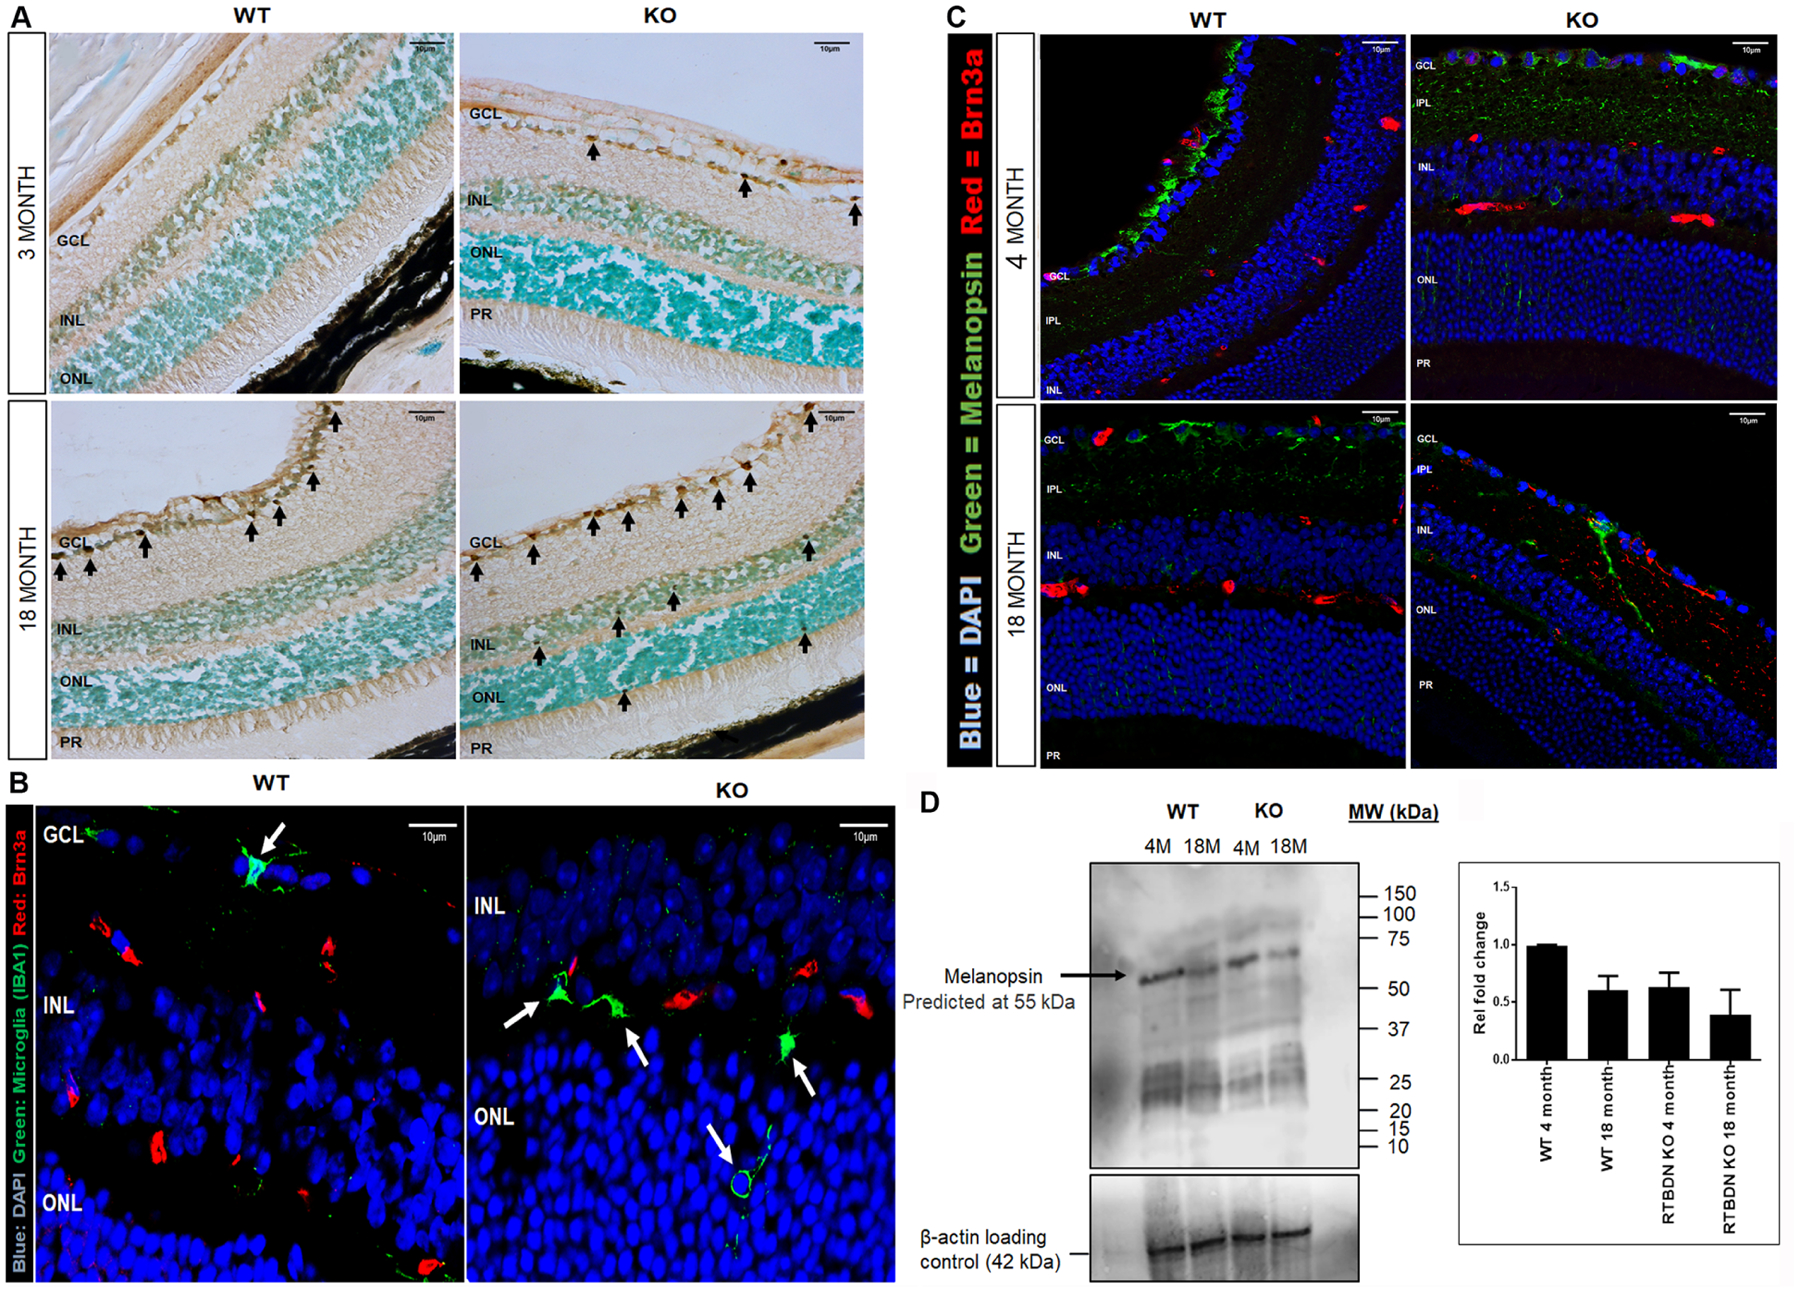
A: TUNEL assay showing increased apoptosis of retina cells especially in GCL in 3- and 18-month Rtbdn-KO compared to 3- and 18-month WT. Black arrows indicate apoptotic cells.
B: Immunofluorescence showing activated microglia in ONL and GCL in Rtbdn-KO retina compare to WT retina. White arrows indicate microglia. IBA1 microglia (green), Brn3a (red), DAPI nuclei (blue).
C: Immunofluorescence showing premature decrease in OPN4+ RGCs in Rtbdn-KO retina compared to WT. Melanopsin (green), Brn3a (red), DAPI nuclei (blue).
D. Western blot showing decrease in OPN4 in 4- and 18-month Rtbdn-KO retinas compared to 4- and 18-month WT retinas. Bands were detected for OPN4 at 55 KDa and β-actin at 42 KDa. Blots are representative of n = 3. P < 0.001. One-way ANOVA followed by Tukey’s multiple comparison test.
Cell death in the aging and diseased retina may be associated with activation of microglia, the immune cells of the retina (Li et al., 2015; Rathnasamy et al., 2019). IF of Rtbdn-KO retinas using antibody to IBA1, a marker for activated microglia, showed isolated microglia in the GCL, INL and ONL, including an example of a microglial cell engulfing an ONL nucleus (Fig 4B).
Retinal ganglion cells are a heterogenous population of differentiated types, including intrinsically photosensitive retinal ganglion cells, ipRGC which express the opsin family member melanopsin (OPN4) (Fu et al., 2005). These cells are implicated in light entrainment of circadian rhythms and they decline with age (Esquiva et al., 2017). Comparison of WT and Rtbdn-KO retinas at 3 months and 18 months showed that the number of melanopsin positive cells and levels of melanopsin protein declined with age in WT (Fig 4C–D). In Rtbdn-KO retina, melanopsin labelling was already at lower levels by 4 months, suggesting that deletion of retbindin leads to an ipRGC phenotype similar to premature aging. Interestingly, Rpe65 KO mice also have fewer melanopsin-positive ipRGCs than WT controls (Doyle et al., 2006). These results suggest that retbindin may have a function related to the visual cycle, in which RPE65 is a key enzyme.
3.6. Visual Function
Mice were examined by ERG at ages of 4, 6, 8, 12 and 16 months (Fig 5). At 4 months, there was no difference in visual response between WT and Rtbdn-KO mice, consistent with the normal histology seen at this age. By 6 months, there appeared to be a slight decrease in the amplitude of dark adapted (rod) a- and b-wave responses in the Rtbdn-KO relative to WT (Fig 5A, B). This deficit increased over time; by 16 months, the responses were only one-third that of WT. Light adapted responses (mostly from cones) were quite similar between WT and Rtbdn-KO up to 6 months but fell significantly in the Rtbdn-KO at up to 16 months, relative to WT (Fig 5C).
Figure 5: Age-related loss of visual function in the Rtbdn-KO retina by ERG.
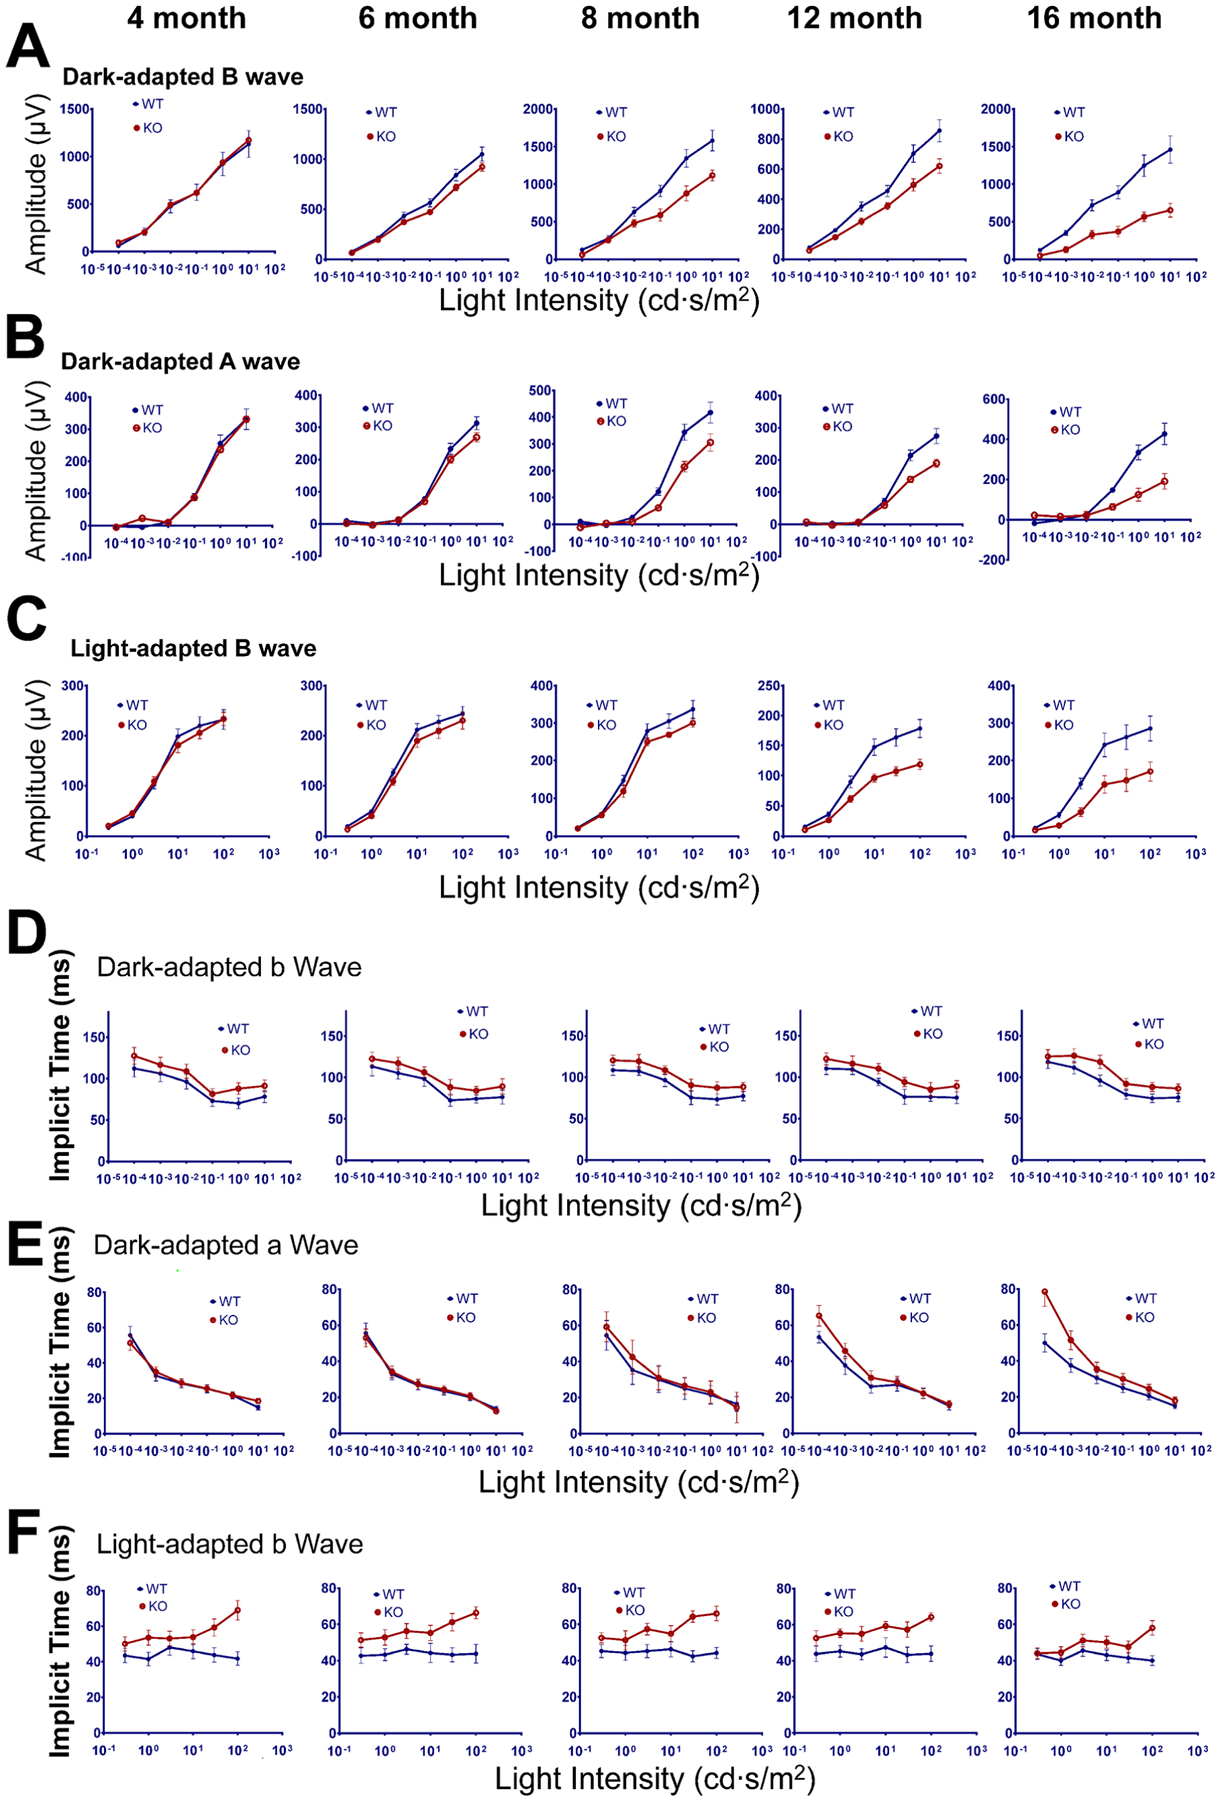
Amplitudes and implicit times of ERG responses for dark and light adapted mice at 4, 6, 8, 12 and 16 months. WT blue; Rtbdn-KO red. A) Amplitudes for dark adapted b-wave; B) amplitudes for dark adapted a-waves; C) amplitudes for light adapted b-waves. Implicit times of ERG responses from the same mice at various ages (4, 6, 8, 12 and 16 months) as in A–C were plotted against light intensity for dark-adapted b-wave, dark-adapted a-wave (D) and light-adapted b-wave (E). Error bars represent means ± the standard deviations (N=5–10 mice).
Measurement of implicit times (IT) for ERG response, a measure of photoreceptor sensitivity (Hood and Birch, 1992), also showed significant differences. Dark adapted b-wave IT was slightly slower in Rtbdn-KO at all ages (Fig 5D). IT for dark adapted a-wave in the Rtbdn-KO was identical up to 6 months, then showed slowing relative to WT (Fig 5E). IT for light adapted b-wave were slower than WT at all ages. Prolonged IT has been noted in aging and in human disease states including AMD and diabetic retinopathy (Safi et al., 2018; Yavas et al., 2014).
In addition, c-waves, which are dependent on RPE, were weaker in Rtbdn-KO than WT in both young (3 month) and old (18 month) mice (Fig 6A, B). These data suggest that there is an age-dependent loss of visual function as a result of Rtbdn deletion, although some deficits are already apparent at 3 months. The early effects on c-waves are consistent with the observed localization of retbindin between OS and RPE (Fig 1). Most notably, even in young animals, both dark- and light-adapted Rtbdn-KO mice showed significantly slower regeneration times in bleaching experiments (Fig 6C, D). This suggests that retbindin has a role related to the visual cycle.
Figure 6: Changes in RPE-related ERG c-wave and in recovery of ERG response after bleaching in Rtbdn-KO mice.
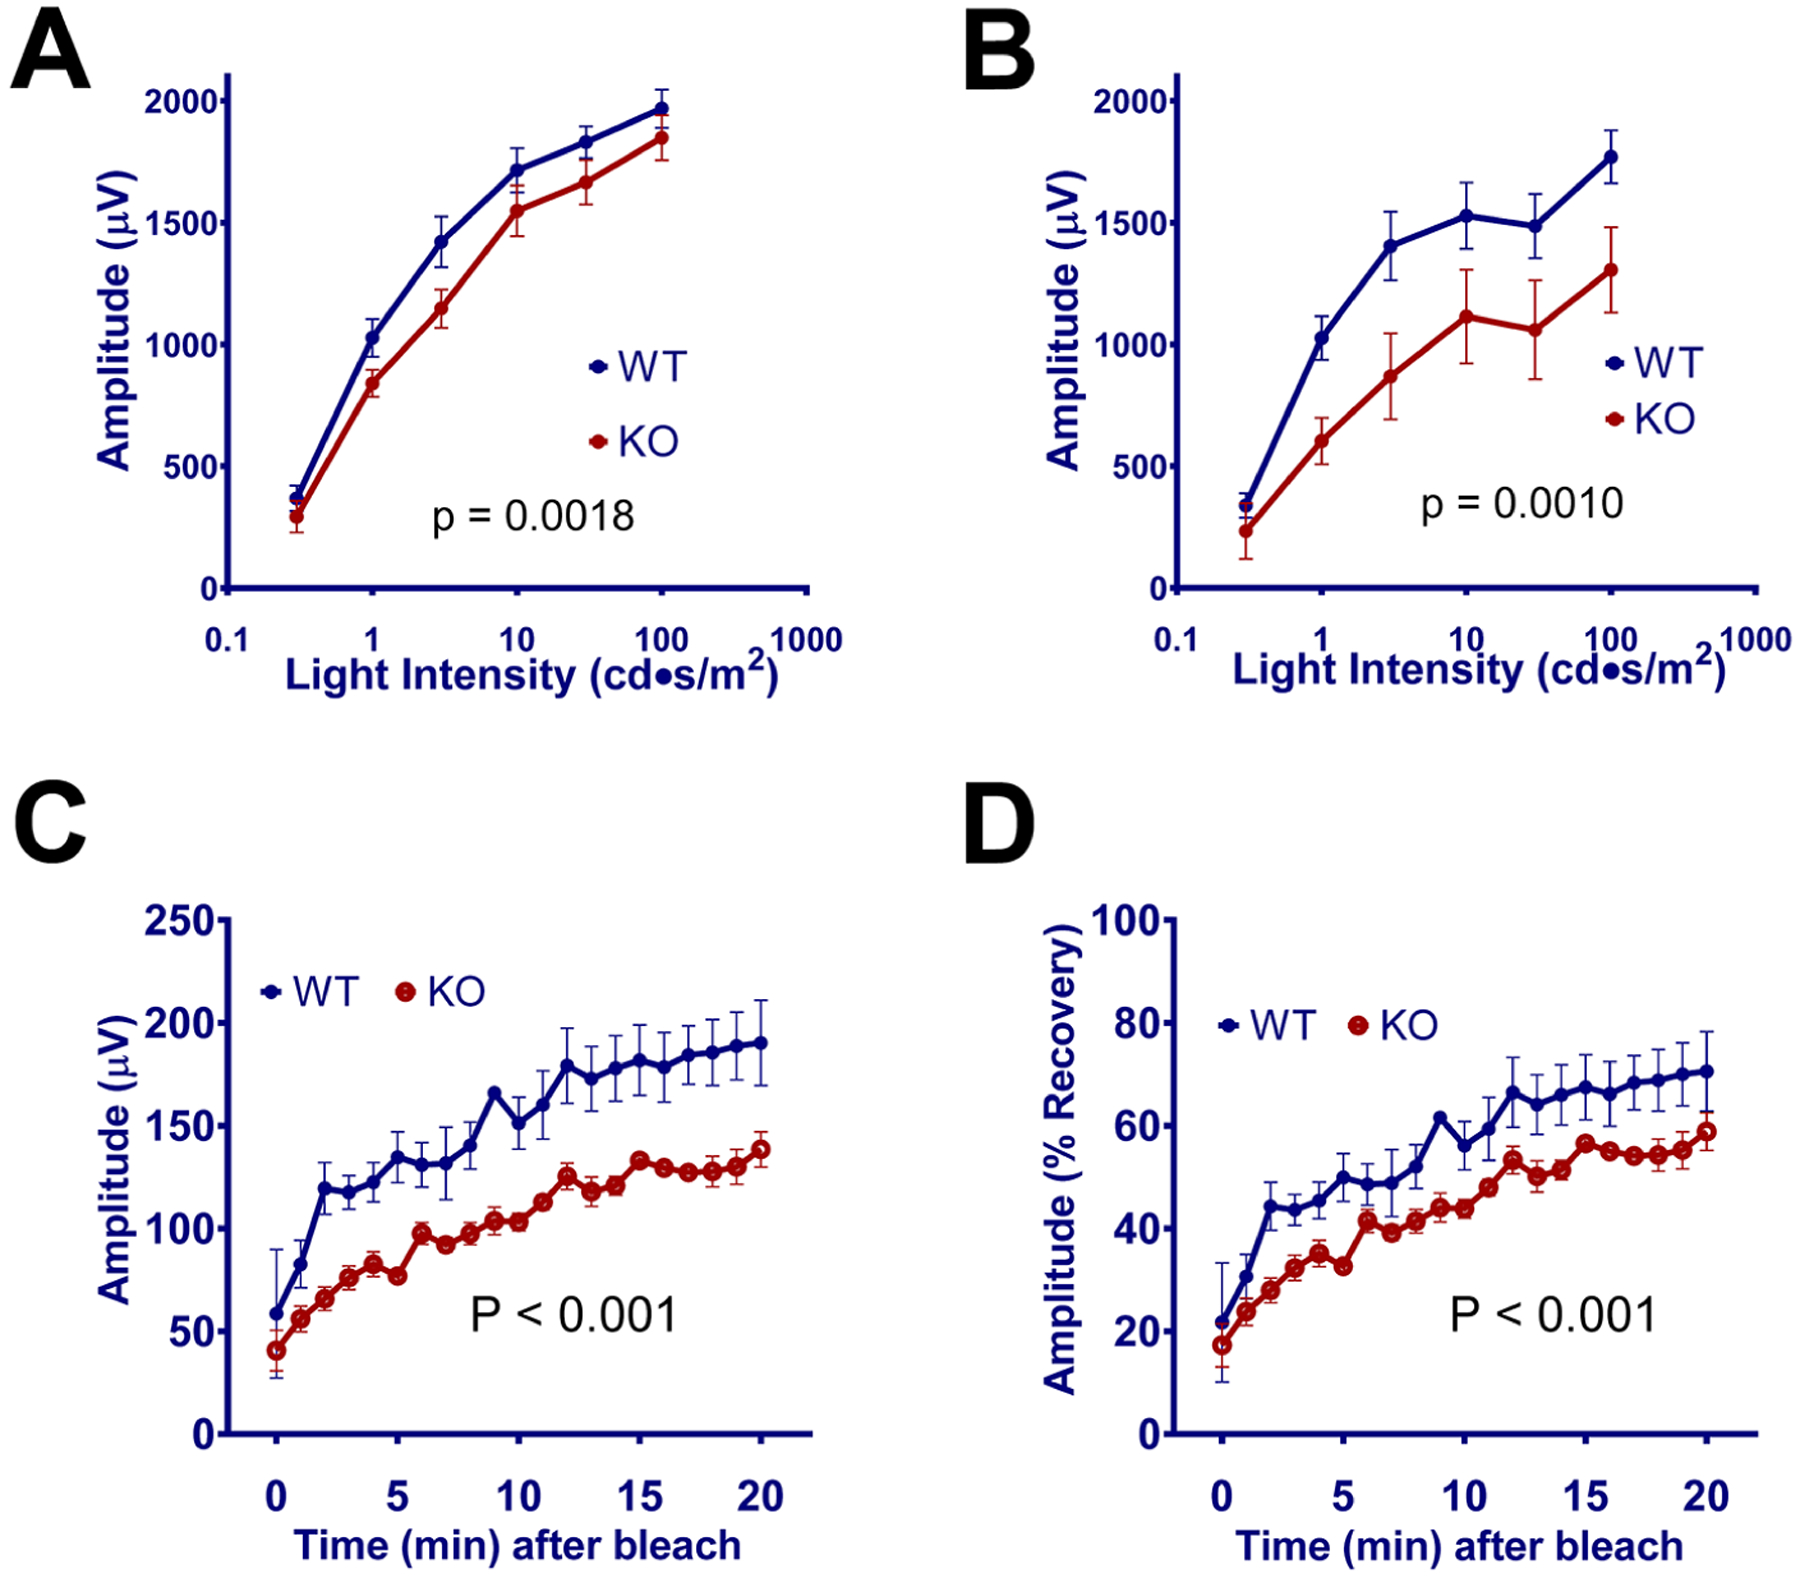
Amplitudes for ERG c-waves in A) 3-month and B) 18-month WT (blue) and Rtbdn-KO mice (red). Decreased amplitudes were seen even in young Rtbdn-KO mice, suggesting deficits related to RPE. This became more pronounced in old mice. Recovery of ERG response (B-wave amplitude) in young (2-month-old) was measured as a function of time after bleaching and shown as actual amplitude (C) or as percentage of the amplitude (D) measured immediately before bleaching. N>=5.
3.7. Light-induced retinal damage.
In dark-adapted mice with a normal visual cycle, exposure to light causes photoreceptor death dependent on 11-cis retinal, with damage spreading from the tip of the outer segments to the ONL (Organisciak and Vaughan, 2010). The popular C57Bl6/J strain is resistant to light-damage because it has a mutation in the RPE65 gene which leads to somewhat deficient levels of 11-cis retinal. Since retbindin is localized at the tips of the photoreceptors, a role in 11-cis retinal transport was possible. To check this, mice were bred onto the 129/S6 background, which is susceptible to light damage. WT and Rtbdn-KO mice also on the 129/S6 background were compared for susceptibility to light-induced damage. Dark adapted animals were exposed to light and monitored by OCT (Fig 7A). As expected, two weeks after light-exposure, WT mice showed significant loss of photoreceptors, with decreased thickness of both ONL and OS, while the Rtbdn-KO mice under the same conditions showed no evidence of damage. Histology of plastic sections of retina confirmed this result (Figure 7B).
Figure 7. Deletion of retbindin protects against light induced retinal damage.
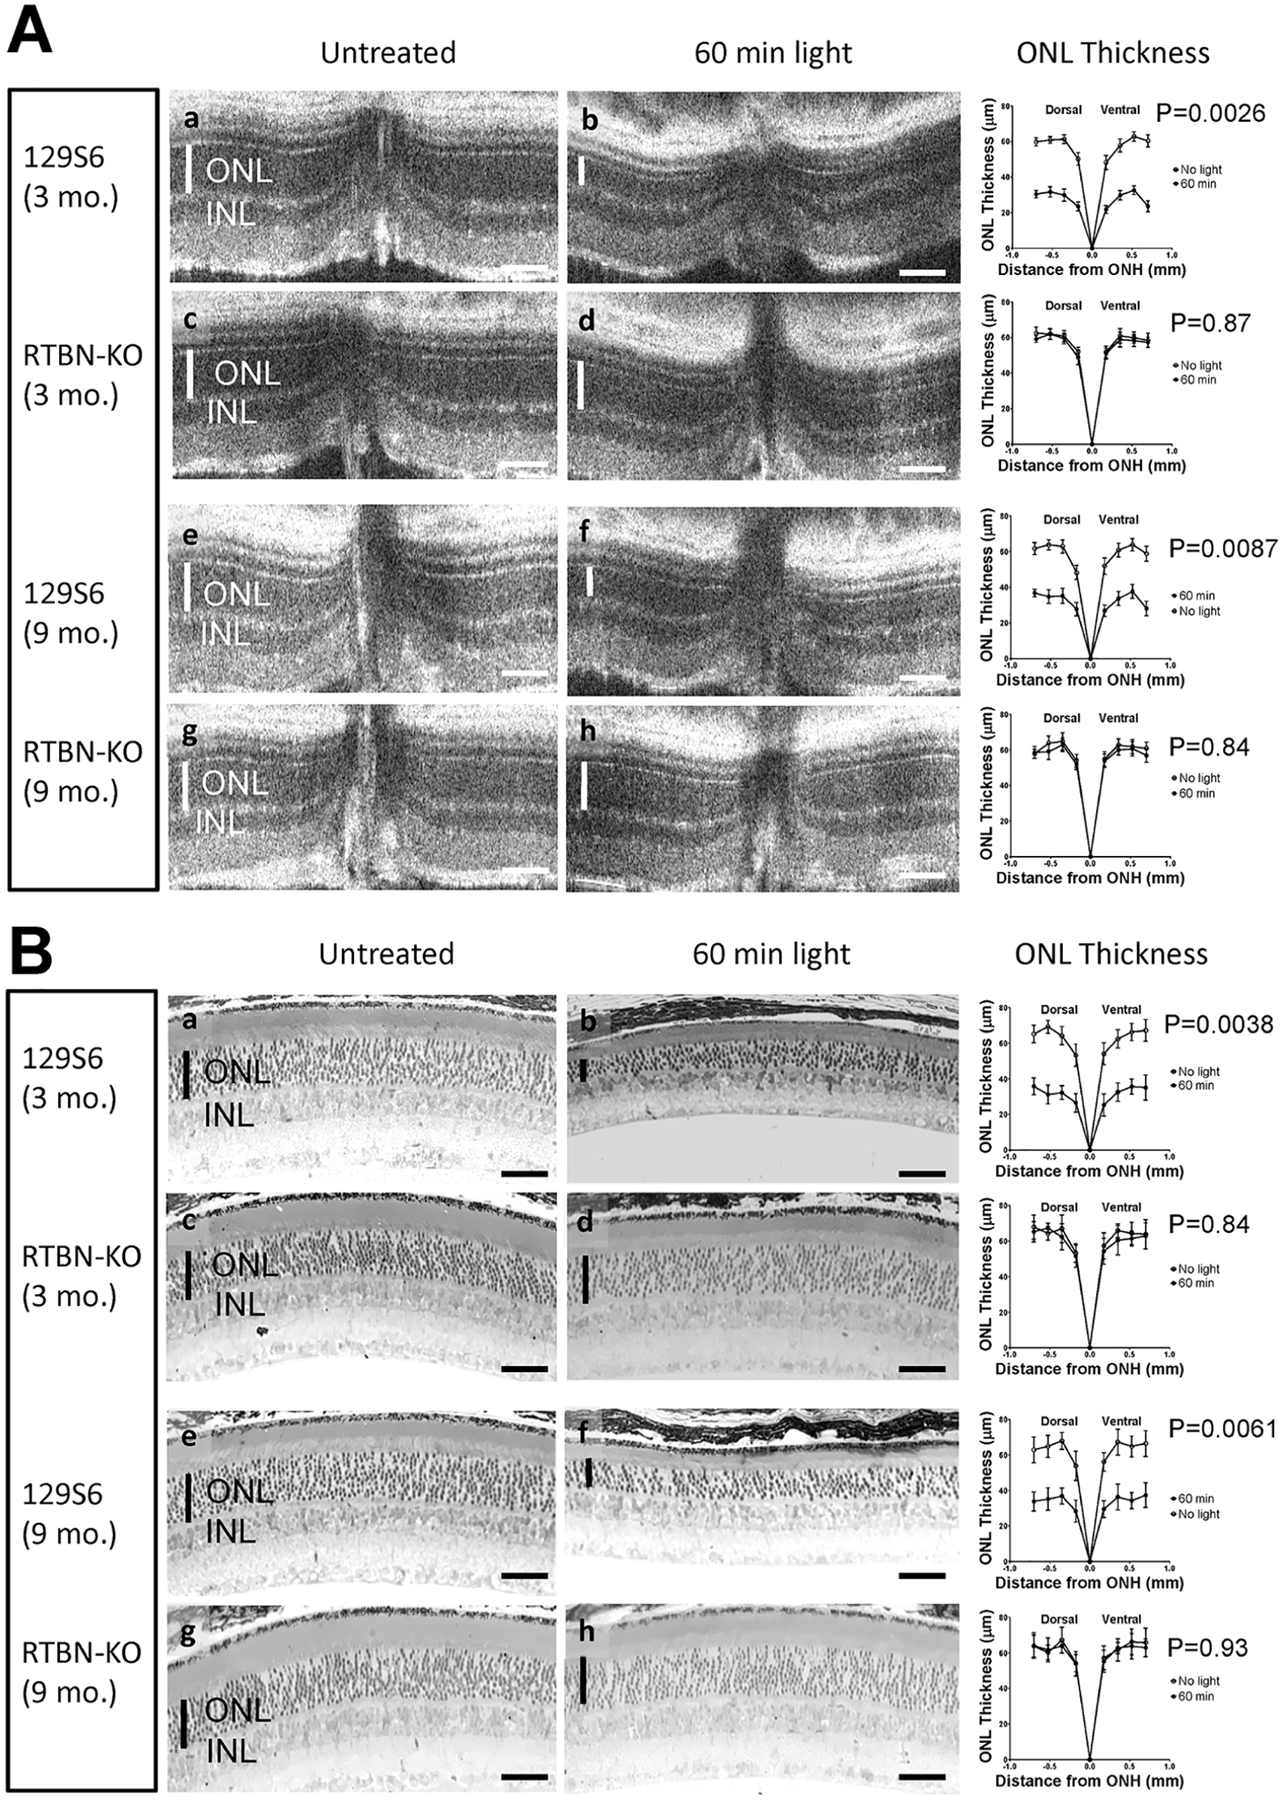
Retbindin knockout mice in 129 background (c, d, g and h) and wild type 129S6 control mice (a, b, e, and f) at age of 3 months (a, b, c, and d) and 9 months (e, f, g and h) were dark-adapted then were either untreated (a, c, e, and g) or subjected to light damage for 1 h at 12000 lux (b, d, f and h). After additional dark adaptation for 2 weeks, the mice were imaged for retinal damage with OCT (Panel A), followed by light microscopic examination of H&E stained retinal sections in the plastic (Panel B). N=4 for each group. Thickness of the Outer Nuclear Layer (ONL) was indicated by the vertical white bars (A) or black bars (B) in each panel. In addition, thickness of ONL was measured using images from both the OCT experiment (A) and plastic sections (B) and plotted over distances from optical nerve head (ONH). The resulting line graphs were displayed at the end of respective groups of panels. Error bars represent means ± the standard deviations (N=4). The statistical p values were calculated using the pairwise two-tailed T-test between data from untreated and light-damaged mice. The horizontal size bar (white in A and black in B) at the bottom right of each subpanel represents 50 μm.
3.8. Binding affinity of Retbindin
Light-damage is known to be mediated through 11-cis retinal (Organisciak and Vaughan, 2010). We used bio-layer interferometry (BLI) to measure the affinity of recombinant mouse retbindin for several ligands (Fig 8). While the affinities for flavins and other control molecules were low, the protein showed significant affinity for several retinoids, particularly for 11-cis retinal, in the μM range very similar to the well characterized 11-cis retinal transport protein IRBP which, when tested in this system, gave binding close to that determined by others (Vachali et al., 2013). Although it has been reported that retbindin binds flavins (Kelley et al., 2015), by BLI, affinities for these and other compounds were orders of magnitude weaker than for retinoids.
Figure 8. Recombinant mouse retbindin has high affinity for 11-cis retinal and other retinoids.
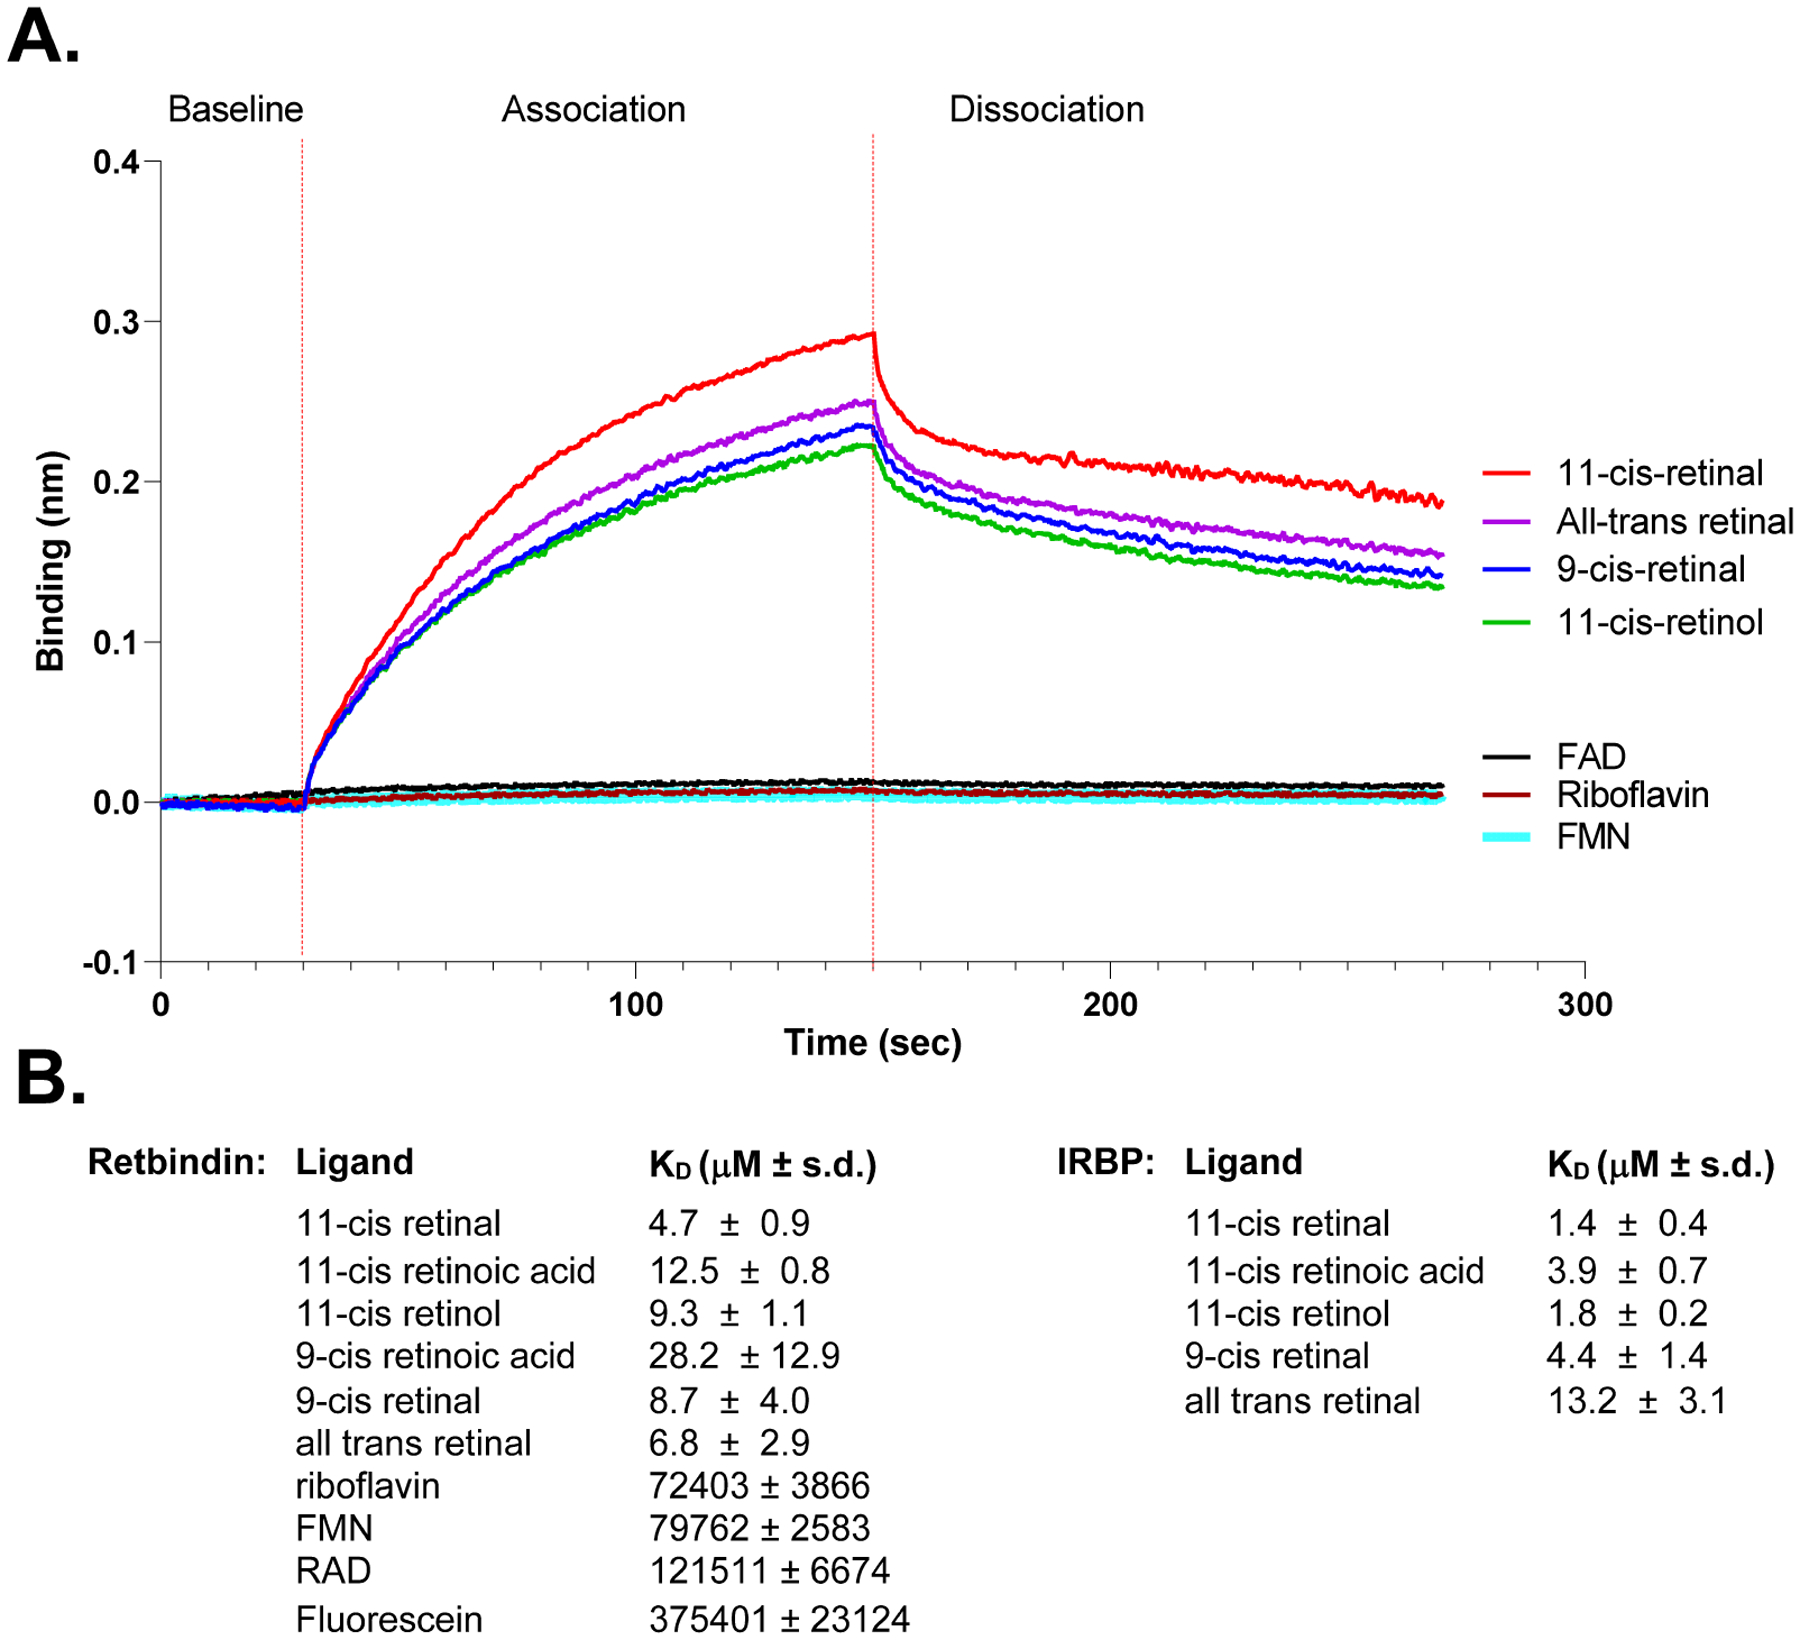
Ligand binding to mouse retbindin was measured by bio-layer interferometry using the BLItz device. A) BLI binding and dissociation curves for retbindin and several retinoids and flavins are shown. The affinity for retinoids is much greater than flavins.
B) Dissociation constants for retinoids, flavins and fluorescein (as a control) on retbindin, and for retinoids on bovine IRBP are shown. Retbindin has high affinity for 11-cis retinal.
3.9. Flavin levels
It has been proposed that retbindin has a role in maintaining flavin levels in the retina. We compared Rtbdn-KO retinas with WT (Table 1) at 9 months and found no significant differences in FAD and FMN levels and only a small drop in riboflavin, whereas in another model for retbindin deletion based on a strategy involving reporter gene expression, which produced retinal degeneration, flavin levels were significantly reduced (Kelley et al., 2015; Kelley et al., 2017; Sinha et al., 2021). Our results suggest that retbindin does not play a major role in maintaining flavin levels in the retina. Differences in flavin levels between the two deletion models may reflect the different degree of retinal degeneration seen in the two models.
Table 1.
Flavin levels in Rtbdn-KO (KO) mice and wild type (WT) controls.
| Substrate | Flavin Levels (pmoles ± sd) | |
|---|---|---|
| WT | KO | |
| Riboflavin | 63.92 ± 2.88 | 55.89 ± 2.96 |
| FAD | 25.98 ± 5.14 | 25.18 ± 2.48 |
| FMN | 61.92 ± 11.87 | 59.07 ± 2.76 |
Levels of riboflavin, FMN and FAD were measured in dark adapted, 9-month-old +/+ (WT) and −/− (KO) retinas. FMN and FAD showed no differences between WT and Rtbdn-KO. Levels of riboflavin were only slightly reduced. Values represent average levels in pmoles per eye ± standard deviation (sd).
3.10. Molecular modeling
When it was first discovered (Wistow et al., 2002), it was noted that retbindin belongs to same protein superfamily as riboflavin binding proteins in egg laying species, mainly defined by a fingerprint of conserved cysteine residues that form disulfide bonds in the structure of chicken riboflavin binding protein (chRBP) (Monaco, 1997). Using the homology modelling program Rosetta (Das and Baker, 2008) with riboflavin-bound chRBP as template, constrained to form the same pattern of disulfides, we produced a model for the binding domain of mouse retbindin (Fig 9). In spite of low sequence identity, a very similar three-dimensional structure could be produced. Strikingly, there were major changes in the residues of the binding pocket. In particular, Tyr92 and Trp173 which form a neat slot for riboflavin in chRBP are both changed to leucines. This suggests that retbindin in mammals has evolved to bind a different ligand from chRBP. Our BLI binding and modeling data strongly suggest that the biologically relevant ligand is 11-cis retinal.
Fig 9: Molecular modelling suggests the flavin binding site of chRBP is not conserved in retbindin.
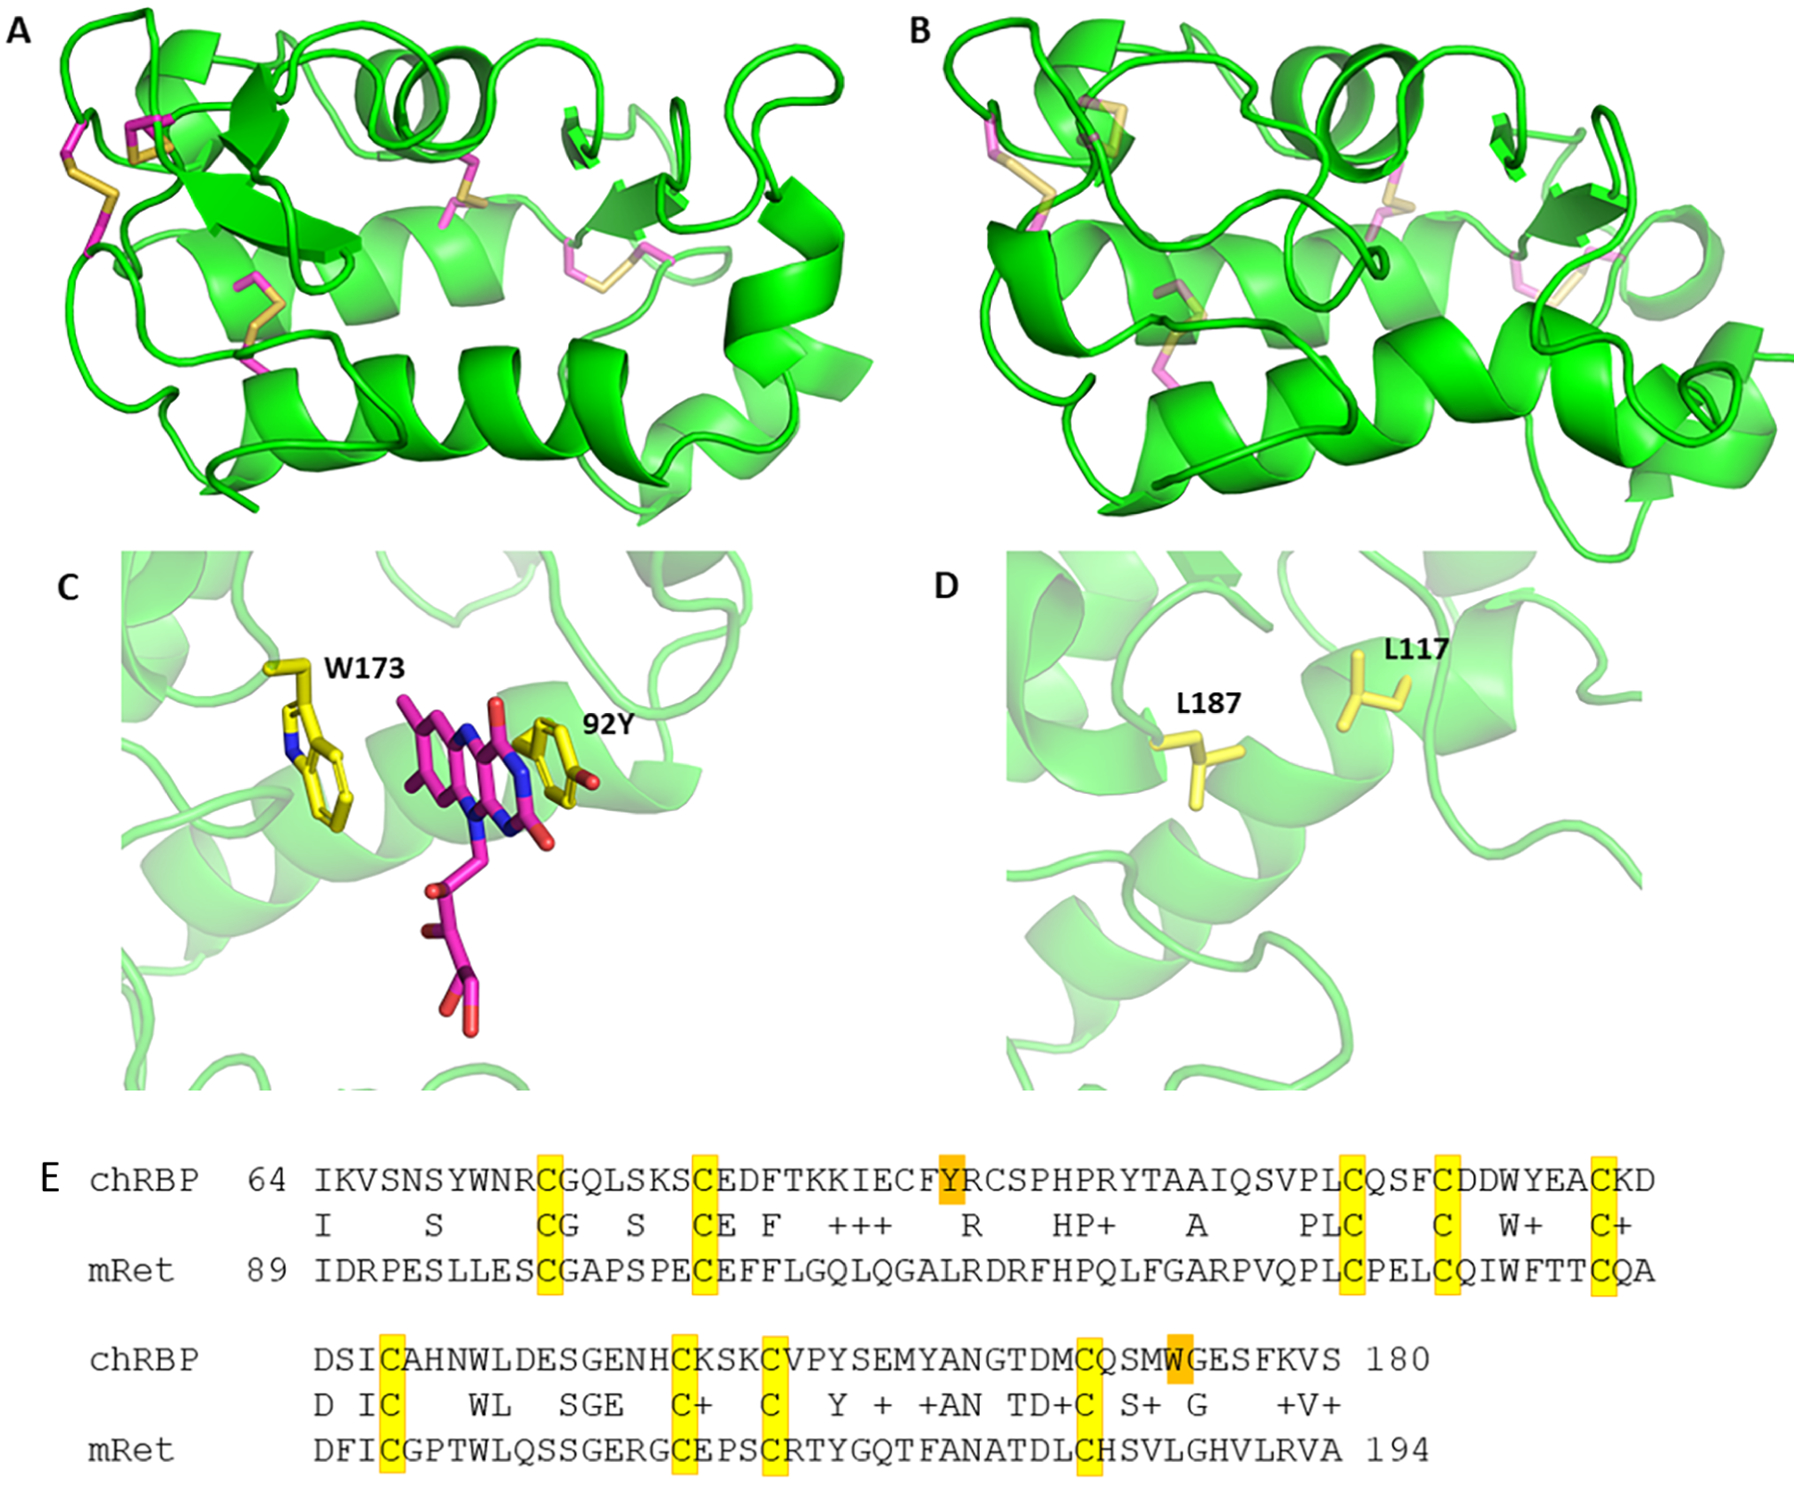
A: Structure of chicken riboflavin binding protein (chRBP). B: Homology model of mouse retbindin. Conserved disulfide bonds are shown in yellow, main chain trace shown as green ribbon.
C: Detail view of the riboflavin binding site of chRBP. Side chains indicated form a slot for flavin binding. D: Equivalent region in mouse retbindin shows lack of conservation. E: Alignment of binding domains of chRBP and mouse retbindin (mRet). Conserved cysteine residues are highlighted in yellow. The two aromatics of the riboflavin binding site of chRBP shown in B are highlighted in orange. Neither are conserved in retbindin.
4. Discussion
The vertebrate retina is a highly specialized neuronal tissue highly conserved in general structure, differentiated cell types and molecular components from fish to birds and mammals (Malicki et al., 2016). Vision depends on the proper development of the retina and on the specialized mechanisms of visual transduction. Most of the tissue-specific genes of the retina are essential and their deletion or mutation have early, serious effects (RetNet, https://sph.uth.edu/retnet/). Years of work identified the genes required for normal development and visual function, so it was a surprise when ocular genomics revealed an abundant, retina-specific gene in humans that had no known function and no obvious ortholog in non-mammalian species (Wistow et al., 2002). The protein was named retbindin from its retinal expression and its superfamily relationship with riboflavin binding proteins found in birds and reptiles (Monaco, 1997; Wistow et al., 2002); other members of the superfamily include folate receptors (PFAM PF03024). No human disease linked to this gene has been identified yet.
To gain insight into the role of retbindin, we deleted mouse Rtbdn by homologous recombination. This was bred into the C57Bl/6J background, (avoiding rd8 in C57Bl/6N (Mattapallil et al., 2012)) and into 129/S6. Both strains gave similar results for the KO phenotype, but our characterization focused on C57Bl/6J. Elimination of retbindin mRNA was confirmed by RNASeq, and ISH. IF detected retbindin protein in the interphotoreceptor matrix (IPM) between the tips of the photoreceptors and the RPE in WT, as previously observed by others (Kelley et al., 2015), but no retbindin was detected in the Rtbdn-KO.
Up to 4 months, the Rtbdn-KO retina was normal by histology and by visual function (ERG), showing that retbindin does not have an essential developmental role and is not required for visual transduction. However, with age, clear phenotypes became apparent. There was a significant decrease in ERG response in Rtbdn-KO mice, relative to WT, from 6 months onward. This affected both light- and dark-adapted responses, suggesting defects in both cone and rod pathways. However, in contrast to another model for the deletion of retbindin (Kelley et al., 2017), there was no retinal degeneration. This difference may be the result of the different strategies used for gene deletion. The prior model included expression of a reporter under control of the retbindin promoter (Kelley et al., 2017) and this may have had effects on photoreceptors (Ansari et al., 2016; Ganini et al., 2017).
In the earlier model, with retinal degeneration, levels of flavins in the Rtbdn-KO retina were significantly decreased, implicating retbindin in flavin pathways (Kelley et al., 2017; Sinha et al., 2021). In contrast, our Rtbdn-KO mice showed little difference in flavin levels compared to age-matched wild type even at 9 months. It is possible that the significant decrease in flavin levels in the prior model was due to increased photoreceptor cell death, rather than to a direct flavin-related role.
While our model showed no retinal degeneration, there were significant photoreceptor defects in old mice. Outer segments (OS) became disordered, with loss of the regular, neat stacking of discs, although OS length was not much changed. This disorganization was similar to that seen in the Rpe65 knockout mouse (Redmond et al., 1998) in which absence of 11-cis retinal led to OS damage due to excess activity of unliganded opsin (Woodruff et al., 2003). The disorganization of the photoreceptors occurs at younger age for Rpe65-KO than for Rtbdn-KO and includes shortening of OS. However, the similarity of the Rtbdn-KO to a mild version of the severe Rpe65-KO phenotype raises possibility that retbindin plays a role related to 11-cis retinal.
Given its location, retbindin could have a role in normal OS disc shedding. Indeed, retinal flat mounts showed that the Rtbdn-KO RPE had fewer lysosomes and phagosomes, the organelles responsible for phagocytosis and degradation of shed discs (Keeling et al., 2018), than WT. Decreased phagocytotic activity in retina occurs with aging and disease (Wavre-Shapton et al., 2014), showing that the Rtbdn-KO has features of premature aging.
Although our Rtbdn-KO mice had no significant retinal degeneration, TEM showed evidence for isolated examples of cell death in both the ONL and GCL in mice over 1-year old. This was confirmed by TUNEL, which showed that young WT retina showed little apoptosis, although this increased with age, while 3-month Rtbdn-KO mice had levels of apoptosis similar to that in old WT mice. Aging and disease in the retina is often accompanied by activation of microglia (Ma and Wong, 2016). Immunolabelling detected activated microglia in both the ONL and GCL of older Rtbdn-KO, and isolated examples of nuclear engulfment by microglia were also observed. Furthermore, labelling for melanopsin (OPN4), a marker for intrinsically photosensitive retinal ganglion cells (ipRGC) (Fu et al., 2005) also showed differences between WT and Rtbdn-KO. OPN4 levels decline with age in normal retina (Esquiva et al., 2017). We again found that young Rtbdn-KO retinas more closely resembled old WT retina in the levels of detectable OPN4 positive cells. These widespread effects suggest a general loss of homeostasis throughout the retina.
Age-related macular degeneration (AMD) is a major cause for vision loss in aging populations and aged Rtbdn-KO mice showed some features related to AMD. EFEMP1/Fibulin 3 (Fib3) deposits were detected along Bruch’s membrane (BrM) along with accumulation of unesterified cholesterol (UC), both markers for AMD (Marmorstein et al., 2002; Rajapakse et al., 2017; Wyatt et al., 2013). AMD can be associated with calcium/hydroxyapatite deposition (Pilgrim et al., 2017; Thompson et al., 2015) and the Rtbdn-KO eye showed significant, premature deposition of calcium/HAP along BrM. Furthermore, both light and electron microscopy showed that in aged Rtbdn-KO mice the RPE is swollen, with large vacuoles, BrM is thickened and there are clear examples of drusen-like structures in BrM, all of which are features of AMD in human eye (Bhutto and Lutty, 2012; Curcio et al., 2011; Gehrs et al., 2006; Klein, 2007).
However, a purely age-related role for retbindin does not explain why it evolved in mammals. To be selected through evolution, it should have a useful role early enough to benefit reproductive success. Although the Rtbdn-KO retina of young mice appeared normal in both morphology and visual function, we looked further for any differences. Closer examination of ERG responses in 3-month-old mice revealed that both c-wave and implicit time responses were delayed, even though light and dark-adapted a- and b-wave amplitudes were normal. C-waves are related to RPE function and the change seen may be the result of the loss of retbindin as a major component of the interface between OS and RPE. Furthermore, Rtbdn-KO mice showed significantly reduced regeneration times in flash bleaching experiments for both dark- and light-adaptation even in young animals.
Most significantly, young Rtbdn-KO mice, with no evident retinal abnormalities, showed a marked difference in susceptibility to light damage. Exposure of dark-adapted mice with normal visual cycles to bright light causes photoreceptor death (Organisciak and Vaughan, 2010) (human retinas can also suffer light-damage (van Norren and Vos, 2016)). The mechanism of this response is not clear, but damage requires normal levels of 11-cis retinal. C57Bl6 mice have lower levels of 11-cis retinal, due to a mutation in RPE65, and are resistant to light damage, compared with strains with normal RPE65 (Organisciak and Vaughan, 2010; Wenzel et al., 2001). Comparison of WT and Rtbdn-KO mice on the 129/S6 background showed that the Rtbdn-KO was resistant to light-induced photoreceptor death. This suggests that retbindin is involved in the visual cycle, probably as an intermediary in the flow of 11-cis retinal to the outer segments. IRBP (RBP3) is the familiar transport protein of this process (Duncan et al., 2006) and deletion of Rbp3 leads to severe loss of photoreceptors (Liou et al., 1998). We found IRBP was distributed along the length of the OS while retbindin was tightly localized at the tips of the OS. Significantly, light-induced damage begins at the tips of the OS before progressing to the ONL (Organisciak and Vaughan, 2010).
We found that retbindin and IRBP had similar, high affinities for retinoids, particularly 11-cis retinal. In contrast, binding of flavins and other compounds was much weaker. Modelling the structure of mouse retbindin from the chicken riboflavin binding protein (chRBP) x-ray structure (Monaco, 1997) showed that key aromatic residues, whose side chains form a neat slot for binding the riboflavin ring system, are not conserved in retbindin. If flavin binding were a conserved feature of retbindin, it would be expected that residues of the binding site would be among those most strongly conserved through evolution. That this is not the case suggests retbindin has evolved for a different function in mammals.
Our results from the localization of retbindin, its role in light damage, and its affinity for 11-cis retinal suggests that it has a specialized role in supplying 11-cis retinal to the tips of the OS. Indeed, this could explain its evolutionary history. Mammals have rod-rich retinas, an adaptation for dim light. As mammals evolved, the mechanism for 11-cis retinal supply that worked well in the cone-rich retinas of ancestral species may have been inadequate, leading to the evolution of an additional component to enhance 11-cis retinal flow from RPE to rods, particularly in the dark. The enhanced flow may result in an oversupply of 11-cis retinal in rods that are unexpectedly assaulted by bright light, overstimulating excitation pathways and initiating a cascade of damage that results in cell death (Organisciak and Vaughan, 2010).
Beyond a role related to vision in low-light conditions, retbindin has a role in longer term homeostasis in the mouse retina and its absence leads to phenotypes of premature aging. Indeed, aging in the mammalian retina may be affected by levels of 11-cis retinal falling below some critical threshold for homeostasis (Jackson et al., 2002; Kolesnikov et al., 2010). The Rtbdn-KO mouse provides new insight into light-damage in the retina and provides a model for aging in the retina, including some phenotypes seen in AMD.
Supplementary Material
Highlights.
Deletion of mouse retbindin protects against light-induced retinal damage
Recombinant retbindin binds 11-cis retinal with high affinity
Deletion of retbindin causes features of premature aging in the mouse retina
Retbindin has an unexpected role in the visual cycle and retinal homeostasis
Acknowledgments
This work was supported by the Intramural Program of the National Eye Institute.
Footnotes
Publisher's Disclaimer: This is a PDF file of an unedited manuscript that has been accepted for publication. As a service to our customers we are providing this early version of the manuscript. The manuscript will undergo copyediting, typesetting, and review of the resulting proof before it is published in its final form. Please note that during the production process errors may be discovered which could affect the content, and all legal disclaimers that apply to the journal pertain.
Competing interests: The authors declare no competing interests.
References
- Ansari AM, Ahmed AK, Matsangos AE, Lay F, Born LJ, Marti G, Harmon JW, Sun Z, 2016. Cellular GFP Toxicity and Immunogenicity: Potential Confounders in in Vivo Cell Tracking Experiments. Stem Cell Rev Rep 12, 553–559. [DOI] [PMC free article] [PubMed] [Google Scholar]
- Bhutto I, Lutty G, 2012. Understanding age-related macular degeneration (AMD): relationships between the photoreceptor/retinal pigment epithelium/Bruch’s membrane/choriocapillaris complex. Mol Aspects Med 33, 295–317. [DOI] [PMC free article] [PubMed] [Google Scholar]
- Brown MC, Joaquim TR, Chambers R, Onisk DV, Yin F, Moriango JM, Xu Y, Fancy DA, Crowgey EL, He Y, Stave JW, Lindpaintner K, 2011. Impact of immunization technology and assay application on antibody performance--a systematic comparative evaluation. PLoS One 6, e28718. [DOI] [PMC free article] [PubMed] [Google Scholar]
- Chaturvedi SK, Sagar V, Zhao H, Wistow G, Schuck P, 2019. Measuring Ultra-Weak Protein Self-Association by Non-ideal Sedimentation Velocity. J Am Chem Soc 141, 2990–2996. [DOI] [PMC free article] [PubMed] [Google Scholar]
- Curcio CA, Johnson M, Rudolf M, Huang JD, 2011. The oil spill in ageing Bruch membrane. Br J Ophthalmol 95, 1638–1645. [DOI] [PMC free article] [PubMed] [Google Scholar]
- Das R, Baker D, 2008. Macromolecular modeling with rosetta. Annu Rev Biochem 77, 363–382. [DOI] [PubMed] [Google Scholar]
- Doyle SE, Castrucci AM, McCall M, Provencio I, Menaker M, 2006. Nonvisual light responses in the Rpe65 knockout mouse: rod loss restores sensitivity to the melanopsin system. Proc Natl Acad Sci U S A 103, 10432–10437. [DOI] [PMC free article] [PubMed] [Google Scholar]
- Duncan T, Fariss RN, Wiggert B, 2006. Confocal immunolocalization of bovine serum albumin, serum retinol-binding protein, and interphotoreceptor retinoid-binding protein in bovine retina. Mol Vis 12, 1632–1639. [PubMed] [Google Scholar]
- Esquiva G, Lax P, Perez-Santonja JJ, Garcia-Fernandez JM, Cuenca N, 2017. Loss of Melanopsin-Expressing Ganglion Cell Subtypes and Dendritic Degeneration in the Aging Human Retina. Front Aging Neurosci 9, 79. [DOI] [PMC free article] [PubMed] [Google Scholar]
- Fletcher EL, Jobling AI, Greferath U, Mills SA, Waugh M, Ho T, de Iongh RU, Phipps JA, Vessey KA, 2014. Studying age-related macular degeneration using animal models. Optometry and vision science : official publication of the American Academy of Optometry 91, 878–886. [DOI] [PMC free article] [PubMed] [Google Scholar]
- Fu Y, Zhong H, Wang MH, Luo DG, Liao HW, Maeda H, Hattar S, Frishman LJ, Yau KW, 2005. Intrinsically photosensitive retinal ganglion cells detect light with a vitamin A-based photopigment, melanopsin. Proc Natl Acad Sci U S A 102, 10339–10344. [DOI] [PMC free article] [PubMed] [Google Scholar]
- Ganini D, Leinisch F, Kumar A, Jiang J, Tokar EJ, Malone CC, Petrovich RM, Mason RP, 2017. Fluorescent proteins such as eGFP lead to catalytic oxidative stress in cells. Redox Biol 12, 462–468. [DOI] [PMC free article] [PubMed] [Google Scholar]
- Gehrs KM, Anderson DH, Johnson LV, Hageman GS, 2006. Age-related macular degeneration--emerging pathogenetic and therapeutic concepts. Ann Med 38, 450–471. [DOI] [PMC free article] [PubMed] [Google Scholar]
- Hood DC, Birch DG, 1992. A computational model of the amplitude and implicit time of the b-wave of the human ERG. Vis Neurosci 8, 107–126. [DOI] [PubMed] [Google Scholar]
- Jackson GR, McGwin G Jr., Phillips JM, Klein R, Owsley C, 2006. Impact of aging and age-related maculopathy on inactivation of the a-wave of the rod-mediated electroretinogram. Vision Res 46, 1422–1431. [DOI] [PubMed] [Google Scholar]
- Jackson GR, Owsley C, Curcio CA, 2002. Photoreceptor degeneration and dysfunction in aging and age-related maculopathy. Ageing Res Rev 1, 381–396. [DOI] [PubMed] [Google Scholar]
- Kamat V, Rafique A, 2017. Designing binding kinetic assay on the bio-layer interferometry (BLI) biosensor to characterize antibody-antigen interactions. Anal Biochem 536, 16–31. [DOI] [PubMed] [Google Scholar]
- Keeling E, Lotery AJ, Tumbarello DA, Ratnayaka JA, 2018. Impaired Cargo Clearance in the Retinal Pigment Epithelium (RPE) Underlies Irreversible Blinding Diseases. Cells 7. [DOI] [PMC free article] [PubMed] [Google Scholar]
- Kelley RA, Al-Ubaidi MR, Naash MI, 2015. Retbindin is an extracellular riboflavin-binding protein found at the photoreceptor/retinal pigment epithelium interface. J Biol Chem 290, 5041–5052. [DOI] [PMC free article] [PubMed] [Google Scholar]
- Kelley RA, Al-Ubaidi MR, Sinha T, Genc AM, Makia MS, Ikelle L, Naash MI, 2017. Ablation of the riboflavin-binding protein retbindin reduces flavin levels and leads to progressive and dose-dependent degeneration of rods and cones. J Biol Chem 292, 21023–21034. [DOI] [PMC free article] [PubMed] [Google Scholar]
- Klein R, 2007. Overview of progress in the epidemiology of age-related macular degeneration. Ophthalmic Epidemiol 14, 184–187. [DOI] [PubMed] [Google Scholar]
- Kolesnikov AV, Fan J, Crouch RK, Kefalov VJ, 2010. Age-related deterioration of rod vision in mice. J Neurosci 30, 11222–11231. [DOI] [PMC free article] [PubMed] [Google Scholar]
- Li L, Eter N, Heiduschka P, 2015. The microglia in healthy and diseased retina. Exp Eye Res 136, 116–130. [DOI] [PubMed] [Google Scholar]
- Liou GI, Fei Y, Peachey NS, Matragoon S, Wei S, Blaner WS, Wang Y, Liu C, Gottesman ME, Ripps H, 1998. Early onset photoreceptor abnormalities induced by targeted disruption of the interphotoreceptor retinoid-binding protein gene. J Neurosci 18, 4511–4520. [DOI] [PMC free article] [PubMed] [Google Scholar]
- Ma W, Wong WT, 2016. Aging Changes in Retinal Microglia and their Relevance to Age-related Retinal Disease. Adv Exp Med Biol 854, 73–78. [DOI] [PMC free article] [PubMed] [Google Scholar]
- Malicki J, Pooranachandran N, Nikolaev A, Fang X, Avanesov A, 2016. Analysis of the retina in the zebrafish model. Methods Cell Biol 134, 257–334. [DOI] [PubMed] [Google Scholar]
- Marmorstein LY, Munier FL, Arsenijevic Y, Schorderet DF, McLaughlin PJ, Chung D, Traboulsi E, Marmorstein AD, 2002. Aberrant accumulation of EFEMP1 underlies drusen formation in Malattia Leventinese and age-related macular degeneration. Proc Natl Acad Sci U S A 99, 13067–13072. [DOI] [PMC free article] [PubMed] [Google Scholar]
- Mattapallil MJ, Wawrousek EF, Chan CC, Zhao H, Roychoudhury J, Ferguson TA, Caspi RR, 2012. The Rd8 mutation of the Crb1 gene is present in vendor lines of C57BL/6N mice and embryonic stem cells, and confounds ocular induced mutant phenotypes. Invest Ophthalmol Vis Sci 53, 2921–2927. [DOI] [PMC free article] [PubMed] [Google Scholar]
- Messenio D, Marano G, Gerosa S, Iannelli F, Biganzoli EM, 2013. The influence of age on the recovery of the ERG photostress test. Doc Ophthalmol 126, 87–97. [DOI] [PubMed] [Google Scholar]
- Monaco HL, 1997. Crystal structure of chicken riboflavin-binding protein. Embo J 16, 1475–1483. [DOI] [PMC free article] [PubMed] [Google Scholar]
- Muller-Esparza H, Osorio-Valeriano M, Steube N, Thanbichler M, Randau L, 2020. Bio-Layer Interferometry Analysis of the Target Binding Activity of CRISPR-Cas Effector Complexes. Front Mol Biosci 7, 98. [DOI] [PMC free article] [PubMed] [Google Scholar]
- Muyrers JP, Zhang Y, Benes V, Testa G, Rientjes JM, Stewart AF, 2004. ET recombination: DNA engineering using homologous recombination in E. coli. Methods Mol Biol 256, 107–121. [DOI] [PubMed] [Google Scholar]
- Nagy A, Rossant J, Nagy R, Abramow-Newerly W, Roder JC, 1993. Derivation of completely cell culture-derived mice from early-passage embryonic stem cells. Proc Natl Acad Sci U S A 90, 8424–8428. [DOI] [PMC free article] [PubMed] [Google Scholar]
- Organisciak DT, Vaughan DK, 2010. Retinal light damage: mechanisms and protection. Prog Retin Eye Res 29, 113–134. [DOI] [PMC free article] [PubMed] [Google Scholar]
- Pennesi ME, Neuringer M, Courtney RJ, 2012. Animal models of age related macular degeneration. Mol Aspects Med 33, 487–509. [DOI] [PMC free article] [PubMed] [Google Scholar]
- Pilgrim MG, Lengyel I, Lanzirotti A, Newville M, Fearn S, Emri E, Knowles JC, Messinger JD, Read RW, Guidry C, Curcio CA, 2017. Subretinal Pigment Epithelial Deposition of Drusen Components Including Hydroxyapatite in a Primary Cell Culture Model. Invest Ophthalmol Vis Sci 58, 708–719. [DOI] [PMC free article] [PubMed] [Google Scholar]
- Rajapakse D, Peterson K, Mishra S, Wistow G, 2017. Serum starvation of ARPE-19 changes the cellular distribution of cholesterol and Fibulin3 in patterns reminiscent of age-related macular degeneration. Exp Cell Res 361, 333–341. [DOI] [PMC free article] [PubMed] [Google Scholar]
- Rathnasamy G, Foulds WS, Ling EA, Kaur C, 2019. Retinal microglia - A key player in healthy and diseased retina. Prog Neurobiol 173, 18–40. [DOI] [PubMed] [Google Scholar]
- Redmond TM, Yu S, Lee E, Bok D, Hamasaki D, Chen N, Goletz P, Ma JX, Crouch RK, Pfeifer K, 1998. Rpe65 is necessary for production of 11-cis-vitamin A in the retinal visual cycle. Nat Genet 20, 344–351. [DOI] [PubMed] [Google Scholar]
- Safi H, Safi S, Hafezi-Moghadam A, Ahmadieh H, 2018. Early detection of diabetic retinopathy. Surv Ophthalmol 63, 601–608. [DOI] [PubMed] [Google Scholar]
- Sinha T, Du J, Makia MS, Hurley JB, Naash MI, Al-Ubaidi MR, 2021. Absence of retbindin blocks glycolytic flux, disrupts metabolic homeostasis, and leads to photoreceptor degeneration. Proc Natl Acad Sci U S A 118. [DOI] [PMC free article] [PubMed] [Google Scholar]
- Thomas KR, Capecchi MR, 1987. Site-directed mutagenesis by gene targeting in mouse embryo-derived stem cells. Cell 51, 503–512. [DOI] [PubMed] [Google Scholar]
- Thompson RB, Reffatto V, Bundy JG, Kortvely E, Flinn JM, Lanzirotti A, Jones EA, McPhail DS, Fearn S, Boldt K, Ueffing M, Ratu SG, Pauleikhoff L, Bird AC, Lengyel I, 2015. Identification of hydroxyapatite spherules provides new insight into subretinal pigment epithelial deposit formation in the aging eye. Proc Natl Acad Sci U S A 112, 1565–1570. [DOI] [PMC free article] [PubMed] [Google Scholar]
- Vachali PP, Besch BM, Gonzalez-Fernandez F, Bernstein PS, 2013. Carotenoids as possible interphotoreceptor retinoid-binding protein (IRBP) ligands: a surface plasmon resonance (SPR) based study. Arch Biochem Biophys 539, 181–186. [DOI] [PMC free article] [PubMed] [Google Scholar]
- van Norren D, Vos JJ, 2016. Light damage to the retina: an historical approach. Eye (Lond) 30, 169–172. [DOI] [PMC free article] [PubMed] [Google Scholar]
- Vihtelic TS, Fadool JM, Gao J, Thornton KA, Hyde DR, Wistow G, 2005. Expressed sequence tag analysis of zebrafish eye tissues for NEIBank. Mol Vis 11, 1083–1100. [PubMed] [Google Scholar]
- Wavre-Shapton ST, Meschede IP, Seabra MC, Futter CE, 2014. Phagosome maturation during endosome interaction revealed by partial rhodopsin processing in retinal pigment epithelium. J Cell Sci 127, 3852–3861. [DOI] [PMC free article] [PubMed] [Google Scholar]
- Wenzel A, Reme CE, Williams TP, Hafezi F, Grimm C, 2001. The Rpe65 Leu450Met variation increases retinal resistance against light-induced degeneration by slowing rhodopsin regeneration. J Neurosci 21, 53–58. [DOI] [PMC free article] [PubMed] [Google Scholar]
- Wistow G, 2002. A Project for Ocular Bioinformatics: NEIBank. Mol. Vis [PubMed] [Google Scholar]
- Wistow G, Bernstein SL, Wyatt MK, Ray S, Behal A, Touchman JW, Bouffard G, Smith D, Peterson K, 2002. Expressed sequence tag analysis of human retina for the NEIBank Project: retbindin, an abundant, novel retinal cDNA and alternative splicing of other retina-preferred gene transcripts. Mol Vis 8, 196–204. [PubMed] [Google Scholar]
- Wistow G, Peterson K, Gao J, Buchoff P, Jaworski C, Bowes-Rickman C, Ebright JN, Hauser MA, Hoover D, 2008. NEIBank: genomics and bioinformatics resources for vision research. Mol Vis 14, 1327–1337. [PMC free article] [PubMed] [Google Scholar]
- Woodruff ML, Wang Z, Chung HY, Redmond TM, Fain GL, Lem J, 2003. Spontaneous activity of opsin apoprotein is a cause of Leber congenital amaurosis. Nat Genet 35, 158–164. [DOI] [PubMed] [Google Scholar]
- Wyatt MK, Tsai JY, Mishra S, Campos M, Jaworski C, Fariss RN, Bernstein SL, Wistow G, 2013. Interaction of complement factor h and fibulin3 in age-related macular degeneration. PLoS ONE 8, e68088. [DOI] [PMC free article] [PubMed] [Google Scholar]
- Yavas GF, Kusbeci T, Inan UU, 2014. Multifocal electroretinography in subjects with age-related macular degeneration. Doc Ophthalmol 129, 167–175. [DOI] [PubMed] [Google Scholar]
- Zarbin MA, 2004. Current concepts in the pathogenesis of age-related macular degeneration. Arch Ophthalmol 122, 598–614. [DOI] [PubMed] [Google Scholar]
Associated Data
This section collects any data citations, data availability statements, or supplementary materials included in this article.