

Abstract
Protein arginine methyltransferases (PRMTs) are a family of enzymes involved in gene regulation and protein/histone modifications. PRMT8 is primarily expressed in the central nervous system, specifically within the cellular membrane and synaptic vesicles. Recently, PRMT8 has been described to play key roles in neuronal signaling such as a regulator of dendritic arborization, synaptic function and maturation, and neuronal differentiation and plasticity. Here, we examined the role of PRMT8 in response to hypoxia-induced stress in brain metabolism. Our results from liquid chromatography mass spectrometry, mitochondrial oxygen consumption rate (OCR), and protein analyses indicate that PRMT8(−/−) knockout mice presented with altered membrane phospholipid composition, decreased mitochondrial stress capacity, and increased neuroinflammatory markers, such as TNF-α and ionized calcium binding adaptor molecule 1 (Iba1, a specific marker for microglia/macrophage activation) after hypoxic stress. Furthermore, adenovirus-based overexpression of PRMT8 reversed the changes in membrane phospholipid composition, mitochondrial stress capacity, and neuroinflammatory markers. Together, our findings establish PRMT8 as an important regulatory component of membrane phospholipid composition, short-term memory function, mitochondrial function, and neuroinflammation in response to hypoxic stress.
Keywords: Protein arginine methyltransferase, hypoxic stress, phospholipids, mitochondrial function, neuroinflammation
Graphical Abstract:

Protein arginine methyltransferases (PRMTs) have been recognized as important regulators of protein function. PRMT8 is a unique member of the PRMT family, as it is primarily expressed in the central nervous system. However, there is no consensus regarding the mechanism of action of PRMT8. Here, we provide evidence that PRMT8 acts as an important regulatory element of membrane phospholipids, mitochondrial function, neuroinflammation, and memory function in response to hypoxic stress. Altogether, PRMT8 can be a potential target in neurological and neurodegenerative disorders.
Created with BioRender.com
Introduction
Arginine methylation is a post-translational process that is involved in epigenetic regulation, mRNA splicing, cell signaling, protein ubiquitination, phosphorylation, and acetylation (Kandel 2001). The protein arginine methyltransferases (PRMT) family of enzymes are responsible for the transfer of methyl groups onto target arginine residues (e.g., RGG/RG motifs) on proteins, to result in a variety of cellular, and protein signaling responses (Blanc & Richard 2017). Recent studies have been focused on understanding PRMT function in various pathologies; however, the exact role of PRMTs has not been well elucidated in neurological function (Poulard et al. 2016; Onwuli et al. 2017). PRMTs are categorized based on their catalytic methylation of arginine residues to form monomethyl arginine (MMA, type III) and asymmetric dimethyl arginine (aDMA, type I), or symmetric dimethylarginine (sDMA, type II) (Kolbel et al. 2009). Within the PRMT family of enzymes, PRMT8 is a type I PRMT enzyme primarily expressed within the central nervous system (Lee et al. 2005; Kousaka et al. 2009), localized at the cell membrane and synaptic vesicles via N-terminal myristoylation (Sayegh et al. 2007). PRMT8 has been suggested to have roles in regulating gene expression and serve as a post-translational modifier of neuronal proteins (e.g., sodium ion channels) (Simandi et al. 2015; Kim et al. 2008; Pahlich et al. 2008). Co-expression of PRMT8 and the sodium channel 1.2 led to an increase in sodium currents, serving as an indicator that arginine-based methylation can modulate neuronal excitability (Baek et al. 2014). In addition, PRMT8 is also unique to exhibit both an arginine methyltransferase and phospholipase D function (Lee et al. 2005; Kim et al. 2015). Its phospholipase activity is responsible for hydrolyzing phosphatidylcholine to form acetylcholine in the cerebellum, thereby regulating dendritic arborization and behavioral motor function (Kim et al. 2015). PRMT8 has also been reported to regulate synaptic function, and to provide neuroprotection against aging motoneurons (Penney et al. 2017; Simandi et al. 2018).
Aside from providing stress tolerance in aging motoneurons (Simandi et al. 2018), most of the current literature concerning PRMT8 has been attributed to the involvement of neuronal development implicated in dendritic spine maturation (Penney et al. 2017; Lin et al. 2013) and modulation of the actin cytoskeleton (Lo et al. 2020) in the absence of cellular stress. Here, we aim to build the body of knowledge on PRMT8 function and to investigate if PRMT8 is involved in stress-mediated responses. Cellular stress (i.e., hypoxia) has been shown to drive atypical expression of PRMTs and cause alterations in their downstream metabolites like asymmetric dimethylarginine (aDMA) (Yildirim et al. 2006). In fact, aDMA has been identified as an important risk factor for cardiovascular disease and heart failure (Liu et al. 2018). Moreover, aDMA is a known inhibitor of nitric oxide synthetase (NOS), ultimately decreasing overall nitric oxide levels, an important neurotransmitter that can modulate vessel tonicity and nerve conductance (Huynh & Chin-Dusting 2006; Couto et al. 2020). Therefore, we hypothesized that the deletion of PRMT8 could impact aDMA levels, subsequently affecting NOS and nitric oxide levels. The goal of this project is not only to investigate the role of PRMT8 in stress-mediated responses, but also to broaden the basic knowledge of PRMT biology. Thus, we investigated the role of PRMT8 in the context of cellular stress and the importance of PRMT8-mediated signaling in various stress-related settings, including membrane phospholipids, mitochondrial function, neuroinflammation, and behavior function. Altogether, our results are indicative that PRMT8 is a regulator of membrane phospholipids composition, mitochondria stress capacity, neuroinflammatory responses and short-term memory function after hypoxic stress.
Methods
Animal preparation
All animal experimental procedures were approved by the Institutional Animal Care and Use Committee of the Louisiana State University Health Sciences Center in Shreveport (Proposal number: P-21–001). 6- to 12-week-old PRMT8 tm1a(EUCOMM)Wtsi (PRMT8−/−) and wild-type (WT, C57BL/6J, Jackson Laboratory, Bar Harbor, ME) mice weighing 20 g-30 g were acclimated for 1 week prior to experimentation. Mice were housed in a controlled environment (20° ± 1° C, humidity 50 ± 5 %) under a 12:12-hour light-dark cycle (lights on at 7:00 a.m., lights off at 7:00 p.m.) and had access to standard rat/mice chow and water available ad libitum. Experiments were not pre-registered and consisted of simple randomized exploratory controlled trials with similar number of animals per group. Experiments were conducted during 6:00 a.m. to 8:00 p.m. After completion of experiments, mice were placed in a small plexiglass chamber with 4% isoflurane (Cat. No. 21295098, Patterson Veterinary, Greeley, CO), and decapitated when fully sedated, as measured by a lack of active paw reflex. Isoflurane was used as it has rapid and reliable onset.
The PRMT8 tm1a(EUCOMM)Wtsi mouse line (RRID: 5806917) was generated by blastocyst injection of the JM8.F6 embryonic stem cell clone EPD0105_1_A03 produced by the European Conditional Mouse Mutagenesis Program and Knockout Mouse Project (EUCOMM/KOMP) and Sanger Mouse Genetics Project. PRMT8−/− embryos were purchased from European Conditional Mouse Mutagenesis Program (EUCOMM) and reconstituted by Jackson Laboratory (Bar Harbor, ME). For genotyping of PRMT8 knockout mice, tail DNA was extracted by hot sodium hydroxide and tris (HOTSHOT) method. Tail samples (1–2 mm) were incubated in 75 μl of alkaline reagent (25 mM NaOH and 0.2 mM EDTA diluted in water at pH 12) at 95 ᴼC for 1 hour. After incubation, the reaction was neutralized with 75 μl of neutralization buffer (40 mM Tris-HCl at pH 5). Multiplex allele-specific PCR was performed using AccuStart™ II GelTrack PCR SuperMix (QuantaBio, Beverly, MA) and the following PCR primers: forward (P1), 5′-CCTGGCACTTTGAGGTGTTG-3′, and the reverse (P2), 5′-TCGTGGTATCGTTATGCGCC-3′, which generated a 252-bp product for the PRMT8 knockout allele.
Throughout this study we utilized a total of 242 male mice distributed as follow: WT (68 mice), hypoxic WT (40), PRMT8−/− (62), hypoxic PRMT8−/− (42), PRMT8−/− + AAV.PHP.eB (16), hypoxic PRMT8−/− + AAV.PHP.eB (14). Wild-type mice were numbered and randomly assigned into group 1 (control) or group 2 (hypoxia). PRMT8−/− mice were randomized into 4 different groups, including group 3 (control), group 4 (hypoxia), group 5 (AAV control), or group 6 (AAV hypoxia). Our experiments were performed on male mice due to the fact that continual variance of female hormones [i.e., 17β-estradiol (E2)] can affect mitochondrial repair, brain metabolism, ultimately leading to neuroprotection against oxidative stress and ischemic injuries, making it difficult to dissect out PRMT8’s function or mechanism (Brann et al. 2007; Zarate et al. 2017).
Neuronal in vivo PRMT8 transduction
Adult male PRMT8−/− mice (approximately 4–5 weeks of age weighing 20–30 g) were given an intravenous administration of the AAV-hSYN1-GFP.m-PRMT8-WPRE (Vector biolabs, Malvern, PA) to re-express the PRMT8 protein. PRMT8 vector [AAV-PHP.eB-hSYN1-GFP.m-PRMT8-WPRE (Vector biolabs, Malvern, PA)] was diluted in lactated Ringer’s solution to a final viral dose of 1 × 10¹¹ vector genomes (vg) in 100 μL total volume for retro-orbital injections. Vehicle groups were just injected with lactated ringer. For adequate gene transduction, mice were used for studies 4 weeks after viral injection.
Acute systemic hypoxia model
Mice were subjected to 3 hours of hypoxia (10 % O2, 0.5 % CO2 and balanced with 89.5 % N2) followed by 1-hour reoxygenation (room air) for 3 consecutive days. Behavioral experiments began 15–20 minutes after the last hypoxic session. After completion of behavioral trials, mice were immediately sacrificed (day 6) for protein, mRNA, and mitochondrial respiratory analyses. Mice were monitored on a daily basis for 4 days after hypoxic stress for any signs of pain and distress, including: loss of appetite, weight loss, self-mutilation, self-imposed isolation, loss of movement, changes in breathing pattern, unkempt appearance, abnormal posture, loss of muscle tone, dehydration, urine and feces quality and texture, tremors or twitching, and increased salivation. Any animals that exhibited signs of severe discomfort or distress were euthanized and excluded from the overall analysis. For a graphical timeline of experiments please see Fig. 1.
Figure 1. Time‐line diagram of animal experiments and endpoints.

A total number of 5 animals were excluded during our outlier assessment via the Grubbs outlier’s test (p<0.05). Moreover, one PRMT8−/− mouse was excluded during PLD1 and PLD2 mRNA analysis. One PRMT8−/− mouse treated with AAV.PHP.eB was excluded during choline/acetylcholine measurements. During open field testing, one WT hypoxic and one hypoxic PRMT8−/− treated with AAV.PHP.eB were excluded from the analysis. In addition, one PRMT8−/− mouse was excluded during our T-maze short-term memory assessment.
Open field behavioral test
Three days after hypoxic stress, mice were placed in the open field arena (65 × 45 × 65 cm) and video recorded for their locomotor activity over a 30 min period. Time spent in center, total distance, and average speed were tracked and measured using the ANY-maze 6.1 automated software (Stoelting, Wood Dale, IL). Experimenters were blinded during video and statistical analysis.
T-maze
After the third day of hypoxic stress, we performed the T-maze for three consecutive days by using a modified spontaneous alternation protocol, as previously described (Wu et al. 2018). The T-maze test is performed in a “T-shaped” apparatus (starting arm: 30 × 10 × 20 cm, goal arm: 30 × 10 × 20 cm) with two goal arms, which measures exploratory behavior and working memory function in mouse models of neurological disorders. Mice were placed at the base of the T-maze arm and could choose between entering either right or left goal arms. Repeated trials should indicate that mice show a tendency to explore a novel arm (i.e., alternate choices between trials). Therefore, animals will alternate goal arms within each trial (i.e., right arm followed by left arm = correct alternation). Animals with neurological deficits are more inclined to choose the same arm over multiple runs (i.e., right arm followed by right arm = incorrect alternation). The experiments were conducted in a dark room with 2 trials/day for each mouse at 20 min intervals for 3 consecutive days. After completion of behavior trials, bedding was changed, and the testing arena was cleaned with 70% ethanol to eliminate scent bias. Experimenters were not blinded during T-maze behavioral analysis. The spontaneous alternation rate was calculated as follow:
RNA sequencing and analysis
Wild-type and PRMT8−/− hippocampi were isolated for low-input whole-transcriptome RNA sequencing. RNA was isolated using PicoPure RNA isolation kit (Applied Biosystems, Foster City, CA). Ribosomal RNA (rRNA) was depleted from total RNA using RiboCop rRNA depletion kits for human/mouse/rat (Lexogen, Vienna, Austria). rRNA depleted samples were amplified using the Single Primer Isothermal Amplification (SPIA) Ovation RNA-Seq System V2 (Tecan Genomics/NuGEN, Redwood City, California). The proprietary strand displacement technology for linear amplification of low-input mRNA generated approximately 10 to 1000 nanograms of double stranded complementary DNA (cDNA). cDNA samples were sheared to an average of 200 nucleotide fragments using the Covaris S2 sonicator set at 4oC with 6 cycles of: duty cycle 10%, intensity 5, 100 cycles/burst for a combined time of 60 seconds. Ten nanograms of sheared cDNA were utilized for library construction using the Ion Xpress Plus HiQ gDNA Fragment Library Preparation kit (Life Technologies, Carlsbad, CA). Barcodes were ligated to cDNA using the Ion Xpress Barcode kit (barcodes 1–16) and cDNA libraries were quantified using Qubit. Quality of total RNA, rRNA depleted RNA, cDNA and cDNA libraries passed assessments by Bioanalyzer. A total of 10 pM of pooled libraries were used for bead preparation, emulsion PCR and DNA enrichment with the Ion PI HQ QT 200 kit on the OneTouch2 (Life Technologies, Carlsbad, CA). Ion Sphere Particle containing 3 libraries were loaded on the Ion PI chip v3 and sequenced using the Ion Torrent Proton. BAM files containing sequenced reads were imported into CLC Genomics Workbench for mapping and downstream differential gene expression analyses (version 20.0.2, QIAGEN, Hilden, Germany). Mouse reference genome Mm10 was used as mapping template. Mapping parameters were as followed: use spike-in controls = no, Mismatch cost = 2, Insertion cost = 3, Deletion cost = 3, Length fraction = 0.8, Similarity fraction = 0.8, Global alignment = no, Strand specific = both, Library type = bulk, Maximum number of hits for a read = 10, count paired reads as two = no, Expression value = RPKM, Calculate expression for genes without transcripts = no. For wildtype, 4 samples were sequenced with a total of 155,018,175 mapped reads; and for PRMT8 knockout with a total of 148,304,145 mapped reads. All datasets passed quality control assessment by boxplot, volcano plot and AB plot analyses. Experimenters were not blinded during RNAseq analysis. Wildtype versus PRMT8 knockout statistical comparisons with associated p values and FDR-adjusted p values were generated by CLC differential expression for whole transcriptome RNA-Seq. Genes were considered expressed in a group if mean RPKM (reads per kilobase million) was >1.
Real-time RT-qPCR:
RNA was extracted from mouse hippocampal tissue using the QIAGEN RNeasy Mini Kit (Cat. No. 74104, QIAGEN, Hilden, Germany) and the quantity/quality of the RNA was assessed by A260/A280 and A260/A230 ratios via the NanoDrop apparatus (Thermo Fisher Scientific, Waltham, MA). cDNA synthesis was performed in 20μL reaction containing 500 ηg total RNA using SuperScript™ III Reverse Transcriptase (Cat. No. 18080051, Thermo Fisher Scientific, Waltham, MA) according to the manufacturer’s recommendations in a T100™ Thermal Cycler (BioRad, Hercules, CA). qPCR was performed in CFX96 Real-Time PCR Detection System using iQ™ SYBR® Green Supermix (Cat. No. 1708886, Bio-Rad, Hercules, CA). The PCR mix consisted in 0.4 μL of cDNA, 10 μL of iQ™ SYBR® Green Supermix (Invitrogen, Carlsbad, CA), 200 ηM of each primer, and nuclease free water for 20μL final volume reaction. The cycling conditions for the qPCR amplification were as follows: 95°C for 3 min, 95°C for 10 s, 60°C for 30 s for 40 cycles. Target genes were normalized with internal control with β-actin (forward 5’-AGCCATGTACGTAGCCATCC-3’ and reverse 5’-CTCTCAGCTGTGGTGGTGAA-3’) or GAPDH (forward 5’-CATCACTGCCACCCAGAAGACTG-3’ and reverse 5’-ATGCCAGTGAGCTTCCCGTTCAG-3’) (Narayan & Kumar 2012). The primer sequence for mouse PRMT1 to PRMT8 genes were obtained from Primer Bank database and PRMT9 gene from OriGene (Rockville, MD) (Table 1) and synthesized by MilliporeSigma (MilliporeSigma, Burlington, MA). Experimenters were not blinded during experimental procedures. The sequence of the primers for mouse PLD1 and PLD2 were obtained from a previous publication (Kim et al. 2015).
Table 1.
Primers used for Real Time RT-PCR
| Gene | Primer Sequence | Identification |
|---|---|---|
|
| ||
| PRMT1 |
Forward: 5’-TACTACTTTGACTCCTATGCCCA-3’ Reverse: 5’-ATGCCGATTGTGAAACATGGA-3’ |
PrimerBank ID: 2860607a1 |
| PRMT2 |
Forward: 5’-GGAAGACCCCGTGGACTATG-3’ Reverse: 5’-TGTCTCATCGGTGGCCGTAT-3’ |
PrimerBank ID: 117938279c1 |
| PRMT3 |
Forward: 5’-GGGATCGGTCTACCCTGACAT-3’ Reverse: 5’-AGCTTCCGGTATAACTGCTTTC-3’ |
PrimerBank ID: 142347894c3 |
| PRMT4 |
Forward: 5’-ATCGCCCTCTACAGCCATGA-3’ Reverse: 5’-CTGTCTGCCCACACGACTG-3’ |
PrimerBank ID: 189409144c1 |
| PRMT5 |
Forward: 5’-GGAACTCTGAAGCGGCTATGT-3’ Reverse: 5’-CTTCCTGATTAAGGGGCAATAGG-3’ |
PrimerBank ID: 188528623c3 |
| PRMT6 |
Forward: 5’-TACTACGAGTGCTACTCCGAC-3’ Reverse: 5’-CTAAGCGGTAGGCTTCGGT-3’ |
PrimerBank ID: 126432553c2 |
| PRMT7 |
Forward: 5’-TTGCCAGGTCATCCTATGCC-3’ Reverse: 5’-GCCAATGTCAAGAACCAAGGC-3’ |
PrimerBank ID: 21703807c1 |
| PRMT8 |
Forward: 5’-CTCAACACCGTGATCTTTGCC-3’ Reverse: 5’-TCTTCGATTGCTACCACGTACA-3’ |
PrimerBank ID: 357527368c2 |
| PRMT9 |
Forward: 5’-GAGGATACCTGCCTTTGACGGA-3’ Reverse: 5’-CACGCCTTCTTTAATAGCAGGAAC-3’ |
CAT#: MP204539 |
| PLD1 |
Forward: 5’-AGTGCTTCAGACTTGTCCTGGGTT-3’ Reverse: 5’-TATGGTAGCGTTTCGAGCTGCTGT-3’ |
(Kim et al. 2015) |
| PLD2 |
Forward: 5’-TTGCGGAAGCACTGTTTCAGTGTG-3’ Reverse: 5’-TTGTTCTCCGCTGTTTCTTGCCAC-3’ |
(Kim et al. 2015) |
Capillary-based immunoassay via ProteinSimple®
Capillary electrophoresis immunoassay, or Simple Western analyses, were performed using the Wes™, according to the manufacturer’s protocol (ProteinSimple, Bio-techne, Minneapolis, MN). Whole-tissue protein was extracted from hippocampal tissue using T-PER® Tissue Protein Extraction Reagent (Cat. No. 78510, Thermo Fisher Scientific, Waltham, MA) with Halt™ Protease Inhibitor Cocktail (Cat. No. 87785, Thermo Fisher Scientific, Waltham, MA). Tissue lysates were diluted in sample buffer (Protein Simple®) to achieve a final concentration of 1 μg/μl and added to a master mix (ration 4:1 of protein: master mix) containing 40 mM fluorescent molecular weight marker with dithiothreitol (DTT). Samples were denatured at 95°C for 5 minutes before being loaded into a 25 well plate and capillary for a 12–230 kDa protein size. All antibodies were diluted using an antibody diluent (Protein Simple, Bio-techne, Minneapolis, MN) as follow: PRMT1 (1:20, RRID: AB_2253021), nNOS (1:200, RRID: AB_2152485), eNOS (1:200, AB_10850618), iNOS (1:50, AB_2687529),(Cell Signaling Technology, Danvers, MA), Iba1 (1:50, Cat. No. GTX1000042) (GeneTex, Irvine, CA). Antibodies targets were detected with an HRP-conjugated secondary anti-rabbit, -mouse, and -goat. Experimenters were not blinded during protein analysis. The relative amount of protein was determined using the areas under peaks from chemiluminescence chromatograms obtained via the Compass for SW software (version 4.0.0, Protein Simple, Bio-techne, Minneapolis, MN). Each protein peak was measured automatically and normalized with respect to the total protein capillary chemiluminescence. Protein values were calculated and expressed as peak intensity divided by the Total protein loading control (Protein Simple®, Bio-techne, Minneapolis, MN).
Immunofluorescence and Immunohistochemistry
Mice were anesthetized with 4% isoflurane, and perfused transcardially with 1 X phosphate buffered saline (PBS, 20ml, Cat. No. AAJ62036-K7, VWR, Radnor, PA), followed by 4% paraformaldehyde (Cat. No. P6148, MilliporeSigma, Burlington, MA) in 0.1 mmol/L PBS. The brains were removed and fixed in 4% paraformaldehyde overnight at 4°C immediately after perfusion. The brains were dehydrated in 30% sucrose (Cat. No. S9378, MilliporeSigma, Burlington, MA) in 0.1 mmol/L PBS for 72 h at 4°C before sectioning. The brains were sectioned into 30 μm sections on a sliding microtome with a freezing stage (Leica Biosystems, SM2000R) in NEG-50™ sectioning media (Cat. No. 6502, Thermo Fisher Scientific, Waltham, MA, USA), and placed on a 24 well dish in 1 X PBS before mounting them on adhesion slides (Cat. No. M1000W, StatLab, McKinney, TX). The sections were washed with 0.3% TritonX-100 (Cat. No. T8787, MilliporeSigma, Burlington, MA) in 1X PBS, blocked with 1% bovine serum albumin (BSA, Cat. No. 97061–420, VWR, Radnor, PA) and 0.3% TritonX-100/PBS for at least 2 h at room temperature, and then incubated overnight at 4°C with 1:1000 rabbit anti-ionized calcium binding adaptor molecule 1 (anti-Iba1; RRID: AB_839504, Wako Chemicals Inc., Richmond, VA, USA) primary antibody for visualization of microglia. The sections were then incubated for 2 h with 1:1000 AlexaFluor 488 anti-rabbit IgG (RRID: AB_2534114, Thermo Fisher Scientific, Waltham, MA), followed by 10 min with 1:1000 4’,6-Diamidino-2-phenylindole dihydrochloride (DAPI, Cat. No. D9542, MilliporeSigma, Burlington, MA) at room temperature. Slides were mounted with coverslips and imaged on a fluorescence microscope (Nikon A1R Confocal & Super Resolution System, Nikon, Tokyo, Japan). Experimenters were not blinded during immunohistochemistry and immunofluorescence analysis
PRMT8 antibody specificity
Antibody labeling of endogenous PRMT8 has been a major issue in the field of PRMT research due to the lack of a specific and accurate antibody (Lee et al. 2005; Kousaka et al. 2009). Here, we used a PRMT1 antibody (Cell Signaling Technologies, RRID: AB_2253021) to analyze the protein expression of PRMT1/PRMT8 through the protein simple Wes™ high dynamic range analysis. The exact specificity of the peptide antigen sequence used to produce PRMT1 from Cell Signaling is proprietary; however, its epitope binding area corresponds to the residues surrounding Leu347 of the PRMT1 protein. In this catalytic region, PRMT1 and PRMT8 are almost identical (>90% sequence homology) (Hung & Li 2004; Wang & Li 2012). When determining the expression of PRMT1 in WT mice we observed a double peak at the 43–45 kDa region and at the 49–51 kDa region (Wu et al. 2021). The predicted molecular weight of PRMT1 is ~41 kDa, whereas the PRMT8 predicted molecular weight is higher (~48kDa) due to its additional N-terminus myristylation motif. The expression of the second peak (49–51 kDa) was not present in PRMT8−/− hippocampal or cortical tissue (n=14). In addition, overexpression of PRMT8 via AAV-hSYN1-GFP.m-PRMT8-WPRE in PRMT8−/−mice resulted in a second peak at approximately 65–67 kDa (a 20–22kDa difference) due to the fusion of PRMT8 to GFP (~28kDa). A discrepancy in 6–8kDa (~10% difference) could be partially due to the protein Simple Wes apparatus, which has been reported to have a coefficient of variation of 10%. These findings give us reason to believe that the PRMT1 antibody can also detect PRMT8 protein in the protein Simple Wes apparatus.
Culture of primary cortical neurons
Neuronal cell cultures were prepared from postpartum (P0-P2 day old) WT or PRMT8−/− pups. Mice were anesthetized with 4% isoflurane, sacrificed, and the cortex was quickly isolated and dissected. Next, the cortical tissue was cut into small ~ 2 mm pieces, and the tissue was digested at 37ᴼC with 0.25% trypsin (Cat. No. 25200056, Thermo Fisher Scientific, Waltham, MA) for 20 minutes. Cells were washed with MEM Eagle’s with Earle’s BSS (Cat. No. 11095080) supplemented with 10% heat inactivated FBS (Cat. No. 26140079), 1 mM sodium pyruvate (Cat No. 11360070), and 1% penicillin/streptomycin (Cat No. 15140122, Thermo Fisher Scientific, Waltham, MA). Afterwards, the tissue was gently triturated with a glass Pasteur pipet, followed by another round of trituration with a flamed-tip glass Pasteur pipet. The cell solution was filtered through a 70 μm strainer into a 50mL conical tube (Cat. No.89039–656, VWR, Radnor, PA). Cells were resuspended and plated in a 96 well plate (Cat. No.10861–562, VWR, Radnor, PA) for PLD enzymatic activity assay. After 4 hours in vitro, plating media (MEM, Thermo Fisher Scientific, Waltham, MA) was replaced with maintenance media composed of Neurobasal medium supplemented with B-27 (Cat No. A3653401, Thermo Fisher Scientific, Waltham, MA), 2 mM GlutaMAX™ (Cat. No. 35050079), and 1% penicillin/streptomycin (Cat No. 15140122, Thermo Fisher Scientific, Waltham, MA). Cells were fed every 3–4 days with Neurobasal media containing 1 μM of Cytarabine (Cat. No. PHR1787, MilliporeSigma, Burlington, MA). All cultures were kept in an incubator (Heracell VIOS 160i, Thermo Fisher Scientific) at 5% CO2 and 37 °C and used within 3–14 days in vitro. No pooling was performed in these experiments, as each sample consisted of one individual mouse pup (n=1). The total number of pups utilized for these experiments were 5 mice per group (i.e., 5 WT, 5 WT + PLD inhibitor, 5 PRMT8−/− and 5 PRMT8−/− + PLD inhibitor). Experimenters were not blinded during neuronal culture related experiments.
Amplex™ Red Phospholipase D Assay Kit
Phospholipase D activity was detected in vitro via 10-acetyl-3,7-dihydroxyphenoxazine (Amplex™ Red reagent), a sensitive fluorogenic probe for hydrogen peroxide, according to the manufacturer’s instructions (Cat No. A12219, Thermo Fisher Scientific, Waltham, MA). A 10 mM stock solution of Amplex™ Red was prepared by adding 100 μL of DMSO and immediately added to the 1X reaction buffer consisting of 100 μM Amplex™ Red, 2 U/mL HRP, 0.2 U/mL choline oxidase, and 0.5 mM lecithin. The reaction was initiated by adding 100 μL of the reaction buffer to the primary cortical neurons in the 96 well-plate. Neurons were incubated at 37ᴼC for 30 min, protected from light. Fluorescence was measured in a microplate reader (CLARIOstar Plus, BMG Labtech, Cary, NC) with an excitation of 530–560 nm and emission detection at ~590 nm.
Choline and acetylcholine quantification
Cortical tissue (10–25 mg) was extracted and homogenized to determine the concentration of choline and acetylcholine (ACh) by a fluorometric assay (Cat. No. ab65345, Abcam, Cambridge, UK). In brief, free choline is oxidized to betaine, via the intermediate betaine aldehyde. The final reaction generates products that interact with the Choline Probe (provided by the manufacturer) to generate fluorescence (Ex/Em 535/587 nm). In addition, acetylcholine is converted to choline by adding acetylcholinesterase to the reaction. The amount of acetylcholine was calculated by subtracting free choline from total choline. The data was normalized to cortical tissue weight.
Phospholipids LC-MS/MS analysis
Immediately after tissue extraction, cortical samples were frozen in liquid nitrogen and stored at −80°C until analysis. Samples were sent to Creative Proteomics for LC-MS/MS analysis. Experimenters were blinded during data acquisition. Briefly, the tissue was homogenized in DI water and the samples were vortexed in a 1:1 mixture with chloroform. Samples were dried under nitrogen gas, weighed, and dissolved in chloroform for analysis. An automated AB Sciex 4000 Q TRAP linear ion trap quadrupole LC-MS/MS mass spectrometer with electrospray ionization source was used to determine the concentration of total lipids within each sample. Two types of scans were used to obtain polar lipid profiles: precursor (Prec) and neutral loss (NL) scans. Scans are specific to particular lipid classes; some classes are analyzed with precursor scans, and others are analyzed with neutral loss scans. The sample was introduced by continuous infusion in solvent into the electrospray ionization source, where lipid molecular ions are produced from the lipid molecules. In our current method, phosphatidylcholine (PC), lysophosphatidylcholine (lysoPC), sphingomyelin (SM) phosphatidylserine (PS), phosphatidylethanolamine (PE), and lysophosphatidylethanolamine (lysoPE) are analyzed as singly-charged positive [M+H]+ ions, monogalactosyl diacylglycerol (MGDG), digalactosyldiacylglycerol (DGDG), phosphatidylglycerol (PG), phosphatidylinositol (PI), phosphatidic acid (PA), and PS are analyzed as singly-charged [M + NH4]+ ions, and lysoPG as negative [M-H]- ions. Lipid levels of each sample were calculated by summing the total number of moles of all lipid species normalized to mol%. Data was expressed as mol% ± SEM. Experimenters were blinded during data acquisition.
Quantification of methylarginines from crude lysates
An equal amount of crude lysate (277 mg) from each sample was processed. Sample preparation, chromatographic separation, and mass spectrometry analysis were performed according to published methods (Lakowski et al. 2015). Experimenters were blinded during data acquisition. To precipitate proteins, trichloroacetic acid (TCA) was added to each lysate to a final concentration of 14% in 6 × 50 mm glass tubes and incubated at room temperature for 10 min. Precipitates were pelleted at 20,000 × g in a tabletop microcentrifuge at 4°C for 30 min. The supernatant was discarded, and the remaining pellet was washed with ice-cold acetone and incubated at 37°C until dry. Glass tubes containing dried, precipitated proteins were added to a glass vial containing 200 μL 6M HCl and incubated in an oven for 20 hours at 110°C under vacuum to hydrolyze the precipitated proteins. Acid hydrolysis was performed using a Pico-Tag™ Workstation (Waters Corp, Milford, MA). Hydrolyzed samples were vigorously resuspended in 300 μL of 10 mM NaH2PO4 buffer (pH 5) and subsequently cleaned via solid phase extraction on MCX Oasis (Waters) cartridges. Purified basic amino acids were eluted from the column in 1 mL of 50% v/v methanol, 40% v/v water, and 10% v/v ammonium hydroxide. Eluted samples were dried in a Savant SC110A SpeedVac Concentrator (Thermo Fisher Scientific, Waltham, MA) using the high temperature setting (65°C).
An Acquity UPLC BEH C18 column (Waters Corp, Milford, MA) was used to chromatographically separate methylarginine species on an Agilent 1290 Infinity LC system using a flow rate of 0.15 mL/min at 45°C. Dried samples were vigorously resuspended in 100 μL mobile phase A (0.1% formic acid and 0.05% trifluoroacetic acid in water) and centrifuged for 30 min at 20,000 × g in a tabletop microcentrifuge to pellet insoluble particles. A volume of 5 μL for each sample was injected onto the column using 100% mobile phase A until 2.9 min at which point a gradient of mobile phase B (0.1% formic acid, 0.05% trifluoroacetic acid and 30% methanol in water) was implemented over 1.1 min until 100% mobile phase B. The total run time for each sample was 5 min, which includes the column pre-equilibration. Samples were subsequently analyzed on an AB Sciex QTrap 5500 triple quadrupole mass spectrometer using Turbo Spray as an ionization source in positive ionization mode. Multiple reaction monitoring (MRM) was used to simultaneously detect analytes. The selected precursor ion for aDMA and sDMA was 203.1 m/z and the precursor ion for MMA was 189 m/z. The selected product ions were 46, 172.1, and 74 m/z for aDMA, sDMA, and MMA, respectively. For each analyte, the declustering potential was 40 V and the cell exit potential (CXP) was 16 V. The collision energy for dimethylarginine species was 30 eV and for monomethylarginine was 25 eV. Each analyte was quantitated by comparing to a standard curve of 20–8000 nM for aDMA and MMA, and 1–5000 nM for sDMA (Lakowski et al. 2015; Lakowski et al. 2013).
Nitrate/Nitrite colorimetric assay
Whole brains were extracted from both normoxic and hypoxic WT and PRMT8−/− mice. Cerebral tissue was homogenized in cold (~4ᴼC) PBS followed by centrifugation at 10,000 × g for 20 min. The supernatant was collected and filtered with a 10 kDa molecular weight ultrafilter (Cat. No. MRCPRT010, Millipore, Burlington, MA) according to manufacturer’s instructions. Nitrate and Nitrite concentrations were measured according to the manufacturer’s protocol (Cat. No. 780001, Cayman Chemical, Ann Arbor, MI). Briefly, 80 μL of protein samples were combined with 10 μL of enzyme cofactor, and 10 μL nitrate reductase in a 96-well plate. After 3 hours, 100 μL Griess reagents were added and allowed to incubate for 30 minutes. A control curve provided by the manufacturer was used to determine nitrate and nitrite concentrations. The changes in absorbance were measured at 550 nm. The amount of nitrate-nitrite was expressed as μM of nitrate/nitrite. Experimenters were not blinded during nitrate/nitrite analysis.
Functional hippocampal mitochondria metabolic analysis
Mitochondrial oxygen consumption rate (OCR) was measured with a Seahorse XFe24 Analyzer (Agilent Technologies, Santa Clara, CA). Wild-type and PRMT8−/− were anesthetized with 4% isoflurane, decapitated, and the brains were quickly removed and placed in a beaker with artificial cerebral spinal fluid (aCSF) buffer [120 mM NaCl (Cat. No. S7653), 3.5 mM KCl (Cat. No. P9333), 1.3 mM CaCl2 (Cat. No. C1016), 1 mM MgCl2 hexahydrate (Cat. No. M9272), 0.4 mM KH2PO4 (Cat. No. P5655), 5 mM HEPES (Cat. No. H7006), 10 mM glucose (Cat. No. G7528), and 1 mg/ml of bovine serum albumin, at a 7.4 pH at 4 °C (MilliporeSigma, Burlington, MA)]. Coronal slices of 200 μm in thickness were sectioned using a Leica VT1000E vibratome in aCSF at 4°C and transferred into a petri dish with aCSF at room temperature. To obtain consistent sections for analysis, we used 1-mm biopsy punch (Cat. No. 96–0192, Sklar Instruments, West Chester, PA). Each tissue section was loaded into a different well of the XFe Islet Capture Microplate (Cat. No. 103518–100; Agilent Technologies, Santa Clara, CA) containing 700μl of aCSF. After 30 min of equilibration in room temperature, the microplate was incubated at 37°C for 1 h, per standard Agilent Technologies protocol, to allow for temperature and pH equilibration. Assay protocol consisted of a combination of 3-min mix, 3-min wait, and 2-min measurement sequences. OCR was measured for 3 times before the 1st and 2nd injection, 8 times after the 2nd injection, 3 times after the 3rd injection, and 10 times after the 4th injection. Hippocampal OCR was measured and plotted at basal conditions followed by sequential addition of I) aCSF media (to maintain tissue viability), II) 20 μg/ml oligomycin (ATP‐synthase inhibitor, Cat. No. O4876), III) 10 μM Carbonyl cyanide 4-(trifluoromethoxy) phenylhydrazone (FCCP, a mitochondrial uncoupler, Cat. No. C2920), and IV) 20 μM antimycin A (a complex III inhibitor, Cat No. A8674). Mitochondrial metabolic parameters, including basal respiration, ATP production, proton leak-linked respiration, and reserve capacity were calculated based on the average of tissue sections which displayed an optimum OCR of 40–210 pmol/min. Tissue sections that displayed OCR measurements below 40 pmol/min or above 210 pmol/min resulted in erratic and unreliable O2 readings, which suggests unhealthy hippocampal tissue sections. Thus, tissue sections with OCR measurements <40 pmol/min or >210 pmol/min were excluded from the analysis (Underwood et al. 2020; Wu et al. 2021). Experimenters were not blinded during mitochondrial function analysis. All drugs for these experiments were purchased from MilliporeSigma (MilliporeSigma, Burlington, MA).
Cytokine array
Mouse hippocampal tissue homogenates (1μg/μl) were used to quantify inflammatory mediators via ELISA-based quantitative array platform according to the manufacturer’s instructions (Cat. No. QAM-INF-1, RayBiotech, Peachtree Corners, GA). The ELISA-based cytokine array tested for the expression of TNF-α in mouse hippocampal protein lysates. Protein levels were quantified via the detection of streptavidin-conjugated fluorescent dye (Cy3 equivalent) as a reporter. The signal was measured via a laser scanner at a wavelength of 532 nm by the manufacturer. All arrays were normalized with internal positive and negative controls. Experimenters were blinded during data acquisition.
Intravital leukocyte imaging with two-photon scanning laser microscopy (TPLSM)
Wild-type and PRMT8−/− were anesthetized with 3% isoflurane and maintained with 1–1.5% isoflurane in 0.9 L of O2 in a stereotaxic device using a nose cone. Body temperature was kept at 37 °C and monitored by a reference rectal probe and heating pad was used to prevent hypothermia. The mouse skull was thinned to image cerebral microvessels. The thinned-skull window method is a modified method from Xu et al. (Xu et al. 2007). A midline longitudinal scalp incision extending from the neck region (between the ears) to the frontal portion of the head was made with microsurgical tools. A thinned-skull circular window was made with a high-speed microdrill (∼2 mm in diameter) 1mm lateral to the bregma. After thinning the skull, the mouse was placed on a TPLSM (Zeiss LSM 510 Multiphoton Confocal, Wetzlar, Germany) while maintaining the body temperature constant at 37 °C by a heating blanket.
A 20 X water immersion objective (Olympus XLUMPlanFl, Olympus Corporation, Tokyo, Japan) was lowered in proximity to the thinned-skull window. Fluorescent images were captured (every 5 to 15 minutes) at an excitation wavelength of 910 nm with the intravenous introduction of low molecular weight fluorescein isothiocyanate (FITC)-dextran (0.2 mg/kg, IV, Cat. No. FD2000S, MilliporeSigma, Burlington, MA) to visualize microvessels and red blood cells, and a wavelength of 750 nm for acridine orange solution (7 mg/kg, IV, Cat. No. 318337, MilliporeSigma, Burlington, MA) to visualize leukocytes (Cahoon et al. 2014; Wu et al. 2020). Cortical cerebral blood vessel images were captured at 20 X and 200 X. In order to measure capillary leukocyte rolling velocity, only vessels with diameters between ~5 to 10 μm were considered for TPLSM studies. Linescans for leukocyte velocity measurements were captured and analyzed with ImageJ analysis software. Each velocity measurement was calculated by measuring the slope of leukocytes (10 lines) representing 10 leukocytes traversing at a point in time of the linescan. The slopes were calculated and averaged based on linescan images. The data was expressed as percent change in flow. This was achieved by utilizing each mouse as its’ own internal control. Baseline measurements before hypoxia treatment were used for normalization of the data. Experimenters were not blinded during intravital leukocyte imaging. Statistical analysis was evaluated by paired-samples t-test.
Statistical analyses
Sample sizes for the studies were not predetermined by statistical methods. The number of animals was based on previous publications, including: (Lee et al. 2017; Lee et al. 2019; Lee et al. 2020; Wu et al. 2021). No assessment of the normality of data was performed. A p value of < 0.05 level of probability was considered significant. The Grubbs’ test was utilized to identify outliers. Results were expressed as means ± S.E.M. Statistical analysis were evaluated by student’s t-test, paired-samples t-test, and by one-way ANOVA (Tukey’s post-hoc test) as appropriate with Graph-pad Prism v.8.0.2 (San Diego, CA).
Results
PRMT8−/− does not exhibit compensatory mechanisms for other PRMT family members
The homozygous mouse line PRMT8 tm1a(EUCOMM)Wtsi allele (PRMT8−/−) was generated from the European Conditional Mouse Mutagenesis Program (EUCOMM). The deletion of the active site of PRMT8 was confirmed by polymerase chain reaction (PCR) (Fig. 2A), quantitative real-time RT-qPCR (Fig. 2B–D), and via RNAseq (Supplemental Fig. 1). The mRNA expression of PRMT8 in the cortex was decreased by 97.1% ± 0.31% (p<0.0001) and by 97% ± 0.27% (p<0.0001) in the hippocampus of PRMT8−/− mice as compared to WT mice (PRMT8+/+) (Fig. 2B). We detected no difference in any other PRMT family members in either cortex or hippocampus of PRMT8−/− mice (Fig. 2C–D). We also performed RNA-seq analysis to further confirm the genetic deletion of PRMT8 in PRMT8−/− mice (−2.46 log-fold change) as compared to WT mice (p<0.001) (Supplemental Fig. 1). In addition, PRMT8−/− mice were viable and fertile with no distinct phenotype from WT mice [for characterization paradigm of primers see methods].
Figure 2. Confirmation of PRMT8−/− knockout mice.

(A) Polymerase chain-reaction (PCR) was used to determine genomic DNA from the tails of wild-type (WT) mice and PRMT8−/− (knockout) mice. “M” indicates DNA ladder with 100 base pair increments. Genotyping was confirmed via the 252 base pair product generated from PRMT8−/− mice. (B) PRMT8 mRNA reverse transcription real-time qPCR (RT-qPCR) in cortex and hippocampus of WT and PRMT8−/− mice. (C, D) Quantification from RT-qPCR of other PRMT family members in cortex (C) and hippocampus (D). Results were expressed as fold-change ± SEM; n indicates number of animals, *p ≤ 0.05 indicates significantly different from wild-type (WT) background mice (C57BL/6J), evaluated by Student’s t-test.
PRMT8 modulation does not affect methylarginines
As a type I PRMT enzyme, PRMT8 activity produces monomethylarginine (MMA) and asymmetric dimethylarginine (aDMA) on proteins (Couto et al. 2020). Therefore, we measured liberated methylarginines via LC-MS to determine the levels of MMA, aDMA, and sDMA on proteins. To our knowledge this is one of the first experiments that investigates methylarginine levels in mice lacking PRMT enzymes. Our results suggest that there were no significant changes in MMA (1603 ± 53.6 nM), aDMA (3253 ± 195 nM), or sDMA (390 ± 11.8 nM) on proteins in the hippocampus of PRMT8−/− mice as compared to WT [1448 ± 194 nM (p=0.879), 3008 ± 405 nM (p=0.946), 330 ± 44.6 nM (p=0.607), respectively] (Fig. 3A–C). These findings were not different in either hypoxic WT [MMA: 1315 ± 171 nM (p=0.918), aDMA: 2167 ± 362 nM (p=0.273), sDMA: 249 ± 40 nM (p=0.366)] nor hypoxic PRMT8−/− [MMA: 1387 ± 149 nM (p=0.994), aDMA: 2003 ± 184 nM (p=0.293), sDMA: 266 ± 34.8 nM (p=0.709)] mice (Fig. 3A–C)
Figure 3. PRMT8−/− does not affect methylarginine levels, nitric oxide intermediates, and nitric oxide synthase (NOS) expression.

Mouse hippocampus were harvested after hypoxic challenge to measure arginine substrates, including asymmetric dimethylarginine (aDMA) (A), monomethylarginine (MMA) (B), symmetric dimethylarginine (sDMA) (C) on proteins. Whole-brain tissue was used to measure total nitrate+nitrite (D), nitrite (E), and nitrate (F) concentrations before and after hypoxic stress. (G) Representative images are presented as synthetic bands from capillary-based immunoassay in the mouse hippocampus. Each lane corresponds to an individual capillary electrophoresis protein sample, in which the conditions of adjacent lanes are fully independent. Neuronal NOS (nNOS) (H), endothelial NOS (eNOS) (I), and inducible NOS (iNOS) (J) protein expressions were measured and quantified via ProteinSimple ® capillary electrophoresis system. Results were expressed as mean ± SEM; n indicates number of animals, evaluated by one-way ANOVA with Tukey’s post-hoc test.
PRMT8 does not influence nitric oxide levels in the cortex and hippocampus
Since aDMA is an endogenous inhibitor of nitric oxide synthase (NOS), we measured the concentration of nitrous oxide via its stable intermediates: nitrite (NO2), and nitrate (NO3). Our results suggest that there were no significant differences in total nitrate + nitrite (8.20 ± 1.17 μM), nitrite (4.92 ± 0.86 μM) or nitrate (3.27 ± 0.30 μM) in PRMT8−/− mice as compared to WT [9.24 ± 3.89 μM (p=0.987), 5.69 ± 2.88 μM (p=0.987), 3.54 ± 1.01 μM (p=0.987), respectively] (Fig. 3D–F). Under hypoxic challenge, total nitrate + nitrite, nitrite, and nitrate were not affected in WT [10.62 ± 1.77 μM (p=0.969), 6.71 ± 1.31 μM (p=0.969), 3.90 ± 0.46 μM (p=0.969), respectively] nor PRMT8−/− mice [9.42 ± 0.33 μM (p=0.999), 5.82 ± 0.24 μM (p=0.999), 3.59 ± 0.08 μM (p=0.999), respectively]. We further verified these results by measuring the expression of neuronal NOS (nNOS), endothelial NOS (eNOS), and inducible NOS (iNOS). The expression of nNOS (0.34 ± 0.02), eNOS (0.17 ± 0.02), and iNOS (0.017 ± 0.003) were not significantly different in PRMT8−/− as compared to WT mice [033 ± 0.03 (p=0.994), 0.17 ± 0.02 (p=0.999), 0.02 ± 0.001 (p=0.577), respectively]. In addition, after hypoxia, there were no significant differences in the expression of nNOS (0.30 ± 0.01), eNOS (0.14 ± 0.01), and iNOS (0.014 ± 0.001) in PRMT8−/− as compared to WT hypoxic mice [0.31 ± 0.03 (p=0.994), 0.21 ± 0.02 (p=0.605), 0.013 ± 0.001 (p=0.995), respectively] (Fig. 3G–J).
Overexpression of PRMT8 via injection of AAV-PHP.eB
PRMT8−/− mice (3–4 weeks old) received a single retro-orbital injection of an AAV vector containing a human synapsin promotor to drive the expression of a mouse PRMT8 protein fused with GFP (AAV-hSYN1-GFP.m-PRMT8-WPRE) as part of a gain-of-function experiment. Four weeks after injection, we validated the expression of PRMT8 via GFP-tagged immunofluorescence (Fig. 4A–D), and PRMT8 protein expression in both cortex [WT:0.032 ± 0.004 vs. PRMT8−/−: 0.00 ± 0.00 vs. PRMT8−/− AAV-PHP.eB:0.74 ± 0.20 (p<0.0001)] and hippocampus [WT:0.032 ± 0.001 vs. PRMT8−/−: 0.00 ± 0.00 vs. PRMT8−/− AAV-PHP.eB:1.34 ± 0.26 (p<0.0015)]. These results suggest that the AAV construct for PRMT8 can enhance PRMT8 total protein levels (Fig. 4E–F).
Figure 4. Overexpression of PRMT8 via AAV.PHP.eB.

Representative image of coronal (A, B) and sagittal (C, D) sections of GFP-fused PRMT8 protein 4 weeks after intravenous injection of vehicle or AAV treatment, vector genomes/kilogram (vg/kg). Cortical (E) and hippocampal (F) PRMT8 protein expressions were measured 4 weeks after intravenous administration of the PRMT8 vector (AAV-PHP.eB-hSYN1-GFP.m-PRMT8-WPRE). Results were expressed as mean ± SEM; n indicates number of animals. *p ≤ 0.05 indicates significantly different from all other groups, evaluated via one-way ANOVA with Tukey’s post-hoc test.
Phospholipase D function was not altered in PRMT8−/− mice
Since Kim et al. (2015) previously suggested that PRMT8 can function as a phospholipase D (PLD)-like enzyme, cleaving phosphatidylcholine into phosphatidic acid and choline, we measured if the deletion of PRMT8 can affect PLD1 and PLD2 mRNA expression (Kim et al. 2015). Our findings suggest that there was no significant difference in the mRNA expression of PLD1 (0.83 ± 0.08) or PLD2 (0.81 ± 0.08) in PRMT8−/− as compared to WT mice (1.01 ± 0.07 (p=0.146), 0.96 ± 0.05 (p=0.134), respectively) (Fig. 5A–B). To further confirm these findings, we measured PLD activity in primary cortical neurons from both WT and PRMT8−/− mice. We detected no differences in PLD enzymatic activity between PRMT8−/− (99.23% ± 5.41 %) and WT cortical neurons (100.0% ± 1.76%, p=0.999) (Fig. 5C). We utilized the PLD1 inhibitor VU0359595 to confirm both cell and enzyme viability. Treatment with 10 μM of VU0359595 reduced PLD activity in both WT (77.89% ± 2.61%, p<0.01) and PRMT8−/− cortical neurons (68.79% ± 4.95%, p<0.001) (Fig. 5C).
Figure 5. Phospholipase D (PLD) expression and activity were not changed in cortical tissue and primary cortical neurons from PRMT8−/− mice.

The hippocampus of WT and PRMT8−/− mice were analyzed with RT-qPCR for the expression of PLD1 (A) and PLD2 (B) mRNA. (C) PLD activity was measured in WT and PRMT8−/− primary cortical neuron cells via the Amplex™ Red Phospholipase D Assay Kit. Cells were treated with 10 μM of PLD inhibitor (VU0359595) as a control to establish cell/enzyme viability in both WT and PRMT8−/− cultured neurons. Results were expressed as mean ± SEM; n indicates number of animals (A,B) and independent cell culture preparations (C). *p ≤ 0.05 indicates significantly different from indicated groups, evaluated by Student’s t-test.
PRMT8−/− mice exhibited changes in membrane phospholipid composition
We measured the concentration of phospholipids (i.e., phosphatidylcholine and phosphatidic acid) in the cortex of WT, PRMT8−/−, and overexpressed PRMT8 mice in normal and hypoxic conditions. PRMT8−/− mice presented with reduced choline (1.72 ± 0.41 pmol) and acetylcholine (0.34 ± 0.09 pmol) as compared to WT mice [5.14 ± 0.55 pmol (p<0.001), 1.50 ± 0.29 pmol (p<0.001), respectively] (Fig. 6A–B). After hypoxic stress, we observed a significant decrease in choline (2.92 ± 0.43 pmol, p<0.01) and acetylcholine (0.40 ± 0.12 pmol, p<0.001) in PRMT8−/− as compared to WT control mice (Fig. 6A–B). Overexpression of PRMT8 did not alter either choline (2.47 ± 0.18 pmol, p=0.898) or acetylcholine (0.07 ± 0.02 pmol, p=866) as compared to PRMT8−/− mice. We did not detect any other significant differences in choline or acetylcholine in hypoxic PRMT8−/− [2.52 ± 0.41 pmol (p=0.840), 0.36 ± 0.17 pmol (p=0.999), respectively], or hypoxic overexpressed PRMT8 (1.72 ± 0.93 pmol (p=0.916), 0.15 ± 0.02 pmol (p=0.999), respectively) mice versus their respective counterparts (Fig. 6A–B).
Figure 6. PRMT8 mediates membrane phospholipids.
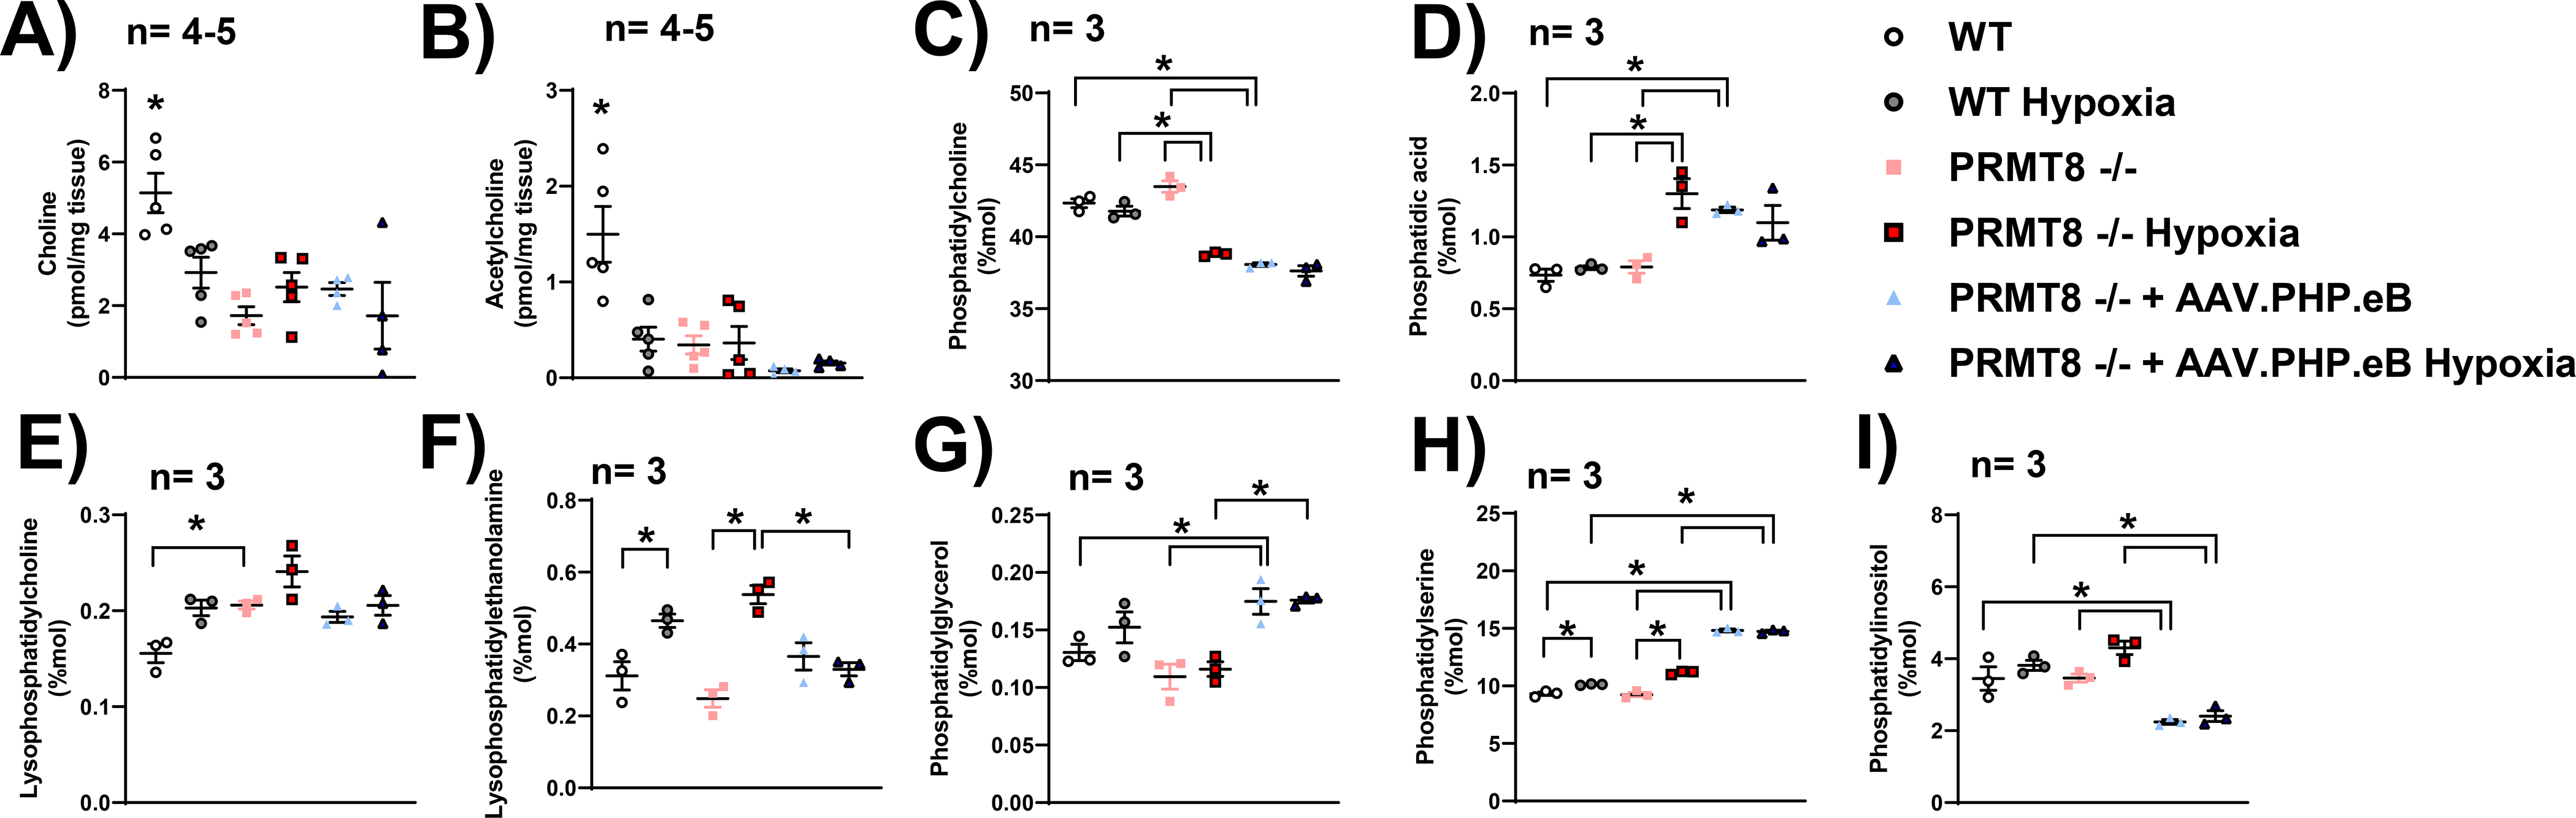
(A) Choline and (B) acetylcholine (B) concentrations were measured in the cortex of WT and PRMT8−/− via a choline/acetylcholine fluorometric assay. Phosphatidylcholine (C), phosphatidic acid (D), lysophosphatidylcholine (E), lysophosphatidylethanolamine (F), phosphatidylglycerol (G), phosphatidylserine (H), and phosphatidylinositol (I) were measured by LC-MS/MS in the cortex of WT and PRMT8−/− mice. Results were expressed as mean ± SEM; n indicates number of animals. *p ≤ 0.05 indicates significantly different from indicated groups, evaluated via one-way ANOVA with Tukey’s post-hoc test.
Our group also measured phosphatidylcholine and phosphatidic acid via LC-MS analysis. We observed no differences in phosphatidylcholine (43.49 ± 0.40 mol%) nor phosphatidic acid (0.79 ± 0.04 mol%) levels in the cortex of PRMT8−/− mice as compared to WT mice (42.34 ± 0.30 mol% (p=0.134), 0.73 ± 0.04 mol% (p=0.991), respectively) (Fig. 6C–D). However, we detected a significant decrease in phosphatidylcholine (38.80 ± 0.08 mol%), and an increase in phosphatidic acid (1.30 ± 0.10 mol%) in hypoxic PRMT8−/− mice as compared to WT control [42.34 ± 0.30 mol% (p<0.0001), 0.73 ± 0.04 mol% (p<0.01), respectively], hypoxic WT [41.78 ± 0.34 mol% (p<0.001), 0.78 ± 0.01(p<0.01), respectively] and PRMT8−/− normoxic mice [43.49 ± 0.40 mol% (p<0.0001), 0.79 ± 0.04 mol% (p<0.01), respectively] (Fig. 6C–D). Overexpression of PRMT8 reduced phosphatidylcholine (38.07 ± 0.12 mol%) and enhanced phosphatidic acid levels (1.18 ± 0.02 mol%) as compared to both WT (p<0.0001,p<0.01, respectively) and PRMT8−/− (p<0.0001,p<0.05, respectively). After overexpression of PRMT8, we observed no significant change in phosphatidylcholine or phosphatidic acid as compared to its hypoxic counterpart [37.62 ± 0.36 mol% (p=0.880), 1.09 ± 0.12 mol% (p=0.939), respectively] (Fig. 6C–D).
Additionally, we also measured other active membrane and mitochondrial phospholipids, including lysophosphatidylcholine, lysophosphatidylethanolamine, phosphatidylglycerol, phosphatidylserine, and phosphatidylinositol. We observed a significant increase in lysophosphatidylcholine in PRMT8−/− (0.206 ± 0.004 mol%) as compared to WT (0.1557 ± 0.01 mol%, p<0.05) (Fig. 6E). Under hypoxic stress, we detected an increase in lysophosphatidylethanolamine and phosphatidylserine in both WT (0.46 ± 0.02 mol%,10.12 ± 0.03 mol%, respectively) and PRMT8−/− (0.54 ± 0.02 mol%, 11.16 ± 0.08 mol%, respectively) as compared to WT [0.31 ± 0.04 mol% (p<0.05), 9.32 ± 0.14 mol% (p<0.01), respectively] and PRMT8−/− [0.25 ± 0.03 mol% (p<0.001), 9.25 ± 0.18 mol% (p<0.0001), respectively] normoxic controls (Fig. 6F, H). After hypoxic stress, overexpression of PRMT8 reduced the concentration of lysophosphatidylethanolamine (0.33 ± 0.02 mol%) as compared to hypoxic PRMT8−/− mice (p<0.01) (Fig. 6F). In normoxic conditions, overexpression of PRMT8 resulted in an increase in phosphatidylglycerol (0.175 ± 0.011 mol%), phosphatidylserine (14.82 ± 0.12 mol%), and a reduction in phosphatidylinositol (2.24 ± 0.06 mol%) as compared to WT [0.130 ± 0.007 mol% (p<0.05), 9.32 ± 0.14 mol% (p<0.0001), 3.45 ± 0.32 mol% (p<0.01), respectively] and PRMT8−/− mice [0.109 ± 0.011 mol% (p<0.01), 9.25 ± 0.18 mol% (p<0.0001), 3.46 ± 0.11 mol% (p<0.01), respectively] (Fig. 6G–I). Under hypoxic stress, overexpression of PRMT8 increased phosphatidylglycerol (0.176 ± 0.002 mol%) as compared to PRMT8−/− hypoxia mice [0.116 ± 0.006 mol% (p<0.01)]. After hypoxic stress, overexpression of PRMT8 increased phosphatidylserine (14.75 ± 0.09 mol%), and decreased phosphatidylinositol (2.40 ± 0.15 mol%) as compared to WT hypoxia [10.12 ± 0.03 mol% (p<0.0001), 3.81 ± 0.14 mol% (p<0.01), respectively] and PRMT8−/− hypoxia mice [11.16 ± 0.08 mol% (p<0.0001), 4.30 ± 0.18 mol% (p<0.0001), respectively] (Fig. 6G–I).
Overexpression of PRMT8 restores mitochondrial bioenergetic function
We measured hippocampal mitochondrial respiration ex vivo in WT and PRMT8−/− mice via the Seahorse XFe24 Analyzer (Fig. 7A). Our results from real‐time oxygen consumption rate of 200 μm hippocampal coronal slices suggest that PRMT8−/− mice reduced basal respiration (89.12 ± 9.34 pmol/min), maximal oxygen consumption rate (98.60 ± 8.95 pmol/min), and ATP production (50.00 ± 4.58 pmol/min), while not affecting ATP-linked respiration (56.75 ± 7.11 pmol/min) as compared to WT hippocampal tissue [137.9 ± 4.48 pmol/min (p<0.05), 153.60 ± 5.11 pmol/min (p<0.01), 80.14 ± 2.91 pmol/min (p<0.01), 83.24 ± 2.79 pmol/min (p=0.096), respectively] (Fig. 7B–F). After hypoxic stress, WT mice presented with a reduction in ATP production (57.80 ± 9.13 pmol/min, p<0.05) and ATP-linked respiration (46.00 ± 10.24 pmol/min, p<0.01) as compared to normoxic WT mice. Interestingly, our analysis of the respiratory reserve capacity, calculated by subtracting basal oxygen consumption rate from FCCP enhanced oxygen consumption, was significantly decreased in PRMT8−/− (−2.03 ± 2.84 pmol/min) as compared to WT (11.97 ± 2.81 pmol/min, p<0.05) (Fig. 7E). Under hypoxic stress, PRMT8−/− mice presented with a severe reduction in reserve capacity (−16.74 ± 1.53 pmol/min) as compared to WT (11.01 ± 2.69 pmol/min p<0.0001), hypoxic WT (16.77 ± 2.35 pmol/min, p<0.0001) and its’ normoxic PRMT8−/− counterpart (−2.03 ± 2.84 pmol/min, p<0.05) (Fig. 7E). Overexpression of PRMT8 did not affect basal respiration (121.30 ± 4.39 pmol/min, p=0.179), ATP production (65.42 ± 3.46 pmol/min, p=0.345), and ATP-linked respiration (76.97 ± 3.96 pmol/min, p=0.315) (Fig. 7B, D, F). However, overexpression of PRMT8 significantly increased maximal oxygen consumption rate (130.60 ± 4.10 pmol/min) and mitochondrial reserve capacity (20.47 ± 3.67 pmol/min) as compared to PRMT8−/− mice [83.68 ± 9.77 pmol/min (p<0.05), −2.03 ± 2.84 pmol/min (p<0.0001), respectively] (Fig. 7C, E). Under hypoxic stress, overexpression of PRMT8 in PRMT8−/− mice rescued mitochondrial reserve capacity (127.4 ± 3.37 pmol/min, p<0.0001) as compared to hypoxic PRMT8−/− mice (Fig. 7E).
Figure 7. Overexpression of PRMT8 restores mitochondrial respiration.

Oxygen consumption rate (OCR) was measured in hippocampal slices (200 μm) via the Seahorse XFe24 analyzer. Changes in mitochondrial respiration were manipulated by injection of 20 μg/ml oligomycin (Oligomycin), 1 mM pyruvate and 80 μM carbonyl cyanide 4-(trifluoromethoxy) phenylhydrazone (FCCP), and 20 μM antimycin A (Antimycin A) (A). Basal respiration (B), maximal respiration (C), ATP production (D), reserve capacity (E), and ATP-linked respiration (F) were measured and expressed as mean ± SEM; n indicates number of animals. *p ≤ 0.05 indicates significantly different from indicated groups, evaluated via one-way ANOVA with Tukey’s post-hoc test.
Overexpression of PRMT8 reduced TNF-α levels and microglia activation after hypoxic stress
Recently, neuroinflammation has been extensively associated with derangements in mitochondrial function (Verri et al. 2012; Bajwa et al. 2019; Ferger et al. 2010). Therefore, we measured the levels of tumor necrosis factor alpha (TNF-α), a major pro-inflammatory mediator and inducer of microglia activation (Biesmans et al. 2015), and ionized calcium-binding adapter molecule 1 (Iba1) marker, a microglia/macrophage-specific calcium binding protein associated with activated microglia. PRMT8−/− mice exhibited an increase in TNF-α (168.3 ± 17.02 %) as compared to WT mice (100.0 ± 11.28 %, p<0.05) (Fig. 8A). In addition, we observed that overexpression of PRMT8 reduced the TNF-α levels (74.82 ± 9.29 %) as compared to normoxic PRMT8−/− mice (p<0.01). Under hypoxic stress, overexpression of PRMT8 significantly reduced the expression of TNF-α (72.42 ± 8.88 %) as compared to PRMT8−/− hypoxic mice (p<0.01) (Fig. 8A). The expression of Iba1 was significantly enhanced in both normoxic PRMT8−/− (0.184 ± 0.017) and PRMT8−/− hypoxic mice (0.145 ± 0.01) as compared to normoxic WT (0.104 ± 0.005, p<0.0001) and WT hypoxic mice (0.099 ± 0.005, p<0.05), respectively (Fig. 8A–B). We further confirmed these findings via IHC staining of Iba1 in hippocampal coronal sections (Fig. 8C). Overexpression of PRMT8 significantly reduced the protein expression of Iba1 before (0.012 ± 0.002) and after hypoxia (0.013 ± 0.004) as compared to WT (p<0.0001), WT hypoxia (p<0.0001), PRMT8−/− (p<0.0001), and PRMT8−/− hypoxia (p<0.0001) (Fig. 8A–B). In addition, we also measured leukocyte extravasation/speed into cerebral tissue in vivo via two-photon scanning laser microscopy in both PRMT8−/− and WT mice. After hypoxic stress, we observed that PRMT8−/− (−37.77 ± 14+.88 %) had a significant reduction in rolling leukocyte speed as compared to WT (135.9 ± 32.99 %, p<0.01) (Supplemental Fig. 2). Furthermore, overexpression of PRMT8 was not sufficient to rescue rolling leukocyte speed after hypoxia (−44.57 ± 9.96%, p<0.982) (Supplemental Fig. 2).
Figure 8. Overexpression of PRMT8 reduces TNF-α and microglia activation after hypoxic stress.

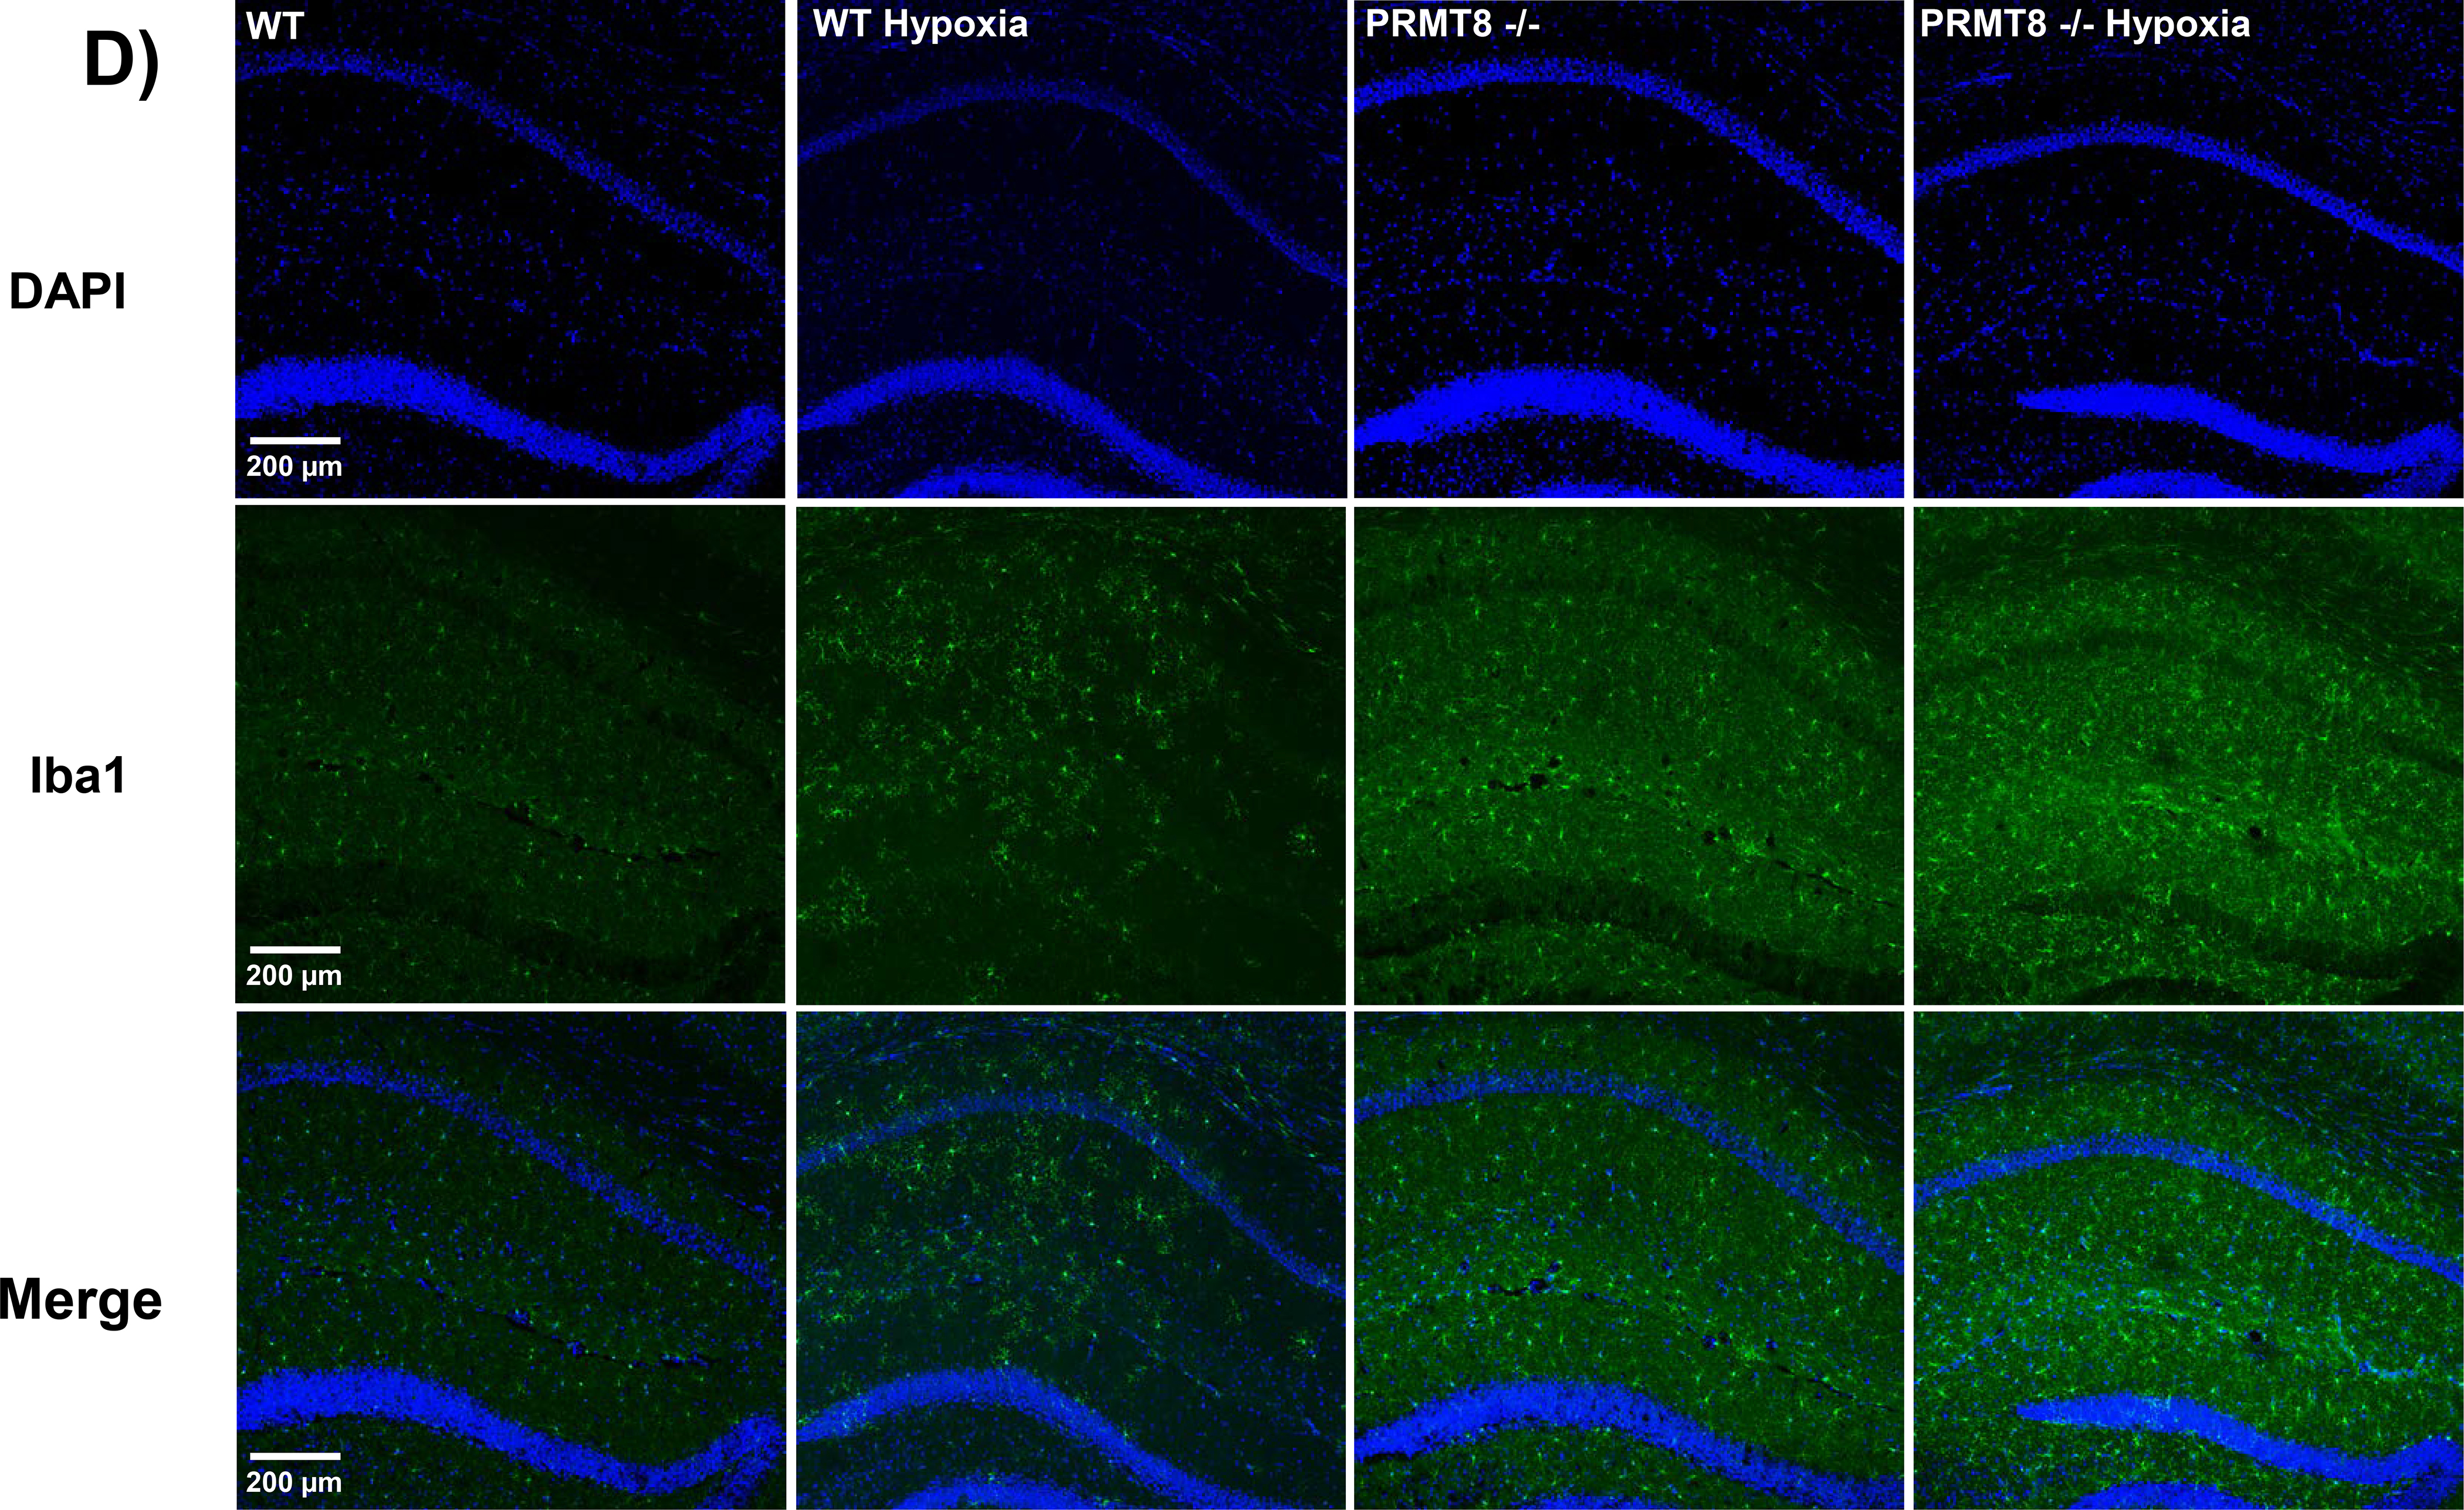
(A) Hippocampal protein levels of TNF-α were measured through an ELISA-based cytokine array. (B) Representative images of synthetic bands from capillary-based immunoassay. Each lane corresponds to an individual capillary electrophoresis protein sample, in which the conditions of adjacent lanes are fully independent. Quantification of ionized calcium binding adaptor molecule 1 (Iba1) expression in hippocampal proteins were summarized in C. (D) Immunohistochemistry was performed in coronal brain sections of the CA1 region of the hippocampus in WT and PRMT8−/− mice +/− hypoxia. Coronal sections were stained with Iba1 (green), a specific marker for microglia activation, and DAPI, a nuclear counterstain (blue), along with merged images (bottom row). vg/kg - vector genomes/kilogram. Results were expressed as mean ± SEM; n indicates number of animals. *p ≤ 0.05 indicates significantly different from indicated groups and respective WT backgrounds, evaluated via one-way ANOVA with Tukey’s post-hoc test.
PRMT8−/− mice exhibited impairments in working memory after hypoxic stress
Given that previous findings characterized PRMT8−/− mice with reduced hippocampus-dependent memory and hyperactive phenotype, we examined if PRMT8 was involved in cognitive/working memory function and motor activity via T-maze and open field, respectively (Kim et al. 2015; Penney et al. 2017). Under hypoxic stress, WT mice exhibited a decrease in alternation rate (37.72 ± 3.33%) as compared to WT control mice (63.33 ± 4.16%, p<0.001) (Fig. 9A). Overexpression of PRMT8 did not affect alternation rate (53.33 ± 4.16%) as compared to PRMT8−/− mice (68.33 ± 6.78 %, p=0.312) and WT mice (p=0.737). However, under hypoxic stress, PRMT8−/− mice (21.93 ± 4.04%) exhibited a significant reduction in working memory function as compared to control PRMT8−/− mice (68.33 ± 6.78%, p<0.0001), and hypoxic WT mice (37.72 ± 3.33%, p<0.05) (Fig. 9A). After hypoxic stress, overexpression of PRMT8 did not affect working memory function (31.48 ± 5.15%) as compared to hypoxic WT (37.72 ± 3.33%, p=0.937) or hypoxic PRMT8−/− mice (21.93 ± 4.04%, p=0.690) (Fig. 9A). We also examined if PRMT8−/− mice displayed a hyperactive phenotype as reported by others (Kim et al. 2015; Penney et al. 2017). Overexpression of PRMT8 did not significantly change total distance traveled (141.5 ± 10.62 m) or time spent in the center (10.95 ± 1.16%) as compared to WT mice [128.1 ± 10.98 m (p=0.378), 8.74 ± 1.23% (p=0.846), respectively] or PRMT8−/− [147.7 ± 8.52 m (p=0.999), 11.26 ± 1.47% (p=0.999), respectively] (Fig. 9B–C).
Figure 9. PRMT8−/− mice reduced short-term memory after hypoxic stress.

(A) Short-term memory (T-maze) was assessed via spontaneous alternation protocol (Wu et al. 2018). Motor function (total distance traveled) (B) and anxiolytic behavior (time spent in center of apparatus) (C) were measured via the open field test (Feng et al. 2017). vg/kg - vector genomes/kilogram. Results were expressed as mean ± SEM; n indicates number of animals. *p ≤ 0.05 indicates significantly different from indicated groups, evaluated via one-way ANOVA with Tukey’s post-hoc test.
Discussion
Here, we established that PRMT8 is a regulator of 1) membrane phospholipids composition, 2) mitochondrial bioenergetics, 3) neuroinflammation and 4) short-term memory function after hypoxic stress. PRMT8 is primarily expressed in the central nervous system and localized to the cellular membrane via a myristoylation motif in its N-terminus (Taneda et al. 2007; Kousaka et al. 2009; Dillon et al. 2013; Scaramuzzino et al. 2013). Methylation by PRMT8 can affect protein substrate structure and function. In fact, co-expression of PRMT8 and sodium channel 1.2 enhanced sodium currents, which suggest that arginine-based methylation can modulate neuronal excitability (Baek et al. 2014), as PRMT8 is also a synaptic protein involved in hippocampal-dependent fear learning, dendritic spine maturation, and actin cytoskeleton modulation (Penney et al. 2017; Lo et al. 2020). We previously described that PRMT8 was enhanced in the presence of palmitic acid methyl ester, a known vasodilator and inflammatory regulator against brain ischemia (Wu et al. 2021; Lee et al. 2019; Lin & Perez-Pinzon 2013; Lin et al. 2008). Therefore, in this study, we further investigated the functional role(s) of brain PRMT8 in response to cellular stress.
Dhar et al., 2013 previously suggested that the loss of PRMT type I results in substrate scavenging by other PRMTs family members (e.g., PRMT1), which suggest a compensatory mechanism exists to preserve PRMT function (Dhar et al. 2013). To investigate this phenomenon in our PRMT8−/− mice, we utilized real-time RT-qPCR and RNAseq to confirm the genetic deletion of PRMT8 and found no significant differences in expression of other PRMT family members in the cortex and hippocampus of PRMT8−/− mice, which suggest the lack of compensatory mechanism(s) (Kim et al. 2015; Dhar et al. 2013).
As a type I PRMT enzyme, PRMT8 catalyzes the formation of monomethylarginine (MMA) and asymmetric dimethylarginine (aDMA) on proteins whose eventual degradation leads to liberated methylarginines. Since aDMA is a known inhibitor of nitric oxide synthase (NOS) (De Gennaro Colonna et al. 2009), we hypothesized that the knockout of PRMT8 may affect the levels of methylarginines, which would in turn regulate nitric oxide levels. However, the deletion of PRMT8 did not affect methylarginine production on proteins, suggesting that the methyltransferase domain of PRMT8 does not significantly affect levels of MMA, aDMA, and sDMA. While we did not determine any changes in global substrate methylation patterns between MMA, aDMA, and sDMA upon PRMT8 knockout, we cannot rule out that another PRMT did not scavenge a specific PRMT8 substrate in the absence of PRMT8. We further confirmed our free methylarginine findings by measuring nitric oxide intermediates (nitrate and nitrite) and the expression of nitric oxide synthetases (NOS), including neuronal (nNOS), endothelial (eNOS), and inducible (iNOS), to suggest no difference in free nitrite and nitrate, or the expression of nNOS, eNOS, or iNOS, independent of hypoxia. Altogether, these findings are suggestive that modulation of PRMT8 does not affect methylarginine nor nitric oxide production.
Aside from its methyltransferase function, previous studies from Kim et al. (2015) suggest that PRMT8 also functions as a phospholipase D-like enzyme (Kim et al. 2015), which cleaves phosphatidylcholine to phosphatidic acid and choline (Liscovitch et al. 2000). PRMT8−/− mice have been reported to have reduced cerebellar choline and acetylcholine levels, while phosphatidylcholine levels were maintained (Kim et al. 2015). The absence of PRMT8 could directly impact both the breakdown of phosphatidylcholine, a major component of cell membranes, choline/acetylcholine, a major neurotransmitter involved in neuronal response, and the synthesis of phosphatidic acid, a regulator for mitochondrial function (Kameoka et al. 2018). However, we found no significant difference in PLD mRNA expression and activity in PRMT8−/− mice.
Consistent with Kim et al. (2015), our findings suggest that PRMT8−/− mice had a significant reduction in choline and acetylcholine levels as compared to WT mice. However, while Kim et al. (2015) reported an increase in phosphatidylcholine and a reduction in phosphatidic acid in the cerebellum of PRMT8−/−, our results indicate no difference in phosphatidylcholine or phosphatidic acid levels in the cortex of PRMT8−/− mice, to further suggest that PRMT8 does contribute significantly to PLD-enzyme activity in cortical tissue (Kim et al. 2015). This difference may be due to tissue specificity as the cerebral cortex has less cholinergic signaling and neuronal cell bodies than the cerebellum (Pouwels & Frahm 1998; Herculano-Houzel 2010). Surprisingly, the cortex of hypoxic PRMT8−/− mice presented with a significant decrease in phosphatidylcholine, but an increase in phosphatidic acid, a known regulator of mitochondrial function (Kameoka et al. 2018). In fact, overexpression of PRMT8 (via AAV) in PRMT8−/− mice resulted in a decrease in phosphatidylcholine and increase in phosphatidic acid (Kim et al. 2015). These results suggest that deletion of PRMT8 under hypoxia can alter hydrolysis of other membrane phospholipid species (i.e., besides phosphatidylcholine) to promote the production of phosphatidic acid. PRMT8 can also influence other phospholipids such as lysophosphatidylethanolamine, phosphatidylinositol, phosphatidylserine, and phosphatidylglycerol, which are involved in neuroinflammation and mitochondrial respiration (De Simone et al. 2004; Yeom et al. 2013; Chen et al. 2018).
In our RNAseq analysis, both reactive oxygen species (ROS) markers [Thyroxine (TTR), and solute carrier family 3 member 1 (Slc3a1)] (Sharma et al. 2019), (Jiang et al. 2017) were enhanced in PRMT8−/− mice. Since we detected a change in mitochondrial-related membrane phospholipids (e.g., phosphatidic acid) and that mitochondrial dysfunction is a consequence of ROS generation (Finkel & Holbrook 2000; Zhang et al. 2012; Selivanov et al. 2011; Yoo et al. 2020; Olesen et al. 2020; Riley & Tait 2020), we sought to determine if PRMT8 could affect mitochondrial activity by investigating the impact of PRMT8 on mitochondrial bioenergetics in the hippocampus of WT, PRMT8−/−, and overexpressed PRMT8 mice via Seahorse respirometry. We detected a significant reduction in basal respiration, maximal respiration, ATP production in PRMT8−/− mice as compared to WT mice. Additionally, mitochondrial respiratory reserve capacity, indicative of the mitochondria to acclimate to rising metabolic demands during stress, was significantly reduced in the hippocampus of PRMT8−/− mice as compared to WT. A reduction in mitochondrial respiratory function could expose neurons to chronic oxidative stress and promote neuroinflammation. However, independent of hypoxic stress, overexpression of PRMT8 rescued (enhanced) the mitochondrial reserve capacity to WT levels, suggesting that PRMT8 is directly modulating mitochondrial respiration. Previously, Madreiter-Sokolowski et al., 2016 reported that PRMT1 could methylate the mitochondrial calcium uniporter 1 (MICU1), thereby decreasing calcium sensitivity within the inner mitochondrial membrane (Madreiter-Sokolowski et al. 2016). Since PRMT1 and PRMT8 share >90% sequence homology, we believe that PRMT8 could potentially regulate mitochondrial calcium intake (Madreiter-Sokolowski et al. 2016; Hung & Li 2004; Wang & Li 2012) through a similar pathway. Decreased calcium sensitivity would cause mitochondria to become depolarized, thereby resulting in aberrant mitochondrial respiration.
Under hypoxic stress, the deletion of PRMT8 resulted in an increase in oxidative stress genes (e.g., TTR, Slc3a1), and mitochondrial dysfunction. Therefore, we measured the levels of tumor necrosis factor alpha (TNF-α), a pro-inflammatory cytokine produced by activated macrophages/monocytes that can lead to necrosis/apoptosis important in neuroinflammation (Blazar et al. 2004; Idriss & Naismith 2000; Sonar & Lal 2015; Olmos & Llado 2014). Furthermore, TNF-α was the strongest and most significantly enhanced cytokine detected in our experiments. Deletion of PRMT8 significantly elevated TNF-α, but overexpression of PRMT8 after hypoxic stress significantly reduced the levels of TNF-α. These results are further corroborated by corresponding with Iba1 levels (Hopperton et al. 2018).
Another hallmark of neuroinflammation is the increased leukocyte diapedesis penetrating cerebral tissues (Schwartz & Baruch 2014). After hypoxia, PRMT8−/− mice had a significant reduction in rolling leukocyte speed as compared to WT mice, which suggest that there is an increase in leukocyte extravasation into the brain. Overexpression of PRMT8, however, did not restore baseline rolling leukocyte speed, which suggest that the re-introduction of PRMT8 was not sufficient to regulate rolling leukocyte speed. These findings suggest that PRMT8 is involved neuroinflammation, coupled with mitochondrial activity in response to stress.
In addition to being involved in mitochondrial function and neuroinflammation, we also observed phenotypic behavioral changes in PRMT8 mice after hypoxic stress. We measured short-term memory function via a T-maze test, and motor activity through an open field behavioral test. Under hypoxic stress, PRMT8−/− mice presented with a significant reduction in working memory as compared to hypoxic WT mice, which suggests that PRMT8 can regulate hippocampal learning memory function. Overexpression of PRMT8 partially restored working memory function to WT levels. In our work, we did not detect any differences in hyperactivity between PRMT8−/− and WT mice as previously described by Kim et al. (2015), independent of hypoxia (Kim et al. 2015). We also measured anxiolytic-like behavior, which translates to time-spent in the center of the open field apparatus (Feng et al. 2017). We found no significant differences in PRMT8−/− mice as compared to WT mice. In addition, we did not observe a hindlimb clasping phenotype in PRMT8−/− mice, as reported by Kim et al. (2015) and Simandi et al. (2018) (data not shown) (Kim et al. 2015; Simandi et al. 2018).
Previously, PRMT8 has been linked to provide cellular stress tolerance in aging motoneurons (Simandi et al. 2018). Moreover, Simandi et al. 2018 reported that loss of PRMT8 resulted in an increase in DNA doubled-stranded breaks and a decrease in cAMP response-element-binding protein 1 (CREB1) level, a transcription factor that regulates genes involved in neuronal survival and function (Simandi et al. 2018). Here, we further characterize that loss of PRMT8 can modulate brain metabolism including changes in phospholipid composition, mitochondria stress capacity, and neuroinflammation in response to cellular stress. While the precise function of PRMT enzymes remains largely unknown, our findings further support the notion that PRMT8 is heavily involved in neuronal stress function.
Conclusion
PRMT8 is localized in the plasma membrane with targets associated with receptors, channels, transporters, and adaptor proteins (Guo et al. 2014). However, there is no consensus regarding the mechanism of action of PRMT8 in cerebral function. Our findings suggest that PRMT8 can regulate cellular stress including mitochondrial function, phospholipid composition, and neuroinflammation. To our knowledge, we are the first to examine the functional role of PRMT8 in response to cellular stress. Our study establishes PRMT8 as an important component of mitochondrial function and neuroinflammation. Altogether, PRMT8 emerges as a potential target for studies involved in neurological and neurodegenerative disorders.
Supplementary Material
Acknowledgements
This study was supported by grants from the NIH/NINDS R01-NS096225 and the AHA 19PRE34380808, 19TPA34850047, 19CDA3466032, 19POST34380784, 17GRNT33660336, 17POST33660174, the Louisiana State University Research Council, the Joanna G. Magale Foundation, the Natural Sciences and Engineering Research Council of Canada RGPIN-2020-04227, and the Alexander Graham Bell CGS-D.
Abbreviations:
- aDMA
asymmetric dimethyl arginine
- eNOS
endothelial nitric oxide synthase
- Iba1
ionized calcium binding adaptor molecule 1
- iNOS
inducible nitric oxide synthase
- MMA
monomethyl arginine
- nNOS
neuronal nitric oxide synthase
- NOS
nitric oxide synthase
- PLD
phospholipase D
- PRMT
protein arginine methyltransferase
- PRMT8−/−
protein arginine methyltransferase 8 knockout mouse
- OCR
oxygen consumption rate
- RRID
Research Resource Identifier
- sDMA
symmetric dimethylarginine
- TNF-α
tumor necrosis factor alpha
- WT
wild-type
Footnotes
Conflict of Interest Disclosure
No conflicts of interest, financial or otherwise, are declared by the author(s).
--Human subjects --
Involves human subjects:
If yes: Informed consent & ethics approval achieved:
=> if yes, please ensure that the info “Informed consent was achieved for all subjects, and the experiments were approved by the local ethics committee.” is included in the Methods.
ARRIVE guidelines have been followed:
Yes
=> if it is a Review or Editorial, skip complete sentence => if No, include a statement in the “Conflict of interest disclosure” section: “ARRIVE guidelines were not followed for the following reason:
“
(edit phrasing to form a complete sentence as necessary).
=> if Yes, insert in the “Conflict of interest disclosure” section:
“All experiments were conducted in compliance with the ARRIVE guidelines.” unless it is a Review or Editorial
References
- Baek JH, Rubinstein M, Scheuer T and Trimmer JS (2014) Reciprocal Changes in Phosphorylation and Methylation of Mammalian Brain Sodium Channels in Response to Seizures. J Biol Chem 289, 15363–15373. [DOI] [PMC free article] [PubMed] [Google Scholar]
- Bajwa E, Pointer CB and Klegeris A (2019) The Role of Mitochondrial Damage-Associated Molecular Patterns in Chronic Neuroinflammation. Mediators Inflamm 2019, 4050796. [DOI] [PMC free article] [PubMed] [Google Scholar]
- Biesmans S, Bouwknecht JA, Ver Donck L et al. (2015) Peripheral Administration of Tumor Necrosis Factor-Alpha Induces Neuroinflammation and Sickness but Not Depressive-Like Behavior in Mice. Biomed Res Int 2015, 716920. [DOI] [PMC free article] [PubMed] [Google Scholar]
- Blanc RS and Richard S (2017) Arginine Methylation: The Coming of Age. Mol Cell 65, 8–24. [DOI] [PubMed] [Google Scholar]
- Blazar BR, Levy RB, Mak TW et al. (2004) CD30/CD30 Ligand (CD153) Interaction Regulates CD4+ T cell-Mediated Graft-versus-host Disease. J Immunol 173, 2933–2941. [DOI] [PubMed] [Google Scholar]
- Brann DW, Dhandapani K, Wakade C, Mahesh VB and Khan MM (2007) Neurotrophic and Neuroprotective Actions of Estrogen: Basic Mechanisms and Clinical Implications. Steroids 72, 381–405. [DOI] [PMC free article] [PubMed] [Google Scholar]
- Cahoon JM, Olson PR, Nielson S, Miya TR, Bankhead P, McGeown JG, Curtis TM and Ambati BK (2014) Acridine Orange Leukocyte Fluorography in Mice. Exp Eye Res 120, 15–19. [DOI] [PMC free article] [PubMed] [Google Scholar]
- Chen WW, Chao YJ, Chang WH, Chan JF and Hsu YH (2018) Phosphatidylglycerol Incorporates into Cardiolipin to Improve Mitochondrial Activity and Inhibits Inflammation. Sci Rep 8, 4919. [DOI] [PMC free article] [PubMed] [Google Scholar]
- Couto ESA, Wu CY, Citadin CT et al. (2020) Protein Arginine Methyltransferases in Cardiovascular and Neuronal Function. Mol Neurobiol 57, 1716–1732. [DOI] [PMC free article] [PubMed] [Google Scholar]
- De Gennaro Colonna V, Bianchi M, Pascale V, Ferrario P, Morelli F, Pascale W, Tomasoni L and Turiel M (2009) Asymmetric Dimethylarginine (ADMA): an Endogenous Inhibitor of Nitric Oxide Synthase and a Novel Cardiovascular Risk Molecule. Med Sci Monit 15, RA91–101. [PubMed] [Google Scholar]
- De Simone R, Ajmone-Cat MA and Minghetti L (2004) Atypical Antiinflammatory Activation of Microglia Induced by Apoptotic Neurons: Possible Role of Phosphatidylserine-phosphatidylserine Receptor Interaction. Molecular Neurobiology 29, 197–212. [DOI] [PubMed] [Google Scholar]
- Dhar S, Vemulapalli V, Patananan AN et al. (2013) Loss of the Major Type I Arginine Methyltransferase PRMT1 Causes Substrate Scavenging by Other PRMTs. Sci Rep 3, 1311. [DOI] [PMC free article] [PubMed] [Google Scholar]
- Dillon MB, Rust HL, Thompson PR and Mowen KA (2013) Automethylation of Protein Arginine Methyltransferase 8 (PRMT8) Regulates Activity by Impeding S-adenosylmethionine Sensitivity. J Biol Chem 288, 27872–27880. [DOI] [PMC free article] [PubMed] [Google Scholar]
- Feng J, Pena CJ, Purushothaman I et al. (2017) Tet1 in Nucleus Accumbens Opposes Depression- and Anxiety-Like Behaviors. Neuropsychopharmacology 42, 1657–1669. [DOI] [PMC free article] [PubMed] [Google Scholar]
- Ferger AI, Campanelli L, Reimer V, Muth KN, Merdian I, Ludolph AC and Witting A (2010) Effects of Mitochondrial Dysfunction on the Immunological Properties of Microglia. J Neuroinflammation 7, 45. [DOI] [PMC free article] [PubMed] [Google Scholar]
- Finkel T and Holbrook NJ (2000) Oxidants, Oxidative Stress and the Biology of Ageing. Nature 408, 239–247. [DOI] [PubMed] [Google Scholar]
- Guo A, Gu H, Zhou J et al. (2014) Immunoaffinity Enrichment and Mass Spectrometry Analysis of Protein Methylation. Mol Cell Proteomics 13, 372–387. [DOI] [PMC free article] [PubMed] [Google Scholar]
- Herculano-Houzel S (2010) Coordinated Scaling of Cortical and Cerebellar Numbers of Neurons. Front Neuroanat 4, 12. [DOI] [PMC free article] [PubMed] [Google Scholar]
- Hopperton KE, Mohammad D, Trepanier MO, Giuliano V and Bazinet RP (2018) Markers of Microglia in Post-mortem Brain Samples from Patients with Alzheimer’s Disease: a Systematic Review. Mol Psychiatry 23, 177–198. [DOI] [PMC free article] [PubMed] [Google Scholar]
- Hung CM and Li C (2004) Identification and Phylogenetic Analyses of the Protein Arginine Methyltransferase Gene Family in Fish and Ascidians. Gene 340, 179–187. [DOI] [PubMed] [Google Scholar]
- Huynh NN and Chin-Dusting J (2006) Amino Acids, Arginase and Nitric Oxide in Vascular Health. Clin Exp Pharmacol Physiol 33, 1–8. [DOI] [PubMed] [Google Scholar]
- Idriss HT and Naismith JH (2000) TNF Alpha and the TNF Receptor Superfamily: Structure-function Relationship(s). Microsc Res Tech 50, 184–195. [DOI] [PubMed] [Google Scholar]
- Jiang Y, Cao Y, Wang Y, Li W, Liu X, Lv Y, Li X and Mi J (2017) Cysteine Transporter SLC3A1 Promotes Breast Cancer Tumorigenesis. Theranostics 7, 1036–1046. [DOI] [PMC free article] [PubMed] [Google Scholar]
- Kameoka S, Adachi Y, Okamoto K, Iijima M and Sesaki H (2018) Phosphatidic Acid and Cardiolipin Coordinate Mitochondrial Dynamics. Trends Cell Biol 28, 67–76. [DOI] [PMC free article] [PubMed] [Google Scholar]
- Kandel ER (2001) The Molecular Biology of Memory Storage: a Dialogue Between Genes and Synapses. Science 294, 1030–1038. [DOI] [PubMed] [Google Scholar]
- Kim JD, Kako K, Kakiuchi M, Park GG and Fukamizu A (2008) EWS is a Substrate of Type I Protein Arginine Methyltransferase, PRMT8. Int J Mol Med 22, 309–315. [PubMed] [Google Scholar]
- Kim JD, Park KE, Ishida J et al. (2015) PRMT8 as a Phospholipase Regulates Purkinje Cell Dendritic Arborization and Motor Coordination. Sci Adv 1, e1500615. [DOI] [PMC free article] [PubMed] [Google Scholar]
- Kolbel K, Ihling C, Bellmann-Sickert K, Neundorf I, Beck-Sickinger AG, Sinz A, Kuhn U and Wahle E (2009) Type I Arginine Methyltransferases PRMT1 and PRMT-3 Act Distributively. J Biol Chem 284, 8274–8282. [DOI] [PMC free article] [PubMed] [Google Scholar]
- Kousaka A, Mori Y, Koyama Y, Taneda T, Miyata S and Tohyama M (2009) The Distribution and Characterization of Endogenous Protein Arginine N-methyltransferase 8 in Mouse CNS. Neuroscience 163, 1146–1157. [DOI] [PubMed] [Google Scholar]
- Lakowski TM, Pak ML, Szeitz A, Thomas D, Vhuiyan MI, Clement B and Frankel A (2015) Arginine Methylation in Yeast Proteins During Stationary-phase Growth and Heat Shock. Amino Acids 47, 2561–2571. [DOI] [PubMed] [Google Scholar]
- Lakowski TM, Szeitz A, Pak ML, Thomas D, Vhuiyan MI, Kotthaus J, Clement B and Frankel A (2013) MS(3) Fragmentation Patterns of Monomethylarginine Species and the Quantification of All Methylarginine Species in Yeast Using MRM(3). J Proteomics 80, 43–54. [DOI] [PubMed] [Google Scholar]
- Lee J, Sayegh J, Daniel J, Clarke S and Bedford MT (2005) PRMT8, a New Membrane-bound tissue-specific Member of the Protein Arginine Methyltransferase Family. J Biol Chem 280, 32890–32896. [DOI] [PubMed] [Google Scholar]
- Lee RH, Couto ESA, Lerner FM et al. (2017) Interruption of Perivascular Sympathetic Nerves of Cerebral Arteries Offers Neuroprotection Against Ischemia. Am J Physiol Heart Circ Physiol 312, H182–H188. [DOI] [PubMed] [Google Scholar]
- Lee RH, Couto ESA, Possoit HE et al. (2019) Palmitic Acid Methyl Ester is a Novel Neuroprotective Agent Against Cardiac Arrest. Prostaglandins, Leukotrienes and Essential Fatty Acids 147, 6–14. [DOI] [PMC free article] [PubMed] [Google Scholar]
- Lee RH, Grames MS, Wu CY et al. (2020) Upregulation of Serum and Glucocorticoid-regulated Kinase 1 Exacerbates Brain Injury and Neurological Deficits After Cardiac Arrest. Am J Physiol Heart Circ Physiol 319, H1044–H1050. [DOI] [PMC free article] [PubMed] [Google Scholar]
- Lin HW, Liu CZ, Cao D et al. (2008) Endogenous Methyl Palmitate Modulates Nicotinic receptor-mediated transmission in the superior cervical ganglion. Proc Natl Acad Sci U S A 105, 19526–19531. [DOI] [PMC free article] [PubMed] [Google Scholar]
- Lin HW and Perez-Pinzon M (2013) The Role of Fatty Acids in the Regulation of Cerebral Vascular Function and Neuroprotection in Ischemia. CNS Neurol Disord Drug Targets 12, 316–324. [DOI] [PubMed] [Google Scholar]
- Lin YL, Tsai YJ, Liu YF, Cheng YC, Hung CM, Lee YJ, Pan H and Li C (2013) The Critical Role of Protein Arginine Methyltransferase PRMT8 in Zebrafish Embryonic and Neural Development is Non-redundant with its Paralogue PRMT1. PLoS One 8, e55221. [DOI] [PMC free article] [PubMed] [Google Scholar]
- Liscovitch M, Czarny M, Fiucci G and Tang X (2000) Phospholipase D: Molecular and Cell Biology of a Novel Gene Family. Biochem J 345 Pt 3, 401–415. [PMC free article] [PubMed] [Google Scholar]
- Liu X, Xu X, Shang R and Chen Y (2018) Asymmetric Dimethylarginine (ADMA) as an Important Risk Factor for the Increased Cardiovascular Diseases and Heart Failure in Chronic Kidney Disease. Nitric Oxide 78, 113–120. [DOI] [PMC free article] [PubMed] [Google Scholar]
- Lo LH, Dong R, Lyu Q and Lai KO (2020) The Protein Arginine Methyltransferase PRMT8 and Substrate G3BP1 Control Rac1-PAK1 Signaling and Actin Cytoskeleton for Dendritic Spine Maturation. Cell Rep 31, 107744. [DOI] [PubMed] [Google Scholar]
- Madreiter-Sokolowski CT, Klec C, Parichatikanond W et al. (2016) PRMT1-mediated Methylation of MICU1 Determines the UCP2/3 Dependency of Mitochondrial Ca(2+) Uptake in Immortalized cells. Nat Commun 7, 12897. [DOI] [PMC free article] [PubMed] [Google Scholar]
- Narayan C and Kumar A (2012) Constitutive Over Expression of IL-1beta, IL-6, NF-kappaB, and Stat3 is a Potential Cause of Lung Tumorgenesis in Urethane (ethyl carbamate) Induced Balb/c Mice. J Carcinog 11, 9. [DOI] [PMC free article] [PubMed] [Google Scholar]
- Olesen MA, Torres AK, Jara C, Murphy MP and Tapia-Rojas C (2020) Premature Synaptic Mitochondrial Dysfunction in the Hippocampus During Aging Contributes to Memory Loss. Redox Biol 34, 101558. [DOI] [PMC free article] [PubMed] [Google Scholar]
- Olmos G and Llado J (2014) Tumor Necrosis Factor Alpha: a Link Between Neuroinflammation and Excitotoxicity. Mediators Inflamm 2014, 861231. [DOI] [PMC free article] [PubMed] [Google Scholar]
- Onwuli DO, Rigau-Roca L, Cawthorne C and Beltran-Alvarez P (2017) Mapping Arginine Methylation in the Human Body and Cardiac Disease. Proteomics Clin Appl 11. [DOI] [PubMed] [Google Scholar]
- Pahlich S, Zakaryan RP and Gehring H (2008) Identification of Proteins Interacting with Protein Arginine Methyltransferase 8: the Ewing Sarcoma (EWS) Protein Binds Independent of its Methylation State. Proteins 72, 1125–1137. [DOI] [PubMed] [Google Scholar]
- Penney J, Seo J, Kritskiy O, Elmsaouri S, Gao F, Pao PC, Su SC and Tsai LH (2017) Loss of Protein Arginine Methyltransferase 8 Alters Synapse Composition and Function, Resulting in Behavioral Defects. J Neurosci 37, 8655–8666. [DOI] [PMC free article] [PubMed] [Google Scholar]
- Poulard C, Corbo L and Le Romancer M (2016) Protein Arginine Methylation/Demethylation and Cancer. Oncotarget 7, 67532–67550. [DOI] [PMC free article] [PubMed] [Google Scholar]
- Pouwels PJ and Frahm J (1998) Regional Metabolite Concentrations in Human Brain as Determined by Quantitative Localized Proton MRS. Magn Reson Med 39, 53–60. [DOI] [PubMed] [Google Scholar]
- Riley JS and Tait SW (2020) Mitochondrial DNA in Inflammation and Immunity. EMBO Rep 21, e49799. [DOI] [PMC free article] [PubMed] [Google Scholar]
- Sayegh J, Webb K, Cheng D, Bedford MT and Clarke SG (2007) Regulation of Protein Arginine Methyltransferase 8 (PRMT8) Activity by its N-terminal Domain. J Biol Chem 282, 36444–36453. [DOI] [PubMed] [Google Scholar]
- Scaramuzzino C, Monaghan J, Milioto C et al. (2013) Protein Arginine Methyltransferase 1 and 8 Interact with FUS to Modify its Sub-cellular Distribution and Toxicity in vitro and in vivo. PLoS One 8, e61576. [DOI] [PMC free article] [PubMed] [Google Scholar]
- Schwartz M and Baruch K (2014) The Resolution of Neuroinflammation in Neurodegeneration: Leukocyte Recruitment via the Choroid Plexus. EMBO J 33, 7–22. [DOI] [PMC free article] [PubMed] [Google Scholar]
- Selivanov VA, Votyakova TV, Pivtoraiko VN, Zeak J, Sukhomlin T, Trucco M, Roca J and Cascante M (2011) Reactive Oxygen Species Production by Forward and Reverse Electron Fluxes in the Mitochondrial Respiratory Chain. PLoS Comput Biol 7, e1001115. [DOI] [PMC free article] [PubMed] [Google Scholar]
- Sharma M, Khan S, Rahman S and Singh LR (2019) The Extracellular Protein, Transthyretin Is an Oxidative Stress Biomarker. Front Physiol 10, 5. [DOI] [PMC free article] [PubMed] [Google Scholar]
- Simandi Z, Czipa E, Horvath A et al. (2015) PRMT1 and PRMT8 Regulate Retinoic Acid-dependent Neuronal Differentiation with Implications to Neuropathology. Stem Cells 33, 726–741. [DOI] [PubMed] [Google Scholar]
- Simandi Z, Pajer K, Karolyi K et al. (2018) Arginine Methyltransferase PRMT8 Provides Cellular Stress Tolerance in Aging Motoneurons. J Neurosci 38, 7683–7700. [DOI] [PMC free article] [PubMed] [Google Scholar]
- Sonar S and Lal G (2015) Role of Tumor Necrosis Factor Superfamily in Neuroinflammation and Autoimmunity. Front Immunol 6, 364. [DOI] [PMC free article] [PubMed] [Google Scholar]
- Taneda T, Miyata S, Kousaka A, Inoue K, Koyama Y, Mori Y and Tohyama M (2007) Specific Regional Distribution of Protein Arginine Methyltransferase 8 (PRMT8) in the Mouse Brain. Brain Res 1155, 1–9. [DOI] [PubMed] [Google Scholar]
- Underwood E, Redell JB, Zhao J, Moore AN and Dash PK (2020) A Method for Assessing Tissue Respiration in Anatomically Defined Brain Regions. Sci Rep 10, 13179. [DOI] [PMC free article] [PubMed] [Google Scholar]
- Verri M, Pastoris O, Dossena M, Aquilani R, Guerriero F, Cuzzoni G, Venturini L, Ricevuti G and Bongiorno AI (2012) Mitochondrial Alterations, Oxidative Stress and Neuroinflammation in Alzheimer’s disease. Int J Immunopathol Pharmacol 25, 345–353. [DOI] [PubMed] [Google Scholar]
- Wang YC and Li C (2012) Evolutionarily Conserved Protein Arginine Methyltransferases in Non-mammalian Animal Systems. FEBS J 279, 932–945. [DOI] [PubMed] [Google Scholar]
- Wu CY, Couto ESA, Citadin CT et al. (2021) Palmitic Acid Methyl Ester Inhibits Cardiac Arrest-induced Neuroinflammation and Mitochondrial Dysfunction. Prostaglandins, Leukotrienes and Essential Fatty Acids 165, 102227. [DOI] [PMC free article] [PubMed] [Google Scholar]
- Wu CYC, Lerner FM, Couto ESA, Possoit HE, Hsieh TH, Neumann JT, Minagar A, Lin HW and Lee RHC (2018) Utilizing the Modified T-Maze to Assess Functional Memory Outcomes After Cardiac Arrest. J Vis Exp [DOI] [PMC free article] [PubMed] [Google Scholar]
- Wu CYC, Lopez-Toledano MA, Daak AA et al. (2020) SC411 Treatment Can Enhance Survival in a Mouse Model of Sickle Cell Disease. Prostaglandins, Leukotrienes and Essential Fatty Acids 158, 102110. [DOI] [PubMed] [Google Scholar]
- Xu HT, Pan F, Yang G and Gan WB (2007) Choice of Cranial Window Type for in vivo Imaging Affects Dendritic Spine Turnover in the Cortex. Nat Neurosci 10, 549–551. [DOI] [PubMed] [Google Scholar]
- Yeom M, Hahm DH, Sur BJ, Han JJ, Lee HJ, Yang HI and Kim KS (2013) Phosphatidylserine Inhibits Inflammatory Responses in Interleukin-1beta-stimulated Fibroblast-like Synoviocytes and Alleviates Carrageenan-induced Arthritis in Rat. Nutr Res 33, 242–250. [DOI] [PubMed] [Google Scholar]
- Yildirim AO, Bulau P, Zakrzewicz D, Kitowska KE, Weissmann N, Grimminger F, Morty RE and Eickelberg O (2006) Increased Protein Arginine Methylation in Chronic Hypoxia: Role of Protein Arginine Methyltransferases. Am J Respir Cell Mol Biol 35, 436–443. [DOI] [PubMed] [Google Scholar]
- Yoo SM, Park J, Kim SH and Jung YK (2020) Emerging Perspectives on Mitochondrial Dysfunction and Inflammation in Alzheimer’s Disease. BMB Rep 53, 35–46. [DOI] [PMC free article] [PubMed] [Google Scholar]
- Zarate S, Stevnsner T and Gredilla R (2017) Role of Estrogen and Other Sex Hormones in Brain Aging. Neuroprotection and DNA Repair. Front Aging Neurosci 9, 430. [DOI] [PMC free article] [PubMed] [Google Scholar]
- Zhang Y, Wang M, Li H, Zhang H, Shi Y, Wei F, Liu D, Liu K and Chen D (2012) Accumulation of Nuclear and Mitochondrial DNA Damage in the Frontal Cortex Cells of Patients with HIV-associated Neurocognitive Disorders. Brain Res 1458, 1–11. [DOI] [PubMed] [Google Scholar]
Associated Data
This section collects any data citations, data availability statements, or supplementary materials included in this article.