Abstract
Live-cell imaging with high spatiotemporal resolution and high detection sensitivity facilitates the study of the dynamics of cellular structure and function. However, extracting high-resolution 4D (3D space plus time) information from live cells remains challenging, because current methods are slow, require high peak excitation intensities or suffer from high out-of-focus background. Here we present 3D interferometric lattice light-sheet (3D-iLLS) imaging, a technique that requires low excitation light levels and provides high background suppression and substantially improved volumetric resolution by combining 4Pi interferometry with selective plane illumination. We demonstrate that 3D-iLLS has an axial resolution and single-particle localization precision of 100 nm (FWHM) and <10 nm (1σ), respectively. We illustrate the performance of 3D-iLLS in a range of systems: single messenger RNA molecules, nanoscale assemblies of transcription regulators in the nucleus, the microtubule cytoskeleton, and mitochondria organelles. The enhanced 4D resolution and increased signal-to-noise ratio (SNR) of 3D-iLLS will facilitate the analysis of biological processes at the sub-cellular level.
Interferometric (4Pi) approaches1-6 achieve the highest 3D spatial resolution and single-particle localization precision to date, <100 nm and <10 nm, respectively. Point-scanning 4Pi imaging1, with focused excitation and confocal detection, features the most efficient 3D point spread function (PSF) in terms of reduced side-lobes as well as background reduction. However, point-scanning is limited in temporal resolution when imaging large fields, and short pixel dwell times require high peak excitation intensities that often accelerate photobleaching. Wide-field interferometric setups could in principle achieve faster imaging at reduced peak intensities. However, such setups typically have been implemented in an epi-illumination configuration2-6, which suffers from increased out-of-focus background. Applications have thus been limited to relatively sparse and bright cellular structures with low background. There are many systems where structures of interest might comprise only ~10 molecules3, 13. Such structures are difficult to visualize in the presence of often overwhelming cellular background, such as out-of-focus blur in dense structures, as well as super-Poisson intensity noise due to particle number fluctuations13. An approach that can simultaneously achieve high 3D resolution and localization precision and reduced background/photo-bleaching would greatly advance our capabilities to visualize molecular structures and motions at nanometer scales, in the high-background, crowded intracellular milieu.
Selective plane-illumination (light-sheet) approaches illuminate only a thin slice through the sample, overcoming many of the limitations of epi-illumination. In the simplest implementations, a single plane is illuminated with an excitation beam that is perpendicular to the detection optics. A conventional choice for creating the selective plane illumination profile is a Gaussian beam, which can be projected by a separate excitation objective lens mounted perpendicular to the detection lens10, or reflected by a microfabricated cantilever mirror mounted on an excitation objective lens opposed to the detection lens9. In either case, a trade-off between the thickness of the light sheet and the effective field of view due to diffraction needs to be considered, and a sweet spot is chosen depending on the requirements of the sample studied. To overcome the constraints due to diffraction of Gaussian beams, non-diffracting beams, such as Bessel8, 11 or Airy12 beams can be used. Both a single beam11 and an array of Bessel beams8 can be scanned to create a light sheet that is thinner than what achieved with a Gaussian beam. However, the non-negligible excitation side-lobes away from the main illumination plane introduce excess background and unnecessary photo-bleaching at out-of-focus parts of the sample that are not imaged. Selective plane illumination based on bound 2D optical lattices, lattice light-sheet (LLS) illumination, can suppress the side lobes while maintaining the non-diffracting property and the thin profile of the light sheet7. LLS microscopy demonstrated combined low photo-toxicity, low photo-bleaching and low background, well-suited to live cell imaging studies. In conventional LLS imaging with a single 0.7 NA excitation lens and a single 1.1 NA detection lens, a 240 nm×240 nm×380 nm xyz resolution has been achieved7, while for single-particle localization applications, typical localization precisions7, 14 are ~20 nm in xy and ~45 nm in z. This z performance is significantly lower than what can be achieved by interferometric methods, but unfortunately, possibly due to the constrains of the dual opposed objective lens geometry, it has been challenging to implement selective-plane illumination approaches in interferometric setups, to further reduce background and increase the achievable 3D resolution.
Here, we report an interferometric imaging method for highly-sensitive live-cell imaging that replaces the original epi-illumination scheme with a selective-plane illumination scheme based on optical lattices (LLS illumination). This 3D interferometric lattice light-sheet (3D-iLLS) imaging method, achieves a more confined detection volume than conventional LLS microscopy with a single detection objective lens, and thus less out-of-focus background and higher signal-to-noise ratio. The reduced background, higher photon utilization efficiency and the higher optical sectioning capabilities of 3D-iLLS enable visualizing weak sub-cellular structures. We demonstrate an achievable z resolution 100 nm (FWHM) and a localization precision <10 nm (1σ), both a factor of ~4× improvement compared to conventional LLS.
RESULTS
Theory and experimental implementation of 3D-iLLS
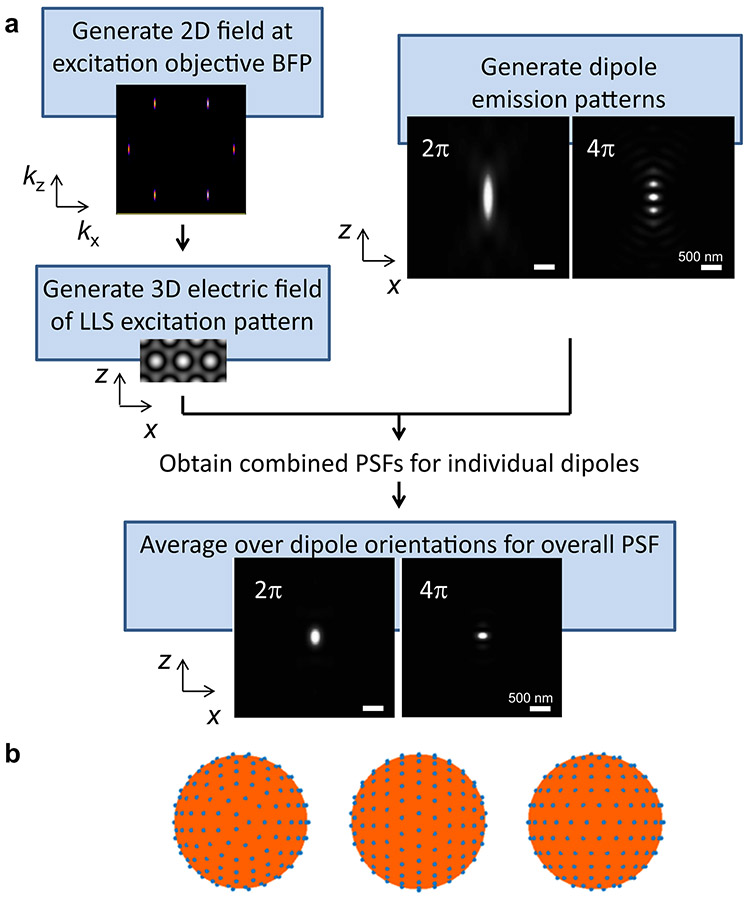
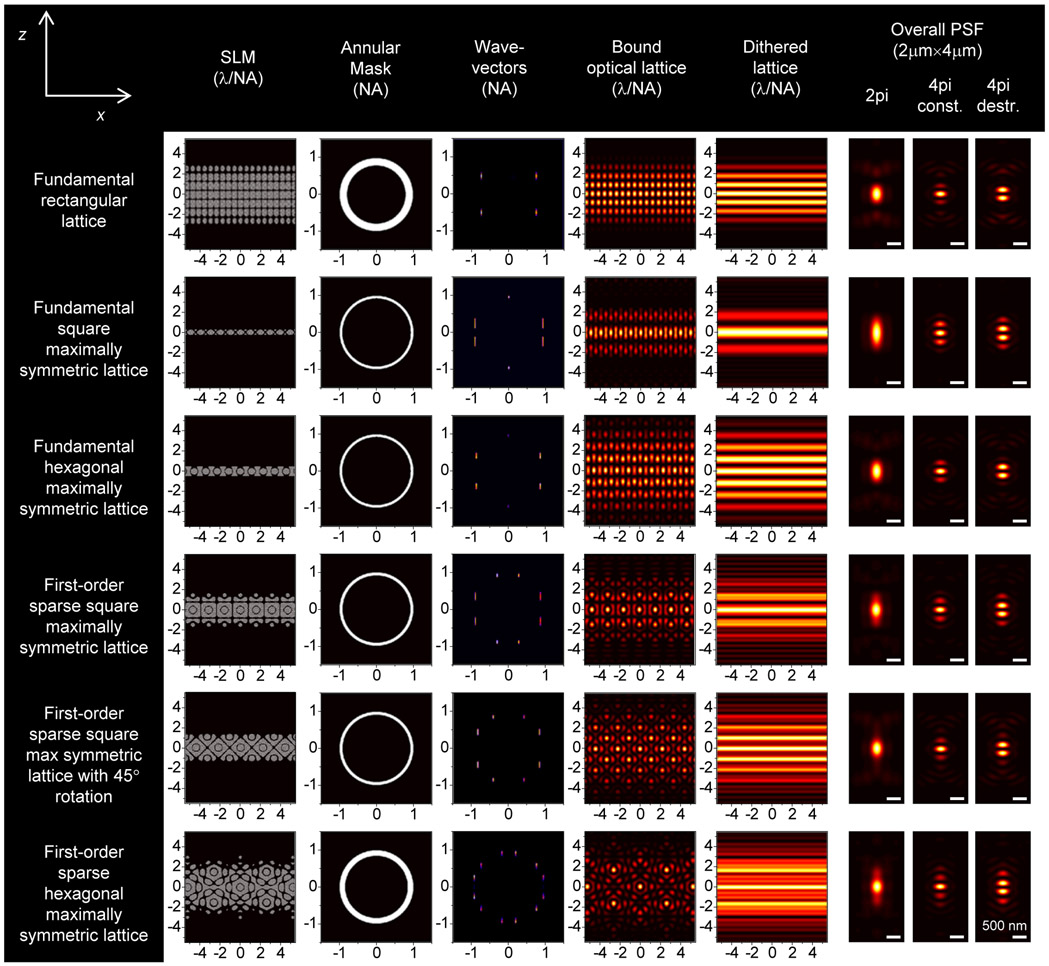
To better understand and optimize 3D-iLLS microscopy, we developed a numerical simulation pipeline (Supplementary Note; Extended Data Figure 1) for calculating the resulting 3D Point-Spread-Functions (PSFs) based on electromagnetic vector-field calculations. The overall 3D-iLLS PSFs show distinct profiles compared to conventional LLS microscopy (Extended Data Figure 2). In 3D-iLLS with constructive emission interference, the PSF exhibits a maximum centered at the common focus of the two objectives, with two additional visible side lobes along the z-axis. When emission interferes destructively, the intensity maxima are symmetrically positioned along the z-axis away from the focal plane, with two less pronounced side lobes. In both cases, the volume occupied by the overall PSFs for 4Pi detection is ≈2× less than for 2Pi detection. As the overall PSF becomes smaller, background contributions from molecules that diffuse in-and-out of the detection volume, or from molecules that bind to loci nearby, are reduced. This effect allows individual molecules and faint structures of interest at the focal plane to be visualized not only with higher z resolution but also with increased sensitivity and higher signal-to-noise ratio (SNR).
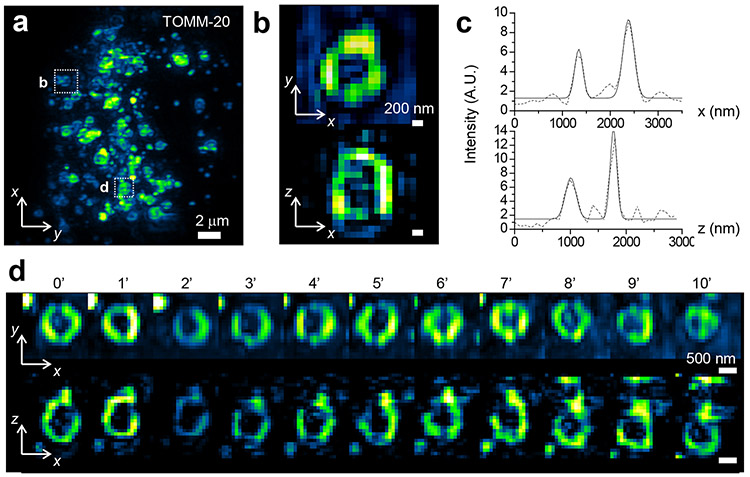
Figure 5. 3D-iLLS-SIM enables time-lapse imaging with extended resolution.
a, 3D-iLLS-SIM imaging of mitochondria in a live COS-7 cell (Tomm-20-Halo, visualized with JF646-Halo ligand). Image shows maximum intensity projection in the yx plane. b, Orthoslices showing cross-sections of a single mitochondrion (boxed in a), in the xy and xz planes, respectively. c, Line profiles of mitochondrion in b, and Gaussian peak fits. Fitted FWHM is 226 nm, and 140 nm in z and 199 nm, and 270 nm in x, respectively. d, Orthoslices showing time-lapse dynamics of another mitochondrion (second box in a), at 1 minute intervals over a 10 minute period. Two experiments were repeated independently with similar results.
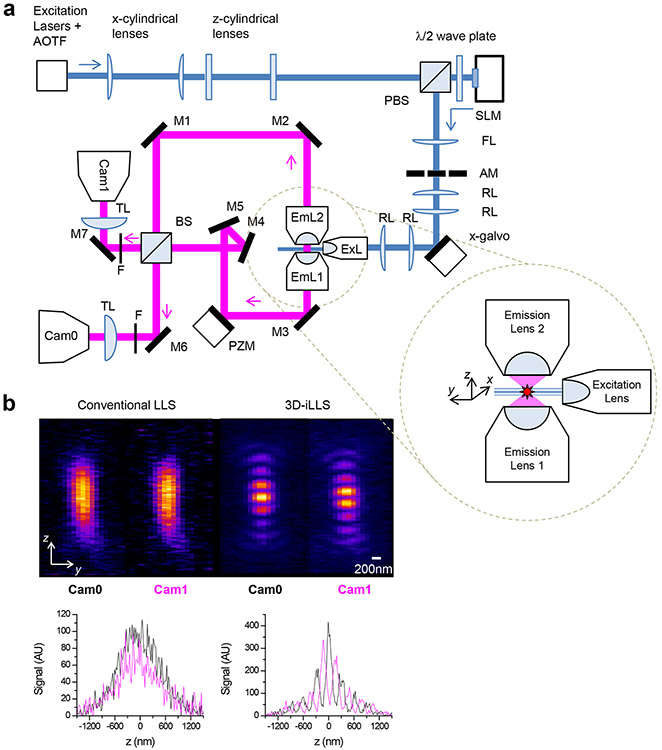
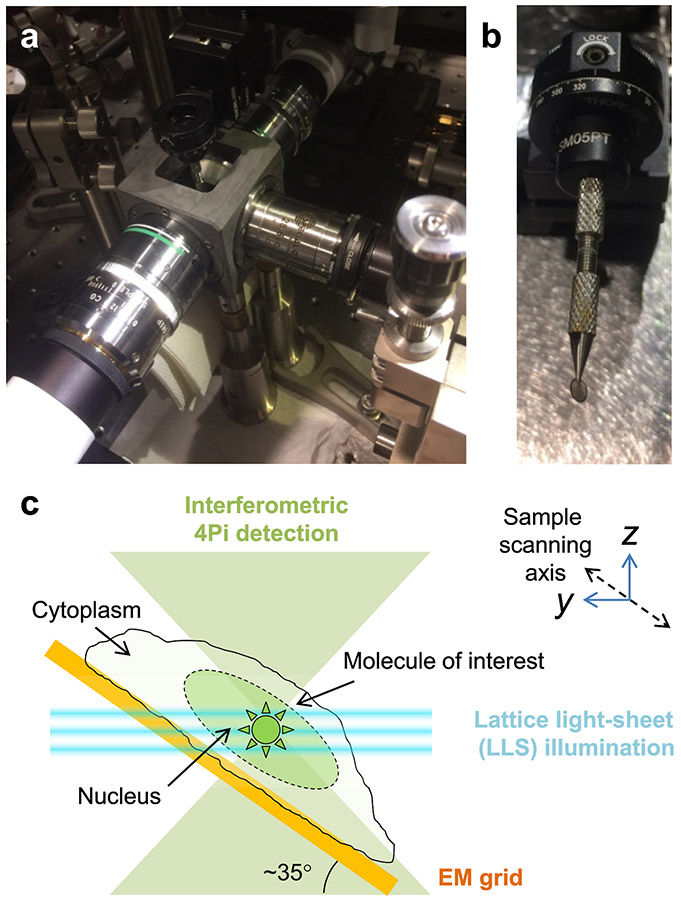
Our 3D-iLLS microscope (Figure 1a; Extended Data Figure 3) uses two 1.1 NA opposed detection lenses, in a previously described3 interferometric cavity arrangement. For imaging, the interferometer is tuned near the zero-path-length position, resulting in constructive/destructive interference at the two ports of the beam-splitter. A third 0.7 NA lens, orthogonal to the two opposed detection lenses, delivers the LLS excitation. We calibrate the experimental 3D-iLLS PSF using 40 nm fluorescent beads (Figure 1b). The experiment calibrations recapitulate our numerical calculations, featuring the expected modulated PSF with a ~100-140 nm FWHM central lobe, thus demonstrating successful implementation of the desired 3D-iLLS optical properties.
Figure 1. Principles of 3D-iLLS, optical setup schematic and comparison of PSF properties of 3D-iLLS vs. conventional LLS.
a, Schematic of experimental setup. ExL: excitation les; EmL1,2: emission detection lenses. M1-7: mirrors. BS: non-polarizing beam-splitter. PZM: piezo-electric mount (phase shifter). Cam0,1: sCMOS detection cameras. TL: tube lens. F: emission filters. AOTF: Acousto-optic tunable filter. PBS: polarizing beam-splitter. SLM: spatial light modulator. AM: annular mask. FL: Fourier-transform lens. RL: relay lenses. Inset: geometry and coordinate system between lenses. b, Experimental calibration of the conventional LLS and 3D-iLLS PSFs, using 40 nm fluorescent beads. Excitation: 642 nm; emission filter: 700/70m. At least five experiments were repeated independently, with similar results, for b.
Increased axial resolution of 3D-iLLS vs. conventional LLS
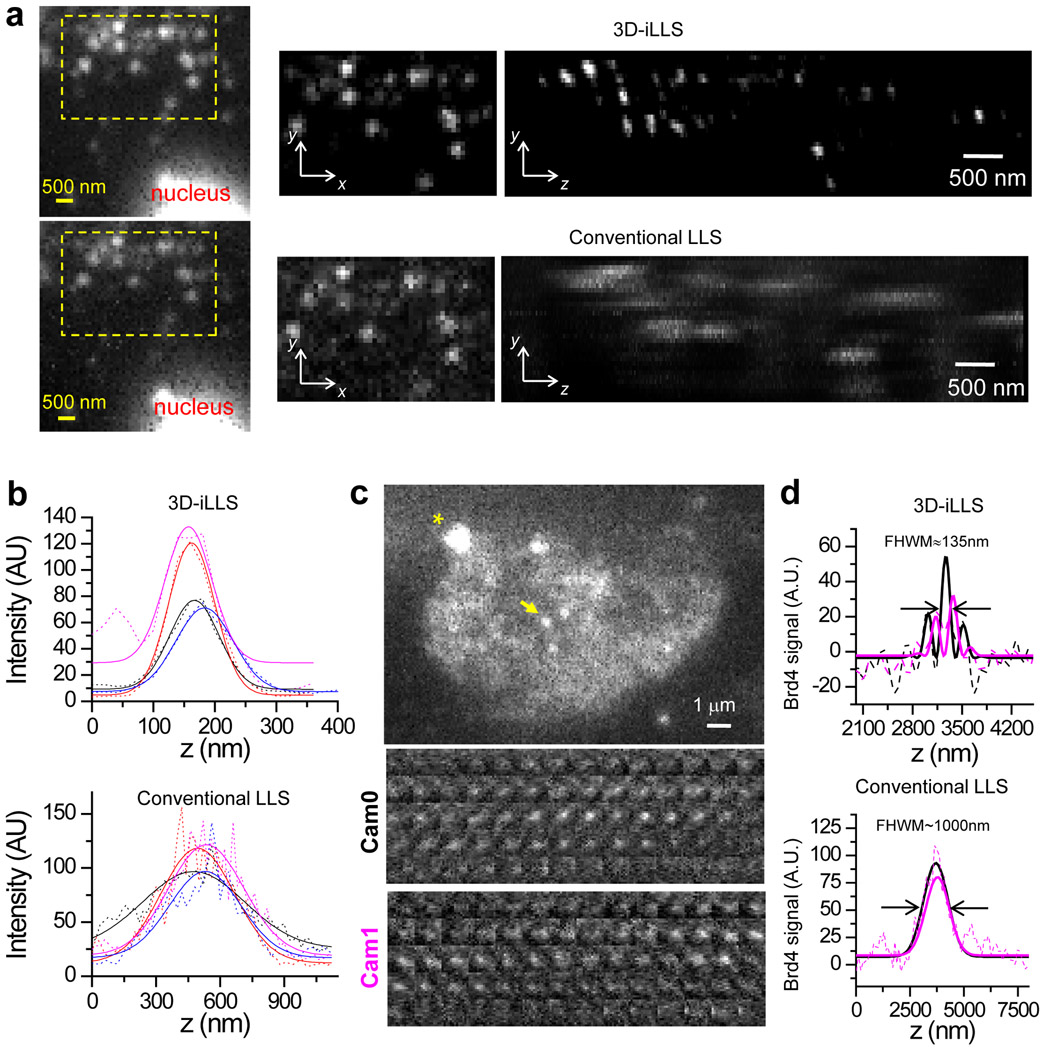
To test the performance of 3D-iLLS with cellular samples we visualized single mRNAs in human osteosarcoma cells (U-2 OS)13. Single mRNAs are tagged with PP7 phage derived stem-loops (24×PP7) and visualized with a tandem-dimer phage coat protein fused to Halo-tag (tdPCP-Halo) and staining with a JF-646 Halo-tag ligand. 3D-iLLS adequately resolved single mRNAs, even in tight clusters where conventional LLS failed (Figure 2a). We further quantified the axial resolution by measuring the z profile of single mRNAs. For conventional LLS the obtained FWHM resolution is 496±27 nm and 444±80 nm, for raw data and after deconvolution, respectively (mean±S.D., n=4 and 4). The 3D-iLLS z profiles after deconvolution yield a FWHM of 96±10 nm (mean±S.D., n=4) (Figure 2b). These results demonstrate a ≈4× axial resolution improvement of 3D-iLLS compared to conventional LLS.
Figure 2. 3D-iLLS outperforms conventional LLS in 3D sub-cellular imaging.
a, Comparison of 3D-iLLS vs. conventional LLS for imaging 24×PP7 mRNAs tagged with tdPCP-Halo-JF646 in fixed U-2 OS cells. yx, zx, and yz maximum projections. b, z profiles of single mRNAs (dashed lines) and 1D Gaussian peak fits (solid lines), showing increased axial resolution for 3D-iLLS vs. conventional LLS. c, 3D-iLLS image of Brd4 clusters in live mESCs. A single z slice from the raw data is shown. Asterisk marks a bead fiducial. Insets show individual z slices for the cluster indicated by the yellow arrow (3D-iLLS data, 20 nm z steps). d, z profiles (background-subtracted, using a band-pass FFT filter) of single Brd4 clusters imaged with conventional LLS and 3D-iLLS. Solid lines: non-linear least-squares fit to 1D Gaussian peaks for conventional LLS and to equations of the form for 3D-iLLS, for Cam0 and Cam1 respectively. Zoomed-out panels in a and panels in c, d show raw data without deconvolution. Data for boxed regions in a and in b are shown after deconvolution. Two experiments were repeated independently with similar results, for a-d.
To demonstrate the performance of 3D-iLLS in live-cell imaging, we imaged mouse embryonic stem cells (mESCs) that are engineered with a SNAP-tag knocked into the endogenous Brd4 locus13. We had previously shown that Brd4 forms foci containing ~15 tagged molecules at the enhancers of the Pou5f1 and Nanog genes13. Our 3D-iLLS imaging shows multiple Brd4 clusters throughout the nucleus of mESCs (Figure 2c), suggesting extensive Brd4 clustering at mESC enhancers. 3D-iLLS resolves Brd4 clusters with increased resolution compared to conventional LLS (Figure 2d). 3D-iLLS can also localize the center-of-mass of Brd4 clusters in the reconstructed cellular volumes with ≈10 nm z localization precision (Extended Data Figure 5). These results highlight the capabilities of 3D-iLLS for live cell imaging.
3D-iLLS-SIM provides improved OTF contiguity and strength
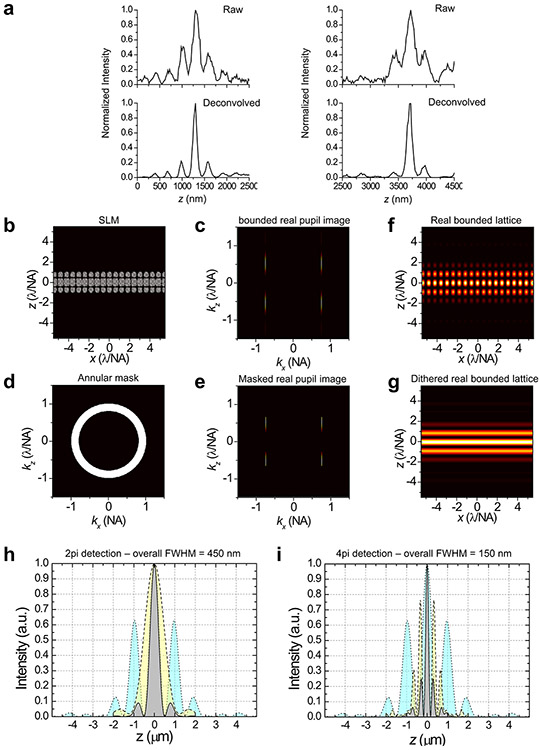
An important consideration for extended resolution and super-resolution imaging techniques is faithfully reconstructing structures of all sizes, down to the resolution limit. Different spatial frequencies present within the support of the microscope’s optical transfer function (OTF) must be recovered above the noise level15. OTF contiguity and strength are crucial, as it becomes challenging to recover signals in weak OTF regions. Interferometric 4Pi techniques16 as well as SPIM techniques with modulated excitation (LLS, Bessel)7 often inherently contain OTF depressions, manifesting as side-lobes in the effective PSF. Depending on the detailed OTF structure and the spatial frequencies present in the sample, deconvolution can minimize (e.g. Extended Data Figure 5a) or, in certain cases, even eliminate side-lobes17. The dithered LLS parameters can be further optimized (Extended Data Figure 5b-i), but we reasoned that beyond merely assessing the appearance of the effective PSF (e.g. based on side-lobe strength), further evaluating the full OTF structure and seeking to increase OTF strength and contiguity, throughout its support in 3D Fourier space, would be beneficial for general 3D-iLLS imaging applications.
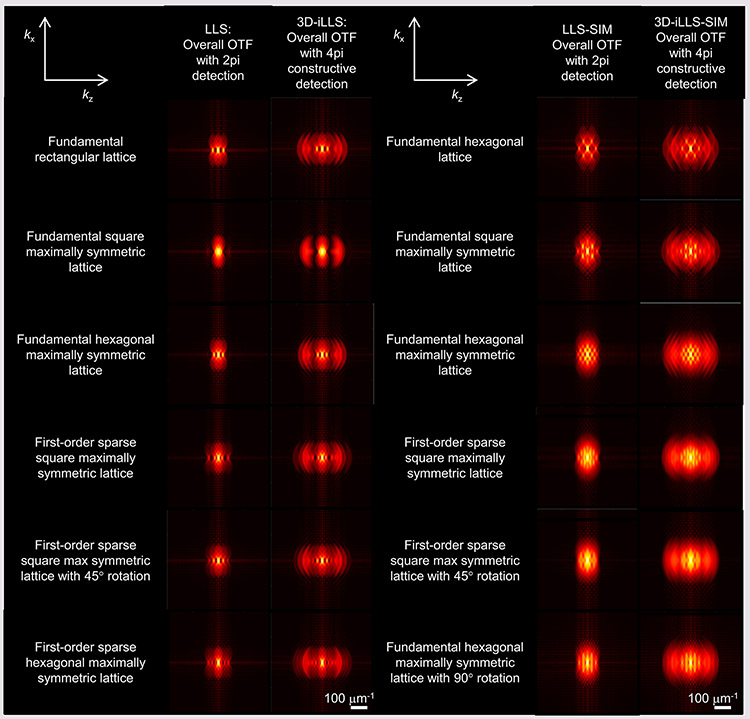
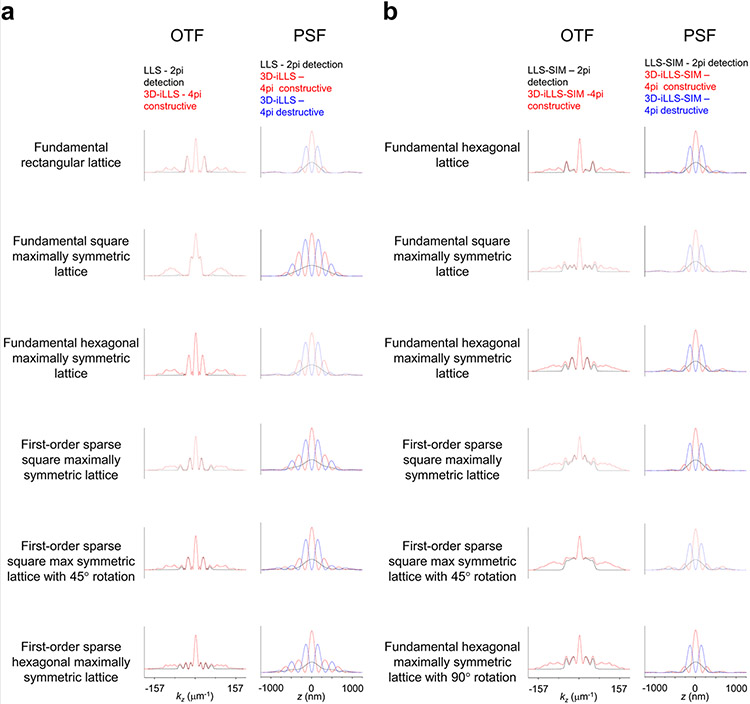
To achieve a more uniform and further extended 3D-iLLS OTF support, we explored 3D Structured Illumination Microscopy (SIM)18. By virtue of shifting and adding multiple information components in Fourier space, SIM can potentially better cover different spatial frequency ranges. Comparison between theoretical OTFs reveals that, indeed, the combination of 3D-iLLS and 3D SIM (3D-iLLS-SIM) results in OTFs that feature significantly shallower depressions than 3D-iLLS with dithered LLS excitation (Extended Data Figures 6-7). The corresponding 3D-iLLS-SIM PSFs also feature less prominent side lobes along the z axis than dithered LLS 3D-iLLS (Extended Data Figure 7). Finally, the support of 3D-iLLS-SIM OTFs extends further along the x axis, featuring an (anisotropically) increased resolution, similarly to conventional LLS-SIM7. These desirable optical properties predicted theoretically prompted us to further pursue and implement extended resolution 3D-iLLS-SIM imaging.
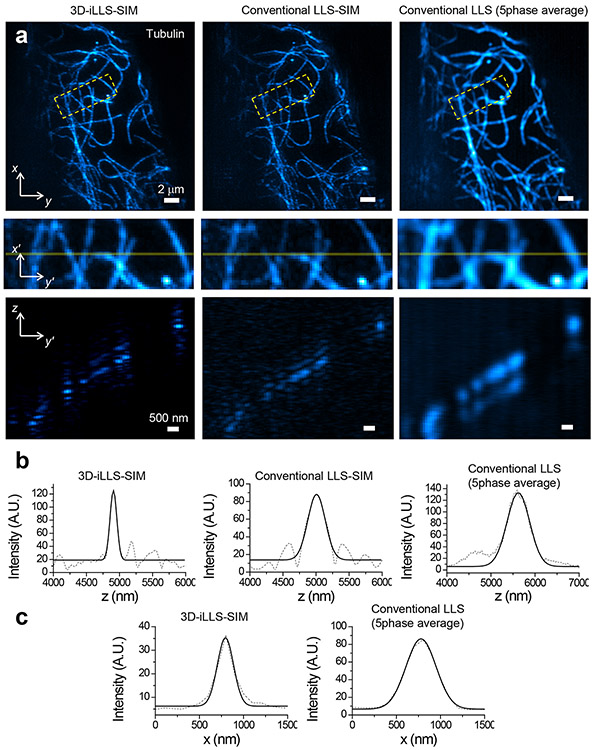
To evaluate the capabilities of 3D-iLLS-SIM, we first visualized the microtubule cytoskeleton in COS-7 cells (Figure 3a-b; Extended Data Figure 8a). Consistent with the theoretical predictions, 3D-iLLS-SIM visualizes individual microtubules with improved xz resolution. Quantification of individual filaments reveals z FWHM of 137±14 nm vs. 321±23 nm and 579±66 nm, for 3D-iLLS-SIM vs. LLS-SIM and dithered LLS, respectively (mean±S.D., n=10, 7 and 4 individual z profiles). Similarly, 3D-iLLS-SIM achieves x FWHM of 214±35 nm vs. 383±18 nm for dithered LLS (mean±S.D., n=5 and 5 individual x profiles, respectively).
Figure 3. 3D-iLLS-SIM enables cellular imaging with improved resolution compared to conventional LLS-SIM and dithered LLS.
a, Top and middle panels: maximum intensity projections of Atto 647N immunostained microtubules in a fixed COS-7 cell. Bottom panels: slice of the data in the plane indicated by the transparent yellow lines. b, Line profiles of individual microtubules in z. c, Line profiles of individual microtubules in x. b-c, Dashed lines: raw data; solid lines: 1D Gaussian peak fits. Fitted z FWHM widths are 122 nm, 311 nm, and 603 nm, for 3D-iLLS-SIM, and for conventional LLS-SIM and LLS (5-phase average), respectively. Fitted x FWHM widths are 216 nm and 401 nm, for 3D-iLLS-SIM and conventional LLS (5-phase average), respectively. Three experiments were repeated independently with similar results.
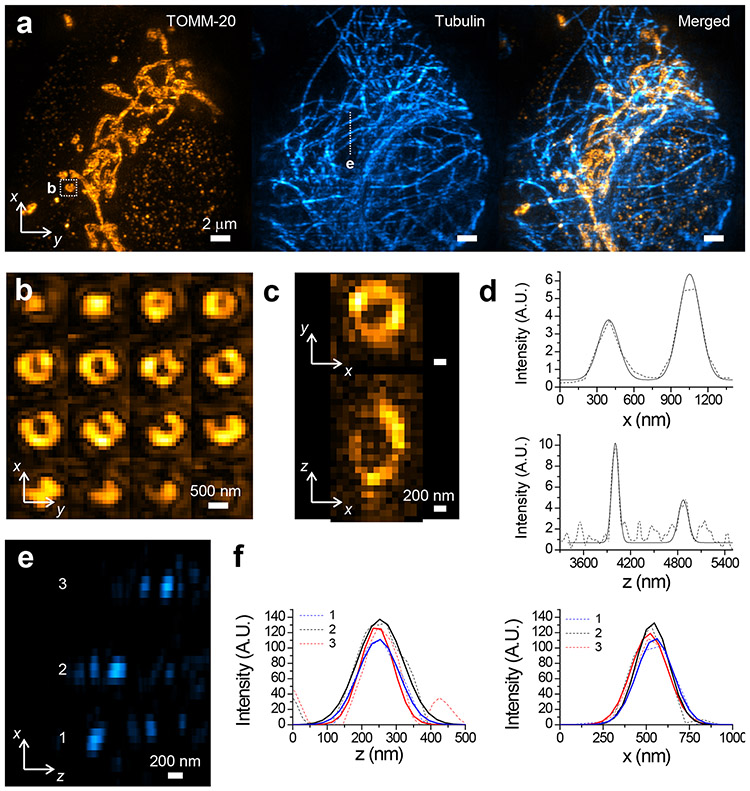
We further performed two-color 3D-iLLS-SIM imaging of mitochondria and microtubules, simultaneously resolving the hollow structure of individual mitochondria and the spatial relationships between mitochondria and microtubules (Figure 4a-f; Supplementary Video 1). The resolution in the shorter wavelength used for imaging mitochondria is 116±25 nm and 185±50 nm in z and x, respectively (FWHM; mean±S.D., n=8 and 8 individual z and x profiles, respectively). Inspection of the Fourier transforms of reconstructed data further illustrates the increased resolution and the improved recovery of axial spatial frequencies of 3D-iLLS-SIM compared to 3D-iLLS using dithered LLS excitation (Extended Data Figure 8b-c). Finally, we tracked mitochondria dynamics in live COS-7 cells using 3D-iLLS-SIM (Figure 5a-c; Supplementary Videos 2 and 3), at ~1 minute/volume temporal resolution and extended xz spatial resolution (143±27 nm z FWHM and 224±43 nm x FWHM; mean±S.D., n=14 and 16 individual z and x profiles, respectively). These results demonstrate the capabilities of extended resolution 3D-iLLS-SIM imaging for multi-color applications and for volumetric time-lapse imaging of sub-cellular dynamics.
Figure 4. 3D-iLLS-SIM enables two-color imaging with extended resolution.
a, Two-color imaging of mitochondria (Tomm-20 Atto647N) and microtubules (tubulin, CF568) in a fixed COS-7 using 3D-iLLS-SIM. Images show maximum intensity projections in the yx plane. b, Montage showing consecutive z sections (100 nm z-steps) through a single mitochondrion (boxed in a). c, Orthoslices and line profiles of the CF 568 immunostained mitochondrion shown in b. Dashed lines: raw data; solid lines: 1D Gaussian peak fits. Fitted FWHM is 110 nm, and 152 nm in z and 199 nm, and 206 nm in x, respectively. e, Orthoslice showing microtubule cross-sections in the zx plane. f, Line profiles (dashed lines) of the microtubules in e, and 1D Gaussian peak fits (solid lines). Fitted FWHM is 140 nm, 157 nm and 114 nm in z and 248 nm, 251 nm, and 225 nm in x, respectively. Two experiments were repeated independently with similar results.
Nanometer localization by 3D-iLLS modulation interferometry
Certain applications such as single-molecule localization-based imaging and single-particle tracking require fast 3D coordinate determination, in a narrow range near the focal plane, with sub-diffraction precision. Such localization measurements can greatly benefit from the reduced background in selective-plane illumination schemes, but conventional LLS microscopy with a single detection objective and astigmatism-based axial detection could only achieve ~40-50 nm z localization precision7, 14, 19. We reason that the ~10× more efficient photon utilization efficiency3 of interferometric vs. astigmatism-based localization and the 2× higher SNR of 3D-iLLS vs. conventional LLS should push the 3D nanometer localization precision to the sub-10 nm regime.
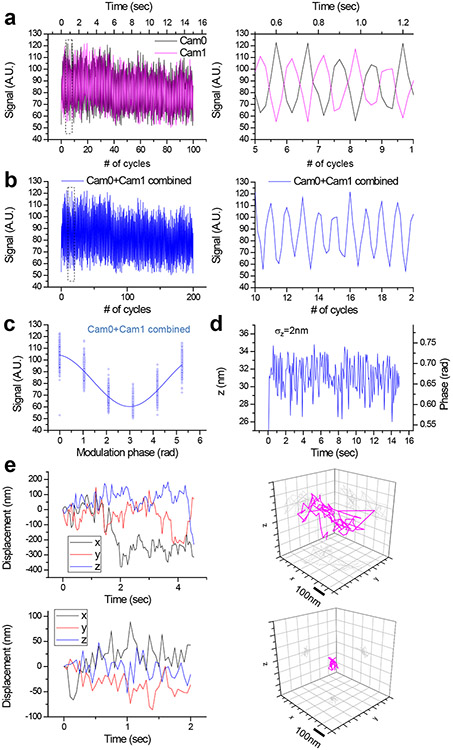
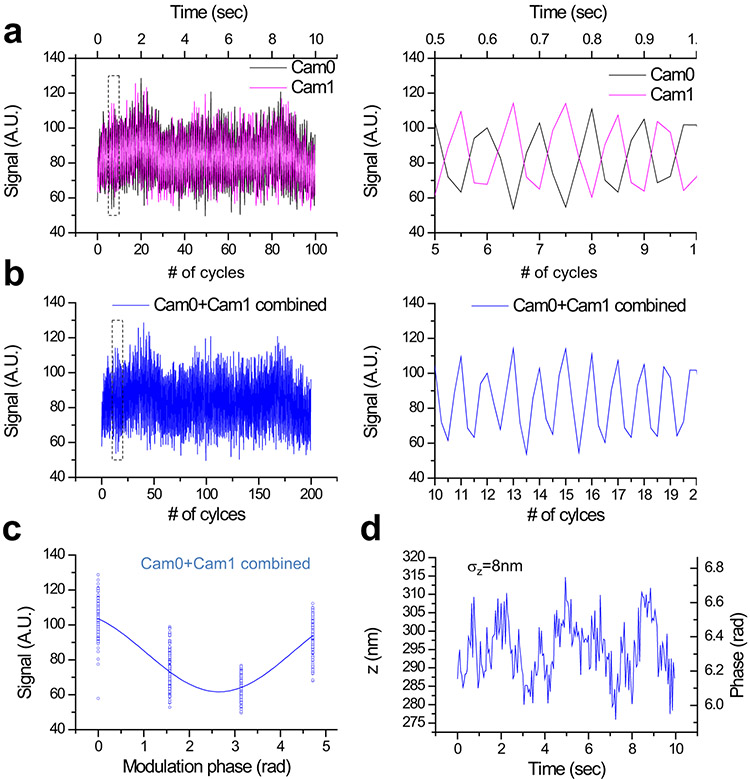
To harness 3D-iLLS for improved z localization precision, we implement modulation interferometry3, a method that previously achieved ~1-2 nm z localization precision. We extract the z position by dynamically modulating the length of one of the interferometer arms and measuring the phase of the ensuing intensity modulation (Figure 6a and Extended Data Figures 9, 10a). Previously modulation inteferometry relied on the coherence of two counter-propagating excitation beams. Here, we instead rely of the coherence of the emitted fluorescent photons. Importantly, in the excitation-only interference configuration, the fluorescence signals in the two ports of the intereferometer beam splitter are in-phase, while for emission-only interference, the two signals are out-of-phase relative to each other. This effect thus enables measuring two phases simultaneously, one on each detection camera (Extended Data Figure 9), which also improves the temporal resolution of modulation interferometry by 2-fold (Figure 6b and Extended Data Figure 10b). Using the combined phases from Cameras 0 and 1, with a 6-phase or 4-phase modulation cycle, our 3D-iLLS setup achieves ≈2 nm and ≈8 nm z localization precision respectively (Figure 6c,d and Extended Data Figure 10c,d). This “open loop” performance, without any active stabilization, indicates short-term mechanical stability of the 3D-iLLS design in the <10 nm regime. 3D-iLLS and modulation interferometry also enabled successfully tracking the 3D movement of single 24×PP7 mRNAs tagged with tdPCP-Halo-JF646 in the cytoplasm of live U-2 OS cells (Figure 6e). These results illustrate how 3D-iLLS can also be exploited for dynamic 3D single-particle tracking in live cells.
Figure 6. 3D-iLLS and modulation interferometry enable improved axial localization and 3D single-particle tracking.
a-d, Axial localization performance with 3D-iLLS and 6-phase modulation interferometry. a, Signals from a 40 nm bead on Cameras 0 and 1, over 100 6-step modulation cycles. The piezoelectric phase shifter is stepped in 121.67 nm increments, corresponding to 0°, 60°, 120°, 180°, 240°and 300° relative phases. Each step lasts 25 msec, for a total of 150 msec per 6-step modulation cycle. Right panel: zoom-in of the dotted region in the left panel, illustrating the anti-correlated signal modulation of Cam0 vs. Cam1. b, Signals from Cam0 and Cam1 are combined into a single modulation cycle, doubling the temporal resolution to 75 msec. Right panel: zoom-in of the dotted region in the left panel. c, Superposition of all 200 modulation cycles by collapsing the x axis in the interval [0-2π), showing excellent stability and reproducibility of the setup. Solid line: fit to a sine wave. d, Extracted phase and z coordinate, showing σz≈2 nm r.m.s. localization precision. e, 3D tracking of single mRNAs in live U-2 OS cells using 3D-iLLS and 4-phase modulation interferometry. The piezoelectric phase shifter is stepped in 182.5 nm increments, corresponding to 0°, 90°, 180° and 270° relative phases. Each 4-step modulation cycle lasts 100 msec. Cam0 and cam1 signals are combined for extracting z coordinates, achieving a final temporal resolution of 50 msec. See also Extended Data Figure 9. Top panels: an mRNA molecule undergoing mostly random Brownian motion; bottom panels: an mRNA molecule confined to a volume of ~20 nm r.m.s. radius in 3D. Two and three experiments were repeated independently with similar results, for a-d and e, respectively.
DISCUSSION
Our results establish 3D-iLLS as a versatile technique with improved volumetric imaging of crowded cellular samples. 3D-iLLS increases the axial (z) resolution to ~100 nm FWHM, compared to ~400 nm FWHM using conventional dithered LLS (after deconvolution, at 640/700 nm excitation/emission wavelengths, respectively). 3D-iLLS-SIM features ~180×250×120 nm FWHM xyz resolution compared to ~180×250×310 nm FWHM xyz resolution for conventional LLS-SIM (both at 560/580 nm excitation/emission wavelengths, respectively). The volume of the overall PSF ovoid (, where rx, ry and rz are the PSF half-width-at-half-maximum along x, y and z, respectively) for 3D-iLLS-SIM as implemented here (NA 1.1 for detection, NA 0.65 for excitation) is almost identical to conventional 3D-SIM with high NA oil immersion lenses (NA 1.4, ~130×130×320 nm FWHM xyz resolution)14, 20, with both techniques featuring ~2.8·10−3 μm PSF volume at 560/580 nm excitation/emission wavelengths, respectively. However, the selective-plane illumination of 3D-iLLS-SIM offers reduced out-of-focus background and photobleaching compared to epi-illumination of conventional 3D-SIM, which facilitates imaging of weak signals. The volumetric resolution is only 17% worse (~2.8·10−3 μm vs. ~2.4·10−3 μm) than what achieved by 3D LLS with non-linear SIM using patterned activation (3D PA NL-SIM; 118×230×170 nm FWHM xyz resolution, for the Skylan-NS fluorophore and 405/488/520 nm photoactivation/excitation/emission wavelengths, respectively)15. 3D-iLLS-SIM, compared to 3D PA NL-SIM, does not require specialized fluorophores or sample exposure to violet light.
Further developments are possible. 3D-iLLS and modulation interferometry3 could enhance 3D single-molecule localization-based super-resolution imaging, with the reduced background being particularly useful when imaging densely labeled samples14. The properties of 3D-iLLS could further be leveraged for future implementations of parallelized methods that use excitation patterns featuring intensity zeros (e.g. 3D MINFLUX21) and for enhancing precision and reducing background in other modulation-enhanced localization microscopy approaches22-25, particularly for single-particle tracking and localization imaging in live cells.
Our current 3D-iLLS implementation exhibits adequate short-term stability for many applications. For prolonged time-lapse observations or for localization-based super-resolution imaging requiring hrs-long acquisitions, active stabilization, as we previously implemented for a 4Pi modulation interferometry setup3, could be further employed to ensure registration between the two opposed lenses and correct for phase shifts of the interferometer. Adaptive optics26 to correct for system and sample induced aberrations could further optimize the interferometric PSF properties, reducing the axial extend of the detection and excitation PSFs and well as better matching the detection PSFs to increase coherence, and maintaining these optical properties for 3D-iLLS imaging of optically thicker, multi-cellular systems.
3D-iLLS-SIM offers increased OTF contiguity compared to 3D-iLLS with dithered LLS, but some ringing is still present in the final reconstructions. Additional deconvolution after SIM reconstruction might further improve image quality27. However multiple reasons might underlie this remaining ringing: imperfect experimental OTF calibrations or imprecise illumination parameter estimation used for SIM reconstruction, as well as sample-induced phase differences between the two detection arms and subtle distortions of the LLS excitation pattern due to system- and sample-induced aberrations. Beyond affecting global image quality, such effects could also result in an effective OTF that is spatially-varying throughout the sample volume. System aberrations could be corrected or accounted for by more detailed OTF calibrations, but sample-induced effects might be more difficult to predict a priori. More elaborate data acquisition and image reconstruction schemes could then be explored to mitigate such effects: use of spatially-varying SIM reconstruction parameters28, 29 and/or a spatially-varying OTF30-32, e.g. obtained by OTF calibrations at multiple points of the field-of-view and/or data acquisitions with different phase-shifter settings.
Our present 3D-iLLS implementation could also be easily modified for multi-color super-resolution imaging that relies on single-molecule discrimination between spectrally overlapping dyes33-35. To image two spectrally well-separated dyes, we performed two-color imaging sequentially, refocusing the objective lenses after completing a z-stack for the first color. Quasi-simultaneous, e.g. by interlacing different colors at each z position, multi-color 3D-iLLS live-cell imaging and single-particle tracking could be achieved using fast adaptive optics, such as deformable mirrors, in the detection path, to enable real-time corrections of chromatic aberrations. The recently discovered Field Synthesis Theorem36 could also be explored as an alternative to dithered LLS, to possibly generate excitation patterns for 3D-iLLS that better fill the OTF. Finally, our design can be further augmented by introducing additional excitation lenses37 and implementing full 3D SIM schemes4, 18, for eventual live-cell 3D-iLLS-SIM at sub-100 nm isotropic 3D resolution.
Online Methods.
3D-iLLS microscope setup.
The 3D-iLLS setup is built on an actively stabilized vibration isolation platform (TMC, Stacis iX) inside a temperature-controlled room. The 3D-iLLS microscope consists of a LLS excitation path orthogonal to the optical axis of two opposed detection lenses in a 4Pi interferometric arrangement. We use a custom 26.7× 0.7 NA excitation objective lens (Special Optics, 54-10-7) and two 25× 1.1 NA detection objective lenses (Nikon, MRD77225).
Detection path.
The first detection lens is mounted on a 3D flexure stage driven by differential micrometers (Thorlabs, MBT616D). The second detection lens is mounted on a 3D flexure stage configured with differential micrometers and additional closed-loop piezoelectric actuators (Thorlabs, MAX301). An additional 50mm-travel stage driven by a stepper motor (Thorlabs, LNR50S) is used for coarse positioning of the second detection lens. The interferometric detection path is similar to our previous modulation interferometry setup3, including a motorized platform for coarse path-length scanning and a piezoelectric phase shifter for fine-tuning/fast modulation (Physik Instrumente, S-303.CD with E-709.CHG controller). The fluorescence beams from the two detection lenses interfere at a non-polarizing beam splitter, and the light from the two exit ports is filtered using quad notch filters (Semrock, StopLine NFO3-405/488/561/635E-25) and emission filters (Chroma, ET525/50m, ET595/50m, and ET700/75m; selectable using a filter wheel; Thorlabs, FW103H), before it is imaged onto two sCMOS cameras (Hamamatsu, C11440-22CU) with two f=50cm achromatic lenses. Final magnification is ≈100 nm/pixel.
Excitation path.
The excitation path is built based on the originally reported LLS design7. An ATOF device (AA OPTO-ELECTRONIC, ATFnC-400.650-TN and MPDS8C driver) facilitates on-off switching of CW laser beams (488 nm, 560 nm, and 642 nm; MPB Communications, 2RU-VFL-P-500-488-B1R, 2RU-VFL-P-500-560-B1R, and 2RU-VFL-P-500-642-B1R or 2RU-VFL-P-2000-642-B1R, respectively) and modulating laser power. An elliptical lens telescope reshapes the excitation beams before they are spatially modulated by a combination of a phase-only spatial-light-modulator (SLM; Forth Dimension Displays, QXGA-3DM), an achromatic quarter-wave plate and a polarizing beam splitter cube. The modulated beam is Fourier-Transformed with a lens and the unmodulated light is blocked using a custom annular mask (Photo Sciences, custom design). The resulting 2D optical lattice is dithered using an x-axis galvanometer (Thorlabs, GVS001), placed at a plane conjugate to the Back-Focal-Plane (BFP) of the excitation lens. Sample- and BFP-conjugate cameras (Thorlabs, DCC1545M and Edmund EO-0312M) are used for inspection of the 2D lattice pattern.
Instrument control and synchronization.
Instrument control and synchronization are achieved with a custom Lab-VIEW (National Instruments, 2015 64-bit) application and an FPGA-based real-time hardware system (National Instruments, PCIe-7852R LX50).
Sample mounting and sample cell.
To position electron microscopy grids in the space between the 3 objective lenses, we machine a pincher-grip sample holder out of a stainless-steel rod. The sample holder is mounted on a rotation mount and pitch-adjustable kinematic adapter (Thorlabs, RSP05 and TPA01), which are further mounted on a 3D nanopositioning stage (Physik Instrumente, P-733.3DD with E-727.3CDA controller) and an xyz micrometer-driven translation stage (Thorlabs, LNR25M). The sample is immersed from the top into a cubic chamber machined out of stainless-steel (Extended Data Figure 3). Three of the horizontal faces of the chamber contain openings for the detection and excitation lenses. Silicone sheets (~100 μm thick) stretch over each lens and provide sealing. The fourth horizontal face of the sample holder contains a glass window for observing the interior of the chamber.
Live-cell imaging.
For live-cell imaging, the temperature of the three objectives and the sample cell is regulated to ~37°C, using resistive heaters and thermistor sensors, except for the experiment in Figure 5a-d, which was performed at 23°C. A separate temperature controller (Thorlabs, TC200) regulates the temperature of each objective lens, as well as a heating plate at the base and a cover plate at the top of the sample cell respectively. The exact temperature set-points are determined empirically, while the temperature of the media inside the sample cell is verified with an independent out-of-loop probe. The top cover plate is further used for delivering a mixture of N2, CO2 and O2 gases, with flow-rates controlled by three independent mass-flow controllers (Omega Engineering).
Cell lines.
Human osteosarcoma cells with 24×MS2-tagged RNAs were derived from U-2 OS cells (ATCC HTB-96; human, female – no additional cell line authentification performed). We used CMV clone 5 cells13, which contain two integrations of a 24×MS2 mini-gene driven by the CMV immediate early promoter and enhancer. Mouse embryonic stem cell lines for imaging the nuclear organization of Brd4 were derived from Bruce 4 mESCs (Millipore Sigma CMTI-2; murine strain C57/BL6J, male—species/sex verified by karyotyping, no additional cell-line authentication performed). We used OMG SNAP-Brd4 clone 9 cells13, which contain biallelic integrations of SNAP-tag at the Brd4 locus. COS-7 cells used for microtubule and mitochondria imaging were obtained from ATCC (ATCC, CRL-1651; no additional cell-line authentication performed). All cell lines tested negative for mycoplasma.
Cell sample preparation.
EM grid preparation, bead deposition and cell seeding.
Cells were cultured on gold electron microscopy (EM) grids with Formvar films (Ted-Pella, 01703G). For mESC cells, EM grids were pre-coated with 5mg/ml laminin (BioLamina LN511) at 37°C overnight in a humidified 5% CO2 incubator. For U-2 OS and COS-7 cells, EM grids were pre-coated with collagen (Sigma C8919) at 37°C overnight in a humidified 5% CO2 incubator. In both cases, the EM grids were coated with the Formvar film facing up. After coating, EM grids were briefly rinsed with 1×PBS solution and flipped over for adding fluorescent bead fiducials. 0.1 μm TetraSpeck beads (ThermoFisher Scientific T7279) were diluted 1:300 with 1×PBS and MgCl2 was added to the diluted beads to a final concentration of ~ 0.1M. Diluted beads were then deposited onto EM grids for 10min at 37°C and removed, and rinsed briefly with 1×PBS. EM grids were then flipped over with the Formvar film facing up and placed in glass bottom microwell dishes (MatTek, P35G-1.5-14-C), ready for cell seeding. Cells were trypsinized, counted and ~ 0.3 million cells were seeded in the appropriate media. As 3D-iLLS imaging requires optical access from 3 sides, cells growing attached on the Formvar film near the middle of the grid holes, and that could be illuminated and imaged unobstructed from the grid bars, were selected for imaging experiments.
Cell culture and staining.
All cell cultures were maintained at 37°C, in 5% v/v CO2 atmosphere, in a humidified incubator. Brd4 OMG cells were cultured with +2i media with 400 μg/ml G418 (Sigma G8168-10ML) on 0.1% gelatin-coated dish, at 37°C in a humidified 5% CO2 incubator. +2i media contain D-MEM (Thermo Fisher Scientific 10313021), 15% fetal bovine serum (Gemini Bio 100-500), 0.1 mM 2-mercaptoethanol (Thermo Fisher Scientific 21985023), 2 mM L-alanyl-L-glutamine (Thermo Fisher Scientific 35050079), 1× MEM nonessential amino acids (Thermo Fisher Scientific 11140076), 1000 U/mL LIF (Millipore ESG1107), 3 μM CHIR99021 (Millipore 361559) and 1 μM PD0325901 (Axon Medchem 1408). Before imaging, cells were seeded with −2i media plus 400 μg/ml G418. For SiR staining, cells were labeled with 0.3μM SiR-BG for 10 min, at 37°C, followed by three times rinsing with new media.
CMV clone 5 cells were maintained in McCoy’s 5A media without phenol-red (GE Healthcare SH30200.01), supplemented with 10% fetal bovine serum (Gemini Bio, 100-500), 1× Non-essential Amino Acids Solution (Thermo Fisher Scientific 11140050), 1mM Sodium Pyruvate (Thermo Fisher Scientific 11360070), 100U/mL Penicillin-Streptomycin (Thermo Fisher Scientific, 15140122) plus 1 μg/ml α-amanitin (Sigma A2232) and 1μg/ml Puromycin (Sigma P8833). CMV clone 5 cells were nucleofected with 0.2μg tdPCP-Halo and 0.5μg TetR-RFP plasmids (Amaxa kit VCA-1003, Lonza) and seeded with media containing α-amanitin and Puromycin. 1-3 days post-nucleofection cells were stained with JF646-SNAP-tag ligand (JF646-BG) and used for imaging experiments. For staining, cells were incubated with media containing 1μM JF646-BG for 1hr, rinsed once with new media, and replaced with new media containing drugs.
COS-7 cells were maintained in EMEM (ATCC, 30-2003) media, supplemented with 10% fetal bovine serum (Gemini Bio, 100-500) and 100U/mL Penicillin-Streptomycin (Thermo Fisher Scientific, 15140122). COS-7 cells were transfected with plasmids (Tomm-20 Halo, Addgene 123284) and then plated in EMEM media. 1-4 days post transfection cells were seeded onto collagen-coated EM grids. Before live-cell imaging, cells were incubated with EMEM media containing 1μM JF646-Halo for 1hr, rinsed once with new media, and placed in fresh media.
Cell fixation.
Cells were fixed with freshly-prepared 4% v/v methanol-free Formaldehyde (Thermo Scientific 28906) in 1×PBS at room temperature for 10 min, and then rinsed 3 times with 1×PBS. After fixation, samples were stored at 4°C.
Cell immunofluorescence.
EM grids seeded with COS-7 cells were briefly rinsed PBS and then fixed with 3% v/v formaldehyde and 0.1% v/v glutaraldehyde in PBS for 10 min at RT. The fixed cells were further rinsed with PBS and quenched with freshly made 0.1% w/v sodium borohydride in PBS for 7 min. Next, the cells were permeabilized with blocking buffer (3 % BSA, 0.5 % Triton X-100 in PBS) for 10 min and stained with primary antibodies (Mouse anti-α-tubulin, Thermo Fisher Scientific 32-2500, 1/100 dilution; Rabbit anti-Tomm20, Sigma HPA011562, 1/50 dilution) for 2 hr in blocking buffer. The sample was further washed with a washing buffer (0.2 % BSA, 0.1 % Triton X-100 in PBS) three times for 10 min each. The sample was incubated for 2 hr with secondary antibodies (Goat Anti-Mouse-IgG-Atto647N, Sigma 50185, 1/300 dilution; Donkey Anti-Rabbit IgG-CF568, Sigma SAB4600076, 1/800 dilution) in blocking buffer, and then rinsed washed with PBS three times for 10 min each. Finally, the sample was post-fixed with 3% v/v formaldehyde and 0.1% v/v glutaraldehyde in PBS for 10 min at RT, and then stored in PBS at 4 °C until imaging.
Bead alignment/calibration sample.
For routine alignment and calibration of the instrument, we use a mixture of 40 nm spheres (Thermo Fisher Scientific, TransFluoSpheres 488/645, T10711) as well the 0.1μm Tetraspek beads deposited on gold EM grids with Formvar films. The 0.1 μm beads provide higher signal and can facilitate fast mapping of the LLS excitation profile, while the 40 nm spheres are used for fine-tuning the interferometer alignment.
Data acquisition and analysis.
3D-iLLS and conventional LLS imaging is performed by scanning the sample through the stationary LLS excitation pattern. We scan the sample simultaneously in yz along an axis ~35° relatively to the LLS propagation direction (Extended Data Figure 3c). The z step size is 20 nm and the exposure time is 10 msec (the SLM sequence consists of consecutive balanced positive and negative images7, each lasting 10 msec; laser exposure was performed only in the first 10 msec, during the positive SLM image). We note that the speed constraints for 3D-iLLS are similar to conventional LLS, but to accommodate the increased z resolution, finer axial sampling and thus smaller z step size is needed. Exposures down to a few msec are also within the capabilities of the 3D-iLLS hardware in use (sCMOS camera, galvanometer and piezoelectric nanopositioners).
3D-iLLS-SIM acquisition was performed with five LLS excitation pattern phases (spaced by 2π/5), by stepping the x galvanometer. Five sequential exposures were performed at each z position before moving to the next z position. We imaged a 27×27×10 μm3 volume, obtaining a total of 5×500 = 2500 raw images per volume. Each raw image required ≈25 msec, for a total of ≈62.5 sec per volume. Two-color 3D-iLLS-SIM imaging was performed sequentially, by refocusing the detection lenses after a z stack for the first color was completed, using a bead fiducial.
3D particle tracking using modulation interferometry is performed by keeping the sample stationary and stepping the piezoelectric phase shifter in increments corresponding to relative phase changes of 90° or 60°, for 4-step and 6-step modulation cycles, respectively. For far-red fluorescence emission, the step sizes are 182.5 nm and 121.67 nm respectively, as one modulation period corresponds to ≈730 nm translation of the phase shifter. Raw image data are saved in binary format and imported for processing in MATLAB (Mathworks, 2014b or 2020a).
Generation of LLS excitation patterns.
For 3D-iLLS with minimal overall PSF side lobes the thinnest achievable LLS excitation is desired. Based on our numerical calculations (Extended Data Figures 1-2, 5b-i, 6-7), we used a fundamental rectangular lattice, with wave-vector corresponding to 0.59 NA and annular mask corresponding to NA range of 0.52-0.65. The main excitation peak is ~500 nm FWHM, with additional weaker excitation peaks above and below. For 3D-iLLS with excitation confined to a single plane and for single-particle tracking with modulation interferometry, we used a fundamental square maximally symmetric lattice, with wave-vector corresponding to 0.6 or 0.64 NA and annular mask corresponding to NA range of 0.59-0.65. The main excitation peak is ~1 μm FWHM. For 3D-iLLS-SIM, as a tradeoff between speed (dictated by number of phase-stepped images required for SIM reconstruction) and OTF uniformity, we used a maximally symmetric fundamental hexagonal lattice (requiring 5 stepped images), with wave-vector corresponding to 0.58 NA and annular mask corresponding to NA range of 0.52-0.65.
3D-iLLS and 3D-iLLS-SIM volume reconstruction.
Raw 3D-iLLS and conventional LLS data were deskewed and deconvolved in MATLAB using the measured PSF. Deconvolution was applied to the images in Figures 2a,b but not to Figs. 2c,d. Deconvolution was performed using 10 iterations the Richarson-Lucy algorithm with no damping. For reconstruction, only the constructive interference channel (Cam0) was used, although future work could focus on how to best combine the information from both constructive and destructive interference channels for optimal reconstruction.
3D-iLLS-SIM reconstruction was performed with the original 3D-SIM algorithm18 implemented in MATLAB, with an experimental OTF calibration for each wavelength using 100 nm fluorescent Tetraspek beads. Before 3D-SIM reconstruction, background was subtracted using a rolling-ball filter38, which also removes some out-of-focus signal that could create high-frequency reconstruction artifacts27. For the SIM reconstruction parameters the original algorithm was slightly modified, as follows: the modulation wavevector p was determined directly by peak-fitting the discrete Fourier transform (DFT) of the raw data. The DFT was calculated on a fine grid (10-fold upsampling factor compared to the 1/256 pixels−1 frequency resolution of the raw 256×256 image data), in a small region in Fourier space close to the expected peak position, to obtain the modulation wavevector at sub-pixel precision. We found that the exact value of the initial modulation phase parameter, φ0, did not significantly affect the reconstruction results; thus, instead of estimating it computationally from the raw data, φ0 was set manually based on the approximate experimental value (determined by the x galvo position) and adjusted (if needed) after inspecting the reconstructed data. The Wiener parameter, w, was set empirically, by inspecting the reconstructed data and balancing a trade-off between resolution and SNR: too large w results in blurred images and gaps in the FT of the reconstructed data, while too small w results in significant high-frequency noise.
Two-color SIM imaging was performed sequentially for each color. The two colors were aligned and registered in 3D using Tetrapek fluorescence bead fiducials attached on the EM grid. Live-cell time-lapse 3D-iLLS-SIM data were corrected for photobleaching using exponential fitting. The volumetric data were imported in ImageJ for visualization and maximum intensity projection calculations.
3D-iLLS particle tracking using modulation interferometry.
Raw images were imported in ImageJ and the frames from each modulation cycle were grouped together in a single maximum projection image. The maximum projection images were imported in MATLAB for 2D particle tracking analysis39. The trajectories of selected particles were further refined by performing a 2D Gaussian fit in 11×11 pixel ROIs to obtain more accurate xy coordinates. For obtaining the z coordinate, we first sum the intensity of the pixels in a 7×7 pixel ROI centered on the xy coordinate of the particle. To combine the intensities measured from Cam0 and Cam1, the intensity of Cam1 is rescaled to the same mean and standard deviation as Cam0.
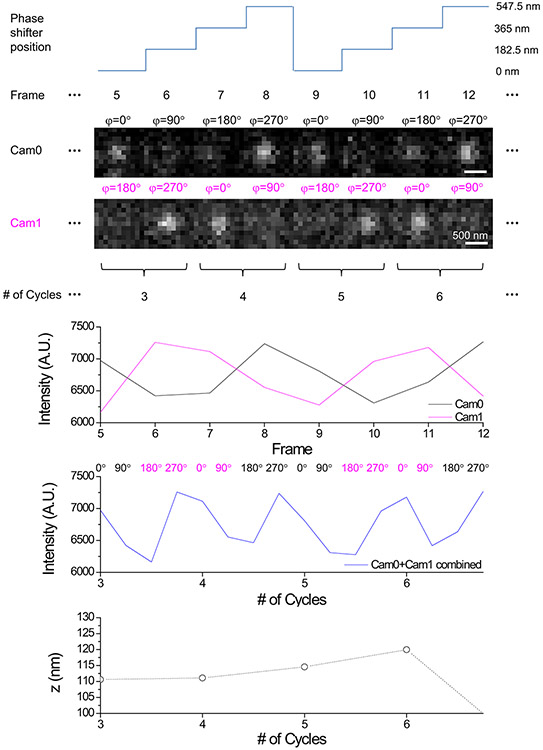
The procedure for combining the intensities of Cam0 and Cam1 is illustrated in Extended Data Figure 9, and proceed as follows. During each n-step modulation cycle (n=4 or 6), in the first half of the cycle, Cam0 and Cam1 measure phases in the intervals 0°−180° and 180°−360°, respectively. Thus, the intensities from the two cameras measured in the first half (corresponding to the first n/2 steps of the phase shifter) can be combined in a single complete n-step modulation cycle. Similarly, in the second half of the cycle Cam0 and Cam1 now measure phases in the intervals 180°−360° and 0°−180°, respectively. The intensities from the two cameras measured in the second half (corresponding to the last n/2 steps of the phase shifter) can also be combined in a separate complete n-step modulation cycle. The end result is two successive n-step modulation cycles, each corresponding to half of the original n-step modulation cycle.
To extract z position, we calculate the phase of the intensity modulation in each cycle. As two z position measurements can be extracted from each original n-step modulation cycle (Extended Data Fig. 9), the net effect is a 2-fold increase in temporal resolution. In each step, the modulation phase is extracted in a 2π interval centered on the previous phase. We note that for particle displacements over successive cycles small compared to half of an interferometric period (a range of Δz ≈ 265nm/2 = 132.5nm), this procedure also enables phase unwrapping and tracking over multiple interferometric fringes.
Data Availability
Datasets that support results in the paper are available in the Zenodo repository, 10.5281/zenodo.4795421.
Code Availability
Custom-written analysis code is available in the Zenodo repository, 10.5281/zenodo.4795421. Data acquisition and instrument control software can be requested for academic use from the corresponding author, after executing material transfer agreements with MSKCC.
Extended Data
Extended Data Figure 1. Numerical calculation of 3D-iLLS PSFs.
a, Simulation pipeline. b, Near uniform sampling of 214 orientations viewed from three angles.
Extended Data Figure 2. Numerical 3D-iLLS PSFs for different excitation lattices and comparison with conventional LLS.
Overall PSFs are calculated for 2pi detection and for 4pi constructive and destructive detection. Simulation parameters are given in Supplementary Tables 1 and 2.
Extended Data Figure 3. Three-objective 3D-iLLS configuration, liquid sample cell, sample holder and sample mounting geometry.
a, Photograph of 3D-iLLS setup, highlighting the three-objective configuration, the liquid sample cell and the top-immersion sample holder. b, Photograph of the pincher-grip sample holder with mounted EM grid. c, Sample mounting geometry.
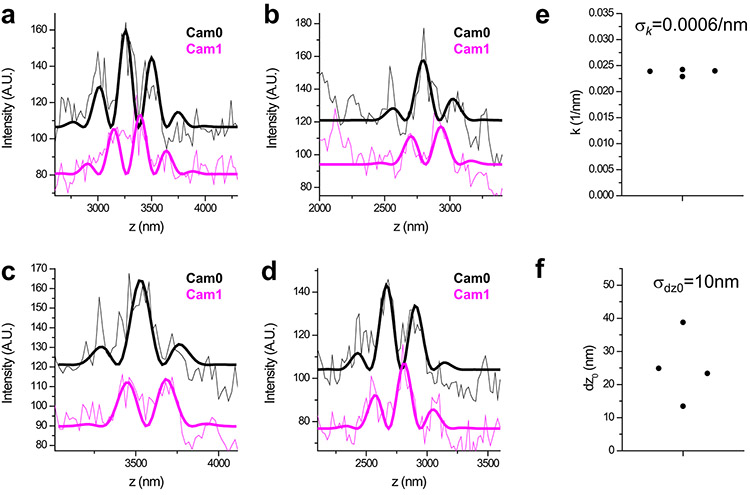
Extended Data Figure 4. Localization of Brd4 clusters in reconstructed 3D-iLLS images.
a-d, Axial profiles of individual Brd4 clusters. Thick lines show non-linear least-squares fits to equations of the form for Cam0 and Cam1, respectively. Global fitting is performed, with shared k,θ and σz parameters. We obtain two separate localization measurements of the parameter z0 that indicates the center position of the cluster, estimated independently from Cam0 and Cam1. e, Oscillation wave-vector k is 0.02375±0.00059 nm−1 (mean±SD), indicating a relative error σk/k of ≈2.5%. f, The center position z0 shows a systematic offset between the two cameras of dz0=25nm and an r.m.s localization error σdz0=10 nm. These systematic and random errors relative to the oscillation period (2π/k=265nm) are ≈9% and ≈4% respectively.
Extended Data Figure 5. Reduction of axial side-lobes by deconvolution and optimization of the 3D-iLLS PSF.
a, Reduction of side-lobes in 3D-iLLS imaging using deconvolution. Top: raw z profiles of two individual mRNA molecules, from the data in Figure 2a. Bottom: z profiles of the same mRNAs, after 10 iterations of the Richardson-Lucy deconvolution algorithm with an experimental PSF. b-i, Optimized 3D-iLLS PSF based on a fundamental rectangular 2D bound lattice. b, SLM pattern and c, corresponding intensity at rear pupil. d Annular mask. e, Intensity at rear pupil after annular mask. f, Resulting 2D bound lattice in real space and g, corresponding dithered lattice excitation pattern. h, Axial profile of conventional LLS PSFs. i, Axial profile of 3D-iLLS PSFs. Cyan: excitation; yellow: detection; gray: overall.
Extended Data Figure 6. Comparison of OTFs obtained by conventional LLS, 3D-iLLS, conventional LLS-SIM and 3D-iLLS-SIM.
Simulation parameters are given in Supplementary Tables 1 and 2.
Extended Data Figure 7. Line profiles of OTFs and PSFs obtained by conventional LLS, 3D-iLLS, conventional LLS-SIM and 3D-iLLS-SIM.
a, conventional LLS and 3D-iLLS based on dithered LLS excitation. b, conventional LLS-SIM and 3D-iLLS-SIM based on SIM LLS excitation. Line profiles along the kz axis (kx=0, ky=0) and z axis (x=0, y=0) are shown for OTFs and PSFs, respectively. Simulation parameters are given in Supplementary Tables 1 and 2.
Extended Data Figure 8. Resolution and recovery of spatial frequencies of conventional LLS-SIM vs. 3D-iLLS-SIM.
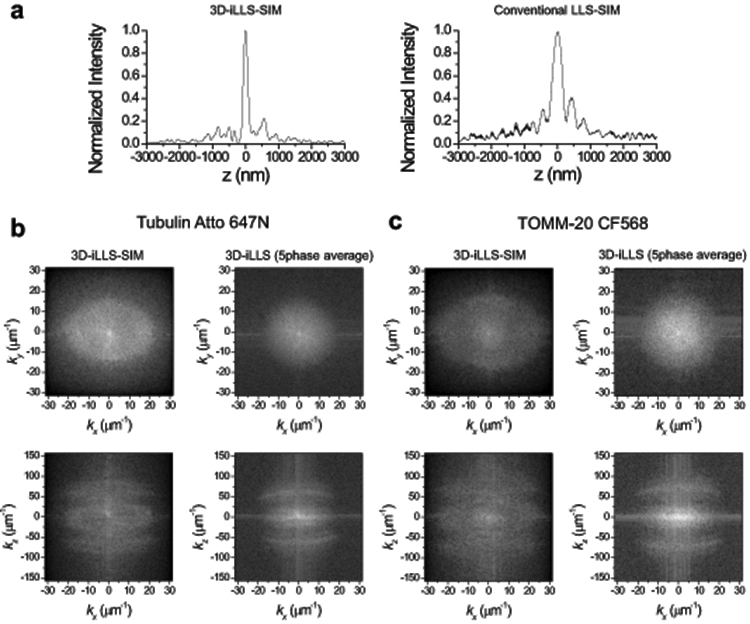
a, Conventional LLS-SIM vs. 3D-iLLS-SIM of microtubules. Average z profile obtained from n=9 and 7 individual microtubules from the 3D-iLLS-SIM and conventional LLS-SIM data in Figure 3a. b,c, Fourier transforms of 3D-iLLS-SIM vs. 3D-iLLS images of microtubules and mitochondria. Fourier transforms S(k) correspond to the real-space data shown in Figure 4a. Maps show log(∣S(k)∣) in the kxky and kxkz planes. 3D-iLLS data are obtained from the 3D-iLLS-SIM data by 5-phase averaging. Two experiments were repeated independently with similar results.
Extended Data Figure 9. Illustration of z tracking using 3D-iLLS modulation interferometry with a 4-step modulation cycle.
Data corresponds to part of the trajectory of a single mRNA molecule (shown in the second row of Figure 4e). Top trace shows the displacement of the phase shifter. Four steps are taken, each corresponding to 1/4th of the interferometric period. The black and magenta traces show the intensity of the Cam0 and Cam1 images in each frame. In each step, two phases are measured simultaneously, one on each camera. The images from the first half of each original 4-step modulation cycle - corresponding to φ=0° and 90° measured on Cam0 and φ=180° and 270° measured on Cam1– are combined in a single modulation cycle. Similarly, the images from the second half of the original 4-step modulation cycle - corresponding to φ=180° and 270° measured on Cam0 and φ=0° and 90° measured on Cam1 – are combined in a separate second modulation cycle. The blue line shows this combined Cam0+Cam1 intensity trace. The z position is then extracted by the phase of the intensity modulation, resulting in two successive z position measurements, one each for the first and second part of the original 4-step modulation cycle.
Extended Data Figure 10. Axial localization performance with 3D-iLLS and 4-phase modulation interferometry.
a, Signals from a 40 nm bead on Cameras 0 and 1, over 100 4-step modulation cycles. The piezoelectric phase shifter is stepped in 182.5nm increments, corresponding to 0°, 90°, 180° and 270° relative phases. Each step lasts 25 msec, for a total of 100 msec per 4-step modulation cycle Right panel: zoom-in of the dotted region in the left panel, illustrating the anti-correlated signal modulation of Cam0 vs. Cam1. b, Signals from Cam0 and Cam1 are combined into a single modulation cycle, doubling the temporal resolution to 50 msec. Right panel: zoom-in of the dotted region in the left panel. c, Superposition of all 200 modulation cycles by collapsing the x axis in the interval [0-2π), showing excellent stability and reproducibility of the setup. Solid line: fit to a sine wave. d, Extracted phase and z coordinate, showing σz ≈ 8 nm r.m.s. localization precision. Two experiments were repeated independently with similar results.
Supplementary Material
3D rendering of two-color 3D-iLLS-SIM imaging. Mitochondria (orange) and microtubules (cyan) are visualized in a fixed COS-7 cell, as displayed in Figure 4a
3D rendering of 3D-iLLS-SIM imaging in a live COS-7 cell. Mitochondria are visualized in a live COS-7 cell, as displayed in Figure 5a.
Time-lapse 3D-iLLS-SIM imaging. The dynamics of a single mitochondrion are followed in 1 minute intervals, as displayed in Figure 5d.
Acknowledgements
We thank Gregory Ayzenberg (MSKCC Medical Physics) for expert machining, Daniel Mazover for assistance with CAD and Luke Lavis for dye reagents. This work was supported by a NYSTEM Postdoctoral Training Award (C32599GG; J.L.), a National Cancer Institute Grant (P30 CA008748) and by a National Institutes of Health (NIH) Director’s New Innovator Award (1DP2GM105443-01; A.P.), the Louis V. Gerstner, Jr. Young Investigators Fund (A.P.) and the National Institute of General Medical Sciences of NIH (1R01GM135545-01 and 1R21GM134342-01; A.P.).
Competing Interests
MSKCC has filed patent applications, WO2018106678A1, 62/430117, 63/070125, relating to this work, with A.P. and G.W. listed as inventors.
References
- 1.Hell S & Stelzer EHK Properties of a 4pi Confocal Fluorescence Microscope. J Opt Soc Am A 9, 2159–2166 (1992). [Google Scholar]
- 2.Gustafsson MGL, Agard DA & Sedat JW Sevenfold Improvement of Axial Resolution in 3d Widefield Microscopy Using 2 Objective Lenses. P Soc Photo-Opt Ins 2412, 147–156 (1995). [Google Scholar]
- 3.Wang G, Hauver J, Thomas Z, Darst SA & Pertsinidis A Single-Molecule Real-Time 3D Imaging of the Transcription Cycle by Modulation Interferometry. Cell 167, 1839–1852 e1821 (2016). [DOI] [PMC free article] [PubMed] [Google Scholar]
- 4.Gustafsson MG, Agard DA & Sedat JW I5M: 3D widefield light microscopy with better than 100 nm axial resolution. J Microsc 195, 10–16 (1999). [DOI] [PubMed] [Google Scholar]
- 5.Shtengel G et al. Interferometric fluorescent super-resolution microscopy resolves 3D cellular ultrastructure. Proc Natl Acad Sci U S A 106, 3125–3130 (2009). [DOI] [PMC free article] [PubMed] [Google Scholar]
- 6.Aquino D et al. Two-color nanoscopy of three-dimensional volumes by 4Pi detection of stochastically switched fluorophores. Nat Methods 8, 353–359 (2011). [DOI] [PubMed] [Google Scholar]
- 7.Chen BC et al. Lattice light-sheet microscopy: imaging molecules to embryos at high spatiotemporal resolution. Science 346, 1257998 (2014). [DOI] [PMC free article] [PubMed] [Google Scholar]
- 8.Gao L et al. Noninvasive imaging beyond the diffraction limit of 3D dynamics in thickly fluorescent specimens. Cell 151, 1370–1385 (2012). [DOI] [PMC free article] [PubMed] [Google Scholar]
- 9.Gebhardt JC et al. Single-molecule imaging of transcription factor binding to DNA in live mammalian cells. Nat Methods 10, 421–426 (2013). [DOI] [PMC free article] [PubMed] [Google Scholar]
- 10.Huisken J, Swoger J, Del Bene F, Wittbrodt J & Stelzer EH Optical sectioning deep inside live embryos by selective plane illumination microscopy. Science 305, 1007–1009 (2004). [DOI] [PubMed] [Google Scholar]
- 11.Planchon TA et al. Rapid three-dimensional isotropic imaging of living cells using Bessel beam plane illumination. Nat Methods 8, 417–423 (2011). [DOI] [PMC free article] [PubMed] [Google Scholar]
- 12.Vettenburg T et al. Light-sheet microscopy using an Airy beam. Nat Methods 11, 541–544 (2014). [DOI] [PubMed] [Google Scholar]
- 13.Li J et al. Single-Molecule Nanoscopy Elucidates RNA Polymerase II Transcription at Single Genes in Live Cells. Cell 178, 491–506 e428 (2019). [DOI] [PMC free article] [PubMed] [Google Scholar]
- 14.Legant WR et al. High-density three-dimensional localization microscopy across large volumes. Nat Methods 13, 359–365 (2016). [DOI] [PMC free article] [PubMed] [Google Scholar]
- 15.Li D et al. ADVANCED IMAGING. Extended-resolution structured illumination imaging of endocytic and cytoskeletal dynamics. Science 349, aab3500 (2015). [DOI] [PMC free article] [PubMed] [Google Scholar]
- 16.Nagorni M & Hell SW Coherent use of opposing lenses for axial resolution increase in fluorescence microscopy. I. Comparative study of concepts. J Opt Soc Am A Opt Image Sci Vis 18, 36–48 (2001). [DOI] [PubMed] [Google Scholar]
- 17.Nagorni M & Hell SW Coherent use of opposing lenses for axial resolution increase. II. Power and limitation of nonlinear image restoration. J Opt Soc Am A Opt Image Sci Vis 18, 49–54 (2001). [DOI] [PubMed] [Google Scholar]
- 18.Gustafsson MG et al. Three-dimensional resolution doubling in wide-field fluorescence microscopy by structured illumination. Biophys J 94, 4957–4970 (2008). [DOI] [PMC free article] [PubMed] [Google Scholar]
- 19.Liu Z et al. 3D imaging of Sox2 enhancer clusters in embryonic stem cells. elife 3, e04236 (2014). [DOI] [PMC free article] [PubMed] [Google Scholar]
- 20.Fiolka R, Shao L, Rego EH, Davidson MW & Gustafsson MGL Time-lapse two-color 3D imaging of live cells with doubled resolution using structured illumination. P Natl Acad Sci USA 109, 5311–5315 (2012). [DOI] [PMC free article] [PubMed] [Google Scholar]
- 21.Gwosch KC et al. MINFLUX nanoscopy delivers 3D multicolor nanometer resolution in cells. Nat Methods 17, 217–224 (2020). [DOI] [PubMed] [Google Scholar]
- 22.Gu L et al. Molecular resolution imaging by repetitive optical selective exposure. Nature methods 16, 1114–1118 (2019). [DOI] [PubMed] [Google Scholar]
- 23.Reymond L et al. SIMPLE: Structured illumination based point localization estimator with enhanced precision. Optics express 27, 24578–24590 (2019). [DOI] [PubMed] [Google Scholar]
- 24.Reymond L, Huser T, Ruprecht V & Wieser S Modulation-enhanced localization microscopy. J Phys-Photonics 2 (2020). [Google Scholar]
- 25.Cnossen J et al. Localization microscopy at doubled precision with patterned illumination. Nature methods 17, 59–63 (2020). [DOI] [PMC free article] [PubMed] [Google Scholar]
- 26.Liu TL et al. Observing the cell in its native state: Imaging subcellular dynamics in multicellular organisms. Science 360 (2018). [DOI] [PMC free article] [PubMed] [Google Scholar]
- 27.Perez V, Chang B-J & Stelzer EHK Optimal 2D-SIM reconstruction by two filtering steps with Richardson-Lucy deconvolution. Sci Rep 6, 37149 (2016). [DOI] [PMC free article] [PubMed] [Google Scholar]
- 28.Liu Y, Lauderdale JD & Kner P Stripe artifact reduction for digital scanned structured illumination light sheet microscopy. Optics letters 44, 2510–2513 (2019). [DOI] [PMC free article] [PubMed] [Google Scholar]
- 29.Hoffman DP & Betzig E Tiled Reconstruction Improves Structured Illumination Microscopy. BioRxiv (2020). [Google Scholar]
- 30.Vicidomini G, Schmidt R, Egner A, Hell S & Schonle A Automatic deconvolution in 4Pi-microscopy with variable phase. Opt Express 18, 10154–10167 (2010). [DOI] [PubMed] [Google Scholar]
- 31.Baddeley D, Carl C & Cremer C 4Pi microscopy deconvolution with a variable point-spread function. Applied optics 45, 7056–7064 (2006). [DOI] [PubMed] [Google Scholar]
- 32.Lauer TR Deconvolution with a spatially-variant PSF. Astronomical Data Analysis Ii 4847, 167–173 (2002). [Google Scholar]
- 33.Bossi M et al. Multicolor far-field fluorescence nanoscopy through isolated detection of distinct molecular species. Nano letters 8, 2463–2468 (2008). [DOI] [PubMed] [Google Scholar]
- 34.Zhang Z, Kenny SJ, Hauser M, Li W & Xu K Ultrahigh-throughput single-molecule spectroscopy and spectrally resolved super-resolution microscopy. Nature methods 12, 935–938 (2015). [DOI] [PubMed] [Google Scholar]
- 35.Zhang Y et al. Nanoscale subcellular architecture revealed by multicolor three-dimensional salvaged fluorescence imaging. Nature methods 17, 225–231 (2020). [DOI] [PMC free article] [PubMed] [Google Scholar]
- 36.Chang B-J et al. Universal light-sheet generation with field synthesis. Nature methods 16, 235–238 (2019). [DOI] [PMC free article] [PubMed] [Google Scholar]
- 37.Pertsinidis A & Wang G WO2018106678A1. [Google Scholar]
- 38.Turcotte R et al. Dynamic super-resolution structured illumination imaging in the living brain. Proc Natl Acad Sci U S A 116, 9586–9591 (2019). [DOI] [PMC free article] [PubMed] [Google Scholar]
- 39.Crocker JC & Grier DG Methods of digital video microscopy for colloidal studies. J Colloid Interf Sci 179, 298–310 (1996). [Google Scholar]
Associated Data
This section collects any data citations, data availability statements, or supplementary materials included in this article.
Supplementary Materials
3D rendering of two-color 3D-iLLS-SIM imaging. Mitochondria (orange) and microtubules (cyan) are visualized in a fixed COS-7 cell, as displayed in Figure 4a
3D rendering of 3D-iLLS-SIM imaging in a live COS-7 cell. Mitochondria are visualized in a live COS-7 cell, as displayed in Figure 5a.
Time-lapse 3D-iLLS-SIM imaging. The dynamics of a single mitochondrion are followed in 1 minute intervals, as displayed in Figure 5d.
Data Availability Statement
Datasets that support results in the paper are available in the Zenodo repository, 10.5281/zenodo.4795421.


