

Abstract
Background:
The increase in telehealth in response to the Coronavirus Disease 2019 pandemic highlights the need to understand patients’ capacity to utilize this care modality. Patient portals are a tool whose use requires similar resources and skills as those required for telehealth. Patients’ capacity to use patient portals may therefore provide insight regarding patients’ readiness and capacity to use telehealth.
Objective:
To examine factors related to patients’ capacity to use a patient portal and test the impact of these factors on patients’ portal use.
Research Design and Subjects:
Using data from a large-scale pragmatic randomized controlled trial of patient portal use, 1,081 hospitalized patients responded to survey items that were then mapped onto the four dimensions of the Engagement Capacity Framework (ECF): self-efficacy, resources, willingness, and capabilities.
Measures:
The outcome variable was frequency of outpatient portal use. We evaluated associations between ECF dimensions and patient portal use, using regression analyses.
Results:
Patients with fewer resources, fewer capabilities, lower willingness, and lower overall capacity to use patient portals used the portal less; in contrast, those with lower perceived self-efficacy used the portal more.
Conclusions:
Our findings highlight differences in patients’ capacity to use patient portals, which provide an initial understanding of factors that may influence the use of telehealth and offer important guidance in efforts to support patients’ telehealth use. Offering patients training tailored to the use of telehealth tools may be particularly beneficial.
Keywords: Patient Portal, Telehealth, Telemedicine, Patient Engagement
INTRODUCTION
The patient portal, an online personal health record that offers patients a secure view of selected information from the electronic medical record (EMR), is an important health information technology (HIT) tool that allows patients to engage with their healthcare.1 Some telehealth services can be accessed via patient portals, including e-visits and video visits.2 Notably, disparities that may contribute to a patient’s ability and readiness to use patient portals are well documented. For example, across the United States in 2018, 15–24% of households lacked a broadband internet subscription, and that proportion was higher among lower income groups.3 Even with internet access, a significant number of patients may be unwilling to use HIT tools such as patient portals.4 Research indicates, for instance, that Black and Latino patients use portals at lower rates than White patients.5–8 Among portal users, Black patients are still less likely to communicate with providers using secure messages.9 While these statistics highlight use disparities, patients’ capacity to use patient portals may include additional considerations beyond demographics and access to technology, such as patients’ digital literacy,10 privacy and security concerncs,11 and understanding about how to appropriately use secure messaging to communicate with their physician.12
Understanding how different factors relate to each other and influence use of patient portals is valuable not only to ensure portal use, but also to provide insight for the use of other HIT that requires similar skill sets and resources, such as telehealth tools. Patients’ abilities to use patient portals and telehealth both require access to the internet and personal devices and skills to navigate those devices, download software such as mobile applications, and complete electronic medical questionnaires. A patient’s comfort utilizing a portal may therefore be related to a patient’s comfort using telehealth. Importantly, research on use of patient portals is relatively more advanced compared to telehealth use, creating an opportunity to learn about patients’ capacity to use patient portals to develop insight about the potential readiness of patients to use telehealth.
The capacity of patients to use telehealth, a broad set of applications ranging from electronic exchange of medical information to delivery of clinical services synchronously or asynchronously,13–15 is critical to understand. Use of telehealth across the United States healthcare system has increased significantly with the emergence of Coronavirus Disease 2019 (COVID-19). In response, hospitals and clinics have rapidly expanded their abilities to provide telehealth.15–18
Beyond application in a pandemic, telehealth approaches increase patients’ access to healthcare services, improve convenience for patients and providers, and possibly lower costs. For instance, a systematic review found that telehealth can expand access to healthcare services in rural areas and among patients for whom traveling to a healthcare provider is challenging.19 In addition, telehealth approaches have been shown to enhance communication among patients and providers,20,21 and improve health outcomes.22–24
The rapid shift to telehealth in response to the COVID-19 pandemic has allowed little time for organizations or policymakers to consider the patients’ capacity to use telehealth, and this limited understanding may be constraining the use of telehealth or resulting in disparities in its use. To improve our understanding of the factors related to patients’ capacity to use HIT tools–such as patient portals or telehealth–we examined data collected as part of a larger study examining patient portal use.25 We framed our study using the Engagement Capacity Framework,26 described below, to examine individual elements of patients’ capacity to use patient portals and to test their impact on the use of a patient portal.
Conceptual framework
The Engagement Capacity Framework (ECF) (Figure 1) conceptualizes factors that influence an individual’s capacity to engage in their healthcare.26 Drawing upon Social Cognitive Theory,27 the ECF suggests there are reciprocal relationships between a person, their environment, and their behavior of engaging in healthcare. The ECF presents four dimensions that support these relationships: 1) self-efficacy–an individual’s belief in their ability to execute a behavior; 2) resources–external factors that support an individual’s performance of a behavior; 3) willingness–an individual’s interest in taking an action; and 4) capabilities–the knowledge and skills that, together with the first three domains, allow an individual to enact a behavior.
Figure 1.
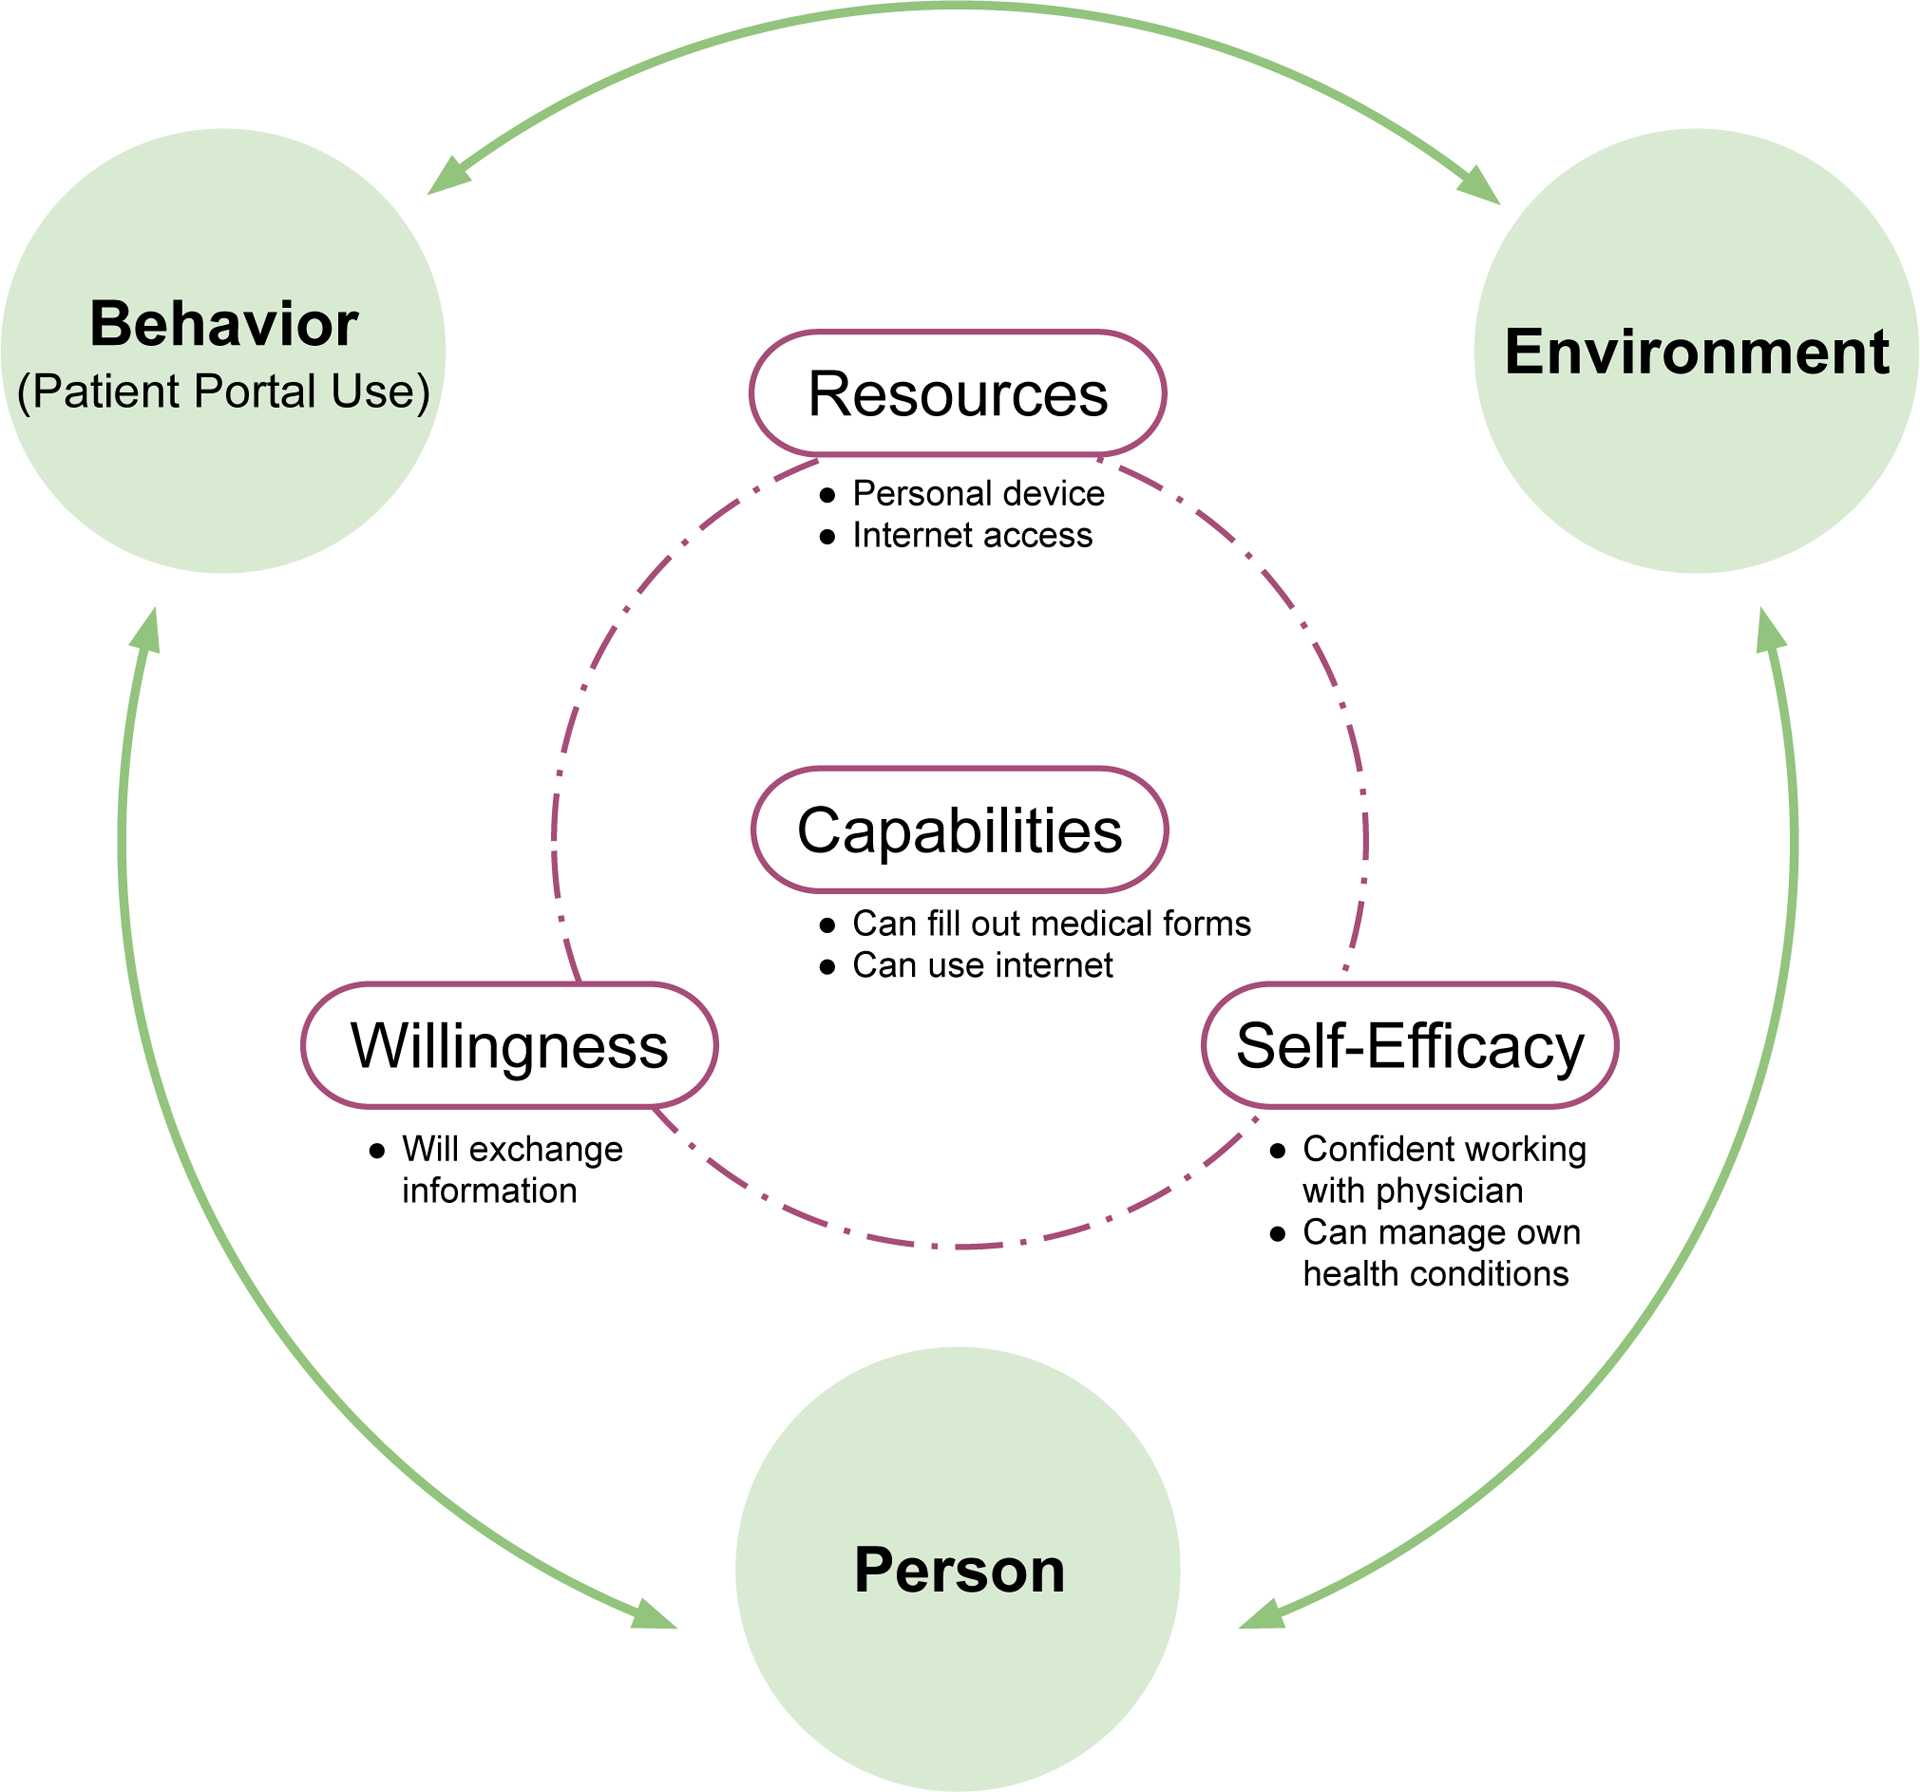
The Engagement Capacity Framework adapted from Sieck, et al., 2019.26
We applied this framework to understand patients’ capacity to use a patient portal. In this context, the ECF enables categorization of barriers to patient engagement with patient portals and can therefore inform potential interventions to increase engagement with this tool. For example, a patient with low confidence using technology to manage their health may need coaching about how to sign up for and use a patient portal, while a patient with no internet access would need help accessing broadband services. The ECF can thus offer a holistic lens through which researchers and practitioners can view a patient’s capacity to use a patient portal.
METHODS
Study design
The data came from a large-scale pragmatic randomized controlled trial (RCT) conducted at a Midwestern academic medical center (AMC) utilizing the outpatient portal, MyChart (Epic Systems; Verona, WI)25 through a website or mobile application for iOS or Android operating systems. MyChart also facilitates telehealth by supporting synchronous and asynchronous visits with providers.
Patients were administered a survey at enrollment into the RCT asking about factors related to the ECF dimensions. They completed the survey on a tablet or on paper during their stay and received up to three reminders.
Study population
Hospitalized patients from December 2016 to August 2019 were recruited. Patients were at least 18, spoke English, and were not involuntarily detained. Patient characteristics including age, gender, race, and Charlson Comorbidity Index were acquired from the EMR through the AMC’s Information Warehouse (IW). The AMC’s Institutional Review Board approved this study and informed consent was obtained from all study participants.
Survey measures
Questions were derived and adapted from different validated measures including the Health Information National Trends Survey (HINTS)28 and other validated scales when available (see Supplemental Digital Content (SDC) 1 for complete description of measures).29–32 Marital status, level of education, household income, employment, and insurance coverage were acquired from survey questions.
Patient portal use
Portal use was measured by use of the MyChart portal assessed from audit log files obtained from the IW.33 Log files record each action conducted by a user, such as logging into the application. We used a count of MyChart sessions within three months of patient enrollment into the RCT as the outcome variable34 to provide a general use measure. The three-month window was established to examine use related to the hospital admission in which they enrolled.
Data analysis
Composite scores for the ECF dimensions were calculated averaging numerical values of the survey items. To account for the different numbers of items in dimensions, composites were coded as categorical variables with three levels: high, medium, and low. Values in the top third percentile were considered high. Values in the lower third percentile were coded as low. The remaining values were coded as medium. Because the resources dimension was comprised of only two items, we coded affirmative responses to both questions as high, affirmative responses to only one of the two questions as medium, and the rest as low.
For patients without missing composite scores, an overall capacity to use the portal was also coded as a categorical variable with three levels: high, medium, and low. This variable was derived by adding together the patient values for the four individual dimensions and then encoded as a high, medium, or low score depending on whether the added value belonged to the top, middle, or lowest third percentiles.
We addressed missingness via listwise deletion, and compared excluded and included patients using a test for independence in the distribution of demographics and responses to survey items (see SDC 2). A negative binomial regression was used to evaluate the association between patient capacity to use portals and frequency of MyChart use, controlling for demographics. We tested two models: the four dimensions of the ECF and their association with engagement with the portal, and the overall score to test whether the ECF as a whole captured capacity to use patient portals. To examine the effects of outliers, we winsorized the data at two alternative cut-off points based on natural breaks in the data (i.e., 200 and 300 sessions) determined by visual inspection of the distribution of sessions (see SDC 3).
RESULTS
Demographics of participants included in the study (n = 1,081) are presented in Table 1, including actual (i.e., based on the total sample) and valid (i.e., based on the number of non-missing responses) frequencies. Table 2 presents the frequencies of responses to each survey item. Answers to all the survey items were provided by 65% percent of participants; after listwise deletion, 698 patients remained. With respect to excluded patients, while otherwise comparable to patients in the final sample, they differed significantly in their CCI (loge WMann-Whitney = 11.89, p = 0.007, r = 0.10) and their Resources level distribution (X2 (2, 1081) = 8.97, p = 0.011, Cramer’s V = 0.08).
Table 1.
Characteristics of the study population.
| Actual frequency1, n (%) or Median (IQR) (N = 1,081) |
Valid frequency2, n (%) or Median (IQR) (N = 1,081) |
|
|---|---|---|
| Race | ||
| White | 837 (77.4) | 837 (77.4) |
| Black | 201 (18.6) | 201 (18.6) |
| Other | 43 (4.0) | 43 (4.0) |
| Gender | ||
| Female | 628 (58.1) | 628 (58.1) |
| Male | 453 (41.9) | 453 (41.9) |
| Age | ||
| 18–34 | 286 (26.5) | 286 (26.5) |
| 35–49 | 307 (28.4) | 307 (28.4) |
| 50–64 | 354 (32.7) | 354 (32.7) |
| 65–74 | 110 (10.2) | 110 (10.2) |
| 75+ | 24 (2.2) | 24 (2.2) |
| Charlson score | 2 (0 – 3) | 2 (0 – 3) |
| Marital status | ||
| Married | 408 (37.7) | 408 (47.0) |
| Not married | 461 (42.6) | 461 (53.0) |
| (Missing) | 212 (19.6) | |
| Household income | ||
| $0–$19,999 | 314 (29.0) | 314 (37.8) |
| $20,000–$34,999 | 127 (11.7) | 127 (15.3) |
| $35,000–$49,999 | 88 (8.1) | 88 (10.6) |
| $50,000–$74,999 | 117 (10.8) | 117 (14.1) |
| $75,000–$99,999 | 71 (6.6) | 71 (8.5) |
| $100,000 or more | 114 (10.5) | 114 (13.7) |
| (Missing) | 250 (23.1) | |
| Employment status | ||
| Employed | 360 (33.3) | 360 (41.0) |
| Unemployed | 402 (37.2) | 402 (45.8) |
| Retired | 115 (10.6) | 115 (13.1) |
| (Missing) | 204 (18.9) | |
| Education | ||
| Less than high school | 57 (5.3) | 57 (6.3) |
| High school | 236 (21.8) | 236 (26.0) |
| Some college | 278 (25.7) | 278 (30.7) |
| College graduate | 234 (21.6) | 234 (25.8) |
| Graduate or beyond | 102 (9.4) | 102 (11.2) |
| (Missing) | 174 (16.1) | |
| Healthcare coverage | ||
| Yes | 785 (72.6) | 785 (91.5) |
| No | 73 (6.8) | 73 (8.5) |
| (Missing) | 223 (20.6) |
Notes:
Actual frequency calculated as percent of total sample.
Valid frequency calculated as percent of non-missing respondents. IQR: inter-quartile range.
Not all percentages may add up to 100 due to rounding.
Table 2.
Frequency of survey items mapped to the dimensions of the Engagement Capacity Framework.
| Dimension | Item | Actual frequency1, n (%) (N = 1,081) | Valid frequency2, n (%) (N = 1,081) |
|---|---|---|---|
| Self-Efficacy | I can change my behavior | ||
| Strongly disagree | 14 (1.3) | 14 (1.4) | |
| Somewhat disagree | 43 (4.0) | 43 (4.3) | |
| Neutral | 108 (10.0) | 108 (10.9) | |
| Somewhat agree | 394 (36.4) | 394 (39.7) | |
| Strongly agree | 434 (40.1) | 434 (43.7) | |
| (Missing) | 88 (8.1) | ||
| I can manage my condition(s) | |||
| Strongly disagree | 4 (0.4) | 4 (0.4) | |
| Somewhat disagree | 13 (1.2) | 13 (1.3) | |
| Neutral | 68 (6.3) | 68 (6.9) | |
| Somewhat agree | 332 (30.7) | 332 (33.6) | |
| Strongly agree | 572 (52.9) | 572 (57.8) | |
| (Missing) | 92 (8.5) | ||
| I can keep symptoms from interfering | |||
| Strongly disagree | 47 (4.3) | 47 (4.7) | |
| Somewhat disagree | 128 (11.8) | 128 (12.9) | |
| Neutral | 139 (12.9) | 139 (14.0) | |
| Somewhat agree | 375 (34.7) | 375 (37.9) | |
| Strongly agree | 301 (27.8) | 301 (30.4) | |
| (Missing) | 91 (8.4) | ||
| I know how to take care of my health | |||
| Strongly disagree | 7 (0.6) | 7 (0.7) | |
| Somewhat disagree | 26 (2.4) | 26 (2.6) | |
| Neutral | 95 (8.8) | 95 (9.6) | |
| Somewhat agree | 436 (40.3) | 436 (43.9) | |
| Strongly agree | 430 (39.8) | 430 (43.3) | |
| (Missing) | 87 (8.0) | ||
| I can take medication appropriately | |||
| Strongly disagree | 2 (0.2) | 2 (0.2) | |
| Somewhat disagree | 4 (0.4) | 4 (0.4) | |
| Neutral | 46 (4.3) | 46 (4.7) | |
| Somewhat agree | 184 (17.0) | 184 (18.6) | |
| Strongly agree | 751 (69.5) | 751 (76.1) | |
| (Missing) | 94 (8.7) | ||
| I can work with my provider | |||
| Strongly disagree | 7 (0.6) | 7 (0.7) | |
| Somewhat disagree | 17 (1.6) | 17 (1.7) | |
| Neutral | 58 (5.4) | 58 (5.8) | |
| Somewhat agree | 342 (31.6) | 342 (34.4) | |
| Strongly agree | 569 (52.6) | 569 (57.3) | |
| (Missing) | 88 (8.1) | ||
| Resources | I have a personal device | ||
| Yes | 974 (90.1) | 974 (95.4) | |
| No | 47 (4.3) | 47 (4.6) | |
| (Missing) | 60 (5.6) | ||
| I have personal access to the internet | |||
| Yes | 912 (84.4) | 912 (94.7) | |
| No | 51 (4.7) | 51 (5.3) | |
| (Missing) | 118 (10.9) | ||
| Willingness | I am interested in exchanging info | ||
| Not at all interested | 70 (6.5) | 70 (7.3) | |
| Somewhat interested | 227 (21.0) | 227 (23.7) | |
| Interested | 350 (32.4) | 350 (36.6) | |
| Very interested | 310 (28.7) | 310 (32.4) | |
| (Missing) | 124 (11.5) | ||
| Capabilities | Can fill out medical forms | ||
| Strongly disagree | 16 (1.5) | 16 (2.0) | |
| Somewhat disagree | 25 (2.3) | 25 (3.1) | |
| Neutral | 48 (4.4) | 48 (6.0) | |
| Somewhat agree | 153 (14.2) | 153 (19.0) | |
| Strongly agree | 562 (52.0) | 562 (69.9) | |
| (Missing) | 277 (25.6) | ||
| Have skills to evaluate health resources | |||
| Strongly disagree | 29 (2.7) | 29 (3.4) | |
| Somewhat disagree | 68 (6.3) | 68 (7.9) | |
| Neutral | 154 (14.2) | 154 (17.9) | |
| Somewhat agree | 313 (29.0) | 313 (36.4) | |
| Strongly agree | 297 (27.5) | 297 (34.5) | |
| (Missing) | 220 (20.4) | ||
| Installs new software | |||
| Never | 111 (10.3) | 111 (11.5) | |
| Rarely | 168 (15.5) | 168 (17.4) | |
| Occasionally | 254 (23.5) | 254 (26.4) | |
| Frequently | 178 (16.5) | 178 (18.5) | |
| Very frequently | 252 (23.3) | 252 (26.2) | |
| (Missing) | 118 (10.9) | ||
| Uses the internet | |||
| Never | 25 (2.3) | 25 (2.6) | |
| Rarely | 40 (3.7) | 40 (4.1) | |
| Occasionally | 119 (11.0) | 119 (12.3) | |
| Frequently | 184 (17.0) | 184 (19.0) | |
| Very frequently | 601 (55.6) | 601 (62.0) | |
| (Missing) | 112 (10.4) | ||
| Uses email | |||
| Never | 42 (3.9) | 42 (4.3) | |
| Rarely | 82 (7.6) | 82 (8.5) | |
| Occasionally | 135 (12.5) | 135 (14.0) | |
| Frequently | 158 (14.6) | 158 (16.3) | |
| Very frequently | 550 (50.9) | 550 (56.9) | |
| (Missing) | 114 (10.5) | ||
| Uses social media | |||
| Never | 107 (9.9) | 107 (11.1) | |
| Rarely | 81 (7.5) | 81 (8.4) | |
| Occasionally | 131 (12.1) | 131 (13.5) | |
| Frequently | 152 (14.1) | 152 (15.7) | |
| Very frequently | 497 (46.0) | 497 (51.3) | |
| (Missing) | 113 (10.5) |
Notes:
Actual frequency calculated as percent of total sample.
Valid frequency calculated as percent of non-missing respondents.
Not all percentages may add up to 100 due to rounding.
Within the four ECF dimensions (left side of Figure 2), the majority of patients reported high levels of resources, with 656 out of 698 (94%) having both a personal device and access to the internet for personal use; 13 (1.9%) were classified as low on resources, with no device and no personal access to the internet. The distribution across the remaining three dimensions was more equal. The right side of Figure 2 shows the overall capacity to use patient portals based on these data: 387 (35.8%) of the patients had a high level, 337 (31.2%) had a medium level, and the remaining 357 (33%) had low overall capacity.
Figure 2.
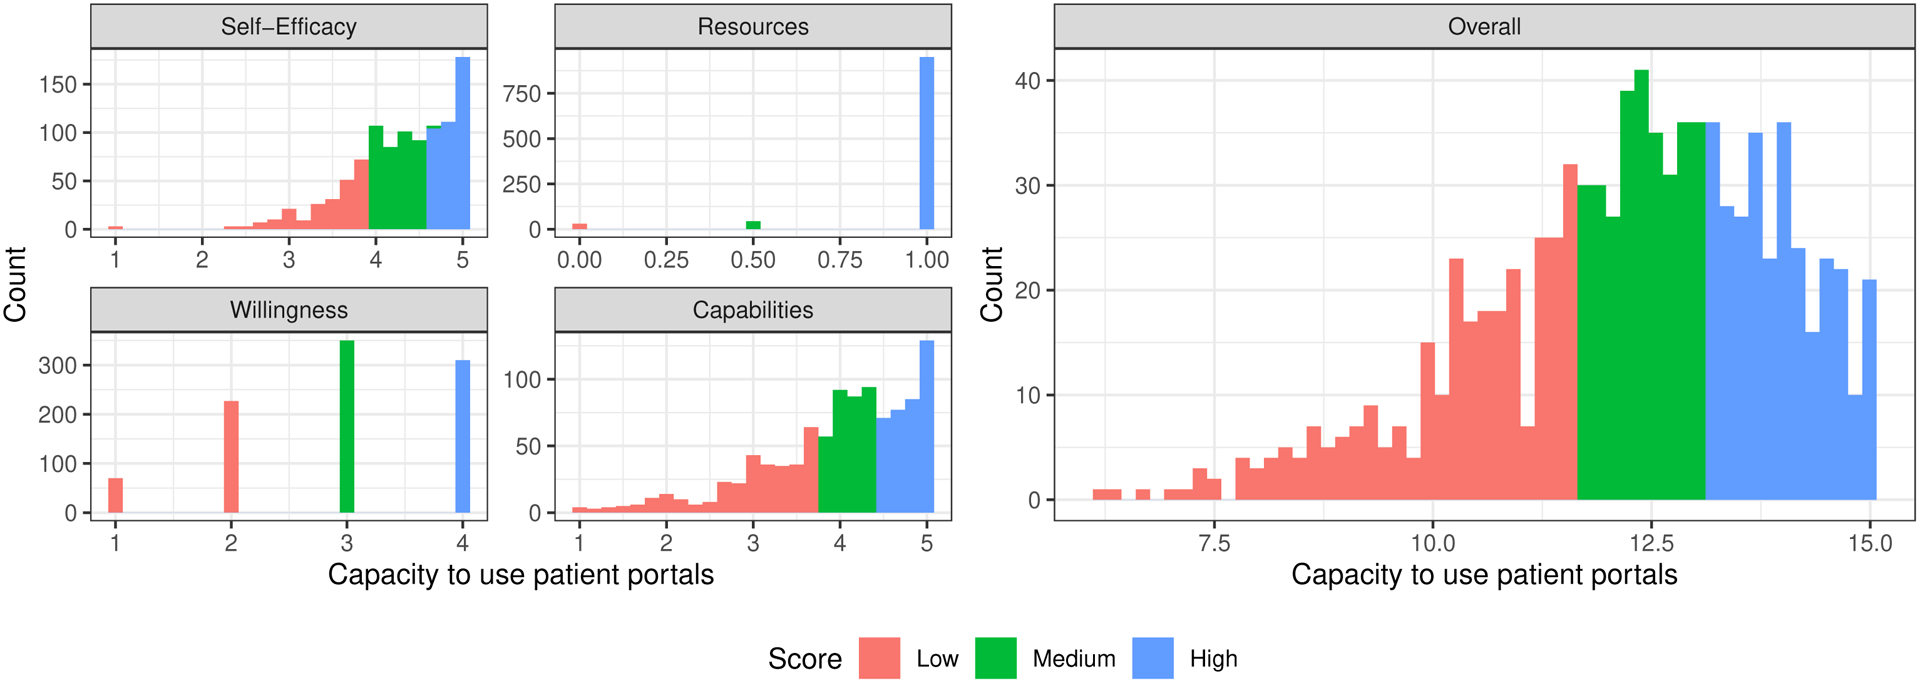
Patient capacity to use patient portals, categorized by dimensions of the Engagement Capacity Framework (left side), and overall capacity to use patient portals (right side).
There were 14,170 total portal sessions on record, with a median count of 4 sessions per patient (interquartile range (IQR) 0, 25). The association between frequency of portal use and the capacity to use patient portals is presented in Table 3. When considering the four dimensions of the ECF independently (Model 1), patients with fewer and no resources engaged with the portal less frequently; incidence rate ratio (IRR) for patients with medium resources was 0.27 [95% confidence interval (CI) 0.12–0.66]; IRR for patients with low resources was 0.15 [95% CI 0.05–0.63]. Similarly, patients with a lower capabilities score had less frequent use: IRR for patients with medium capabilities was 0.68 [95% CI 0.46–0.99]; IRR for patients with low capabilities was 0.59 [95% CI 0.39–0.89]. Portal use was also associated with the willingness dimension, however only the patients with low willingness were significantly different from the reference group (IRR 0.66 [95% CI 0.44–0.97]). Conversely, patients who reported low self-efficacy used the portal with higher frequency (IRR 1.55 [95% CI 1.01–2.40]).
Table 3.
Frequency of outpatient portal use in relation to the four dimensions of the Engagement Capacity Framework (Model 1) and the overall readiness for telehealth (Model 2), controlling for the patient demographic characteristics.
| Model 1 (n = 698) | Model 2 (n = 698) | |||||
|---|---|---|---|---|---|---|
| Characteristic | IRR1 | 95% CI2 | p-value | IRR1 | 95% CI2 | p-value |
| Overall capacity to use patient portals | ||||||
| High | — | — | ||||
| Medium | 0.89 | 0.62, 1.29 | 0.538 | |||
| Low | 0.66 | 0.45, 0.99 | 0.034 | |||
| Capabilities | ||||||
| High | — | — | ||||
| Medium | 0.68 | 0.46, 0.99 | 0.032 | |||
| Low | 0.59 | 0.39, 0.89 | 0.011 | |||
| Resources | ||||||
| High | — | — | ||||
| Medium | 0.27 | 0.12, 0.66 | 0.001 | |||
| Low | 0.15 | 0.05, 0.63 | 0.002 | |||
| Self-Efficacy | ||||||
| High | — | — | ||||
| Medium | 0.93 | 0.66, 1.32 | 0.663 | |||
| Low | 1.55 | 1.01, 2.40 | 0.032 | |||
| Willingness | ||||||
| High | — | — | ||||
| Medium | 0.94 | 0.64, 1.37 | 0.743 | |||
| Low | 0.66 | 0.44, 0.97 | 0.032 | |||
| Race | ||||||
| White | — | — | — | — | ||
| Black | 0.78 | 0.52, 1.18 | 0.225 | 0.84 | 0.56, 1.29 | 0.388 |
| Other | 0.51 | 0.24, 1.30 | 0.111 | 0.58 | 0.27, 1.49 | 0.196 |
| Gender | ||||||
| Male | — | — | — | — | ||
| Female | 0.97 | 0.70, 1.34 | 0.847 | 0.98 | 0.71, 1.35 | 0.898 |
| Age | ||||||
| 18–34 | — | — | — | — | ||
| 35–49 | 1.08 | 0.70, 1.65 | 0.722 | 1.01 | 0.66, 1.54 | 0.957 |
| 50–64 | 1.08 | 0.69, 1.68 | 0.735 | 1.01 | 0.64, 1.58 | 0.966 |
| 65–74 | 1.57 | 0.79, 3.26 | 0.209 | 1.22 | 0.61, 2.57 | 0.578 |
| 75+ | 0.73 | 0.23, 2.82 | 0.603 | 0.48 | 0.15, 1.86 | 0.226 |
| Charlson score | 1.13 | 1.03, 1.24 | 0.001 | 1.11 | 1.02, 1.22 | 0.006 |
| Marital status | ||||||
| Married | — | — | — | — | ||
| Not married | 0.92 | 0.64, 1.30 | 0.609 | 0.93 | 0.65, 1.32 | 0.677 |
| Household income | ||||||
| $0–$19,999 | — | — | — | — | ||
| $20,000–$34,999 | 1.57 | 0.98, 2.57 | 0.058 | 1.60 | 0.99, 2.64 | 0.052 |
| $35,000–$49,999 | 1.30 | 0.75, 2.33 | 0.353 | 1.21 | 0.71, 2.17 | 0.497 |
| $50,000–$74,999 | 2.18 | 1.30, 3.70 | 0.003 | 2.23 | 1.32, 3.85 | 0.002 |
| $75,000–$99,999 | 2.72 | 1.46, 5.29 | 0.002 | 2.73 | 1.47, 5.31 | 0.002 |
| $100,000 or more | 2.13 | 1.17, 3.94 | 0.012 | 2.35 | 1.27, 4.42 | 0.005 |
| Employment status | ||||||
| Employed | — | — | — | — | ||
| Unemployed | 0.86 | 0.59, 1.26 | 0.422 | 0.96 | 0.65, 1.42 | 0.823 |
| Retired | 1.23 | 0.65, 2.40 | 0.508 | 1.32 | 0.69, 2.63 | 0.380 |
| Education | ||||||
| Less than high school | — | — | — | — | ||
| High school | 0.72 | 0.35, 1.41 | 0.319 | 0.55 | 0.27, 1.08 | 0.074 |
| Some college | 1.17 | 0.59, 2.20 | 0.621 | 1.12 | 0.55, 2.14 | 0.722 |
| College graduate | 1.40 | 0.68, 2.75 | 0.320 | 1.27 | 0.61, 2.51 | 0.485 |
| Graduate or beyond | 1.54 | 0.67, 3.42 | 0.281 | 1.51 | 0.65, 3.40 | 0.310 |
| Healthcare coverage | ||||||
| Yes | — | — | — | — | ||
| No | 0.89 | 0.53, 1.59 | 0.655 | 0.74 | 0.44, 1.32 | 0.264 |
IRR = Incidence Rate Ratio;
CI = Confidence Interval
The four ECF dimensions in combination (Model 2) showed that those with low overall capacity utilized the portal significantly less frequently than those with high overall capacity (IRR 0.66 [95% CI 0.45–0.99]). In both models, the three groups with higher incomes had more frequent portal use. In addition, sicker patients used the portal more often (IRR 1.13 [95% CI 1.03–1.24] for a one-point increase in the mean Charlson index in Model 1; IRR 1.11 [95% CI 1.02–1.22] in Model 2).
Overall, we found that our results were robust to the effects of outliers with one exception: the IRR comparing medium to high capabilities was no longer significant after removal of patients with >200 portal sessions; all other relationships remained consistent.
DISCUSSION
Focusing on capacity to use patient portals offers a view into capacity to use other HIT tools, which is particularly relevant given the pandemic-related rapid shift to telehealth. Therefore, to provide operational guidance for successful telehealth implementation, improving our understanding of the patient factors that may facilitate or hinder a patient’s use of telehealth is critical moving forward.
Our results suggest that patients without reliable resources or with limited capabilities are less likely to use patient portals to engage in their care. This finding makes logical sense, as patients are less likely to be able to use portals without access to the right tools or the skills to use them. On the other hand, while prior work has found that patients with an objectively higher number of medical issues are more likely to use a patient portal, our findings suggest that subjective factors may also play a role. Specifically, we found that patients with lower self-efficacy in managing their health used the portal more, suggesting that perhaps patients who felt less confident relied on more interaction through the portal to support their efforts to self-manage their health. Our measure assessed a patient’s self-efficacy in managing their health, which reflects a broader focus than specifically using a patient portal and allows us to understand how confidence in managing one’s health may relate to use of a portal. In the context of the ECF, the behavior of engaging through more frequent check-ins with providers may influence a person’s self-efficacy in managing their care.
Our findings also highlight barriers that may limit patients’ abilities to use telehealth more broadly. For example, video visits require installation of specialized software on a personal device; our data suggests that many patients may not be comfortable installing new software and thus may have challenges participating in telehealth visits. During the COVID-19 pandemic, physicians used a variety of audio/video platforms;35,36 moving forward, software usability of telehealth platforms is a critical consideration. In addition, asynchronous telehealth visits–also known as e-visits–require completion of medical forms. Notably, over 10% of our population were not confident about their ability to complete these forms. Furthermore, as e-visit communications can occur over a 7-day period, patients also need to understand how to identify and reply to ongoing messages from their providers, typically through a patient portal.37
Ultimately, our findings highlight the impact of the digital divide as healthcare shifts to a greater dependence on virtual care. Moderated through factors such as age, race, socioeconomic status, and eHealth literacy, the digital divide results in underserved patient populations having less access to technology and the internet, and more difficulty using these resources to manage their health.38,39 In practice, the digital divide impacts both patient portal use40 and the use of telehealth more broadly.41
Emerging evidence suggests training to use patient portals may be a useful approach to encourage use,42 but it also underlines the importance of tailoring training modalities to address the specific gaps in patients’ self-efficacy, attitudes, and capabilities43,44 for the most effective training approaches. For example, some studies suggest that partnerships with local organizations (e.g., libraries, area associations on aging) can help connect patients with the skills and devices they need.45 Other evidence points to engaging community health workers to identify patient needs and provide assistance.46 Further, national programs including the Lifeline Program directed by the Federal Communications Commission, and non-profit organizations offer reduced cost internet access and devices.47
There are several limitations that should be considered when interpreting our findings. First, this study evaluated a patient population at a single AMC. However, this study included a large population of patients across six hospitals, providing variability in the population that we believe supports the generalizability of our findings. Second, given our listwise deletion approach, our analytic sample included patients with higher Resource levels and lower CCI then may be present in the general population. Thus, our findings around the relationship between these factors and patient portal use may be underestimated. We assessed capacity to use a patient portal through the ECF dimensions, but these items have not been validated in combination as a single scale. Finally, our findings related to patient portal use may have limited generalizability to telehealth use more broadly. Nonetheless, the resources and capabilities considered in our study are likely also required by telehealth tools beyond patient portals.
Our research provides an initial understanding of patient-level factors that may influence their capacity to use portals and can inform efforts to increase the use of patient portals, as well as other telehealth tools, and identify opportunities to address barriers to use. As the COVID-19 pandemic continues to highlight the importance of telehealth options, healthcare organizations should be prepared to assist patients who lack the self-efficacy, resources, willingness, or capabilities to use such tools. These findings can help guide the development of strategies that support patients in efforts to use HIT tools to manage their health.
Supplementary Material
SDC 1: Survey Measure Description (Word file)
SDC 2: Patients excluded from the final analytical sample (Table and Figure)
SDC 3: Distribution of the number of MyChart sessions (Figure)
Acknowledgements:
This research was supported by grants from the Agency for Healthcare Research and Quality [Grant #R01HS02409 and Grant #P30HS024379]. Conduct of this research was reviewed and approved by the Institutional Review Board of the authors. The authors wish to thank Alice Gaughan, Lindsey Sova, Jaclyn Volney, Danijela Cvijetinovic, Toby Weinert, Allison Silverman, Ayanna Scott, and Karen Alexander, all affiliated with the authors’ organization, for their assistance with this project, as well as all the participants in this study.
Footnotes
Conflicts of Interest: The authors report no conflicts of interest related to this work.
REFERENCES
- 1.Kaelber DC, Jha AK, Johnston D, et al. A research agenda for personal health records (PHRs). J Am Med Inform Assn. 2008;15:729–736. [DOI] [PMC free article] [PubMed] [Google Scholar]
- 2.Shah SD, Liebovitz D. It takes two to tango: Engaging patients and providers with portals. PM R. 2017;9:S85–S97. [DOI] [PubMed] [Google Scholar]
- 3.Tomer A, Fishbane L, Siefer A, et al. Digital prosperity: How broadband can deliver health and equity to all communities. Metropolitan Infrastructure Initiative, Brookings Institution; 2020. Available at: https://www.brookings.edu/wp-content/uploads/2020/02/20200227_BrookingsMetro_Digital-Prosperity-Report-final.pdf. Accessed April, 2020. [Google Scholar]
- 4.Sieck CJ, Walker DM, Gregory M, et al. Assessing capacity to engage in healthcare to improve the patient experience through health information technology. Patient Exp J. 2019;6:Article 7. [Google Scholar]
- 5.Roblin DW, Houston TK 2nd, Allison JJ, et al. Disparities in use of a personal health record in a managed care organization. J Am Med Inform Assn. 2009;16:683–689. [DOI] [PMC free article] [PubMed] [Google Scholar]
- 6.Sarkar U, Karter AJ, Liu JY, et al. The literacy divide: Health literacy and the use of an internet-based patient portal in an integrated health system-results from the diabetes study of northern California (DISTANCE). J Health Commun. 2010;15 Suppl 2:183–196. [DOI] [PMC free article] [PubMed] [Google Scholar]
- 7.Sarkar U, Karter AJ, Liu JY, et al. Social disparities in internet patient portal use in diabetes: Evidence that the digital divide extends beyond access. J Am Med Inform Assn. 2011;18:318–321. [DOI] [PMC free article] [PubMed] [Google Scholar]
- 8.Yamin CK, Emani S, Williams DH, et al. The digital divide in adoption and use of a personal health record. Arch Intern Med. 2011;171:568–574. [DOI] [PubMed] [Google Scholar]
- 9.Lyles CR, Harris LT, Jordan L, et al. Patient race/ethnicity and shared medical record use among diabetes patients. Med Care. 2012;50:434–440. [DOI] [PubMed] [Google Scholar]
- 10.Casillas A, Cemballi AG, Abhat A, et al. An untapped potential in primary care: Semi-structured interviews with clinicians on how patient portals will work for caregivers in the safety net. J Med Internet Res. 2020;22:e18466. [DOI] [PMC free article] [PubMed] [Google Scholar]
- 11.Sakaguchi-Tang DK, Bosold AL, Choi YK, et al. Patient portal use and experience among older adults: Systematic review. JMIR Med Inform. 2017;5:e38. [DOI] [PMC free article] [PubMed] [Google Scholar]
- 12.Hefner JL, MacEwan SR, Biltz A, et al. Patient portal messaging for care coordination: A qualitative study of perspectives of experienced users with chronic conditions. BMC Fam Pract. 2019;20:57. [DOI] [PMC free article] [PubMed] [Google Scholar]
- 13.Tuckson RV, Edmunds M, Hodgkins ML. Telehealth. N Engl J Med. 2017;377:1585–1592. [DOI] [PubMed] [Google Scholar]
- 14.Hollander JE, Carr BG. Virtually perfect? Telemedicine for COVID-19. N Engl J Med. 2020;96:141–145. [DOI] [PubMed] [Google Scholar]
- 15.Turer RW, Jones I, Rosenbloom ST, et al. Electronic personal protective equipment: A strategy to protect emergency department providers in the age of COVID-19. J Am Med Inform Assn. 2020: 10.1093/jamia/ocaa1048. [DOI] [PMC free article] [PubMed] [Google Scholar]
- 16.Chopra V, Toner E, Waldhorn R, et al. How should U.S. hospitals prepare for coronavirus disease 2019 (COVID-19)? Ann Intern Med. 2020: 10.7326/M7320-0907. [DOI] [PMC free article] [PubMed] [Google Scholar]
- 17.Reeves JJ, Hollandsworth HM, Torriani FJ, et al. Rapid response to COVID-19: Health informatics support for outbreak management in an academic health system. J Am Med Inform Assn. 2020: 10.1093/jamia/ocaa1037. [DOI] [PMC free article] [PubMed] [Google Scholar]
- 18.World Health Organization. Operational considerations for case management of COVID-19 in health facility and community. 2020. Available at: https://apps.who.int/iris/bitstream/handle/10665/331492/WHO-2019-nCoV-HCF_operations-2020.1-eng.pdf. Accessed April, 2020.
- 19.Kruse CS, Krowski N, Rodriguez B, et al. Telehealth and patient satisfaction: A systematic review and narrative analysis. BMJ Open. 2017;7:e016242. [DOI] [PMC free article] [PubMed] [Google Scholar]
- 20.Cottrell E, Cox T, O’Connell P, et al. Patient and professional user experiences of simple telehealth for hypertension, medication reminders and smoking cessation: A service evaluation. BMJ Open. 2015;5:e007270. [DOI] [PMC free article] [PubMed] [Google Scholar]
- 21.Bishop TF, Press MJ, Mendelsohn JL, et al. Electronic communication improves access, but barriers to its widespread adoption remain. Health Aff (Millwood). 2013;32:1361–1367. [DOI] [PMC free article] [PubMed] [Google Scholar]
- 22.Dias AE, Limongi JCP, Hsing WT, et al. Telerehabilitation in Parkinson’s disease: Influence of cognitive status. Dement Neuropsychol. 2016;10:327–332. [DOI] [PMC free article] [PubMed] [Google Scholar]
- 23.Totten AM, Womack DM, Eden KB, et al. Telehealth: Mapping the evidence for patient outcomes from systematic reviews. Rockville, MD: Agency for Healthcare Research and Quality, 2016: Report No.16-EHC034-EF. [PubMed] [Google Scholar]
- 24.DeNicola N, Grossman D, Marko K, et al. Telehealth interventions to improve obstetric and gynecologic health outcomes: A systematic review. Obstet Gynecol. 2020;135:371–382. [DOI] [PMC free article] [PubMed] [Google Scholar]
- 25.McAlearney AS, Sieck CJ, Hefner JL, et al. High touch and high tech (HT2) proposal: Transforming patient engagement throughout the continuum of care by engaging patients with portal technology at the bedside. JMIR Res Protoc. 2016;5:e221. [DOI] [PMC free article] [PubMed] [Google Scholar]
- 26.Sieck CJ, Walker DM, Retchin S, et al. The patient engagement capacity model: What factors determine a patient’s ability to engage? NEJM Catalyst Blog; 2019. Available at: https://catalyst.nejm.org/doi/full/10.1056/CAT.19.0001?utm_campaign=Connect%20Weekly&utm_source=hs_email&utm_medium=email&utm_content=70937477&_hsenc=p2ANqtz--kM54wfRW7n95XkfRIZFgbWaZmBQ-1pcEt45zi6Y9eOiz4uXymdsFpwRz9qAglmnYbwrDQqDlqifYcpJRQTMF7Euz9eg&_hsmi=70937477. Accessed April, 2020. [Google Scholar]
- 27.Bandura A The self system in reciprocal determinism. Am Psychol. 1978;33:344–358. [Google Scholar]
- 28.National Cancer Institute. About HINTS. Available at: https://hints.cancer.gov/about-hints/learn-more-about-hints.aspx. Accessed April, 2020.
- 29.Norman CD, Skinner HA. eHEALS: The eHealth literacy scale. J Med Internet Res. 2006;8:e27. [DOI] [PMC free article] [PubMed] [Google Scholar]
- 30.Wallace LS, Rogers ES, Roskos SE, et al. Brief report: Screening items to identify patients with limited health literacy skills. J Gen Intern Med. 2006;21:874–877. [DOI] [PMC free article] [PubMed] [Google Scholar]
- 31.Bandura A. Guide for constructing self-efficacy scales. Self-efficacy beliefs of adolescents. Greenwich, CT: Information Age Publishing, 2006:307–337. [Google Scholar]
- 32.Lorig K, Chastain RL, Ung E, et al. Development and evaluation of a scale to measure perceived self-efficacy in people with arthritis. Arthritis Rheum. 1989;32:37–44. [DOI] [PubMed] [Google Scholar]
- 33.Huerta T, Fareed N, Hefner JL, et al. Patient engagement as measured by inpatient portal use: Methodology for log file analysis. J Med Internet Res. 2019;21:e10957. [DOI] [PMC free article] [PubMed] [Google Scholar]
- 34.Di Tosto G, McAlearney A, Fareed N, et al. Outpatient portal use and patient engagement as measured by log file analysis. JMIR Preprints. 2020:16849. [DOI] [PMC free article] [PubMed] [Google Scholar]
- 35.Miliard M. OCR will ease restrictions on telehealth tech during COVID-19. Healthcare IT News; 2020. Available at: https://www.healthcareitnews.com/news/ocr-will-ease-restrictions-telehealth-tech-during-covid-19. Accessed April, 2020. [Google Scholar]
- 36.U.S. Department of Health and Human Services. Notification of enforcement discretion for telehealth remote communications during the COVID-19 nationwide public health emergency. 2020. Available at: https://www.hhs.gov/hipaa/for-professionals/special-topics/emergency-preparedness/notification-enforcement-discretion-telehealth/index.html?utm_campaign=Membership&utm_source=hs_email&utm_medium=email&_hsenc=p2ANqtz--gqVMnO8_feDONnGcvSqXdKxGvzZ2BTzsZyDRXnp6hsV_dkVtwtRMSguql1nvCBKMZt-rE. Accessed April, 2020.
- 37.Medicare telemedicine health care provider fact sheet Centers for Medicare and Medicaid Services; 2020. Available at: https://www.cms.gov/newsroom/fact-sheets/medicare-telemedicine-health-care-provider-fact-sheet. Accessed April, 2020.
- 38.Brodie M, Flournoy RE, Altman DE, et al. Health information, the internet, and the digital divide. Health Aff (Millwood). 2000;19:255–265. [DOI] [PubMed] [Google Scholar]
- 39.Neter E, Brainin E. eHealth literacy: Extending the digital divide to the realm of health information. J Med Internet Res. 2012;14:e19. [DOI] [PMC free article] [PubMed] [Google Scholar]
- 40.Graetz I, Gordon N, Fung V, et al. The digital divide and patient portals: Internet access explained differences in patient portal use for secure messaging by age, race, and income. Med Care. 2016;54:772–779. [DOI] [PubMed] [Google Scholar]
- 41.Dorsey ER, Topol EJ. State of telehealth. N Engl J Med. 2016;375:154–161. [DOI] [PubMed] [Google Scholar]
- 42.McAlearney AS, Walker DM, Gaughan A, et al. Helping patients be better patients: A qualitative study of perceptions about inpatient portal use. Telemed J E Health. 2020: doi: 10.1089/tmj.2019.0198. [DOI] [PMC free article] [PubMed] [Google Scholar]
- 43.Sheon AR, Bolen SD, Callahan B, et al. Addressing disparities in diabetes management through novel approaches to encourage technology adoption and use. JMIR Diabetes. 2017;2:e16. [DOI] [PMC free article] [PubMed] [Google Scholar]
- 44.Harris K, Castek J, Jacobs G, et al. Learner Web as an on-ramp to health portal use. National Digital Inclusion Alliance Net Inclusion Summit: Kansas City; 2016. Available at: http://netinclusion.pbworks.com/w/page/106715592/Community%20Digital%20Inclusion%20Partnerships%20With%20Healthcare%20Providers. Accessed April, 2020. [Google Scholar]
- 45.Fichtenberg C, Delva J, Minyard K, et al. Health and human services integration: Generating sustained health and equity improvements. Health Aff (Millwood). 2020;39:567–573. [DOI] [PubMed] [Google Scholar]
- 46.Sheon A, Carrol L. How can health systems leverage technology to engage patients? In: Marx EW, ed. Voices of innovation: Fulfilling the promise of information technology in healthcare. Washington DC: Taylor and Francis, 2018. [Google Scholar]
- 47.Federal Communications Commission. Lifeline support for affordable communications. 2021. Available at: https://www.fcc.gov/lifeline-consumers. Accessed January, 2021.
Associated Data
This section collects any data citations, data availability statements, or supplementary materials included in this article.
Supplementary Materials
SDC 1: Survey Measure Description (Word file)
SDC 2: Patients excluded from the final analytical sample (Table and Figure)
SDC 3: Distribution of the number of MyChart sessions (Figure)