

Abstract
BACKGROUND:
Cognitive impairment is common, but poorly managed in people with multiple sclerosis (MS). Balance has been correlated with cognition in people with MS, potentially through shared utilization of central sensory integration pathways.
OBJECTIVE:
This study characterized the relationship between central vestibular integration and cognition in people with MS through measurement of several clinical vestibular functions requiring central sensory integration and multiple cognitive domains.
Methods:
Forty people with MS and 20 controls completed a battery of vestibular and cognitive examinations targeting different central vestibular integration measures and different domains of cognition, respectively. Performance on these measures was compared between people with MS and controls, and then correlational analyses were undertaken between the vestibular and cognitive measures in the MS sample.
RESULTS:
People with MS performed worse than controls on all vestibular and cognitive measures. There were consistent correlations between vestibular and cognitive measures in the MS sample. Factor analysis of vestibular functions yielded a single factor hypothesized to represent central vestibular integration that demonstrated a significant relationship with a composite cognitive measure in people with MS.
DISCUSSION:
Our results suggest that vestibular and cognitive dysfunction may both arise from central sensory processing pathways in people with MS. This connection could be targeted through vestibular rehabilitation techniques that improve central sensory processing and both balance and cognition in people with MS.
Keywords: Multiple Sclerosis, Cognition, Vestibular, Balance, Rehabilitation
Introduction
Cognitive impairment occurs in upwards of 50% of the nearly 1 million people living with multiple sclerosis (MS) in the United States.1,2 Such cognitive impairment typically presents across multiple cognitive domains of attention and processing speed, learning and memory, and executive function, and may dramatically impact quality of life, participation, and independence.3–7 Nevertheless, there are few effective strategies for managing cognitive impairment in people with MS. Reviews of pharmacological, cognitive, and physical interventions suggest that there are insufficient data supporting any one strategy as a definitive treatment for cognitive dysfunction in people with MS.8–10
Beyond cognitive impairment, balance dysfunction and fatigue further are common disease-related manifestations that negatively impact the lives of those with MS.11–13 Vestibular rehabilitation has emerged as a potential treatment modality for balance dysfunction and fatigue in people with MS.14 Vestibular rehabilitation seemingly produces a therapeutic effect on both balance and fatigue through rehabilitation of shared central sensory processing pathways.14–17 To date, research in the area is scarce, but balance function, as measured by static postural sway, has been correlated with Symbol Digit Modalities Test (SDMT) scores (i.e., as a measure of cognitive processing speed and a proxy of generalized MS-related cognitive functioning).18,19 Such an association may similarly represent shared utilization of central sensory processing pathways by both balance pathways and cognitive processing pathways in this population.
We have identified two other central vestibular functions, besides balance, that are impaired in people with MS and correlated with fatigue, namely through the vestibular ocular reflex (VOR) cancellation task and the subjective visual vertical (SVV) task.20,21 If the relationship between balance and cognition is driven by impairments in central sensory processing pathways, these measures may further demonstrate correlations with cognitive performance measures. To that end, understanding and identifying the central vestibular integration functions that correlate with cognition, if any, will focus vestibular rehabilitation treatment strategies as a novel approach for improving cognition in people with MS.
This study compared measures requiring central sensory integration of vestibular information and measures of cognition between people with MS and sex/age matched controls, and investigated the correlations between these functions in people with MS. We hypothesized that clinical central vestibular measures and cognitive functions would moderately to strongly correlate in people with MS. We hypothesized that composite measures representing central vestibular integration function and general cognitive ability would moderately to strongly correlate in people with MS as well. Controls were included for confirmation that the sample with MS exhibited both central vestibular and cognitive dysfunction and therefore justify correlational analyses between measures in MS.
Methods
Institutional Review Board approval was obtained for the study and all participants provided written informed consent.
Sample Recruitment and Matching
We recruited 40 people with MS and 20 healthy controls. The inclusion criteria for people with MS were: age of 21–55 years; diagnosis of relapsing-remitting MS; ability to walk with or without aid (Expanded Disability Status Scale (EDSS) of ≤ 6.5); no additional neurological diagnosis beyond MS (i.e. a diagnosis of optic neuritis was not disqualifying); and no diagnosis of vestibular disease. The age cut-off of 55 years reduced the likelihood of age-related vestibular degeneration versus vestibular dysfunction due to MS.22 People with MS were recruited in person from an outpatient clinic (n=28) and from study flyers mailed to participants of previous studies (n=12).
The total testing time for the research protocol was three hours that was split into two 1.5-hour days that were completed within two weeks of each other. Tests were completed in the same order for all participants. Balance, gait, and cognitive tasks were completed in the same session. Cognitive tasks were the first subtests administered that day to prevent potential fatigue effects.
Neurological Examination:
The data collector was certified as a Neurostatus-C level examiner and performed a neurological examination among people with MS for EDSS scoring.
Clinical Vestibular Tests:
Participants completed a fifteen-minute vestibular and oculomotor battery in a Neuroalign (formerly NeuroKinetics, Inc) rotary chair system. Participants were immobilized while wearing 100Hz infrared eye-tracking goggles and a headset for communication. The measures of interest for this study were the VOR and SVV subtests.
Rotary Chair:
VOR testing consisted of sinusoidal oscillations at 0.64Hz in complete darkness for ~10 seconds under two conditions: complete darkness (simple VOR) and with a visual target that oscillated with the participant (VOR Cancellation). For simple VOR testing, participants were verbally distracted and asked to keep their eyes open and relaxed. For VOR Cancellation, participants were instructed to focus on the visual target oscillating with them. The variable of interest was the VOR Cancellation percentage, calculated as the percentage decrease of the VOR gain (the ratio between eye velocity and chair/head velocity) in the VOR Cancellation condition compared to the 0.64Hz simple VOR gain in darkness. As proper VOR Cancellation relies on both intact simple VOR and visual smooth pursuit (SP) systems, participants additionally completed SP tasks requiring them to track a visual target moving horizontally and sinusoidally at 0.25, 0.50, 0.75, and 1.00Hz. The variable of interest was the position gain (average eye location / average target location). Data for the 0.75 condition, closest in frequency to the 0.64Hz VOR conditions, is included here.
Rotary Chair SVV:
The SVV test examined the participant’s perception of vertical. A line stimulus appeared tilted up to 30° clockwise or counterclockwise. The participant pressed buttons on the rotary chair handles to tilt the line to perceived true vertical for 6 trials. The variable of interest was the variance across trials and not the average SVV deviation as variance in response, not average response, was significantly correlated with MS disease severity and other central vestibular integration functions.20,21
While other vestibular measures were collected from this protocol, previous analyses indicated only VOR Cancellation and SVV Variance significantly correlated with EDSS and balance and gait and are the focus of this current analysis.20,21
Balance and Gait Testing:
Static Balance:
Static balance was tested with the EquiTest (Natus) Sensory Organization Test (SOT), which has been shown to be a reliable and valid measure of balance in people with MS.23 The SOT requires participants to stand as still as possible under six balance conditions (combinations of eyes open/closed, stable/unstable surface, stable/unstable visual surround) Three 20s trials were completed for each condition. The equilibrium score calculated by the SOT software for each condition was averaged. An equilibrium score of 100 indicates no sway and 0 indicates a fall. The variables of interest were average equilibrium scores for each condition and the composite score (an average of the 6 conditions).
Functional Gait Assessment (FGA):
The FGA, a 10-item modification of the Dynamic Gait Index that includes more specific vestibular perturbation conditions and has been validated in people with MS, was completed over a one-foot wide, 20-foot long track.24,25 Participants followed standardized instructions read by the examiner for nine gait conditions and were able to use a cane or walker if needed. The final item (Steps) was not completed because a staircase was not available near the testing location; instead, participants were asked 1) If they required a railing to ascend/descend stairs and 2) If they alternate feet while ascending/descending stairs or need to put two feet onto each step for scoring that component. Each item was scored based on its specific 0–3 scale. The variable of interest was the composite score of the items.
Cognitive Testing:
Cognitive function was measured using the Brief International Cognitive Assessment for Multiple Sclerosis (BICAMS). The BICAMS consists of the oral version of the SDMT to remove potentially confounding upper-extremity motor deficits, five trials of the California Verbal Learning Test-II (CVLT-II), and three immediate recall trials of the Brief Visuospatial Memory Test–Revised (BVMT-R).26–28
SDMT:
The SDMT required participants to verbally pair 9 abstract geometric symbols with unpaired single digit numbers based on a completed symbol-digit key presented at the top of the page. Participants were asked to correctly pair numbers for unpaired symbols as quickly as possible for 90 seconds. Responses were recorded by the examiner. The variable of interest was the raw score, calculated as the number of correct pairings provided in the time alotted.26
CVLT-II:
The CVLT-II involved the examiner reading a list of 16 words consisting of four categories (four words per category) that are randomly arranged in the list. The examiner read the words aloud at a rate of approximately 1 word per second. Following the reading, participants were instructed to verbally recall as many words as possible, in any order. This process was completed five times and words were read in the same order each time; participants received no feedback per trial, as per standard procedures. The variable of interest was the raw score calculated as the sum of correct words recalled over the 5 trials (i.e., total learning score) with a maximum score of 80; higher scores indicate better verbal learning and memory.27
BVMT-R:
The BVMT-R consisted of the examiner presenting a 2 × 3 page of abstract geometric figures approximately 15 inches in front of the participant. Participants were given 10 seconds to study the page. Following these 10 seconds, the page was removed from the participant’s sight and they were prompted to draw the figures on a blank, 8.5 × 11” sheet of paper as precisely as possible and in their correct locations; this task was not timed. After participants attempted to replicate the figures from memory, their response sheet was removed, and the process was repeated 2 additional times (i.e., 3 total trials). Each drawing was scored on a 0 to 2 scale, based on accuracy of the figure and whether it was drawn in its correct location. The variable of interest was the raw score calculated as the total score across the 3 trials (i.e., total learning score) with a maximum score of 36, with higher scores indicating better visuospatial learning and memory.28
Z-Scores:
For between-group comparisons of people with MS and controls, we computed z-scores for the SDMT, CVLT-II, and BVMT-R based on published norms.29 A fourth z-score, the BICAMS composite z-score, was computed as the average of the three z-scores as a general cognitive function measure. For correlational analyses within our sample of people with MS, we utilized the three raw scores of the cognitive tasks and the BICAMS z-score measure.
In total, participants completed a 3-hour battery of clinical vestibular, oculomotor, gait, balance, and cognitive tests split into two 1.5-hour sessions that were completed within two weeks of each other. The entire protocol is not described here; a previous analysis of the vestibular function tests of this battery suggested that two measures requiring central integration of vestibular input were the only vestibular measures this sample with MS performed worse on than controls and that predicted MS disease severity.20 A further analysis of those central integration functions alongside two balance measures indicated significant intercorrelations between all measures, presumably due to shared central sensory integration pathways.21 Therefore, those four central vestibular integration measures are utilized in this analysis. Balance and gait testing was done on the same day as the cognitive tasks, but cognitive tasks were completed first.
Statistical Analysis
All statistics were completed in SPSS v27.0. Variables were visually inspected for normality for both people with MS and controls. All four central vestibular variables demonstrated skewed distributions: SVV Variance was right-skewed while VOR Cancellation, SOT, and FGA were left-skewed. Cognitive function scores for both people with MS and controls were normally distributed.
Comparison of Central Vestibular Functions and Cognitive Functions between People with MS and Controls:
For consistency between normally distributed and non-normally distributed variables and a small control sample size, Mann-Whitney U tests were used to compare all vestibular and cognitive variables between people with MS and controls. A p-value of <0.05 was set as the threshold for statistical significance. Common language (CL) effect sizes were calculated for all variables using the Mann-Whitney U statistic and group sample sizes using the equation Effect Size = (Mann Whitney U Statistic) / (MS Sample Size * Control Sample Size).30 This effect size estimates the rate at which a random person with MS would perform worse than a random control based on our samples. We note that comparisons between groups for Simple VOR, VOR Cancellation, and SVV Variance had been completed in a previous analysis.20
Correlations between Central Vestibular Functions and Cognitive Functions in People with MS:
Spearman correlation analyses were run among all four central vestibular measures, raw scores on the three cognitive tasks in people with MS. Benjamini-Hochberg (B-H) p-value corrections were done to control for multiple analyses and a false positive rate of 0.10 was set as the threshold for statistical significance due to the pilot nature of this study.31 Some B-H corrections of p-values > 0.05 resulted in a false positive rate below 0.10; however, these correlations were not considered statistically significant. Spearman correlational analyses between the four central vestibular measures had been completed in a previous analysis, but B-H corrections were based on the analyses completed here.21
Factor Analysis: Factor Analysis:
Due to moderate intercorrelations between the four central vestibular integration variables of interest and hypothesis that they collectively represent function of central vestibular integration pathways, principal axis factor (PAF) analysis was used to assess whether an underlying latent variable(s) represented these intercorrelations.21 Due to negative skew, VOR Cancellation, SOT, and FGA were first reflected to be positively skewed like SVV Variance. All four variables were then log-transformed, resulting in normal distributions and comparable scale scores. An eigenvalue of >1.0 was used as the cutoff for extracted factors. PAF resulted in a single extracted factor which we labeled “Central Vestibular Integration”. Regression scores for each person with MS utilizing the factor’s variable coefficients were calculated and utilized for the following correlation analysis. Due to reflection of VOR Cancellation, SOT, and FGA, a higher “Central Vestibular Integration” score indicates worse function on the four central vestibular measures.
Correlations of regression scores on Extracted “Central Vestibular Integration” Factor and BICAMS z-score:
Both Pearson and Spearman correlational analyses were completed between regression scores on the extracted “Central Vestibular Integration” factor and the BICAMS z-score measure. To determine whether these correlations were driven by separate correlations with MS disease severity, Partial Pearson correlational analyses were completed controlling for EDSS score. A p-value of 0.05 was set as the threshold for statistical significance.
Results
Sample Demographics:
Sample demographics are provided in Table 1. There was no significant difference in age (Student’s T-Test p-value = 0.72) nor sex (Chi-Square p-value = 1.00) between people with MS and controls. 88% of the sample with MS was female. The sample with MS had a median EDSS score of 2.5 (IQR=2.25, Range 1.0–6.5), indicating that on average, participants demonstrated mild disability.32,33
Table 1:
Sample Demographics for People with MS and Controls
| MS (n=40) | Controls (n=20) | |
|---|---|---|
| Age (yrs) | 42.4 ± 7.7 | 41.6 ± 8.7 |
| Sex (N/%) | 35/88%F 5/12%M | 17/85% F 3/15% M |
| EDSS Score (mdn) | 2.5 (IQR=2.25) | - |
| Years Since Diagnosis (yrs) | 9.9 ± 7.2 | - |
Note. EDSS=Expanded Disability Status Scale; MS=Multiple Sclerosis
Comparison of Central Vestibular Functions and Cognitive Functions between People with MS and Controls:
Results of Mann-Whitney U comparisons between people with MS and controls on central vestibular functions and cognitive functions are presented in Table 2. People with MS demonstrated significantly worse performance on all four central vestibular measures and all three cognitive tasks (CL Effect Size 0.71–0.82). People with MS did not demonstrate statistically significantly different simple VOR or SP function.
Table 2:
Mann-Whitney U Comparisons of Central Vestibular Functions, Simple VOR Gain, Smooth Pursuit, and Cognitive Functions in People with MS versus Controls. Data presented as Median (IQR) Statistically significant p-values at α<0.05 are bolded and underlined.
| MS (n=40) | Control (n=20) | CL Effect Size | p-value | |
|---|---|---|---|---|
| VOR Cancel % | 68.0 (30.0) | 79.0 (10.0) | 0.72 | 0.01 |
| 0.64Hz VOR Gain | 0.58 (0.25) | 0.63 (0.17) | 0.11 | 0.70 |
| 0.75Hz SP Gain | 0.98 (0.12) | 0.97 (0.09) | 0.04 | 0.90 |
| SVV Variance | 1.50 (2.25) | 0.77 (0.81) | 0.71 | 0.01 |
| FGA Composite | 27.0 (8.0) | 29.0 (2.0) | 0.82 | <0.01 |
| SOT Composite | 74.0 (19.0) | 82.0 (4.0) | 0.74 | <0.01 |
| SDMT z-score | −0.90 (1.94) | −0.36 (1.53) | 0.75 | <0.01 |
| CVLT-II z-score | −0.74 (2.27) | 0.06 (2.66) | 0.71 | 0.02 |
| BVMT-R z-score | −0.73 (2.63) | 0.23 (1.40) | 0.74 | 0.01 |
| BICAMS z-score | −1.00 (2.21) | −0.21 (1.58) | 0.78 | <0.01 |
Note. VOR=Vestibular Ocular Reflex; SP=Smooth Pursuit; SVV=Subjective Visual Vertical; FGA=Functional Gait Assessment; SOT=Sensory Organization Test; SDMT=Symbol Digit Modalities Test; CVLT-II=California Verbal Learning Test II; BVMT-R=Brief Visuospatial Memory Test Revised; MS=Multiple Sclerosis; CL=Common Language.
Correlations between Central Vestibular Functions and Cognitive Functions in People with MS:
Results of Spearman correlational analyses between vestibular functions and cognitive measures are presented in Table 3. There were statistically significant Spearman correlations among all variables following B-H p-value correction, except for CVLT-II score with BVMT-R and FGA (B-H p-value = <0.10, but raw p-values of 0.08). Significant Spearman correlation coefficients were in the moderate to large range (0.33–0.57).34
Table 3:
Spearman Correlation Matrix of Central Vestibular Integration Measures and Cognitive Measures in People with MS. Numbers shown are Spearman correlation coefficients. Statistically significant correlations after Benjamini-Hochberg p-value corrections at a false positive rate of 0.10 are bolded and underlined. B-H corrected p-values <0.10 were not considered statistically significant if the uncorrected p-value was >0.05.
| Central Vestibular Integration | Cognitive Tasks | |||||||
|---|---|---|---|---|---|---|---|---|
| VOR Cancel % | SVV Variance | FGA Comp | SOT Comp | SDMT Sum | BVMTR Sum | CVLT-II Sum | ||
| Central Vestibular Integration | VOR Cancel % | -- | ||||||
| SVV Variance | −0.35 | -- | ||||||
| FGA Comp | 0.42 | −0.60 | -- | |||||
| SOT Comp | 0.34 | −0.52 | 0.52 | -- | ||||
| Cognitive Tasks | SDMT Sum | 0.57 | −0.40 | 0.51 | 0.55 | -- | ||
| BVMTR Sum | 0.49 | −0.42 | 0.29 | 0.33 | 0.50 | -- | ||
| CVLT-II Sum | 0.36 | −0.57 | 0.47 | 0.54 | 0.52 | 0.29 | -- | |
Note. VOR=Vestibular Ocular Reflex; SVV=Subjective Visual Vertical; FGA=Functional Gait Assessment; SOT=Sensory Organization Test; SDMT=Symbol Digit Modalities Test; CVLT-II=California Verbal Learning Test II; BVMT-R=Brief Visuospatial Memory Test Revised.
Factor Analysis:
KMO Measure of Sampling Adequacy was 0.794 and Bartlett’s Test of Sphericity was statistically significant (χ2=46.34, df=6, p-value<0.001) indicating a good degree of common variance and that factor analysis was appropriate on these four variables (VOR Cancellation %, SVV Variance, SOT, and FGA).35 PAF resulted in a single factor with a single eigenvalue >1.0; no rotation was necessary for a single factor. This factor explained 54.9% of the total variance of the variables. Factor loadings and reproduced correlations are presented in Table 4; all loadings were >0.65 and all reproduced correlation residuals were <0.025 – this supports the adequacy of the single factor solution. This single factor is labelled “Central Vestibular Integration”.
Table 4:
Results of Principal Axis Factoring on VOR Cancellation %, SVV Variance, SOT, and FGA in people with MS. Reproduced correlations are presented as Reproduced Correlation Coefficient (Residual Correlation Coefficient).
| Principal Axis Factoring Results | ||||
|---|---|---|---|---|
|
| ||||
| Communalities | Extraction | |||
| VOR Cancel % | 0.44 | |||
| SVV Variance | 0.60 | |||
| SOT Composite | 0.45 | |||
| FGA Composite | 0.71 | |||
| | ||||
| | ||||
| Extraction Sums of Squared | ||||
| Factors | Loadings | |||
| Eigenvalue | % of Variance | |||
| Factor 1 (“Central Vestibular Integration”) | 2.2 | 54.90% | ||
| | ||||
| | ||||
| Factor Loadings | Factor 1 | |||
| VOR Cancel % | 0.66* | |||
| SVV Variance | 0.78 | |||
| SOT Composite | 0.67* | |||
| FGA Composite | 0.84* | |||
| | ||||
| | ||||
| Reproduced Correlations | ||||
| VOR Cancellation % | SVV Variance | SOT Composite | FGA Composite | |
| VOR Cancel % | -- | |||
| SVV Variance | 0.51 (0.01) | -- | ||
| SOT Composite | 0.44 (0.01) | 0.52 (−0.02) | -- | |
| FGA Composite | 0.56 (−0.02) | 0.51 (0.01) | 0.56 (0.01) | -- |
Note. VOR=Vestibular Ocular Reflex, SVV=Subjective Visual Vertical, SOT=Sensory Organization Test, FGA=Functional Gait Assessment.
Reflection of these variables prior to factor analysis means that the true relationship of these variables with the factor is negative, not positive.
Correlations of regression scores on Extracted “Central Vestibular Integration” Factor and BICAMS z-score:
Pearson and Spearman correlation analyses between regression scores on the extracted “Central Vestibular Integration” factor and the BICAMS z-Score are presented in Table 5. A scatterplot of this correlation is shown in Figure 1. “Central Vestibular Integration” scores demonstrated a significant and strong correlation with the BICAMS z-Score measure using both Pearson (r = −0.69) and Spearman (r = −0.53) analyses.34 The Partial Pearson correlation of “Central Vestibular Integration” scores with BICAMS z-Scores controlling for EDSS score indicated that the correlation remained statistically significant and was of moderate magnitude (r = −0.49) when controlling for disability status.
Table 5:
Pearson and Spearman Correlations of PAF Extracted “Central Vestibular Integration” Factor Scores with Cognitive Measures in People with MS. Statistically significant p-values at α<0.05 are bolded and underlined.
| “Central Vestibular Integration” | ||
|---|---|---|
| BICAMS z-Score | Pearson Coefficient (Spearman Coefficient) | p-value |
| −0.64 (−0.59) | <0.01 (<0.01) | |
| BICAMS z-Score | Partial Pearson Coefficient (EDSS) | p-value |
| −0.49 | 0.01 | |
Note. SDMT=Symbol Digit Modalities Test; CVLT-II=California Verbal Learning Test II; BVMT-R=Brief Visuospatial Memory Test Revised.
Figure 1:
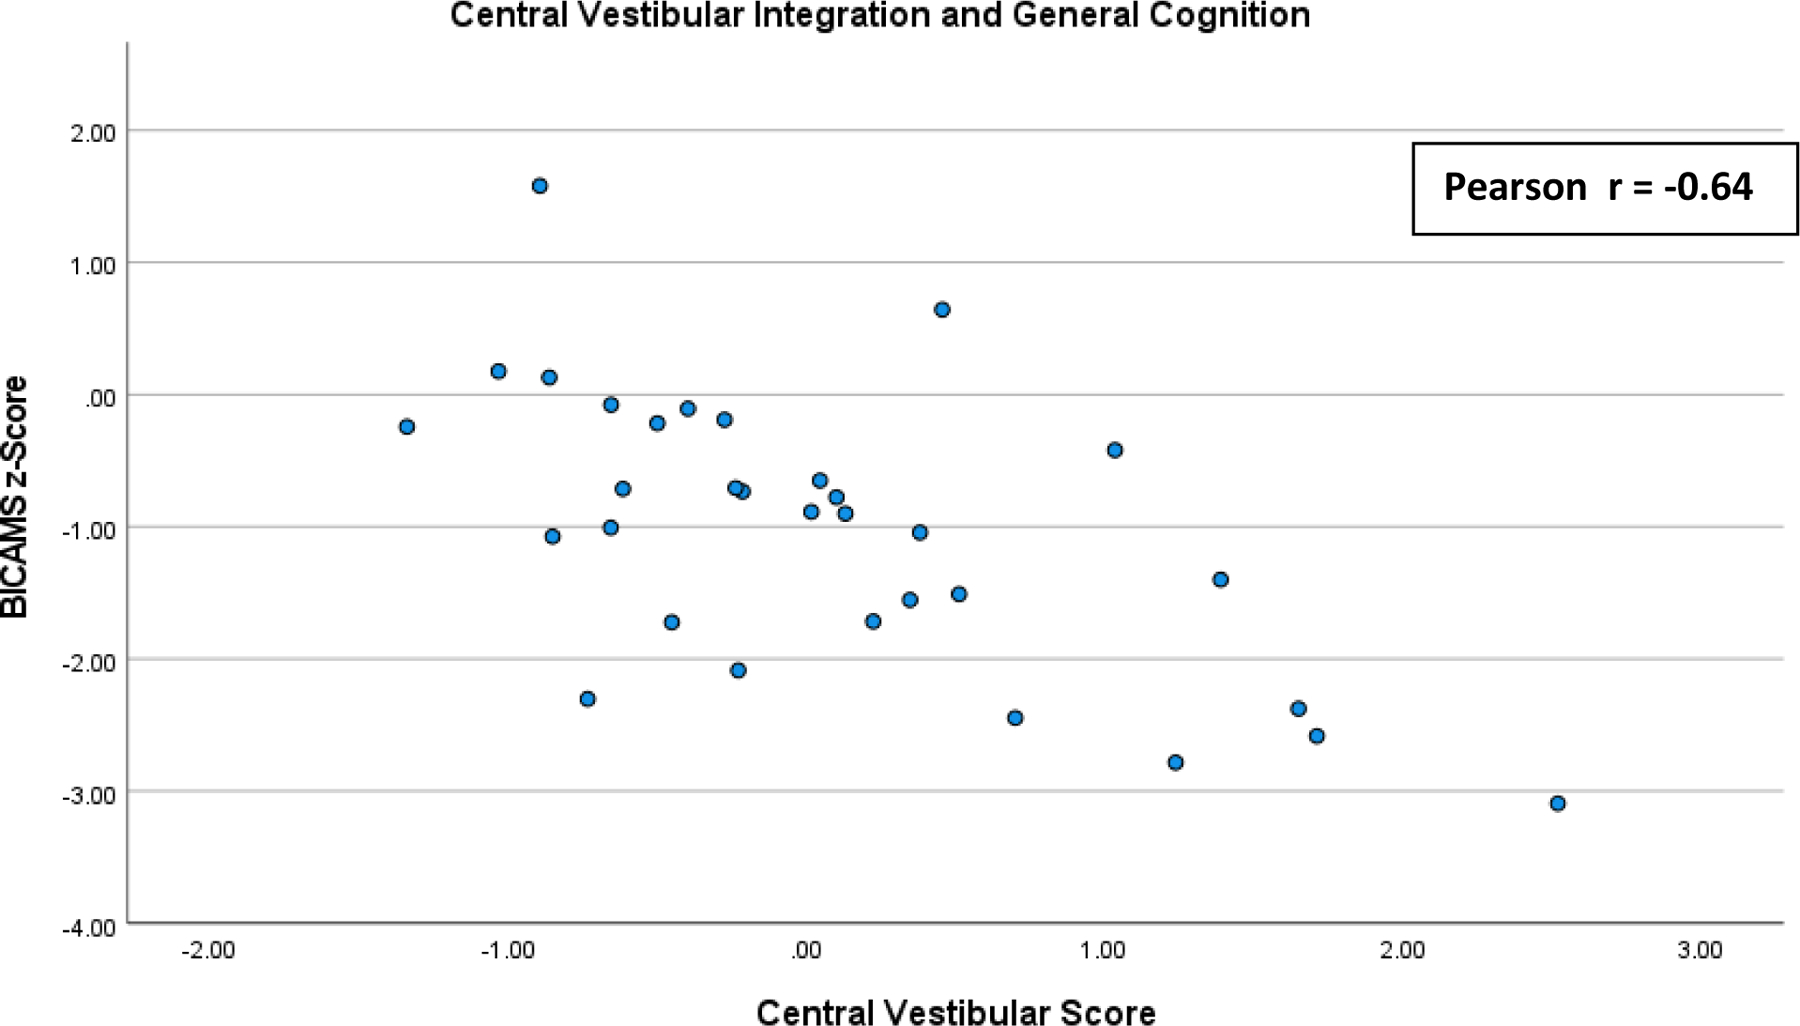
Scatterplot of the correlations of regression scores on Extracted “Central Vestibular Integration” Factor and BICAMS z-score: Pearson and Spearman correlation analyses between regression scores on the extracted “Central Vestibular Integration” factor and the BICAMS z-Score.
Discussion
This study investigated correlations between clinical measures requiring central integration of vestibular information and cognitive task performance in multiple cognitive domains with a sample of people with MS. We identified significant moderate to strong correlations between central vestibular integration measures and cognitive functions in people with MS. These relationships appeared to be independent of MS disease severity. We hypothesize that our results collectively suggest that vestibular and cognitive dysfunction may both arise from central sensory processing pathways in people with MS. Such an observation has implications for rehabilitation research and clinical practice in MS.
The sample of people with MS demonstrated worse performance on all central vestibular integration measures and cognitive tasks (as well as the BICAMS z-score) compared with controls. This indicated that this sample with MS had deficits in vestibular integration and multiple cognitive domains as expected based on previous research, suggesting pursuing correlational analyses between these measures would be appropriate.6,16 CL effect sizes of 0.71–0.82 across central vestibular and cognitive measures indicate the probability of a person with MS demonstrating dysfunction on one measure compared with controls is high and similar across all measures. Spearman correlation analyses between central vestibular and cognitive measures identified significant moderate to strong correlations between most pairs of measures.
The data suggest that central vestibular functions are associated with poor performance in multiple cognitive domains in people with MS. These data expand on a previous study of people with MS that demonstrated a moderate correlation between cognitive processing speed and postural sway by including additional measures of both central vestibular integration and cognition.18 The central vestibular integration measures here require central sensory integration of semicircular canal input (VOR Cancellation), otolith input (SVV Variance), or both (SOT and FGA).36,37 While VOR Cancellation additionally requires a functioning visual smooth pursuit system, we did not identify a deficit in smooth pursuit position gain in our people with MS. We therefore hypothesize that deficits in these functions suggest that central integration of signals from both organs of the vestibular system are impaired in people with MS. Likewise, the three cognitive tasks target unique aspects of cognition: processing speed (SDMT), verbal learning and memory (CVLT-II), and visuospatial learning and memory (BVMT-R).6 Correlations between each of these aspects of cognition with central vestibular integration measures suggest that generalized cognitive performance, and not any specific cognitive domain, is related to vestibular function in people with MS.
Research on the relationship between vestibular function and cognition has been steadily growing but has focused on patients with peripheral vestibular organ loss and age-related vestibular degeneration.38–40 Unlike the findings reported here, previous studies have mainly identified significant interactions between peripheral vestibular loss and visuospatial cognition, and have failed to identify associations with cognitive domains such as verbal memory.38,41,42 This discrepancy may be due to our focus on MS, which we believe primarily causes dysfunction of central vestibular integration processes and not peripheral vestibular reflexes (vestibular evoked myogenic potentials (VEMP), VOR)—the main outcome measures of previous studies on peripheral vestibular degeneration.20 It may be that dysfunction of central sensory integration pathways leads to global deficits in cognition when compared to degeneration of peripheral vestibular inputs which primarily influences spatial memory.
To this end, PAF was completed on our four central vestibular integration measures due to our hypothesis that a latent vestibular integration process underlies the significant intercorrelations between those measures. PAF extracted a single factor (that we labelled “Central Vestibular Integration”) that reproduced the intercorrelations between vestibular measures and that significantly correlated with general cognitive ability as measured by the BICAMS z-Score. In addition, “Central Vestibular Integration” demonstrated statistically significant partial Pearson correlations with the BICAMS z-Score even when controlling for MS disease severity as measured by EDSS. This significant partial correlation suggests that correlations between this latent central integration process and cognitive function in people with MS identified here are likely not spurious correlations caused by separate correlations with EDSS. These correlations support the hypothesis that impairments in a latent central integration process relates to both central vestibular dysfunction and cognition in people with MS.
Despite these statistically significant correlations, it is possible that cognition and vestibular function appear related due to a separate pathophysiological mechanism in MS rather than our hypothesized shared central sensory integration process. Future research should investigate how non-vestibular measures of sensory integration relate to cognition to evaluate this hypothesis and longitudinally evaluate cognition and sensory function in people with MS to identify how both may change over the course of disease.
If shared sensory integration pathways do in fact drive the correlations between cognition and vestibular function, interventions targeting these pathways, such as balance training in vestibular rehabilitation, may simultaneously improve balance function and cognition in people with MS.43,44 Potential cognitive benefits for people with MS may not be limited to only improvements in visuospatial memory as research on balance interventions for healthy adults and other clinical populations might suggest.45 Rather, the present results seemingly suggest that future vestibular rehabilitation interventions could elicit generalized cognitive benefits in MS. Vestibular rehabilitation has already emerged as a potential intervention for improving both balance and fatigue in people with MS due to an identical common central sensory integration hypothesis.14,16,17 Future studies of vestibular rehabilitation in people with MS should include measures of cognition as secondary outcome measures to determine if retraining central sensory integration processes may impact cognition. It may be that balance training could serve as a primary approach for mitigating cognitive impairment in people with MS if cognitive improvements coincide with balance improvements.
There are several limitations of this study. First, the sample with MS had primarily mild to moderate relapsing-remitting MS (Median EDSS = 2.5). The EDSS cutoff of 6.5 for inclusion ensured that participants would be physically able to safely complete all aspects of our study, including gait and balance measures. However, the relationships presented here may not translate well to people with more severe MS nor to people with progressive presentations of MS. It is possible that our participants with EDSS=6.5 have secondary progressive MS and not relapsing-remitting MS. Future studies should include groups with distinct MS diagnoses to evaluate how cognition and vestibular function may correlate differently based on type of MS. Next, a proportion of the current MS sample (n=12) was recruited from flyers sent to previous research participants. This may have resulted in a sample of MS with higher socioeconomic status than the general population of people with MS due to knowledge of and active participation in research. As socioeconomic status can influence performance on cognitive tasks, our data may be slightly biased as we did not control for this potential confounder.46
Next, our sample was between the ages of 27 and 55, due to the concern that age-related vestibular loss may confound the data. The relationship between vestibular function and cognition in people with MS may become more apparent or may change as people with MS age above this range and have concurrent peripheral vestibular degeneration alongside disease-related central vestibular integration. Next, while our original clinical vestibular analyses on this sample demonstrated a lack of peripheral vestibular lesions through intact VEMP and VOR, it is possible that subclinical peripheral lesions exist. These subclinical peripheral lesions would impact central integration processes and could alter interpretation of our results. Future studies should consider adding brainstem MRI analyses that may identify lesions in the vestibular nuclei that VEMP and VOR testing do not. Finally, we did not include measures of depression or anxiety, which may play a role in cognitive status and would be important confounding variables to account for in future studies.
Conclusion
Central vestibular functions such as balance are associated with multiple domains of cognition in people with MS even when controlling for disability status. These correlations suggest that both central vestibular dysfunction and cognitive dysfunction in people with MS are driven by pathology of shared neurological pathways. Interventions that focus on rehabilitation of these pathways, such as vestibular rehabilitation, may simultaneously improve both balance function and cognitive function in people with MS.
Acknowledgements
Thank you to the Foundation of the Consortium of Multiple Sclerosis Centers for their support of this project in the form of a MS Workforce of the Future Medical Student Research Scholarship award to Graham Cochrane. Thank you to Dr. Khurram Bashir and the UAB MS Center for their aid in recruitment of participants. Graham D. Cochrane is also supported by the NIH-NIGMS under award T33GM008361. The content is solely the responsibility of the authors and does not necessarily represent the official views of the NIH
References
- 1.Ruano L, Portaccio E, Goretti B, et al. Age and disability drive cognitive impairment in multiple sclerosis across disease subtypes. Mult Scler 2017;23:1258–67. [DOI] [PubMed] [Google Scholar]
- 2.Wallin MT, Culpepper WJ, Campbell JD, et al. The prevalence of MS in the United States: A population-based estimate using health claims data. Neurology 2019;92:e1029–e40. [DOI] [PMC free article] [PubMed] [Google Scholar]
- 3.DeLuca J, Chelune GJ, Tulsky DS, Lengenfelder J, Chiaravalloti ND. Is speed of processing or working memory the primary information processing deficit in multiple sclerosis? J Clin Exp Neuropsychol 2004;26:550–62. [DOI] [PubMed] [Google Scholar]
- 4.Koutsouraki E, Kalatha T, Grosi E, Koukoulidis T, Michmizos D. Cognitive decline in Multiple Sclerosis patients. Hell J Nucl Med 2019;22 Suppl:75–81. [PubMed] [Google Scholar]
- 5.Benedict RH, Wahlig E, Bakshi R, et al. Predicting quality of life in multiple sclerosis: accounting for physical disability, fatigue, cognition, mood disorder, personality, and behavior change. J Neurol Sci 2005;231:29–34. [DOI] [PubMed] [Google Scholar]
- 6.Langdon DW, Amato MP, Boringa J, et al. Recommendations for a Brief International Cognitive Assessment for Multiple Sclerosis (BICAMS). Mult Scler 2012;18:891–8. [DOI] [PMC free article] [PubMed] [Google Scholar]
- 7.Chiaravalloti ND, DeLuca J. Cognitive impairment in multiple sclerosis. Lancet Neurol 2008;7:1139–51. [DOI] [PubMed] [Google Scholar]
- 8.Sandroff BM, Motl RW, Scudder MR, DeLuca J. Systematic, Evidence-Based Review of Exercise, Physical Activity, and Physical Fitness Effects on Cognition in Persons with Multiple Sclerosis. Neuropsychol Rev 2016;26:271–94. [DOI] [PubMed] [Google Scholar]
- 9.Grzegorski T, Losy J. Cognitive impairment in multiple sclerosis - a review of current knowledge and recent research. Rev Neurosci 2017;28:845–60. [DOI] [PubMed] [Google Scholar]
- 10.DeLuca J, Chiaravalloti ND, Sandroff BM. Treatment and management of cognitive dysfunction in patients with multiple sclerosis. Nat Rev Neurol 2020;16:319–32. [DOI] [PubMed] [Google Scholar]
- 11.Cattaneo D, Jonsdottir J. Sensory impairments in quiet standing in subjects with multiple sclerosis. Mult Scler 2009;15:59–67. [DOI] [PubMed] [Google Scholar]
- 12.Fisk JD, Pontefract A, Ritvo PG, Archibald CJ, Murray TJ. The impact of fatigue on patients with multiple sclerosis. Can J Neurol Sci 1994;21:9–14. [PubMed] [Google Scholar]
- 13.Freal JE, Kraft GH, Coryell JK. Symptomatic fatigue in multiple sclerosis. Arch Phys Med Rehabil 1984;65:135–8. [PubMed] [Google Scholar]
- 14.Garcia-Munoz C, Cortes-Vega MD, Heredia-Rizo AM, Martin-Valero R, Garcia-Bernal MI, Casuso-Holgado MJ. Effectiveness of Vestibular Training for Balance and Dizziness Rehabilitation in People with Multiple Sclerosis: A Systematic Review and Meta-Analysis. J Clin Med 2020;9. [DOI] [PMC free article] [PubMed] [Google Scholar]
- 15.Gandolfi M, Munari D, Geroin C, et al. Sensory integration balance training in patients with multiple sclerosis: A randomized, controlled trial. Mult Scler 2015;21:1453–62. [DOI] [PubMed] [Google Scholar]
- 16.Hebert JR, Corboy JR. The association between multiple sclerosis-related fatigue and balance as a function of central sensory integration. Gait Posture 2013;38:37–42. [DOI] [PubMed] [Google Scholar]
- 17.Hebert JR, Corboy JR, Manago MM, Schenkman M. Effects of vestibular rehabilitation on multiple sclerosis-related fatigue and upright postural control: a randomized controlled trial. Phys Ther 2011;91:1166–83. [DOI] [PubMed] [Google Scholar]
- 18.Sandroff BM, Motl RW. Fitness and cognitive processing speed in persons with multiple sclerosis: a cross-sectional investigation. J Clin Exp Neuropsychol 2012;34:1041–52. [DOI] [PubMed] [Google Scholar]
- 19.Benedict RH, DeLuca J, Phillips G, et al. Validity of the Symbol Digit Modalities Test as a cognition performance outcome measure for multiple sclerosis. Mult Scler 2017;23:721–33. [DOI] [PMC free article] [PubMed] [Google Scholar]
- 20.Cochrane GD, Christy JB, Motl RW. Comprehensive Clinical Assessment of Vestibular Function in Multiple Sclerosis. Journal of Neurologic Physical Therapy 2021. [DOI] [PMC free article] [PubMed] [Google Scholar]
- 21.Cochrane GD, Christy JB, Motl RW. Central vestibular functions correlate with fatigue and walking capacity in people with multiple sclerosis. Phys Ther 2021. [DOI] [PMC free article] [PubMed] [Google Scholar]
- 22.Zalewski CK. Aging of the Human Vestibular System. Semin Hear 2015;36:175–96. [DOI] [PMC free article] [PubMed] [Google Scholar]
- 23.Hebert JR, Manago MM. Reliability and Validity of the Computerized Dynamic Posturography Sensory Organization Test in People with Multiple Sclerosis. Int J MS Care 2017;19:151–7. [DOI] [PMC free article] [PubMed] [Google Scholar]
- 24.Wrisley DM, Marchetti GF, Kuharsky DK, Whitney SL. Reliability, internal consistency, and validity of data obtained with the functional gait assessment. Phys Ther 2004;84:906–18. [PubMed] [Google Scholar]
- 25.Forsberg A, Andreasson M, Nilsagard Y. The Functional Gait Assessment in People with Multiple Sclerosis: Validity and Sensitivity to Change. Int J MS Care 2017;19:66–72. [DOI] [PMC free article] [PubMed] [Google Scholar]
- 26.Smith A. Symbol Digit Modalities Test: Manual Los Angeles: CWPS. [Google Scholar]
- 27.Delis DC KJ, Kaplan E, Ober BA. California Verbal Learning Test, Second Edition (CVLT-II). San Antonio, TX: Psychological Corporation; 2000. [Google Scholar]
- 28.Benedict RHB. The Brief Visuospatial Memory Test Revised (BVMT-R). Lutz FPAR [Google Scholar]
- 29.Parmenter BA, Testa SM, Schretlen DJ, Weinstock-Guttman B, Benedict RH. The utility of regression-based norms in interpreting the minimal assessment of cognitive function in multiple sclerosis (MACFIMS). J Int Neuropsychol Soc 2010;16:6–16. [DOI] [PubMed] [Google Scholar]
- 30.Grissom RJ, Kim JJ. Effect sizes for research: Univariate and multivariate applications 2nd ed. New York: Routledge/Taylor & Francis Group; 2012. [Google Scholar]
- 31.Benjamini Y HY. Controlling the false discovery rate: a practical and powerful approach to multiple hypothesis testing. J R Stat Soc B 1995;57:289–300. [Google Scholar]
- 32.Conradsson D, Ytterberg C, von Koch L, Johansson S. Changes in disability in people with multiple sclerosis: a 10-year prospective study. J Neurol 2018;265:119–26. [DOI] [PMC free article] [PubMed] [Google Scholar]
- 33.Hatipoglu H, Canbaz Kabay S, Gungor Hatipoglu M, Ozden H. Expanded Disability Status Scale-Based Disability and Dental-Periodontal Conditions in Patients with Multiple Sclerosis. Med Princ Pract 2016;25:49–55. [DOI] [PMC free article] [PubMed] [Google Scholar]
- 34.Cohen J. Statistical Power Analysis for the Behavioral Sciences 2 ed. Hillsdale NJ: Lawrence Erlbaum Associates, Publishers; 1988. [Google Scholar]
- 35.Hair JF BW, Babin BJ. . In: Anderson RE TR, ed. Multivariate Data Analysis, sixth edition. New Delhi, India: Pearson Education; 2006. [Google Scholar]
- 36.Cullen KE. The vestibular system: multimodal integration and encoding of self-motion for motor control. Trends Neurosci 2012;35:185–96. [DOI] [PMC free article] [PubMed] [Google Scholar]
- 37.Cullen KE. Physiology of central pathways. Handb Clin Neurol 2016;137:17–40. [DOI] [PubMed] [Google Scholar]
- 38.Bigelow RT, Agrawal Y. Vestibular involvement in cognition: Visuospatial ability, attention, executive function, and memory. J Vestib Res 2015;25:73–89. [DOI] [PubMed] [Google Scholar]
- 39.Ferre ER, Haggard P. Vestibular cognition: State-of-the-art and future directions. Cogn Neuropsychol 2020;37:413–20. [DOI] [PubMed] [Google Scholar]
- 40.Smith PF. The vestibular system and cognition. Curr Opin Neurol 2017;30:84–9. [DOI] [PubMed] [Google Scholar]
- 41.Bigelow RT, Semenov YR, Trevino C, et al. Association Between Visuospatial Ability and Vestibular Function in the Baltimore Longitudinal Study of Aging. J Am Geriatr Soc 2015;63:1837–44. [DOI] [PMC free article] [PubMed] [Google Scholar]
- 42.Kremmyda O, Hufner K, Flanagin VL, et al. Beyond Dizziness: Virtual Navigation, Spatial Anxiety and Hippocampal Volume in Bilateral Vestibulopathy. Front Hum Neurosci 2016;10:139. [DOI] [PMC free article] [PubMed] [Google Scholar]
- 43.Appiah-Kubi KO, Wright WG. Vestibular training promotes adaptation of multisensory integration in postural control. Gait Posture 2019;73:215–20. [DOI] [PubMed] [Google Scholar]
- 44.Soysal Tomruk M, Uz MZ, Kara B, Idiman E. Effects of Pilates exercises on sensory interaction, postural control and fatigue in patients with multiple sclerosis. Mult Scler Relat Disord 2016;7:70–3. [DOI] [PubMed] [Google Scholar]
- 45.Rogge AK, Roder B, Zech A, et al. Balance training improves memory and spatial cognition in healthy adults. Sci Rep 2017;7:5661. [DOI] [PMC free article] [PubMed] [Google Scholar]
- 46.Hackman DA, Farah MJ. Socioeconomic status and the developing brain. Trends Cogn Sci 2009;13:65–73. [DOI] [PMC free article] [PubMed] [Google Scholar]