

Abstract
Background:
Tools are needed to aid clinicians in estimating their patients’ risk of transitioning to long-term opioid use and to inform prescribing decisions.
Objective:
To develop and validate a model that predicts previously opioid-naïve patients’ risk of transitioning to long-term use.
Research Design:
Statewide population-based prognostic study
Subjects:
Opioid-naïve (no prescriptions in previous two years) patients ≥12 years old who received a pill-form opioid analgesic in 2016-2018 and whose prescriptions were registered in the California prescription drug monitoring program (PDMP).
Measures:
A multiple logistic regression approach was used to construct a prediction model with long-term (i.e., >90 days) opioid use as the outcome. Models were developed using 2016-2017 data and validated using 2018 data. Discrimination (c-statistic), calibration (calibration slope, intercept, and visual inspection of calibration plots), and clinical utility (decision curve analysis) were evaluated to assess performance.
Results:
Development and validation cohorts included 7,175,885 and 2,788,837 opioid-naïve patients with outcome rates of 5.0% and 4.7%, respectively. The model showed high discrimination (c-statistic: 0.904 for development, 0.913 for validation), was well calibrated after intercept adjustment (intercept, −0.006 [95% CI, −0.016 to 0.004]; slope, 1.049 [CI, 1.045 to 1.053]), and had a net benefit over a wide range of probability thresholds.
Conclusions:
A model for the transition from opioid-naïve status to long-term use had high discrimination and was well calibrated. Given its high predictive performance, this model shows promise for future integration into PDMPs to aid clinicians in formulating opioid prescribing decisions at the point of care.
Keywords: Prescription drug monitoring program, Opioid-naïve, Long-term opioid use, Risk prediction, Dose trajectory, Opioid analgesic
Introduction
Opioid use disorder and overdose are pressing public health issues in the United States. The Centers for Disease Control and Prevention (CDC) released opioid prescribing guidelines in 2016, which emphasized limiting the number of patients who receive a new opioid prescription and continue receiving opioids for the long term (1, 2). Pharmacies, health systems, payers, and state regulators responded to these guidelines by restricting the days’ supply and/or the daily dose that opioid-naïve patients could receive (3, 4).
Research on the predictors of incident long-term opioid use has focused mostly on individual risk factors, notably characteristics of a patient’s index opioid prescription (5–11). Few studies have examined prescribing patterns during patients’ first month of opioid therapy; after which the CDC guidelines recommend clinical reassessment of opioid prescribing (2). Tools that incorporate prescribing information after the index prescription date can help clinicians estimate their patients’ risk for transition to long-term opioid use and so better inform prescribing decisions.
Prescription drug monitoring programs (PDMPs) track all outpatient opioids dispensed in their respective states, and include a web interface for clinical review of prescribed controlled substances. PDMPs are ideal data sources for developing prescribing-related prediction tools as they track dispensed prescriptions regardless of payer and include information on daily fluctuations in prescribed opioid dose over time. We know of one prior study that has examined associations between PDMP-derived predictors and long-term opioid use (12), but none that have used PDMP data to predict the risk of this outcome.
The objective of this study was to develop and validate a multiple logistic regression prediction model for incident long-term use that could potentially be integrated into a PDMP interface to serve as a clinical aid. To this end, we identified first-time opioid users in California between 2016 and 2018. We then used the first 30 days of this cohort’s opioid prescription history to predict their transition to long-term (>90 day) opioid use. A secondary objective was to determine whether models including PDMP-derived dose trajectory measures would result in improved risk predictions versus those without.
Methods
Study reporting follows the transparent reporting of a multivariable prediction model for individual prognosis or diagnosis (TRIPOD) guidelines for reporting multivariable prediction models (13). The study was approved by the University of California, Davis Institutional Review Board and the California Committee for the Protection of Human Subjects. The National Institute on Drug Abuse of the National Institutes of Health supported this study but had no role in its design, conduct, or reporting.
Data Source
De-identified, patient-level prescription data from 2014-2019 for all patients in California aged ≥12 were obtained from California’s PDMP. Data included details of all outpatient Schedule II-IV controlled substance prescriptions dispensed in the state. Prescription records for opioid analgesics (Supplemental Digital Content 1) and other non-opioid controlled substances utilized for this analysis were identified by linking national drug codes in the PDMP against a widely available prescription drug compendium (14). NDC codes not identified by the compendium were manually reviewed and classified by a clinical pharmacist. Encrypted patient, prescriber, and pharmacy identifiers were included to allow tracking of these individual entities over time. Incomplete records were excluded from analysis (0.98% of all records, none identifiable as prescription opioids).
Prescriptions for opioid-containing antitussive medications were excluded as patients receiving these medications represent a different clinical population than patients prescribed opioid analgesics. Compounded opioid formulations were excluded because these records typically reference bulk quantities making accurate dose calculations impracticable. Intravenous and intramuscular formulations were excluded as these are typically administered in an inpatient setting.
Participants
The study cohort comprised all opioid-naïve persons prescribed an index solid oral dosage (hereby referred to as pill) form opioid analgesic in California between 2016 and 2018 (Figure 1). Patients were considered opioid-naïve if they received no other opioid prescriptions in the previous two years (i.e., 730 days). Records from 2014-15 were used to ensure patients’ opioid-naïve status. This study adopted a more stringent definition of opioid-naïve than the 6- or 12-month definition used in prior studies (10–12), because we had sufficient years of data available to adopt this more stringent definition and because prior work shows that even remote opioid use is relevant when assessing patient’s risk of transition to long-term use (15). Patients who exclusively received non-pill opioids on the index day (3.2%) were excluded from analysis as they likely represented special cases (e.g., liquid opioids to a patient who cannot swallow pills) where predictions of long-term use would be of less clinical value. Non-pill form opioid analgesics, however, were still included in a patient’s opioid prescription episode if they filled a pill-form analgesic on their index day. Patients with prescriptions for buprenorphine typically used for the treatment of opioid use disorder, as an index prescription or any time in the 30 days following the index prescription date, and/or who received a daily dose of ≥500 morphine milligram equivalents (MME) on their index day were excluded; such patients are unlikely to be truly opioid-naïve.
Figure 1:

Participant Flow Chart through Study.
PDMP: Prescription drug monitoring program
a With complete patient records
b Defined as a patient receiving a new opioid analgesic prescription with no other opioid prescribed in the previous two years (730 days) and no opioid indicated for treatment of opioid use disorder prescribed in the index prescription or follow-up period
c Excluded patients may meet multiple exclusion criteria
d Some patients (n = 94,335) qualify as opioid-naïve in both 2016 and 2018 due to at least 730 days between their opioid use episodes and therefore appear in both the development and validation datasets
Outcome
Long-term use was defined as an opioid prescription episode that lasted longer than 90 days, contained at least three opioid prescriptions, and had no more than 60 days between the completion of one prescription and the initiation of the subsequent one. This definition, adapted from prior studies (16, 17), assumes that each patient consumes a consistent daily dose of medication, and is likely an underestimation of the true duration of treatment for new patients as they are often advised to consume opioids “as needed.” The 60-day gap allows for the discrepancy between medication availability and actual use by the patient. Long-term episodes eligible for this analysis were initiated between January 1st, 2016 and October 2nd, 2018. Each participant was followed for 91 days to determine their outcome status. Data from 2019 were utilized to avoid censoring of patients identified in late 2018.
Predictors
Two sets of independent variables based on patient data from the first 30 days post index prescription were considered for inclusion. Set 1 candidate predictors were selected based on clinical experience and prior research (6, 12, 15, 17–20). For each patient, we used their history of opioid prescription records to estimate 30 consecutive daily doses beginning with the date the index prescription was filled, and then used various trajectory statistics (e.g., critical points for polynomial-smoothed trajectories) as set 2 candidate predictors. The 30-day assessment period was chosen based on a prior study which identified this time period as clinically useful for predicting the transition to long-term use (15). A full list of candidate predictors can be found in Appendix 1 of Supplemental Digital Content 2.
Set 1 predictors formed the base model from which the final model was built, and their inclusion was based on prior work (15). Predictors included were patient age and sex, opioid-related variables (type of opioid in the index prescription, total unique pharmacies through day 30, total unique prescribers through day 30, total prescriptions per prescriber through day 30, pills per prescription through day 30, pill difference between day 30 and the index day, active liquid opioid formulations on day 30, active non-pill and non-liquid formulations on day 30), active benzodiazepine prescriptions on day 30, and active non-benzodiazepine and non-opioid controlled substance prescriptions on day 30. As this set of predictors formed the core of our final model, they were not subject to any selection procedures.
For predictors constructed from dose trajectories (Set 2), we utilized 30 days of prescription data (from day 1, the start of the index prescription, through day 30) to determine dosage trajectories for each patient. Two approaches were used to define the dose trajectories from which the set 2 candidate variables were derived, with one approach based on daily quantity (e.g. pill counts) and the other based on daily MME. Total person-day dose was calculated by aggregating all opioid pill prescriptions active for each patient on each given day within this time period. These 30 dose totals formed the basis for constructing dose trajectories for each patient. Details can be found in Appendix 2-A (Supplemental Digital Content 2).
Subsequent prescriptions are often filled early or late depending on individual patient needs. This may lead to brief prescription overlaps or gaps, and therefore to artificially high or low dose totals. To minimize the impact of these artificial fluctuations, we fit the 30 person-day raw dose totals to a cubic polynomial function (21). Summary measures of these polynomials were then derived and considered for model inclusion. Daily patient deviations from a sample average, or residuals, were similarly summarized and also considered as candidate predictors. Details on set 2 predictor derivation are available in Appendices 2-A, 2-B, and 2-C of Supplemental Digital Content 2.
Predictors based on dose trajectories (Set 2) included in the final model were day where dose curve maximum occurs, total area under the dose curve, and change in area under the dose curve between the first and second ten-day periods of follow up.
Statistical Analysis Methods
Our primary goal was predicting opioid-naïve patients’ risk of transition to long-term use. Prescription records from previously opioid-naïve patients from 2016-2017 (n=7,175,885) and 2018 (n=2,788,837) were used to develop and validate the model, respectively. We modeled the outcome using multiple logistic regression, a traditional modeling approach in clinical prediction that performs comparatively well versus alternative methods (22). Univariate and bivariate analyses were utilized to assess potential non-linearity. Using the set 1 variables as a core model (15), we added all remaining candidate trajectory variables (set 2) to create the full model. Set 2 variables were then systematically removed through a backward selection process. This variable selection process was utilized as there are no apparent clinical reasons, nor prior work in the literature, specifying why one candidate summary measure of these smoothed curves would be more valid than another. Due to the large sample size, all candidate variables had p<0.001. We therefore relied on the c-statistic, using the DeLong test (23), to assess candidate predictor inclusion. A full model with all candidates was compared pairwise to a smaller model with one set 2 candidate removed. If the c-statistic in the smaller model was improved, then this model was retained. Remaining set 2 candidates were evaluated similarly. Additionally, the variance inflation factor was used to identify multicollinearity among Set 2 candidates. When multicollinearity was observed, decisions about which variables to remove were based on model fit (c-statistic). Model calibration was then assessed using the validation cohort. Miscalibration was improved by adding quadratic terms, squared terms and 2-way interactions for the following continuous predictors: patient age, total prescriptions per prescriber, pills per prescription, dose difference between day 30 and day 1, day of dose curve maximum, total area under the dose curve, and change in area under the dose curve between the first and second ten-day periods following index prescription. Inclusion of these non-linear terms greatly improved model fit and calibration. A flow chart of the model-building process is detailed in Appendix 3 of Supplemental Digital Content 2.
Sensitivity analysis was performed to compare models with different approaches for deriving dose trajectory variables, based on either quantity or MME. Quantity-based models showed slightly better fit and were therefore used for the primary analysis (Appendix 4, Supplemental Digital Content 2).
Prediction performance was evaluated using measurements of discrimination (i.e., the c-statistic, as described above) and calibration (calibration curves and calibration slope/intercept) (24). Models were re-calibrated by updating the intercept (25). Calibration curves were generated by plotting deciles of risk of the predicted versus observed probabilities of the outcome in the validation data. Decision curve analysis was used to assess clinical utility in the validation sample. Decision curve analysis is a method of determining the clinical value of a prediction model by comparing the ‘net benefit’ of an intervention based on a prediction tool versus two default strategies: intervention for all patients or intervention for none. These comparisons are made over a range of possible probability (or decision) thresholds for which a decision on whether intervention is necessary can be made by the clinician (26). In this context, intervention would refer to action taken by the prescriber to prevent the transition of their patient to long-term opioid use. In addition, we compared the net benefit of the final full model with dose trajectory, set 2, predictors to a core model with only set 1 predictors (Appendix 5, Supplemental Digital Content 2 for further details). Sensitivity, specificity, positive (PPV) and negative predictive values (NPV), and likelihood ratio positive and negative were reported for a range of decision thresholds. All analyses were performed using SAS 9.4.
Results
Patient Characteristics
From 2016-2018, there were 9,870,387 previously opioid-naïve California residents who met our cohort definition (Figure 1); of which 491,747 (4.9%) transitioned to long-term use (361,906 [5.0%] and 129,841 [4.7%] in the development and validation cohorts, respectively). For all study years, patients who transitioned to long-term use were older (median [IQR], 58 [46 to 60] vs 46 [31 to 62]), more likely to be prescribed tramadol (25.6% vs 15.2%) and less likely to be prescribed hydrocodone (45.9% vs 55.7%) or codeine (6.8% vs 16.8%) on their index day. They were more likely to have two or more prescribers (23.6% vs 8.0%) and pharmacies (11.8% vs 3.9%), received more pills per prescription (median [IQR]: 60.0 [30.0 to 90.0] vs 20.0 [16.0 to 30.0]), and were more likely to have active prescriptions for long-acting opioids (7.5% v 0.4%), benzodiazepines (13.8% vs 2.7%), and other controlled substances (9.2% vs 2.4%) on day 30. Their day of maximum dose occurred later (median [IQR], 17.1 [0.0 to 29.0] vs 0.0 [0.0 to 0.0]), they did not have the same decrease in dosage from the index day to the last day of follow-up (median [IQR], 0 [−28 to 20] vs −20 [−30 to −15]), they had a greater area under their smoothed dosage curve (median [IQR], 75.4 [47.2 to 116.0] vs 21.4 [15.4 to 35.2]), and had smaller decreases in area under the curve in the second versus the first 10-day period (median [IQR], −2.7 [−19.5 to 0.0] vs −20.2 [−28.0 to −13.4]) than patients who did not transition to long-term use. Characteristics were similar across development and validation cohorts (Table 1).
Table 1:
Characteristics of Previously Opioid-naïve Patients in California, 2016-2018.
| Variable | Development Cohorta (n = 7,175,885) median (IQR) or n (%) |
Validation Cohortb (n=2,788,837) median (IQR) or n (%) |
||
|---|---|---|---|---|
| No long-term usec (n = 6,813,979) | Long-term usec (n = 361,906) | No long-term usec (n = 2,658,996) | Long-term usec (n = 129,841) | |
| Patient Characteristics | ||||
| Male Sex | 2,952,947 (43.3%) | 156,887 (43.4%) | 1,157,154 (43.5%) | 46,484 (43.5%) |
| Unknown Sex | 4896 (0.1%) | 173 (0.1%) | 2785 (0.1%) | 90 (0.1%) |
| Patient Age | 46 (31, 62) | 57 (46, 68) | 48 (32, 63) | 59 (48, 70) |
| Opioid in Index Prescription | ||||
| Hydrocodone | 3,928,498 (57.7%) | 169,199 (46.8%) | 1,351,757 (50.8%) | 56,501 (43.5%) |
| Oxycodone | 644 217 (9.5%) | 44,238 (12.2%) | 299,916 (11.3%) | 17,139 (13.2%) |
| Tramadol | 984,761 (14.5%) | 90,742 (25.1%) | 458,574 (17.3%) | 35,151 (27.1%) |
| Codeine | 1,108,521 (16.3%) | 24,491 (6.8%) | 483,000 (18.2%) | 8857 (6.8%) |
| Otherd | 147,982 (2.2%) | 33,236 (9.2%) | 65,749 (2.5%) | 12,193 (9.4%) |
| Prescription Characteristics During 30-Day Post Index Period e | ||||
| Two or more Prescribers | 555,890 (8.2%) | 87,184 (24.1%) | 203,752 (7.7%) | 28,725 (22.1%) |
| Two or more Pharmacies | 267,965 (3.9%) | 44,016 (12.2%) | 98,947 (3.7%) | 14,004 (10.8%) |
| Mean Pills per Prescription | 24.0 (17.5, 30.0) | 60.0 (30.0, 90.0) | 20.0 (15.0, 30.0) | 60.0 (30.0, 90.0) |
| Mean Prescriptions per Prescriber | 1 (1, 1) | 1 (1, 2) | 1 (1, 1) | 1 (1, 2) |
| Change in Total Quantity on Day 30 vs. Day 1 | −20 (−30, −15) | 0 (−30, 20) | −20 (−30, −12) | 0 (−21, 16) |
| Prescriptions Active on Day 30 | ||||
| Long-acting Opioid | 28,492 (0.4%) | 26,769 (7.4%) | 10,578 (0.4%) | 10,101 (7.8%) |
| Liquid Opioid | 4727 (0.1%) | 979 (0.3%) | 2206 (0.1%) | 475 (0.4%) |
| Non-liquid Non-Pill Opioid | 4316 (0.1%) | 4557 (1.3%) | 1471 (0.1%) | 1287 (1.0%) |
| Benzodiazepine | 191,266 (2.8%) | 51,835 (14.3%) | 64,803 (2.4%) | 15,908 (12.3%) |
| Non-Opioid non-Benzodiazepine Controlled Substance | 165,965 (2.4%) | 34,368 (9.5%) | 59,379 (2.2%) | 10,859 (8.4%) |
| Dose Trajectory Characteristics e,f | ||||
| Total AUdC | 22.7 (16.8, 35.7) | 76.7 (27.1, 116.0) | 18.1 (13.0, 29.0) | 71.5 (44.4, 114.1) |
| Change in AUdC from Days 1-10 to Days 11-20 | −21.0 (−28.4, −14.0) | −2.8 (−31.4, 0.0) | −20.2 (−26.7, −13.4) | −2.4 (−17.4, 0.0) |
| Day of Maximum Dose | 0.0 (0.0, 0.0) | 16.1 (0.0, 29.0) | 0.0 (0.0, 0.0) | 19.5 (0.0, 29.0) |
AUdC: Area under the smoothed dose curve
All previously opioid-naïve patients that received their index prescription in 2016 and 2017
All previously opioid-naïve patients that received their index prescription in 2018
Defined as an episode of opioid use lasting >90 days after the initial prescription, including at least 3 opioid prescriptions, with no more than a 60-day gap between prescriptions
Includes patients with opioid types not specified in other categories and/or those patients who filled more than one type of opioid on the index day
Only opioid prescriptions for pill formulations (e.g., capsules, tablets, pills) were used to calculate these variables
Variables derived from cubic polynomial curves fit to raw patient daily quantity totals. Curves were fit to each individual patient for their daily dosage (quantity) from the first day of their index prescription through day 30.
Model Results
The prediction model showed excellent discrimination (c-statistic = 0.904 and 0.913 in the development and validation cohorts, respectively) and was well calibrated once model intercepts were adjusted (calibration intercept: −0.006; 95% CI, −0.016 to 0.004; calibration slope: 1.049; 95% CI, 1.045 to 1.053). A calibration plot, shown in Figure 2, compares the mean observed outcome (transition of opioid-naïve patients to long-term opioid use), by deciles of predicted probability. Final model adjusted odds ratios are reported in Appendix 6 of Supplemental Digital Content 2.
Figure 2:

Calibration Curve for a Model Predicting the Transition of Opioid-naïve Patients to Long-term Use among California Residents, 2016-2018.
The plot shows mean observed outcome (transition of previously opioid-naïve patients to long-term opioid use), by deciles of predicted probability (each circle represents a decile). Predicted probabilities are from application of the prediction model, developed on the 2016-2017 cohort, to the validation (2018) cohort. The grey line reflects perfect agreement between observed and predicted probabilities. Error bars represent 95% confidence intervals.
Table 2 summarizes model performance at various probability thresholds. At the optimal threshold, identified by the Youden index, sensitivity, specificity, PPV, NPV, and positive and negative likelihood ratios were 84.4%, 84.8%, 21.3%, 99.1%, 5.49, and 0.18 respectively. At the same optimal threshold, inclusion of dose trajectory predictors, expressed as model benefit in Table 2, yielded 2.11 more true positives identified per 1000 patients assessed compared to the alternative model without dose trajectory variables. Decision curve analysis revealed a greater net benefit, for decision thresholds from <1% to up to 74% risk, for the validated prediction model over the base model using only set 1 predictors (no dose trajectory predictors) and the default strategies of predicting all patients either would or would not transition to long-term opioid use (Figure 3).
Table 2:
Prediction Performance for Various Thresholds of Predicting Long-term Opioid Use.
| Decision Threshold (%)a | Predicted Long-term Use (%)b | Sensitivity (%) | Specificity (%) | PPV (%) | NPV (%) | LR+ | LR− | Model Benefitc |
|---|---|---|---|---|---|---|---|---|
| 0.55 | 75.1 | 99.0 | 26.0 | 6.1 | 99.8 | 1.34 | 0.04 | 0.91 |
| 1.26 | 43.1 | 95.0 | 59.4 | 10.3 | 99.6 | 2.34 | 0.08 | 4.28 |
| 2.57 | 26.2 | 90.0 | 76.9 | 15.6 | 99.4 | 3.90 | 0.13 | 2.99 |
| 3.12 | 23.2 | 88.3 | 80.0 | 17.7 | 99.3 | 4.42 | 0.15 | 2.30 |
| 4.59 | 19.0 | 85.0 | 84.2 | 20.8 | 99.1 | 5.38 | 0.18 | 2.08 |
| 4.89d | 18.6 | 84.4 | 84.8 | 21.3 | 99.1 | 5.49 | 0.18 | 2.11 |
| 4.99 | 18.2 | 84.2 | 85.0 | 21.5 | 99.1 | 5.61 | 0.19 | 2.10 |
| 7.29 | 15.1 | 80.0 | 88.0 | 24.6 | 98.9 | 6.67 | 0.23 | 2.58 |
| 9.81 | 13.1 | 76.3 | 90.0 | 27.2 | 98.7 | 7.63 | 0.26 | 3.20 |
| 21.52 | 7.6 | 59.9 | 95.0 | 36.9 | 98.0 | 11.98 | 0.42 | 3.08 |
| 40.74 | 2.2 | 27.0 | 99.0 | 56.9 | 96.5 | 27.00 | 0.74 | 1.99 |
PPV: Positive predictive value, NPV: Negative predictive value, LR+: Positive likelihood ratio, LR−: Negative likelihood ratio
Predicted probability multiplied by 100, at which previously opioid-naïve individuals are predicted to become long-term opioid users or not, defined as continuous use for ≥90 days with ≥3 opioid prescriptions and no more than 60-day gaps between the run out date of one prescription and the start date of the next prescription
Proportion of sample predicted to transition to long-term opioid use based on the specified threshold
Number of true positives gained per 1000 patients assessed. Calculated through the difference in net benefit between the full model with dose trajectory (set 2) predictors, indicated by curve (A) in Figure 3, and the base model without dose trajectory predictors, indicated by curve (B) in Figure 3.
Optimal threshold calculated by maximizing Youden’s J Index (= Sensitivity + Specificity − 1)
Figure 3:
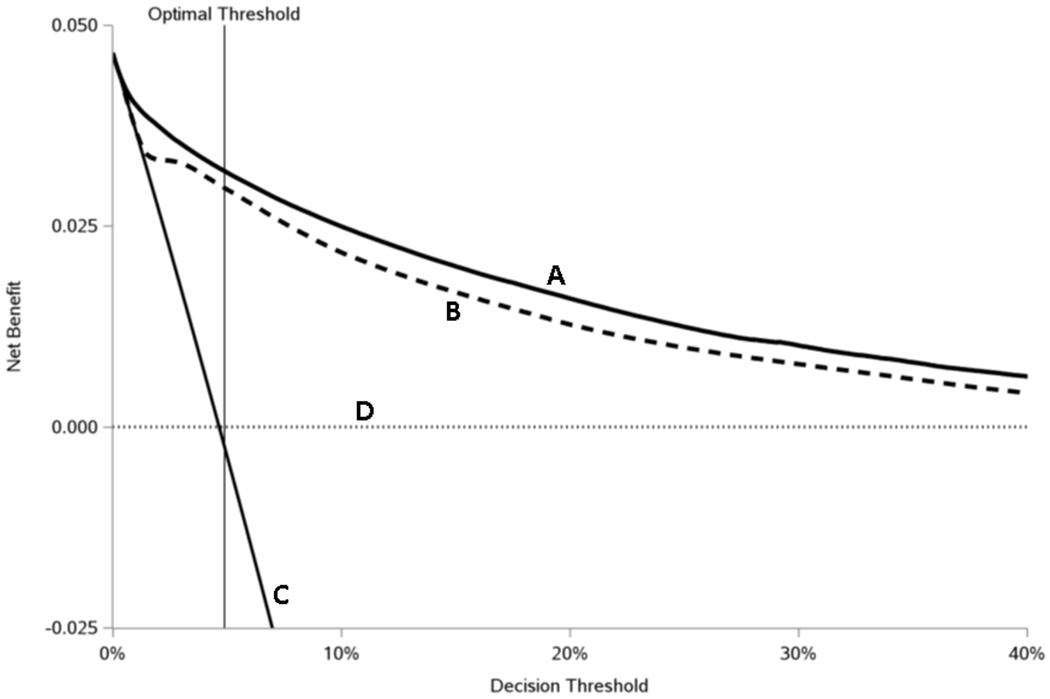
Decision curve analysis comparing clinical utility, as measured by net benefit, for various prescribing strategies by decision threshold
The plot shows decision curve analysis comparing the net benefit for four different prediction strategies: the thick solid line represents the validated risk prediction (full) model (A), the thick dashed line a prediction model without the dose trajectory (set 2) variables (B), the thin solid line when transition to long-term use is predicted for all patients (C), and the thin dotted line when transition to long-term use is predicted for no patients (D). The optimal threshold (4.89%) was calculated by maximizing the Youden’s J statistic (= Sensitivity + Specificity − 1). Appendix 5 (Supplementary Digital Content 2) contains details on how net benefit is calculated.
Discussion
Using PDMP data, we developed and validated a multiple logistic regression model to predict the risk that previously opioid-naïve California residents would transition to long-term opioid use. The model had high discrimination, was well calibrated, and demonstrated clinical utility. Inclusion of dose trajectory measures improved model performance and clinical utility. The full model provided a net benefit over nearly the entire spectrum of risk (from the 4th to >99th percentiles). The model demonstrated high NPV and low PPV due largely to the low prevalence (4.9%) of the outcome.
This model shows promise for future implementation into California’s PDMP interface. It provides a basis for the development and implementation of future PDMP-based prediction tools. Prescribers in many states, California included (27), are required to check PDMPs when writing new opioid prescriptions. Therefore, prescribers considering continued opioid therapy for individual patients could utilize such a tool as a clinical decision aid. Some PDMP interfaces already include metrics associated with patient overdose, such as patients receiving opioids from multiple prescribers and/or pharmacies (28). Indeed, various experts have already stressed the need for PDMPs to utilize their rich prescription data to provide more sophisticated clinical warnings that inform prescribing decisions (29). This model could become a crucial tool for prescribers concerned about their patients developing long-term opioid use, and these encouraging results suggest development of a prediction tool that could be implemented into California’s PDMP as a logical next step.
The prediction model utilized in this study was novel in two important ways. First, it used data exclusively from a state PDMP and is, to our knowledge, the first such model to do so. This is different from past studies which utilized data from electronic health records (30–32), which are limited geographically and to patients with similar characteristics (e.g., similar forms of health coverage), or recruited participants from individual health clinics (33–35) and were further limited by small sample sizes. The use of PDMP data also allowed for the identification of a patient’s opioid-naïve status without having to consider changes in insurance enrollment or similar administrative limitations. Second, it uses a novel set of variables derived from dose trajectories to predict the transition to long-term use. Though dosage has well-established links to long-term use, dose as a predictor tends to either focus on the index prescription (5–9) or to be summarized in simple measures such as cumulative totals (12, 19) or averages over a follow-up period (30). Inclusion of trajectory measures led to more accurate predictions of patient risk with improved model discrimination, calibration, and increased net benefit. These results suggest that dose trajectory measures warrant consideration as candidate predictors in future studies predicting risk for opioid-related harms.
Given the low PPV and high NPV, and therefore high false positive and low false negative rates, tools based on this model would be best utilized to confidently identify patients at low risk for long-term opioid use. Concerns over false positives are warranted and represent a limitation of the study. For example, prescribers should avoid using drastic measures that may harm their patients (e.g., rapidly tapering patients’ opioid dose) based only on the risk of incident long-term use identified by this model. On the other hand, patients classified as high risk might warrant interventions with minimal risk of harm such as dissemination of educational materials, increased clinical follow-up, and discussion of alternative pain management strategies.
In addition to the false positive rate, the study is subject to other limitations. First, the data are exclusively from one state, California. Though it is a populous and diverse state, generalizability to non-California populations requires further validation on PDMP data from other states. Second, PDMP data only includes prescription records from outpatient pharmacies. Third, the data may misclassify patients who moved in or out of California. Patients may have been prescribed opioids previously from out of state and erroneously appear as opioid-naïve in this analysis. Similarly, patients who left the state and continued to receive opioids from non-California sources would be missed. Finally, PDMP data contain no information on pain etiology, medical history, or any other relevant clinical information. This prediction model is meant to aid clinicians in their prescribing decisions and not make these important decisions for them. Clinicians will have a complete record of each patient’s medical history and present medical status; information that would influence any predictions about long-term opioid use and inform whether long-term use is clinically appropriate for their patients (e.g., patients in palliative care).Therefore, prescribers should understand that PDMP-based prognostic tools are not meant to supersede prescribers’ best judgment, but simply act as another tool at their disposal.
In summary, we demonstrated that a validated multiple logistic regression model utilizing only PDMP data can predict, with high degrees of discrimination and good calibration, the transition of previously opioid-naïve patients to long-term opioid use. This model could prove a critical aid in the identification of patients with high risk for long-term opioid use, and therefore at increased risk for opioid-related harms associated with chronic opioid use.
Supplementary Material
Acknowledgments:
The study team would like to acknowledge Eryn Murphy for her contribution to this work.
Disclosures:
The authors have no conflicts of interest to disclose. This work was supported by the National Institute on Drug Abuse of the National Institutes of Health (R01DA044282).
References
- 1.Murthy VH. Ending the Opioid Epidemic - A Call to Action. N Engl J Med 2016;375:2413–2415 [DOI] [PubMed] [Google Scholar]
- 2.Dowell D, Haegerich TM, Chou R. CDC Guideline for Prescribing Opioids for Chronic Pain--United States, 2016. JAMA 2016;315:1624–1645 [DOI] [PMC free article] [PubMed] [Google Scholar]
- 3.Centers for Medicare & Medicaid Services. Medicare Program; Contract Year 2019 Policy and Technical Changes to the Medicare Advantage, Medicare Cost Plan, Medicare Fee-for-Service, the Medicare Prescription Drug Benefit Programs, and the PACE Program. In: Department of Health and Human Services, ed.2018:16440–16757 [PubMed] [Google Scholar]
- 4.Salter J Express Scripts to limit opioids; doctors concerned. 2017. Available at: https://apnews.com/article/c7d6e9acaeeb4260a571232fe7a4492d. Accessed November 2020,
- 5.Delgado MK, Huang Y, Meisel Z, et al. National Variation in Opioid Prescribing and Risk of Prolonged Use for Opioid-Naive Patients Treated in the Emergency Department for Ankle Sprains. Ann Emerg Med 2018;72:389–400 e381 [DOI] [PMC free article] [PubMed] [Google Scholar]
- 6.Meisel ZF, Lupulescu-Mann N, Charlesworth CJ, et al. Conversion to Persistent or High-Risk Opioid Use After a New Prescription From the Emergency Department: Evidence From Washington Medicaid Beneficiaries. Ann Emerg Med 2019;74:611–621 [DOI] [PMC free article] [PubMed] [Google Scholar]
- 7.Thiels CA, Habermann EB, Hooten WM, et al. Chronic use of tramadol after acute pain episode: cohort study. BMJ 2019;365:l1849. [DOI] [PMC free article] [PubMed] [Google Scholar]
- 8.Basilico M, Bhashyam AR, Harris MB, et al. Prescription Opioid Type and the Likelihood of Prolonged Opioid Use After Orthopaedic Surgery. J Am Acad Orthop Surg 2019;27:e423–e429 [DOI] [PMC free article] [PubMed] [Google Scholar]
- 9.Bateman BT, Franklin JM, Bykov K, et al. Persistent opioid use following cesarean delivery: patterns and predictors among opioid-naive women. Am J Obstet Gynecol 2016;215:353 e351–353 e318 [DOI] [PMC free article] [PubMed] [Google Scholar]
- 10.Jeffery MM, Hooten WM, Hess EP, et al. Opioid Prescribing for Opioid-Naive Patients in Emergency Departments and Other Settings: Characteristics of Prescriptions and Association With Long-Term Use. Ann Emerg Med 2018;71:326–336 e319 [DOI] [PMC free article] [PubMed] [Google Scholar]
- 11.Donohue JM, Kennedy JN, Seymour CW, et al. Patterns of Opioid Administration Among Opioid-Naive Inpatients and Associations With Postdischarge Opioid Use: A Cohort Study. Ann Intern Med 2019;171:81–90 [DOI] [PMC free article] [PubMed] [Google Scholar]
- 12.Deyo RA, Hallvik SE, Hildebran C, et al. Association Between Initial Opioid Prescribing Patterns and Subsequent Long-Term Use Among Opioid-Naive Patients: A Statewide Retrospective Cohort Study. J Gen Intern Med 2017;32:21–27 [DOI] [PMC free article] [PubMed] [Google Scholar]
- 13.Moons KG, Altman DG, Reitsma JB, et al. Transparent Reporting of a multivariable prediction model for Individual Prognosis or Diagnosis (TRIPOD): explanation and elaboration. Ann Intern Med 2015;162:W1–73 [DOI] [PubMed] [Google Scholar]
- 14.IBM. Micromedex RED BOOK. Available at: https://www.ibm.com/products/micromedex-red-book
- 15.Henry SG, Stewart SL, Murphy E, et al. Using Prescription Drug Monitoring Program Data to Assess Likelihood of Incident Long-Term Opioid Use: a Statewide Cohort Study. J Gen Intern Med 2021 [DOI] [PMC free article] [PubMed] [Google Scholar]
- 16.Larochelle MR, Liebschutz JM, Zhang F, et al. Opioid Prescribing After Nonfatal Overdose and Association With Repeated Overdose: A Cohort Study. Ann Intern Med 2016;164:1–9 [DOI] [PubMed] [Google Scholar]
- 17.Von Korff M, Saunders K, Thomas Ray G, et al. De facto long-term opioid therapy for noncancer pain. Clin J Pain 2008;24:521–527 [DOI] [PMC free article] [PubMed] [Google Scholar]
- 18.Barnett ML, Zhao X, Fine MJ, et al. Emergency Physician Opioid Prescribing and Risk of Long-term Use in the Veterans Health Administration: an Observational Analysis. J Gen Intern Med 2019;34:1522–1529 [DOI] [PMC free article] [PubMed] [Google Scholar]
- 19.Shah A, Hayes CJ, Martin BC. Characteristics of Initial Prescription Episodes and Likelihood of Long-Term Opioid Use - United States, 2006-2015. MMWR Morb Mortal Wkly Rep 2017;66:265–269 [DOI] [PMC free article] [PubMed] [Google Scholar]
- 20.Young JC, Dasgupta N, Chidgey BA, et al. Postsurgical Opioid Prescriptions and Risk of Long-term Use: An Observational Cohort Study Across the United States. Ann Surg 2019 [DOI] [PMC free article] [PubMed] [Google Scholar]
- 21.Luers JK, Wenning RH. Polynomial Smoothing—Linear VS Cubic. Technometrics 1971;13:589–600 [Google Scholar]
- 22.Christodoulou E, Ma J, Collins GS, et al. A systematic review shows no performance benefit of machine learning over logistic regression for clinical prediction models. J Clin Epidemiol 2019;110:12–22 [DOI] [PubMed] [Google Scholar]
- 23.DeLong ER, DeLong DM, Clarke-Pearson DL. Comparing the areas under two or more correlated receiver operating characteristic curves: a nonparametric approach. Biometrics 1988;44:837–845 [PubMed] [Google Scholar]
- 24.Steyerberg EW, Vergouwe Y. Towards better clinical prediction models: seven steps for development and an ABCD for validation. Eur Heart J 2014;35:1925–1931 [DOI] [PMC free article] [PubMed] [Google Scholar]
- 25.Steyerberg EW, Borsboom GJ, van Houwelingen HC, et al. Validation and updating of predictive logistic regression models: a study on sample size and shrinkage. Stat Med 2004;23:2567–2586 [DOI] [PubMed] [Google Scholar]
- 26.Vickers AJ, Elkin EB. Decision curve analysis: a novel method for evaluating prediction models. Med Decis Making 2006;26:565–574 [DOI] [PMC free article] [PubMed] [Google Scholar]
- 27.Uniform Controlled Substances Act. California. H.S.C. 11165.4. [Google Scholar]
- 28.Prescription Drug Monitoring Program Training and Technical Assistance Program. Prescription Drug Monitoring Program: Statutes and Regulations Table. Bureau of Justice Assistance; 2020 [Google Scholar]
- 29.Fiellin LE, Fiellin DA. Toward Better Stewardship: Gaining Control Over Controlled Substances. Ann Intern Med 2018;168:883–884 [DOI] [PubMed] [Google Scholar]
- 30.Calcaterra SL, Scarbro S, Hull ML, et al. Prediction of Future Chronic Opioid Use Among Hospitalized Patients. J Gen Intern Med 2018;33:898–905 [DOI] [PMC free article] [PubMed] [Google Scholar]
- 31.Karhade AV, Cha TD, Fogel HA, et al. Predicting prolonged opioid prescriptions in opioid-naive lumbar spine surgery patients. Spine J 2020;20:888–895 [DOI] [PubMed] [Google Scholar]
- 32.Karhade AV, Ogink PT, Thio Q, et al. Machine learning for prediction of sustained opioid prescription after anterior cervical discectomy and fusion. Spine J 2019;19:976–983 [DOI] [PubMed] [Google Scholar]
- 33.Butler SF, Budman SH, Fernandez KC, et al. Development and validation of the Current Opioid Misuse Measure. Pain 2007;130:144–156 [DOI] [PMC free article] [PubMed] [Google Scholar]
- 34.Butler SF, Fernandez K, Benoit C, et al. Validation of the revised Screener and Opioid Assessment for Patients with Pain (SOAPP-R). J Pain 2008;9:360–372 [DOI] [PMC free article] [PubMed] [Google Scholar]
- 35.Webster LR, Webster RM. Predicting aberrant behaviors in opioid-treated patients: preliminary validation of the Opioid Risk Tool. Pain Med 2005;6:432–442 [DOI] [PubMed] [Google Scholar]
Associated Data
This section collects any data citations, data availability statements, or supplementary materials included in this article.