
Figure 3.
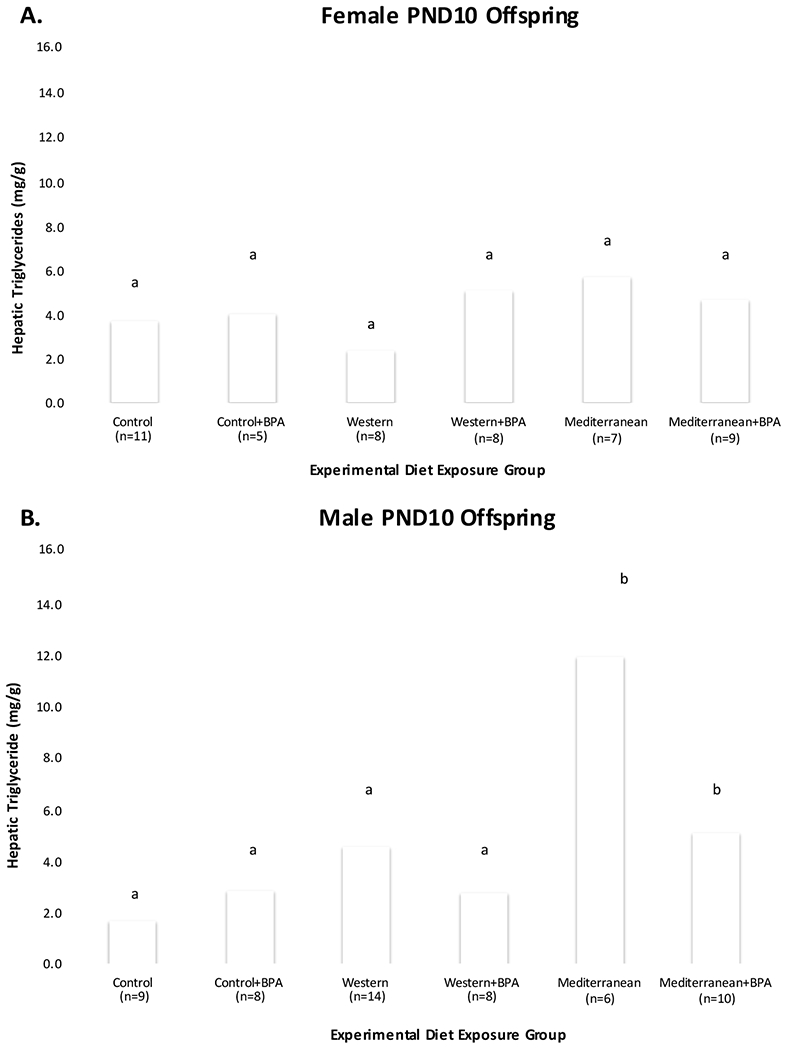
PND10 Offspring Hepatic Triglyceride Levels by Exposure Group
Average hepatic triglycerides (TGs) in PND10 offspring (n = 103), by experimental exposure group: Panel A = female PND10 offspring (n = 48), Panel B = male PND10 offspring (n = 55). aDenotes the average TGs of Control PND10 offspring; groups that do not differ significantly from Control are also marked with ‘a’. b Denotes exposure groups with average TGs that differ significantly (p < 0.05) from Control.