

Abstract
Antigen release resulting from the death of tumour cells induced by chemotherapies and targeted therapies can augment the antitumor responses induced by immune checkpoint blockade (ICB). However, tumours responding to ICB therapies often become resistant to them. Here, we show that the specific targeting of tumour cells promotes the growth of tumour-cell variants that are resistant to ICB, and that the acquired resistance can be overcome via the concurrent depletion of tumour cells and of major types of immunosuppressive cells via a monoclonal antibody binding the enzyme CD73 (which we identified is highly expressed on tumour cells and on regulatory T cells, myeloid-derived suppressor cells and tumour-associated macrophages, yet not on cytolytic T lymphocytes, natural killer cells and dendritic cells). In mice with murine tumours, the systemic administration of anti-PD1 antibodies and anti-CD73 antibodies conjugated to a near-infrared dye subverted near-infrared-irradiated tumours from acquiring resistance to ICB and resulted in the eradication of advanced tumours. The elimination of immunosuppressive cells may overcome acquired resistance to ICB across a range of tumour types and combination therapies.
The reinvigoration of tumor-specific T cells by immune checkpoint blockade (ICB) has recently demonstrated remarkable clinical efficacy across tumor types1,2. Unfortunately, the majority of patients do not respond to ICB and only a small percentage of them achieve durable benefits. For example, PD-1 blockade showed an overall response rate (ORR) of only 4.7% (complete response, CR: 1/170; partial response, PR: 7/170) in 170 patients with metastatic triple-negative breast cancer (TNBC)3, whereas PD-L1 and CTLA-4 blockade appears minimally active4. Similarly, to date, no response (0%) has been observed in clinical trials among patients with pancreatic ductal adenocarcinoma (PDAC) using anti-PD15, anti-PD-L16–7, or anti-CTLA-48 ICB. Furthermore, with higher activity and broader use of ICB immunotherapies, the denominator of patients with a tumor response has increased and the chances of finding patients who responded for a period of time and then progressed, termed acquired resistance, increases9. One explanation for the low response rate is that the effects of ICB are negated by the presence of other immune tolerance mechanisms that keep the immune system in check in the tumor microenvironment (TME)10. Growing evidence suggests that tumor-infiltrating myeloid-derived suppressor cells (MDSCs), tumor-associated macrophages (TAM), and regulatory T cells (Tregs) cells contribute to immune tolerance and reduced CD8+ cytolytic T lymphocyte (CTL) induction, infiltration, and cytolytic function. Further, this immunosuppressive phenotype is not abolished by ICB when tumors fail to respond or acquire resistance to ICB therapy11–16. However, the contribution of immunosuppressive cells in TME to acquired resistance of ICB immunotherapy is still elusive.
Abnormal differentiation and function of myeloid cells is a hallmark of cancer, which blocks CTL function and protects tumors from chemotherapy and immunotherapy17. Some strategies have been developed to prevent the accumulation of myeloid cells, or alternatively, inhibit myeloid cells’ immunosuppressive activity18. Because myeloid cells are a heterogeneous population, approaches to specifically target MDSCs and TAMs without affecting other myeloid cells (such as dendritic cells (DCs)), or subverting CTL responses, remain to be developed and are critical to surmount ICB resistance. In addition to myeloid cells, the function of tumor-infiltrating CTLs may be also suppressed by nearby Tregs19. Controlling tumor-infiltrating Treg cells has been considered another essential step for successful immunotherapy20. Since most Treg cell markers are presented on activated type 1 helper (Th1) and CTLs (e.g. CD25)20, approaches are needed to selectively deplete or inhibit tumor-infiltrating Treg cells without dampening CTLs – but these approaches remain elusive. Because systematic depletion of immunosuppressive cells may result in severe autoimmunity21, ablation of all major types of immunosuppressive cells (e.g. MDSC, TAM, and Treg cells) in tumor may subvert resistance to ICB and bolster an unprecedented immunotherapeutic efficacy, which represents an unmet need for immunotherapy to modify the tumor immune landscape to overcome resistance mechanisms. Currently, approaches that specifically target a single type of immunosuppressive cell in TME remain to be achieved.
In this study, we demonstrated that targeting tumor cell-expressed antigen (e.g. B7H3) selected the outgrowth of resistant variant tumor cells and promoted resistant variant tumor outgrowth, despite co-administration of ICB. To address this acquired resistance, we identified CD73 as a common marker that is highly expressed by most types of immunosuppressive cells [e.g. Tregs, M2-like tumor-associated macrophages (TAM.M2), and myeloid-derived suppressor cells (MDSCs)] as well as by tumor cells, but not or very limited by anti-tumor immune cells, e.g. effector CD4+ T cells or CD8+ T cells. We thus hypothesized that the killing of CD73+ cells in tumor may simultaneously deplete tumor cells and major types of immunosuppressive cells in TME, which may subsequently break the immune tolerance in tumor and overcomes the acquired resistance to ICB. To achieve this goal, we take advantage of an existing approach for near-infrared (NIR) activated photo-depletion of the target cells22–24 and create a IR-700 dye-conjugated anti-CD73 monoclonal antibody (αCD73-Dye). αCD73-Dye conjugates are able to specifically bind to CD73+ cells, and induces highly selective, necrotic cell death of CD73+ cells, without damaging adjoining cells after near-infrared (NIR 690 nm) exposure. When administered intravenously in vivo, local NIR exposure eradicated advanced murine tumors (EMT6, 4T1.2, MMTV-PyMT spontaneous TNBCs, and Pan02 PDAC) and together with αPD-1 monoclonal antibody (mAb) treatment, was associated with ~3 months of tumor-free survival in mice with both local tumors (NIR exposure) and remote tumors (no NIR exposure; serving as metastatic tumors). Furthermore, eradication of CD73+ cells also sensitized human PDAC patient-derived organotypic tumor spheroids to αPD-1 mAb therapy. Therefore, this study revealed a mechanism underlying acquired resistance of ICB immunotherapy and suggested a strategy for overcoming acquired resistance by locally removing all major types of immunosuppressive cells.
Results
Relapse of resistant tumors is inevitable when merely targeting a tumor-expressed antigen.
To understand the mechanism of acquired resistance in ICB, we utilized Pan02B7H3 cells-bearing mice (overexpression of B7H3 on Pan02 PDAC cells, Fig. 1a and Supplementary Fig. 1a). To achieve the goal of tumor-killing of Pan02B7H3 cells, we adopted an existing approach of NIR-activated photo-depletion of the target cells by using antibody-IR700 conjugates23. αB7H3-Dye+NIR induced rapid cell necrosis in >98% of Pan02B7H3 tumor cells in vitro (Fig. 1b, c). Next, we inoculated Pan02B7H3 cells s.c. on the flank of mice. We found that the expression level of B7H3 on tumor-infiltrating immune cells was negative or very low (Supplementary Fig. 1b). Consistent with the low B7H3 expression level, αB7H3-Dye+NIR could not induce cell necrosis in these immune cells ex vivo (Supplementary Fig. 1c). When Pan02B7H3 cells were inoculated in mice, αPD-1 and αB7H3-Dye+αPD-1 treatments did not show any measurable antitumor activity. Moreover, treatments with αB7H3-Dye+NIR or αB7H3-Dye+NIR+αPD-1 induced an initial rapid regression of NIR-treated tumors; but all respondent tumors finally recurred in all treated mice and led to the death of all mice (Fig. 1d, e). The recurred progress was similar to the scenario of acquired resistance in the clinical setting, with a median survival time of 46.5 days for αB7H3-Dye+NIR and 48.5 days for αB7H3-Dye+NIR+αPD-1 treated mice (Fig. 1d, e). We also used this approach to target B7H3-overexpressed EMT6B7H3 murine triple-negative breast cancer (overexpression of B7H3 on EMT6 TNBC cells, Fig. 1f and Supplementary Fig. 1a) and αB7H3-Dye+NIR induced rapid cell necrosis in >95% of EMT6B7H3 tumor cells in vitro (Fig. 1g). In this tumor model, αPD-1, αB7H3-Dye+αPD-1, and αB7H3-Dye+NIR treatments induced a partial response initially in EMT6B7H3 tumor-bearing mice, but unfortunately, the development of acquired resistance eventually led to the tumor recurrence (Fig. 1h). Although αB7H3-Dye+NIR+αPD-1 treatment could further inhibit the growth of EMT6B7H3 tumors compared to αPD-1, αB7H3-Dye+αPD-1, and αB7H3-Dye+NIR treatments, but all respondent tumors finally recurred (Fig. 1h).
Fig. 1 |. Relapse of resistant tumors is inevitable when merely targeting tumor-expressed antigen.

(a) The surface expression of B7H3 on Pan02B7H3 cancer cells was assessed by FACS. (b) Pan02B7H3 cancer cells were treated with IgG, IgG-Dye+NIR, αB7H3-Dye, or αB7H3-Dye+NIR in vitro. Cell death was tested by Nexcelom ViaStain AO/PI staining Solution. Green represents live cells; red represents dead cells. Representative images are shown. (c) The percentage of PI+ cells was tested by FACS (n=3 biological replicates). (d) Diagram of the treatments. Pan02B7H3 tumor cells were s.c. injected on the left (2×10⁶ Pan02B7H3 cells) flanks of B6 mice, and treated on day 7 and day 11 with control IgG, αPD-1, αB7H3-Dye+αPD-1, αB7H3-Dye+NIR, or αB7H3-Dye+NIR+αPD-1 (Combo). NIR was performed on the left-side tumor only (other parts of the mice were shielded from light). (e) Tumor responses and survival curves are shown (total # of mice/group=10). (f) The surface expression of B7H3 on EMT6B7H3 cancer cells was assessed by FACS. (g) EMT6B7H3 cells were treated as indicated in vitro. The percentage of dead cells was determined by FACS after PI staining (n=3 biological replicates). (h) BALB/c mice bearing both orthotopic EMT6B7H3 tumor (5×10⁵ EMT6B7H3 tumor cells injection in the mammary gland) and lung metastasis tumors (1×10⁵ EMT6B7H3 tumor cells injection via tail vein) were treated on day 5 with control IgG, αPD-1, αB7H3-Dye+αPD-1, αB7H3-Dye+NIR, or αB7H3-Dye+NIR+αPD-1 (Combo). NIR irradiation was given on the orthotopic tumor only (other parts of the mice were shielded from light). Orthotopic tumor growth curves (n=5 mice/group) are shown. (i) Diagram of the treatments. Pan02B7H3 tumor cells were s.c. injected on the left (2×10⁶ Pan02B7H3 cells) and right (5×10⁵ Pan02B7H3 cells) flanks of B6 mice, and treated on day 7 and day 11 with αB7H3-Dye+NIR+αPD-1 on the left-side tumor only (right-side tumors were shielded from light; αB7H3-Dye injected i.v.). Mice were treated with αB7H3-Dye+NIR again for both left and right tumors on day 19 when left tumors recurred. (j) Tumor responses of left-side tumors are shown (n=5 mice/group). (k) Tumor responses of right-side tumors are shown (n=5 mice/group). (IgG-Dye represents IR-700 dye-conjugated IgG, αB7H3-Dye represents IR-700 dye-conjugated anti-B7H3 mAbs. Red arrow represents red-to-near-infrared (NIR) irradiation). Representative results from one of two repeated experiments are shown. Data are mean ± SD. ***P<0.001, αB7H3-Dye+NIR group compared with IgG, IgG-Dye+NIR, or αB7H3-Dye group, one-way ANOVA with Tukey’s correction (c and g). ***P<0.001, αB7H3-Dye+NIR or Combo group compared with IgG, αPD-1, or αB7H3-Dye+αPD-1 group, two-way ANOVA with Holm–Sidak test for multiple comparisons (e). ****P<0.0001, αB7H3-Dye+NIR or Combo group compared with IgG, αPD-1, or αB7H3-Dye+αPD-1 group, survival analysis was conducted by log-rank test with holm test for multiple comparisons (e). ****P<0.0001, IgG group compared with αPD-1, αB7H3-Dye+αPD-1, αB7H3-Dye+NIR, or Combo group, two-way ANOVA with Holm–Sidak test for multiple comparisons (h). *P=0.015, compared with day 19, two-way ANOVA with Holm–Sidak test for multiple comparisons (k).
We next inoculated two Pan02B7H3 tumors s.c. on the left and right flanks of mice, and performed the αB7H3-Dye+NIR+αPD-1 treatment (irradiation on the left-side tumor only; right-side tumors were shielded from light). We then tested the sensitivity of local NIR exposed (Left) tumors and the remote no NIR-treated (Right) tumors when the left tumor relapsed (on day 19) by retreatment with αB7H3-Dye+NIR irradiation (Fig. 1i). Local recurrent tumors (Left) but not remote tumors (Right) were resistant (Fig. 1j, k). We thus hypothesize that local recurrent tumors would be B7H3-loss variant tumors iteratively selected by αB7H3-Dye+NIR targeting B7H3, as often occurs in clinical cancer targeted therapy. To test our hypothesis, we harvested PBS-treated Pan02B7H3 tumor, Pan02 tumor, locally recurrent Pan02B7H3 tumor, and remote Pan02B7H3 tumor tissues on day 19. qPCR demonstrated that only locally relapsed Pan02B7H3 tumors showed largely downregulated B7h3 levels (Supplementary Fig. 1d). Similarly, recurred EMT6B7H3 tumors after αB7H3-Dye+NIR+αPD-1 treatment also display substantially reduced B7h3 levels (Supplementary Fig. 1e). Taken together, these results demonstrate that targeting cancer cells would select and promote the outgrowth of resistant variant tumor cells and it seems that the formation of acquired resistant tumors is inevitable, even though ICB was co-administered.
Identification of common marker(s) to target major types of immunosuppressive cells.
Because tumor contains a large number of infiltrated immunosuppressive cells which may dampen the efficacy of immunotherapy25, we hypothesize that additional targeting of immunosuppressive cells in TME would overcome the acquired resistance to ICB. To identify a common marker highly expressed on major types of immunosuppressive cells to specifically target immunosuppressive cells, we analyzed gene expression of Treg cells, MDSCs, and TAM.M2 cells compared to Th1 cells, DCs, and normal tissue macrophages, respectively, based on the published microarray data26–28. Clustering analysis indicated that Treg cells, MDSCs, and TAM.M2 cells have very different gene signatures compared to Th1 cells, DCs, and tissue macrophages, respectively (Fig. 2a, b, c). Overlap among upregulated genes (>2-fold upregulation) in Treg cells/Th1, MDSCs/DCs, and TAM.M2/tissue macrophages were further analyzed by Venn diagram. We identified 11 genes that were co-expressed in these immunosuppressive cells compared to non-immunosuppressive cells (Fig. 2d). The 11 genes were further ranked by integrating their fold-changes in the comparisons of “immunosuppressive to non-immunosuppressive cells” and the overall gene expression level change was evaluated by a rank-adjusted fold-change (see methods section for details). This analysis identified Nt5e gene (encodes CD73 protein) as the top candidate far exceeding 10 other genes (Fig. 2e); this finding is also in agreement with previous studies29,30. We next verified the expression of CD73 on the different types of immune cells in EMT6 TME by FACS, and confirmed that surface CD73 expression was high in multiple types of immunosuppressive cells (e.g. Treg cells, MDSCs, and TAM.M2 cells, Fig. 2f and Supplementary Fig. 2a), while such expression was negative or very low for DCs or effector immune cells (e.g. effector CD4+ T cells, CD8+ T cells, or NK cells) (Supplementary Fig. 2b). Thus, CD73 may provide us with an opportunity to selectively deplete all major types of immunosuppressive cells in TME to modify the tumor immune landscape.
Fig. 2 |. Targeting CD73 specifically kills cancer cells and all major types of immunosuppressive cells.

(a) Hierarchical clustering of gene expression of Treg cells and Th1 cells. (b) Hierarchical clustering of gene expression of MDSCs and DCs. (c) Hierarchical clustering of gene expression of TAM.M2 cells and tissue macrophages. (d) Venn diagrams displaying the number of upregulated genes of Treg cells, MDSCs, and TAM.M2 cells. (e) Rank-adjusted fold-change analysis for 11 commonly upregulated genes among Treg cells, MDSCs, and TAM.M2 cells. (f) Surface expression levels of CD73 on Treg cells, PMN.MDSC, MoMDSC, and TAM.M2 cells isolated from EMT6 tumors. (g) Surface expression levels of CD73 on 4T1.2, EMT6, and Pan02 cancer cells were assessed by FACS. (h) 4T1.2, EMT6, and Pan02 cancer cells were treated with IgG, IgG-Dye+NIR, αCD73-Dye, or αCD73-Dye+NIR in vitro. Cell death was tested by Nexcelom ViaStain AO/PI staining Solution. Green represents live cells; red represents dead cells. Representative images are shown. (i) Cell necrosis of tumor cells and Treg cells, PMN.MDSC, MoMDSC, and TAM.M2 cells isolated from EMT6 tumors. Cells were treated by IgG, IgG-Dye+NIR, αCD73-Dye, or αCD73-Dye+NIR in vitro. Shown is the heatmap illustrating the percentage of PI+ dead cells tested by FACS. Representative results from one of two repeated experiments are shown.
Because multiple types of cancer cells have been reported to express surface CD7331,32, we thus analyzed the expression of CD73 by murine cancer cell lines. Interestingly, CD73 is highly expressed on the surface of all murine 4T1.2 TNBC cells, ~75% of murine EMT6 TNBC cells, while such expression is negative for murine Pan02 PDAC cells (Fig. 2g and Supplementary Fig. 2c). To achieve the goal of local tumor killing of CD73+ cells, we created αCD73-Dye conjugates and performed αCD73-Dye-mediated NIR irradiation. αCD73-Dye+NIR induced rapid cell necrosis in >99% of 4T1.2 tumor cells (CD73+) and ~75% of EMT6 tumor cells but did not induce cell death of Pan02 tumor cells (CD73−) (Fig. 2h, i and Supplementary Fig. 2d). These results suggest that the rapid killing of tumor cells after NIR exposure depends on CD73 expression. We next explored the effects of αCD73-Dye+NIR on EMT6 tumor-isolated immune cells in vitro. In correlation with their surface expression of CD73, αCD73-Dye+NIR also rapidly killed immunosuppressive cells, including Treg cells, MDSCs, and TAM.M2, (Fig. 2i and Supplementary Fig. 2e), while leaving intact CTLs (effector CD4+ T cells and CD8+ T cells), NK cells or DCs (Supplementary Fig. 2e). These data suggest that CD73-Dye can eliminate tumor cells and the major types of immunosuppressive cells in the TME simultaneously, in a highly specific manner.
Based on the efficient killing capacity of αCD73-Dye+NIR in vitro, we performed a study in a 4T1.2 orthotopic TNBC model to test the antitumor function of αCD73-Dye+NIR in vivo. We firstly chose 4T1.2 as they express high amounts of CD73 on the cell surface. BALB/c mice bearing advanced 4T1.2 tumors (~7×6 mm) in mammary pad were i.v. injected with αCD73-Dye, and on the next day, tumors were exposed to 690nm NIR-light. All other parts of mice were covered with an aluminum film to avoid light exposure (Extended Data Fig. 1a). Treatments were performed once again for a group of mice four days later. Remarkably, NIR with αCD73-Dye exposure eradicated the advanced tumors, while IgG-Dye+NIR or αCD73-Dye (no NIR) did not display measurable antitumor activity (Extended Data Fig. 1b). In addition, we also explored the potential of αCD73-Dye on tumors formed by injection of Pan02 cells, which do not produce CD73. The Pan02 PDAC tumor model employs a transplantable form of murine PDAC refractory to many standard chemotherapeutic agents and ICB33,34. Pan02 tumor-bearing C57BL/6 mice were given one or two doses of αCD73-Dye-mediated NIR irradiation when tumors reached ~7×6 mm. Surprisingly, αCD73-Dye-mediated NIR irradiation also largely reduced the tumor growth of Pan02 tumors (Extended Data Fig. 1c); a result that may be arising from intratumor depletion of CD73+ immunosuppressive cells. Taken together, our results indicate that αCD73-Dye efficient killed CD73+ immunosuppressive cells and cancer cells, and mediated extraordinary therapeutic effects to tumors established from both CD73+ and CD73− tumor cells.
Targeting CD73+ cells modifies the tumor immune landscape and bolsters CTL responses in vivo.
The robust antitumor function on tumors prompted us to analyze the 4T1.2 TME after αCD73-Dye-mediated NIR irradiation. We first performed mass cytometry (CyTOF) to profile the tumor immune cell lineages, and the results revealed some remarkably features associated with antitumor immunity activation. αCD73-Dye-mediated NIR irradiation preferentially reduced multiple types of immunosuppressive cells in tumors, including ~85% reduction of Treg cells, 80% reduction of TAM.M2, and 95% reduction of MDSCs. Notably, the reduction of immunosuppressive cells was accompanied by a marked increase in tumor-infiltrating CD8+ CTLs, nearly a 50-fold increase compared to other treated groups (Fig. 3a, b). We further calculated the ratio of CD8+ T cells to different types of immunosuppressive cells. Depletion of CD73+ cells resulted in ~6 to 200-fold increase in the CD8+/Treg cells, CD8+/TAM.M2, CD8+/PMN.MDSC and CD8+/MoMDSC ratios over control groups (Extended Data Fig. 2a, b, c, d). Similar to CD8+ T cells, the modifications of tumor immune landscape also largely increase the ratio of NK cells or CD4+ effector T cells to various types of immunosuppressive cells (Extended Data Fig. 2e, f, g, h, i). Finally, the clearance of immunosuppressive cells may create a highly activating tumor milieu to allow for tumor-infiltrating CD8+ CTL reinvigoration; and indeed, remarkably upregulated GzmB- and IFN-γ-producing CTLs were detected after αCD73-Dye+NIR irradiation (Extended Data Fig. 2j, k). In addition to 4T1.2 tumors, we also analyzed the immune landscape after αCD73-Dye-mediated NIR irradiation in EMT6 TME. Similar to 4T1.2 tumor model, we found that αCD73-Dye-mediated NIR irradiation preferentially reduced multiple types of immunosuppressive cells in tumors but induced a marked increase in tumor-infiltrating CD8+ CTLs (Fig. 3c–3d). Overall, our data thus far highlight that depletion of CD73+ cells by αCD73-Dye+NIR in TME drives CTL reinvigoration for immune elimination of tumor cells.
Fig. 3 |. Targeting CD73+ cells modifies the tumor immune landscape and bolsters CTL responses in vivo.

4T1.2 and EMT6 tumor-bearing mice were treated with IgG, IgG-Dye+NIR, αCD73-Dye, or αCD73-Dye+NIR (mice were treated similarly as shown in Extended Data Fig. 1b). Tumors were harvest 2 hours after the treatment. (a) The t-SNE plot of 4T1.2 tumor-infiltrating CD45+ compartment overlaid with color-coded clusters from the treated mice. CyTOF was used to detect cell subsets in tumor tissues combined from 3–4 tumors of the same treatment group. (b) Calculated cell numbers per 100 mg 4T1.2 tumor are shown by indicated immune cell subsets (n=3 biological replicates). (c) Percentage of EMT6 tumor-infiltrating CD45+ immune cell subsets from the treated tumor-bearing mice. FACS was used to detect cell subsets in tumor tissues. (d) Calculated cell numbers per 100 mg EMT6 tumor are shown by indicated immune cell subsets (n=3 biological replicates). Representative results from one of two repeated experiments are shown. Data are mean ± SD. ****P<0.0001, αCD73-Dye+NIR group compared with IgG, IgG-Dye+NIR, or αCD73-Dye group, one-way ANOVA with Holm–Sidak test for multiple comparisons (b, d).
αCD73-Dye plus local NIR irradiation favors systemic CTL responses.
Because NIR irradiation may not reach metastatic tumors, we sought to determine whether local αCD73-Dye+NIR irradiation facilitates systemic CTL activation, which may be crucial for metastatic tumor clearance. Therefore, we performed a series of experiments to evaluate the potential CTL activation and tumor-infiltration in tumors with and without direct αCD73-Dye+NIR irradiation. We inoculated two Pan02OVA tumors s.c. on the left and right flanks of mice, and performed the αCD73-Dye+NIR irradiation on the left-side tumor only (right-side tumors were shielded from light). One day after NIR irradiation, we adoptively transferred luciferase-transduced OVA-reactive OT-I T cells via tail vein, which provides an approach to visualize the tumor-specific CD8+ CTL trafficking and accumulation (Fig. 4a). To our surprise, bioluminescent imaging revealed that massive Luc+ OT-I T cells infiltrated not only in the αCD73-Dye irradiated tumor but also the tumor shielded from light (Fig. 4b, c). Consistently, there are substantially more OT-I T cells after αCD73-Dye+NIR treatment as calculated for the absolute number of these tumor-specific T cells by FACS (Fig. 4d).
Fig. 4 |. Local αCD73-Dye+NIR irradiation favors systemic CTL responses.

(a) Diagram of the treatments. Pan02OVA tumor cells were s.c. injected on the left and right flanks of CD45.1 B6 mice, and treated with IgG, IgG-Dye+NIR, αCD73-Dye, or αCD73-Dye+NIR. NIR performed on the Left-side tumors only (Right-side tumors were shielded from light). One day after NIR irradiation, luciferase-transduced OVA-reactive OT-I T cells were adoptively-transferred via tail vein. Mice were tested for the OT-I T cell accumulation in the tumor. (b) Accumulation of transferred OVA-reactive luciferase-expressing OT-I T cells was tested by in vivo Bioluminescence Imaging. Representative images are shown. (c) Quantitative analysis of transferred OVA-reactive luciferase-expressing OT-I T cells in both left NIR-treated and right non-NIR treated tumors (n=3 biological replicates). (d) Calculated cell numbers per 100 mg tumor are shown (n=5 biological replicates/αCD73-Dye+NIR group, n=4 biological replicates/other groups). The number of CD45.2+CD8+ OT-I T cells is determined by FACS. (e) Pan02OVA tumor cells were s.c. injected on the left and right flanks of CD45.1 B6 mice, and treated with IgG, IgG-Dye+NIR, αCD73-Dye, or αCD73-Dye+NIR. NIR performed on the Left-side tumors only (Right-side tumors were shielded from light). One day after NIR irradiation, CFSE-labeled OT-I T cells were adoptively transferred via tail vein. Mice were tested for cell proliferation in tumor-draining lymph nodes (TDLNs). The proliferation of CFSE-labelled naïve OT-I CD8+ T cells in TDLNs of left NIR-treated and right non-NIR treated tumors. Representative data are shown (n=3 biological replicates). (f) The proliferation index of CFSE-labelled naïve OT-I CD8+ T cells in TDLNs of left NIR-treated and right non-NIR treated tumors are shown (n=3 biological replicates). (g) BALB/c mice were inoculated at the left mammary gland with 5×10⁵ EMT6 tumor cells and i.v. injection with 1×10⁵ EMT6 tumor cells (which allows lung tumor metastasis). IgG, IgG-Dye+NIR, αCD73-Dye, or αCD73-Dye+NIR treatments were given on day 5 to orthotopic tumors when the tumor size reached around 130 mm3 (other parts of mice were shielded from light). ELISpot analysis measuring IFNγ+ spots derived from CD8+ T cells isolated from ~100 mg lung metastatic tumor tissues 10 days after the mice treated as indicated. Representative data and summarized results are shown (n=4 biological replicates). (h) BALB/c mice were inoculated at the left mammary gland with 5×10⁵ 4T1.2 tumor cells and i.v. injection with 1×10⁵ 4T1.2 tumor cells (which allows lung tumor metastasis). IgG, IgG-Dye+NIR, αCD73-Dye, or αCD73-Dye+NIR treatments were given on day 7 to orthotopic tumors when the tumor size reached around 130 mm3 (other parts of mice were shielded from light). FACS analysis of gp70 tetramer-positive CD8+ T cells in the lung metastatic tumor tissues (n=5 biological replicates) 10 days after NIR. Representative results from one of two repeated experiments are shown. Data are mean ± SD. **P=0.0012926, αCD73-Dye+NIR group compared with αCD73-Dye group; ***P<0.001, ****P<0.0001, αCD73-Dye+NIR group compared with IgG, IgG-Dye+NIR, or αCD73-Dye group (c, d, f, g, and h), one-way ANOVA with Tukey’s correction.
To further confirm the induction of tumor-specific CD8+ CTL response by αCD73-Dye+NIR irradiation in vivo, we labeled OT-I CD8+ T cells with CFSE and adoptively transferred them to mice bearing two Pan02OVA tumors one day after the irradiation on the left tumor (No NIR exposure on the right tumor). Three days after the OT-I T cell transfer, αCD73-Dye+NIR irradiation stimulated a strong proliferation of OT-I T cells in tumor-draining lymph nodes (TDLNs) of tumors with and without the direct NIR exposure (Fig. 4e, f). Moreover, in mice bearing orthotopic and lung metastatic EMT6 and 4T1.2 TNBC, αCD73-Dye+NIR irradiation on the orthotopic tumor also greatly induced a robust effector CD8+ T cells response in the EMT6 lung metastatic tumor tissues (Fig. 4g) and boosted the 4T1.2-specific CTL infiltrating in the 4T1.2 lung metastatic tumor tissues as measured by the gp70-tetramer+ CD8+ T cells (gp70 is a native antigen expressed by 4T1.2) (Fig. 4h), respectively. Critically, these studies identify the unique capacity of αCD73-Dye+NIR irradiation in driving robust host antitumor CTL responses.
αCD73-Dye+NIR irradiation overcomes the acquired resistance of ICB immunotherapy.
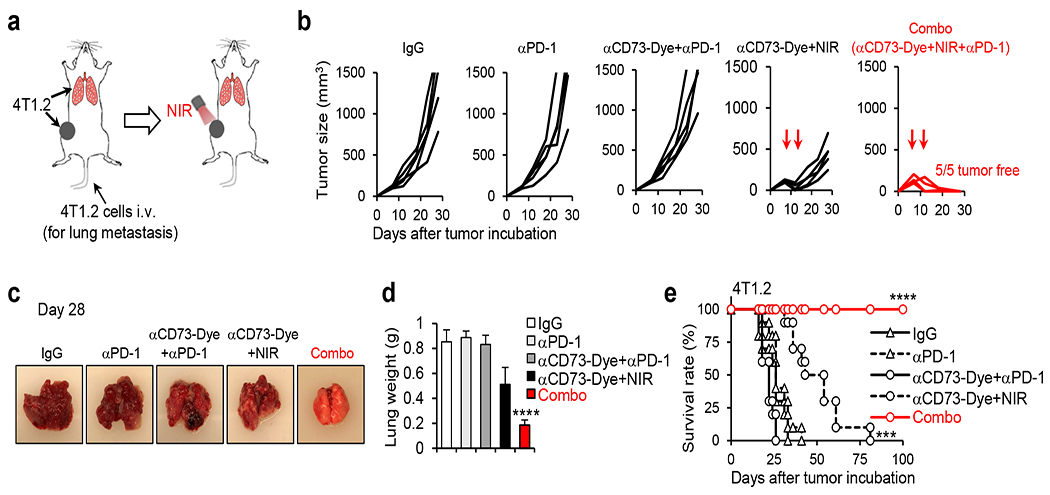
We first tested the anti-tumor efficacy of αCD73 and αCD73+αPD-1 using 4T1.2 orthotopic TNBC model, because these therapies alone may repress tumor growth35,36. In line with others35,36, αCD73 or αCD73+αPD-1 treatment exerted moderated but notable antitumor effects if treatments were started when 4T1.2 tumor size reached ~3×3 mm (small early-stage tumors). However, neither αCD73 nor αCD73+αPD-1 treatment display apparent antitumor function once treatment started when 4T1.2 tumors reached an advanced stage with a ~7×6 mm tumor size (Supplementary Fig. 3). Although targeting CD73 enzyme activity is insufficient to control advanced tumors, we here repurposed anti-CD73 mAbs to deplete CD73+ cells by αCD73-Dye+NIR in tumor to determine if this strategy could overcome the acquired resistance. In mice bearing advanced orthotopic and lung metastatic EMT6 tumors (Fig. 5a), αPD-1, αCD73-Dye+αPD-1, and αCD73-Dye+NIR treatments could induce initial tumor regression in EMT6 tumor-bearing mice, with the median survival time for 30.5, 30, and 47 days, respectively (22 days for IgG group). Remarkably, combo therapy (αCD73-Dye+NIR+αPD-1, the same after) eradicated both advanced orthotopic EMT6 tumor (with NIR) and lung metastatic tumors (no direct NIR to lung) (Fig. 5b, c) and resulted in tumor-free survival of at least 90% of mice up to 100 days (Fig. 5d). Similar results were obtained in 4T1.2 tumor-bearing mice (Extended Data Fig. 3), further highlighting that αCD73-Dye+NIR subverts systemic αPD-1 ICB primary and acquired resistances and promotes curative responses. Although injection of αCTLA-4, αTIM-3, αTIGIT, αLAG3, αGITR, αOX40, or α4-1BB also improves the antitumor effects of αCD73-Dye+NIR, none of these combinations resulted in the curative response as seem in αCD73-Dye+NIR+αPD-1 combo therapy. In addition to TNBC models, we also tested the murine Pan02B7H3 and Pan02 tumors, which displayed resistance to IgG, αPD-1, and αCD73-Dye+αPD-1 treatments (31, 32.5, 34 median survival time, respectively), but responded to αCD73-Dye+NIR treatment with ~50 days median survival time (Fig. 5e, h and Extended Data Fig. 4a, b, c, d). Similarly, αCD73-Dye+NIR+αPD-1 combo therapy also produced a curative effect on established Pan02B7H3 tumors and Pan02 tumors at both the NIR exposed and the distant no NIR-treated sites and resulted in tumor-free survival of all treated mice (Fig. 5e, h and Extended Data Fig. 4a, b, c, d). Finally, host CTL responses dictate these extraordinary antitumor functions, because depletion of CD8+ T cells but not depletion of CD4+ T cells or NK cells dampens the curative responses (Extended Data Fig. 4e, f).
Fig. 5 |. αCD73-Dye+NIR irradiation synergizes with αPD-1 ICB to promote curative responses.

(a) Diagram of the treatments. BALB/c mice bearing both orthotopic EMT6 tumor (5×10⁵ EMT6 tumor cells injection in the mammary gland) and lung metastasis tumors (1×10⁵ tumor cells injection via tail vein) were treated on day 5 with control IgG, αPD-1, αCD73-Dye+αPD-1, αCD73-Dye+NIR, or αCD73-Dye+NIR+αPD-1 (Combo). NIR irradiation was given on the orthotopic tumor only (other parts of the mice were shielded from light). (b) Tumor growth curves (n=5 mice/group) of the orthotopic EMT6 tumors after indicated treatments. (c) Mice were euthanized on day 20 and the summarized lung weight of mice receiving indicated treatments are shown (n=5 mice/group). (d) Surviving curves of EMT6 tumor-bearing mice (n=10 mice/group). (e) Diagram of the treatments. Pan02B7H3 tumor cells were s.c. injected on the left (2×10⁶ Pan02B7H3 cells) and right (5×10⁵ Pan02B7H3 cells) flanks of B6 mice, and treated on day 7 with control IgG, αPD-1, αCD73-Dye+αPD-1, αCD73-Dye+NIR, or αCD73-Dye+NIR+αPD-1 (Combo). NIR performed on the left-side tumor only (right-side tumors were shielded from light). (f) Tumor growth curves of NIR-treated left tumors are shown (n=5 mice/group). (g) Tumor growth curves of non-NIR-treated right tumors are shown (n=5 mice/group). (h) Surviving curves of Pan02B7H3 tumor-bearing mice are shown (n=9 mice/IgG group, n=10 mice/αPD-1 group, n=12 mice/αCD73-Dye+αPD-1 group, n=11 mice/other groups). Representative results from one of two repeated experiments are shown. Data are mean ± SD. ***P<0.001, Combo group compared with IgG, αPD-1, αCD73-Dye+αPD-1, or αCD73-Dye+NIR group, one-way ANOVA with Tukey’s correction (c). ***P<0.001, Combo group compared with IgG, αPD-1, αCD73-Dye+αPD-1, or αCD73-Dye+NIR group; ****P<0.0001, αPD-1 group compared with IgG group; ****P<0.0001, αCD73-Dye+NIR group compared with IgG, αPD-1, or αCD73-Dye+αPD-1 group, survival analysis was conducted by log-rank test with holm test for multiple comparisons (d). # means **P=0.00747, Combo group compared with αCD73-Dye+NIR group, ## means ***P<0.001, Combo group compared with IgG, αPD-1, or αCD73-Dye+αPD-1 group, two-way ANOVA with Holm–Sidak test for multiple comparisons (g). # means *P=0.02969, αCD73-Dye+NIR group compared with IgG group; ## means **P=0.00983, αCD73-Dye+NIR group compared with αPD-1 group; ### means *P=0.01052, αCD73-Dye+NIR group compared with αCD73-Dye+αPD-1 group; ***P<0.001, Combo group compared with IgG, αPD-1, αCD73-Dye+αPD-1, or αCD73-Dye+NIR group, survival analysis was conducted by log-rank test with holm test for multiple comparisons (h).
Depletion of immunosuppressive cells is indispensable for overcoming acquired resistance.
To dissect depletion of which cell type(s) is crucial to the observed curative responses, we used EMT6-bearing Nt5e−/− BALB/c mice (host CD73 KO) to receive αCD73-Dye+NIR+αPD-1 combo treatment, in which the immunosuppressive cells do not express CD73, a similar scenario of only targeting of tumor cells without depletion of immunosuppressive cells. Consistently, αCD73-Dye+NIR+αPD-1 combo treatment induced a notable tumor regression by killing CD73 expressing EMT6 cells, however, host deficiency of CD73 nullified the curative response (Fig. 6a, b). These results demonstrate that only targeting tumor cells without killing immunosuppressive cells invariably leads to acquired resistance. Conversely, we also used EMT6 CD73 knockout (EMT6CD73 KO) tumor cells to establish tumors in WT BALB/c mice, in which tumor cells can not be directly eliminated by αCD73-Dye+NIR in vitro (Extended Data Fig. 5a, b). Interestingly, αCD73-Dye+NIR+αPD-1 combo treatment also eradicated EMT6CD73 KO tumors in WT mice for tumor-free survival in 85% of mice at day 50 (Extended Data Fig. 5c), suggesting that tumor cell-expression of CD73 may be only required for the optimal antitumor capacity of αCD73-Dye+NIR+αPD-1 combo therapy.
Fig. 6 |. Targeting all major types of immunosuppressive cells in tumors is indispensable to the curative response.

Tumor growth curves (a, n=5 mice /group) and mice survival (b, n=9 mice/WT mice+IgG group, n=12 mice/Nt5e−/− mice+Combo group, n=10 mice/other groups) are shown after wild-type (WT) or Nt5e−/− BALB/c mice bearing 5-day orthotopic EMT6 tumors treated with control IgG or αCD73-Dye+NIR+αPD-1 (Combo). (c) Tumor growth curves of reconstituted EMT6 tumors after αCD73-Dye+NIR+αPD-1 combo therapy. Sorted Tregs (Left), TAM.M2 (Middle), or MDSCs (Right) from tumors of EMT6-bearing wild-type (WT) BALB/c mice or Nt5e−/− BALB/c mice were intratumorally injected into EMT6 tumors of WT BALB/c mice 1 day before αCD73-Dye+NIR+αPD-1 combo therapy (n=5 mice/group). Representative results from one of two repeated experiments are shown. Data are mean ± SD. **P=0.00268, WT mice+Combo group compared with Nt5e−/− mice+Combo group, two-way ANOVA with Holm–Sidak test for multiple comparisons (a). ***P<0.001, WT mice+Combo compared with WT mice+IgG, Nt5e−/− mice+IgG, or Nt5e−/− mice+Combo, survival analysis was conducted by log-rank test with holm test for multiple comparisons (b). **P=0.00569, WT TAM.M2 i.t. group compared with Nt5e−/− TAM.M2 i.t. group; ****P<0.0001, WT Treg i.t. group compared with Nt5e−/− Treg i.t. group, WT MDSC i.t. group compared with Nt5e−/− MDSC i.t. group, two-way ANOVA with Holm–Sidak test for multiple comparisons (c).
To further elucidate whether removing all immunosuppressive cells, such as TAM.M2, Tregs, and MDSCs, is required for curative responses, we sorted immunosuppressive cells (Tregs, TAM.M2, or MDSCs) from orthotopic EMT6 tumors inoculated on WT or Nt5e−/− BALB/c mice. We intratumorally injected one type of these sorted immunosuppressive cells into orthotopic EMT6 tumors inoculated in WT BALB/c mice one day before αCD73-Dye+NIR+αPD-1 combo treatment, which establishes the scenario of only one type of immunosuppressive cell remaining as a result of the killing of all the other cell types. The numbers of intratumorally injected cells were adjusted to result in an equal/similar tumor “infiltration” of each subset of cells in WT vs Nt5e−/− cell portion. Interestingly, injection of any type of Nt5e−/− immunosuppressive cells, including Tregs, TAM.M2, or MDSCs, abrogated the curative capacity of the αCD73-Dye+NIR+αPD-1 combo therapy (Fig. 6c), suggesting that targeting all types of these immunosuppressive cells is indispensable for subverting acquired resistance to ICB. Collectively, αCD73-Dye+NIR therapy subverts acquired resistance to ICB and bolsters an unexpectedly immunotherapeutic efficacy in EMT6 tumor model.
αCD73-Dye+NIR irradiation synergizes with αPD-1 to eradicate spontaneous tumors and human organotypic tumor spheroids.
Last, we assessed the anti-tumor capacity of αCD73-Dye+NIR+αPD-1 combo therapy in a more difficult scenario of spontaneous TNBC tumor model (MMTV/PyVT) that is known to resistant to αPD-1 ICB37. MMTV/PyVT mice, which can develop highly invasive mammary ductal carcinomas with a high frequency of lung metastases, highly resembles human luminal breast cancer38. All-female carriers develop palpable mammary tumors by 6 to 7 weeks of age and tumors eventually develop in all of their 10 mammary fat pads39. The treatments were started when mice developed 2 to 3 tumors ~60mm3 each, and NIR irradiation was performed on all of these tumors. Remarkably, only αCD73-Dye+NIR+αPD-1 combo therapy eradicated these established spontaneous tumors (Fig. 7a); and also retarded the growth of tumors from other mammary glands (Fig. 7b, c, d). Furthermore, the eradication of the orthotopic tumors also led to the elimination of lung metastatic TNBCs, and most importantly, αCD73-Dye+NIR+αPD-1 combo therapy resulted in an 80% survival rate at day 110 (Fig. 7e, f). These results highlight that αCD73-Dye+NIR irradiation holds promise for overcoming systematic resistance to αPD-1 therapy in mice genetically prone to spontaneous breast cancer.
Fig. 7 |. αCD73-Dye+NIR irradiation synergizes with αPD-1 to eradicate spontaneous TNBCs.

(a) The treatments were initiated when MMTV-PyVT transgenic female mice developed 2 to 3 tumors and each of them reached ~60mm3 (around 6-7 weeks of age), and NIR irradiation was performed on all of these tumors (three αCD73-Dye+NIR treatments in total at weekly intervals; five αPD-1 injections at 3-day intervals). Shown are representative pictures of MMTV-PyVT transgenic female mice treated by IgG, αPD-1, αCD73-Dye+NIR, or αCD73-Dye+NIR+αPD-1 combo therapy on day 90 after birth. The number of tumor-bearing mammary fat pads (b), total tumor weight (c), combined tumor volume (d), the number of lung metastatic foci (e), and the survival curves (f) of MMTV-PyVT transgenic female mice treated by IgG, αPD-1, αCD73-Dye+NIR, or αCD73-Dye+NIR+αPD-1 combo therapy (n=10 mice/group). Representative results from one of two repeated experiments are shown. Data are mean ± SD. ***P<0.001, ****P<0.0001, Combo group compared with IgG, αPD-1, or αCD73-Dye+NIR group, one-way ANOVA with Tukey’s correction (b, c, and e); ****P<0.0001, Combo group compared with IgG, αPD-1, or αCD73-Dye+NIR group, two-way ANOVA with Holm–Sidak test for multiple comparisons (d). ****P<0.0001, Combo group compared with IgG, αPD-1, or αCD73-Dye+NIR, survival analysis was conducted by log-rank test with holm test for multiple comparisons (f).
Based on the Human Protein Atlas (HPA) dataset40, most human cancer tissues display strong to moderate membranous and cytoplasmic CD73 positivity (Extended Data Fig. 6a). We also tested the expression of CD73 and B7H3 on immune cells and cancer cells in human PDAC tumor specimens. We found that cancer cells express CD73 and B7H3 and all major types of immunosuppressive cells displayed a high expression of CD73, but a low or no expression of B7H3 (Extended Data Fig. 6b, c). We next extend our study to test the antitumor capacity of αCD73-Dye+NIR+αPD-1 and αB7H3-Dye+NIR+αPD-1 combo therapy in human PDAC. To better evaluate the potential of combo therapy in a model that closely resembles the clinical setting, we used human PDAC patient-derived organotypic tumor spheroids (OTS) (Extended Data Fig. 6d). In agreement with our murine tumor model results, only αCD73-Dye+NIR+αPD-1 combo therapy displayed robust tumor-killing ability in human PDAC (Extended Data Fig. 6e), suggesting that the combo therapy may have high translational potential as a therapy for human cancer.
Discussion
In this study, we demonstrated that acquired resistance may occur during ICB immunotherapy or combinational target therapy with ICB immunotherapy, and revealed a potential role of immunosuppressive cells in TME that leads to recurrence. Our results also suggest a strategy for overcoming acquired resistance by local removing all major types of immunosuppressive cells. By identification of CD73 as a common marker highly expressed on multiple types of immunosuppressive cells by bioinformatics analysis, we repurposed anti-CD73 mAbs from blocking the enzymatic activity of CD73 into the killing of CD73+ tumor and immunosuppressive cells by αCD73-Dye+NIR to overcome systemic ICB primary and acquired resistance. Remarkably, depleting of all major types of immunosuppressive cells eradicated advanced tumors, overcame acquired resistance of ICB immunotherapy, and induced curative responses in TNBC and PDAC tumor models.
Acquired resistance may cause cancer treatment failure and death in over 90% of patients with advanced tumors. Patients may initially respond to treatment, but recurrence often occurs because of the heterogeneous nature of cancer cell populations41. In heterogeneous cancer cells, the few cells that are resistant due to somatic mutation will be iteratively selected and escape during treatment41. Tumor cell death induced by chemotherapy- or targeted therapy is thought to promote tumor antigen presentation, which then facilitates the antitumor response of ICB. Interestingly, our results demonstrated that targeting tumor cell-expressed antigens (e.g. target B7H3 by αB7H3-Dye+NIR+αPD-1) without destroying the immunosuppressive TME promoted the outgrowth of B7H3− resistant tumor cells, akin to acquired resistance in the clinical setting42–44.
Various types of tumor-infiltrating immunosuppressive cells, including Treg cells, MDSCs, and TAM.M2, contribute to reduced CTL induction, infiltration, and cytolytic function, which dampens the responsiveness to ICB11–16. The precise understanding of immunosuppressive cells to acquired resistance of ICB immunotherapy remains elusive. We hypothesized that depleting all major types of immunosuppressive cells may overcome the acquired resistance in ICB immunotherapy. Currently, approaches that specifically target a single type of immunosuppressive cell in TME have not yet been achieved. Here, we identified that CD73 was highly expressed by all major types of immunosuppressive cells by comparing gene profiles of immunosuppressive cells to effector immune cells. We also confirmed that immunosuppressive cells, such as MDSCs, Treg cells, and TAMs.M2 highly expressed CD73, whereas the expression of CD73 on CD8+ CTL, Foxp3−CD4+ T cells, or DCs are negative or very low. This unique character of immunosuppressive cells provides us with a chance to simultaneously targeting these immunosuppressive cell subsets, which may contribute to the acquired resistance of ICB.
Indeed, CD73 is the main extracellular source of adenosine, and the accumulated extracellular adenosine could impair the cytotoxic potential of CD8+ T cells and NK cells in TME45. A recent study also suggested that high expression of CD73 in immunosuppressive cells in tumor, particularly in TAM.M2, contributed to the lack of T-cell infiltration, thereby leading to poor clinical outcomes29,30. Thus, the anti-CD73 antibody has been used to target the enzyme activity of CD73 for cancer treatment46–48, but unfortunately, the response of advanced tumors to αPD-1+αCD73 antibody or αPD-1+adenosine antagonist is limited in both pre-clinic studies and clinic trials (clinical effectiveness data donť support launching a phase III study)36,49,50. However, in our current study, we alternatively targeted CD73+ cells with αCD73-Dye+NIR to induce complete response and prevent the recurrence in ICB immunotherapy. This antitumor effect is associated with rapid killing of CD73+ tumor cells and immunosuppressive cells (including Treg cells, MDSCs, and TAMs.M2 cells), but no or very limited cytotoxicity to effector CD4+ T cells and CD8+ T cells or DCs, which is correlated with the surface expression level of CD73. To our surprise, targeting all major types of these immunosuppressive cells, including Treg, MDSC, TAM.M2, is indispensable for subverting acquired resistance to ICB, because the presence of any single type of immunosuppressive cells, including Tregs, TAM.M2, or MDSCs, in local TME abrogated the curative response.
Another intriguing finding is that αCD73-Dye+NIR+αPD-1 also eradicated advanced tumors established from CD73− tumor cells. These results suggest the importance of eradicating immunosuppressive cells to overcome acquired resistance, further highlighting the antitumor potential of αCD73-Dye in a range of tumor types, irrespective of the expression levels of CD73 on tumor cells. Although αCD73-Dye may also kill CD73+ cancer-associated fibroblasts (CAF) and cancer-associated endothelial cells (CAE)51,52, it seems that removal of these cells is insufficient to prevent tumor recurrence. This is because B7H3 is also highly expressed on CAF and CAE53, whereas αB7H3-Dye+NIR+αPD-1 failed to induce tumor-free responses.
Based on the Human Protein Atlas (HPA) dataset40, most cancer tissues display moderate to strong cytoplasmic and membranous CD73 positivity, with only lymphomas and testicular cancers being weakly positive or having no expression. Based on HPA dataset40, normal human pancreatic tissues do not express detectable RNA levels of Nt5e (CD73 encoding gene), and normal human skin and breast tissues produce very low/limited NT5E. Similar results can be found in other databases (Fantom and GTEx)54,55 that normal human pancreas, skin, and breast tissues express very low to undetectable RNA level of Nt5e. Although some studies reported that some cells, like endothelial cells and hepatocytes56, express some level of CD73, and therefore incur unintended toxicity when receiving αCD73-Dye+NIR, NIR light irradiation can be carried out through a fiber optic diffuser under endoscopic guidance to specific target tumor sites and reduce potential damage to normal cells. These data suggest that some tumor types, e.g. PDAC, skin cancer, head and neck cancer, and breast cancer, may be good targets for local αCD73-Dye+NIR irradiation to eliminate the tumor and immunosuppressive cells in TME with limited damage to normal cells. Furthermore, local photodynamic therapy has been performed in patients with PDAC, using laser fibers inserted through needles positioned percutaneously through the anterior abdominal wall guided by ultrasound and computed tomography57. Finally, NIR irradiation with antibody-Dye conjugates is now being tested in phase II clinical trials (NCT02422979; anti-EGFR-IR700), indicating that our proposed approach is feasible.
Taken together, we revealed an immunosuppressive cell-mediated acquired resistance in ICB immunotherapy. Our study provides an opportunity to preferentially and simultaneously target cancer cells and the immunosuppressive TME by our αCD73-Dye, which is sufficient in overcoming acquired resistance and triggers a system curative response in αPD-1-resistant tumors. Thus, this translationally relevant work will lay the critical foundation for future clinical trials for TNBC, PDAC, and other cancers.
Methods
Mice.
C57BL/6, BALB/c, C57BL/6-Tg(TcraTcrb)1100Mjb/J, B6.129S1-Nt5etm1Lft/J, B6.SJL-Ptprca Pepcb/BoyJ, FVB/N-Tg(MMTV-PyVT)634Mul/J were purchased from The Jackson Laboratory. Nt5e−/− mice in BALB/c background were generated by crossing Nt5e−/− B6 mice with BALB/c mice for 12 generations. Male and female 6- to 8-week-old mice were used for PDAC animal experiments, whereas only female mice were used for TNBC models. All experiments complied with protocols approved by the Institutional Animal Care and Use Committee and Institutional Review Board at the Wake Forest School of Medicine.
Cell lines.
4T1.2 cell line was a gift from Dr. Robin L Anderson, University of Melbourne. Pan02 cell line was a gift from Dr. Qing Yi, Cleveland Clinic. EMT6 cell line was purchased from ATCC. Pan02B7H3 and EMT6B7H3 cell lines were generated by transducing with lentivirus vectors encoding murine B7H3. EMT6CD73 KO cells were generated using CRISPR/Cas9 for CD73 deletion. Cells were cultured in RPMI 1640 Medium (Invitrogen) supplemented with 10% heat-inactivated fetal bovine serum (Thermo Scientific), 100 U/ml penicillin-streptomycin, and 2 mM L-glutamine (both from Invitrogen).
Reagents.
ViaStain AO/PI Staining Solution (catalog#CS2-0106) was purchased from Nexcelom. Propidium Iodide Solution (catalog#421301) was purchased from BioLegend. CellTrace CFSE Cell Proliferation Kit (catalog#C34554) was purchased from ThermoFisher. LIVE/DEAD Fixable Blue Dead Cell Stain Kit (catalog#L23105) was purchased from ThermoFisher. Anti-mouse CD73 antibody (clone: TY/23, catalog#BE0209), Anti-mouse B7H3 antibody (clone: MJ18, catalog#BE0124), anti-mouse PD-1 antibody (clone: RMP1-14, catalog#BE0146), anti-mouse CTLA-4 antibody (clone: UC10-4F10-11, catalog#BE0032), anti-mouse TIM-3 antibody (clone: RMT3-23, catalog#BE0115), anti-mouse TIGIT antibody (clone: 1G9, catalog#BE0274), anti-mouse LAG-3 antibody (clone: C9B7W, catalog#BE0174), anti-mouse GITR antibody (clone: DTA-1, catalog#BE0063), anti-mouse OX-40 antibody (clone: OX-86, catalog#BE0031), anti-mouse 401BB antibody (clone: LOB12.3, catalog#BE0169), anti-mouse NK1.1 antibody (clone: PK136, catalog#BE0036), anti-mouse CD4 antibody (clone: GK1.5, catalog#BE0003-1), and anti-mouse CD8 antibody (clone: 2.43, catalog#BE0061) were purchased from BioXcell. Anti-human PD-1 (Nivolumab, catalog#A2002) was purchased from Selleckchem. Anti-human CD73 (clone: AD2, catalog#344002) was purchased from BioLegend.
Quantitative PCR.
Total RNA was extracted from the tumor using the TRIzol Reagent (Thermo Fisher), followed by cDNA synthesis with the High-Capacity cDNA Reverse Transcription kit (Applied Biosystems). qPCR was conducted with SYBR Select Master Mix (Applied Biosystems). Expression was normalized to the expression of the housekeeping gene β-actin. mB7H3 forward: 5’- ATGCTTCGAGGATGGGGTG -3’, mB7H3 reverse: 5’- CCAGGCTCTGGGGAAAAGG -3’; mβ-actin forward: 5’- GGCTGTATTCCCCTCCATCG-3’, mβ-actin reverse: 5’-CCAGTTGGTAACAATGCCATGT-3’.
Venn diagram analysis based on Cut-tree algorithm.
To compare the gene expression profiles of Treg cells, MDSCs, and TAM.M2 cells to Th1 cells, DCs, and normal tissue macrophages, we utilized un-supervised hierarchical clustering to all genes (>2 fold increase) in the published microarray data. The upregulated genes (>2 fold increase) in Treg cells, MDSCs, and TAM.M2 cells were taken for commonality analysis by Venn graph. Venn diagram analysis was implemented by VennDiagram in R (https://www.r-project.org/) as described before58.
Rank-adjusted fold-change analysis.
Genes were sorted by the extent of the genes that show strong gene expression changes in the 3 comparisons of “non-immunosuppressive to immunosuppressive cells”. We defined the rank by sorting ni from high to low:
where , i is the gene i, and the FCij is the gene expression fold-change of i in the comparison of j.
The rank-adjusted fold-change (or called overall fold-change) integrated from the 3 comparisons is defined as follows,
Flow cytometry.
Tumors were dissected, manually dissociated, and digested enzymatically with Collagenase D (Sigma) and DNase I (Roche) in PBS containing 2% FBS for 20 min at room temperature. EDTA was added to a final concentration of 10mM and incubate at room temperature for an additional 5 minutes. The entire suspension was filtered through a 70-μm cell strainer to obtain a single-cell suspension. FITC-, PE- APC-, or eFluor-conjugated mAbs (1:100 dilution) were used for staining after Fc blocking. Samples were acquired with Fortessa flow cytometer or sorting, data were analyzed with Flowjo software. For T cell proliferation assay, 1 million OT-I T cells were labeled with 1.5 mM carboxyfluorescein diacetate succinimidyl ester (CFSE; Invitrogen), and then were adoptively transferred into tumor-bearing mice after NIR treatment. T cell proliferation in tumor-draining lymph nudes was determined 3 days after T cell transfer and ~4,500 OT-I T cells were analyzed (if less than 4,500 OT-I cells, all cells in the sample were collected and analyzed by FACS). The proliferation index is calculated as the average number of divisions of CFSE stained T cells in TDLNs59.
Synthesis of IR700-Dye conjugated antibodies.
IR700-Dye conjugated antibodies were prepared using IRDye® 700DX Protein Labeling Kits (catalog#928-38046, Licor). In brief, antibodies were incubated with IRDye® 700DX NHS Ester at room temperature in phosphate buffer (pH 8.0) for 1h. The product of the conjugation was then purified with Zeba™ Spin Desalting Column. The antibody concentrations were determined with BCA protein assay kit (catalog#23225, Thermo Fisher), and the concentration of IR700 was determined by measuring the absorption at 689nm. The number of IR700 molecules conjugated to each antibody was calculated as reported by us and others24,60. Antibody conjugates used in this study contain an average of 3.5 molecules of IR700 on each antibody.
Cell live/dead assay.
Cancer cells or sorted immune cells (1×10⁴) were plated into 96 well plates and incubated with IgG, IgG-Dye, αB7H3-Dye, or αCD73-Dye at 5μg/mL for 6 hours at 37°C with 5% CO2. The cells were then washed with cold PBS twice and cultured with phenol red-free culture medium. Cells were then irradiated with a NIR light-emitting diode at wavelengths of 690nm (catalog#L690-66-60; Marubeni America Co.). To measure the cytotoxic effect of NIR, cells were stained with PI 2 hours after irradiation, and then ~5000 cells/events were analyzed by flow cytometry. In some experiments, treated cells were incubated with Nexcelom ViaStain AO/PI staining Solution (catalog#CS2-0106) at room temperature in dark for 20 minutes, and then representative images were captured on a Nikon TE300 fluorescence microscope.
Organotypic tumor spheroids (OTS) model.
Three deidentified fresh human pancreatic tumor surgical specimens were obtained from Tumor Tissue and Pathology Shared Resource at the Wake Forest Baptist Comprehensive Cancer Center (0.8-3g tumor tissue/patient, obtained with informed consent using IRB-approved protocol). OTS was prepared similarly as described by others61,62. In brief, the specimens were minced on ice and strained over 100-μm filter and 40-μm filters to generate spheroid fractions (40-100 μm). Spheroid fractions were resuspended in type I rat tail collagen, and layered on top of 1 ml of pre-reconstructed collagen within a 30 mm, 0.4 mm inner transwell, and then incubated for 1h in a 37°C incubator before added culture medium. Organotypic tumor spheroids (OTS) were cultured for 3-5 days and then treated with medium containing control IgG, αPD-1, αCD73-Dye+αPD-1, αCD73-Dye+NIR, αCD73-Dye+NIR+αPD-1, αB7H3-Dye+αPD-1, αB7H3-Dye+NIR, or αB7H3-Dye+NIR+αPD-1 combination therapy for 5 days. In some studies, the human CD45+ immune cells were identified by FACS with cell lineage markers: DCs (CD11c+HLA-DRhiCD1c+), M1-like TAM (TAM-M1, CD11bhiCD68+CD86+), TAM-M2 (CD11bhiCD68+CD163+), Mo-MDSC (CD11bhiCD14hi), and polymorphonuclear (PMN)-MDSC (CD11bhiCD15hi), B cells (CD19+), CD8+ T cells (CD3+CD8+), Treg cells (CD4+CD3+Foxp3hi), CD4+ effector (CD4+CD3+Foxp3−) and NK cells (CD56+).
Measurement of NIR cytotoxicity in OTS.
To measure the cytotoxic effect of NIR in OTS, cell death was tested by Nexcelom ViaStain AO/PI staining Solution. Images were captured on a Nikon TE300 fluorescence microscope. Imaging data were analyzed by customized software using Python 3.7 (www.python.org). A strong imaging processing package, opencv-python (https://pypi.org/project/opencv-python/) was used to quantify total cell area of each dye (green for live cells or red for dead cells in the figures reported in this manuscript). The steps in our customized software are (1) reading an image into pixels; (2) transforming color of each pixel into colors of green, red, and black, in which intensity for each color (green, red, and black) is scaled from 1 to 255; (3) denoising the colors by setting a threshold for each color intensity. In these analyses, we used h=150 for both green (live) and red (dead) colors, i.e. and , where k is a pixel (k = 1, 2, …, n), n is the total number of the pixels in this image, Gk is the green color intensity of the pixel k, and Rk is the read color intensity of the pixel k; and (4) calculating relative ratio of live cells as ratio between total number of pixels in green color and red color, . Thus, r and 1 − r are the output for an image, representing the ratios of the dyed cells, respectively.
In vivo tumor models and treatments.
BALB/c mice were inoculated at the left mammary gland with 5×10⁵ 4T1.2 or EMT6 or EMT6B7H3 or EMT6CD73 KO tumor cells with or without intravenously (i.v.) injection with 1×10⁵ 4T1.2 or EMT6 or EMT6B7H3 or EMT6CD73 KO tumor cells, respectively. Treatments were started on day 5 or 7 when tumors’ size reached about 130 mm3. C57BL/6J mice were inoculated subcutaneously (s.c.) at left flank with 2×10⁶ Pan02 or Pan02B7H3 or Pan02OVA tumor cells with or without s.c. 0.5×10⁶ or 2×10⁶ Pan02 or Pan02B7H3 or Pan02OVA tumor cells at the right flank. Treatments were started on day 7 when left tumor size reached about 130 mm3. Mice were randomized into different groups and mAb-Dye (100 μg) was i.v. injected 1 day before NIR treatment. The tumors on the right flank were exposed once or twice to 690 nm NIR with a total dose of 100 J/cm2 for each NIR. In some experiments, 150 μg αPD-1 was intraperitoneally (i.p.) injected every three days starting on day 5 or 7 for a total of 4 injections in Pan02, 4T1.2, EMT6 tumor-bearing mice or 5 injections for mice with spontaneous TNBC tumors. All other parts of mice were covered with an aluminum film to avoid light. Mice were monitored daily after treatment. The tumor was measured by caliper and tumor size was calculated as 0.5×Length×Width2. Mice were euthanized using carbon dioxide and subsequent cervical dislocation.
In vivo Bioluminescence Imaging.
Before imaging, mice were anesthetized with isoflurane and i.p. injected with 100 μL of 20 mg/mL D-Luciferin (Xenogen Corp.). After 8 min, animals were imaged using an IVIS 200 system (Xenogen), according to the manufacturer’s instructions. Living Image software (Xenogen) was used to analyze data.
The enzyme-linked immunosorbent spot (ELISpot) assay.
BALB/c mice were inoculated at the left mammary gland with 5×10⁵ EMT6 tumor cells and i.v. injection with 1×10⁵ EMT6 tumor cells (which allows lung tumor metastasis). IgG, IgG-Dye+NIR, αCD73-Dye, or αCD73-Dye+NIR treatments were given on day 5 to orthotopic tumors when the tumor size reached around 130 mm3 (other parts of mice were shielded from light). The lung metastatic tumor tissues were minced and digested. CD8+ T cells in the tissues were isolated by a bead positive selection kit (CD8). Isolated cells per 100 mg tumor tissues were cocultured with irradiated EMT6 tumor cells on IFNγ ELISpot Kit plates (Mouse IFN-gamma ELISpot Kit, R&D Systems) for 48 hours following the manufacturer’s instructions. The plates were imaged and evaluated by Cellular Technology Limited ELISPOT Analyzer.
Depletion of NK cells, CD4 T cells, and CD8 T cells.
Anti-NK1.1 (clone: PK136, 200 μg/mouse), or anti-CD4 (clone: GK1.5, 200 μg/mouse), or anti-CD8 (clone: 2.43, 200 μg/mouse) mAbs was i.p. injected every 3 days starting from 1 day before the first NIR treatment63,64.
Extracellular adenosine assay.
Extracellular adenosine assay was performed by using Adenosine Assay Kit (catalog#MET-5090, CELL BIOLABS, INC) according to the manufacturer’s instruction. In brief, tumor tissues were harvested after treatments. Tissues were cut into ~2×2 mm fragments, sonicated in PBS, and centrifuge at 10,000×g for 10 minutes at 4°C. The supernatant was assayed directly or diluted as necessary in PBS using adenosine assay kit.
Single-cell mass cytometry.
Tumors were dissected, manually dissociated, and digested enzymatically with Collagenase D (Sigma) and DNase I (Roche) in PBS containing 2% FBS for 20 min at room temperature. EDTA was added to a final concentration of 10mM and incubate at room temperature for an additional 5 minutes. The entire suspension was filtered through a 70-μm cell strainer to obtain a single-cell suspension. Filtered cells were then washed twice and total cell concentrations were determined using an automated cell counter (ThermoFisher) with trypan blue exclusion. Antibodies were either purchased pre-conjugated from Fluidigm or conjugated in-house using Maxpar Antibody Labeling Kit (Fluidigm) according to the manufacturer’s instruction. Antibodies include: 89Y-CD45, 141Pr-Ly-6G, 145Nd-CD4, 146Nd-F4/80, 149Sm-CD19, 150Nd-CD24, 151Eu-CD64, 152Sm-CD3e, 153Eu-CD8a, 158Gd-Foxp3, 162Dy-Ly6C, 165Ho-IFNγ, 167Er-Nkp46, 169Tm-CD206, 171Yb-GzmB, 172Yb-CD11b, 174Yb-MHCII, 209Bi-CD11c and 194Pt-Live/Dead. 1×10⁶ - 3×10⁶ cells per sample were performed by cell staining according to the manufacturer’s protocol (Fluidigm). Each antibody was used at manufacturer recommended concentrations. Stained samples were shipped to the CyTOF Core of Dana-Farber Cancer Institute and then analyzed using a CyTOF2. An average of 35,000 CD45+ cells (25,000 to 45,000 cells) per sample were evaluated by CyTOF. The CyTOF data were bead-normalized and de-barcoded mass cytometry. We applied Flow-SOM analysis to the CyTOF data. The expression values were arcsinh transformed by the antibodies for transformation. The CD45+ immune cells were identified by consensus clustering of the antibodies for cell lineage markers: DCs (CD11chiMHCIIhiCD24+), M1-like TAM (TAM-M1, CD11bhiF4/80+MHCIIint/hiCD206−CD24−), TAM-M2 (CD11bhiF4/80+MHCIIlow/negCD206+CD24−), Mo-MDSC (CD11bhiLy6ChiLy6Glow), and polymorphonuclear (PMN)-MDSC (CD11bhiLy6Ghi), B cells (CD19+), CD8+ T cells (CD3+CD8+), Treg cells (CD3+CD4+Foxp3+), CD4+ effector (CD3+CD4+Foxp3−) and NK cells (Nkp46+).
Statistical analyses.
For statistical analysis, Student’s t-test or ANOVA was used. Survival was analyzed using the log-rank test. A P-value less than 0.05 was considered statistically significant. Results are presented as mean ± standard deviations (SD) unless otherwise indicated.
Reporting Summary.
Further information on research design is available in the Nature Research Reporting Summary linked to this article.
Extended Data
ED Fig. 1. αCD73-Dye+NIR treatment shrinks advanced tumors in vivo.

(a) Treatment procedures of αCD73-Dye-mediated NIR irradiation against 4T1.2 and Pan02 tumors in vivo. NIR was given on tumors only, while other parts of the mice were shielded from light. Tumor growth curves of 4T1.2 (b) and Pan02 (c) tumors treated with IgG, IgG-Dye+NIR, αCD73-Dye, or αCD73-Dye+NIR (n=5 mice/group). The red arrow represents near-infrared (NIR) irradiation. Representative results from one of two repeated experiments are shown.
ED Fig. 2. Changes in ratios of different immune cells in tumors after αCD73-Dye + NIR treatment.

CD8+ T cells to Treg cells ratio (a), CD8+ T cells to TAM.M2 cells ratio (b), CD8+ T cells to PMN.MDSC cells ratio (c), CD8+ T cells to Mo.MDSC cells ratio (d), NK cells to Treg cells ratio (e), NK cells to TAM.M2 cells ratio (f), NK cells to PMN.MDSC cells ratio (g), NK cells to Mo.MDSC cells ratio (h), and Foxp3.neg CD4+ T cells to Treg cells ratio (i) in 4T1.2 tumors after indicated treatments (as described in Extended Data Figure 1) were tested by CyTOF (n=3 biological replicates). The t-SNE plot of tumor-infiltrating CD45+ compartment overlaid with the expression of GzmB (j) and IFN-γ (k) from the 4T1.2 tumor after treatment. Data are mean ± SD. ****P<0.0001, αCD73-Dye+NIR group compared with IgG, IgG-Dye+NIR, or αCD73-Dye group, one-way ANOVA with Tukey’s correction (a, b, c, d, and h). # means **P= 0.005834, αCD73-Dye+NIR group compared with IgG group, ## means **P= 0.006561, αCD73-Dye+NIR group compared with IgG-Dye+NIR group, ### means *P=0.010734, αCD73-Dye+NIR group compared with αCD73-Dye group, one-way ANOVA with Tukey’s correction (f). # means **P= 0.002767, αCD73-Dye+NIR group compared with IgG group, ## means **P= 0.005519, αCD73-Dye+NIR group compared with IgG-Dye+NIR group, ### means *P=0.028222, αCD73-Dye+NIR group compared with αCD73-Dye group, one-way ANOVA with Tukey’s correction (g). # means **P= 0.007576, αCD73-Dye+NIR group compared with IgG group, ## means **P= 0.004057, αCD73-Dye+NIR group compared with IgG-Dye+NIR group, ### means *P=0.015673, αCD73-Dye+NIR group compared with αCD73-Dye group, one-way ANOVA with Tukey’s correction (i).
ED Fig. 3. αCD73-Dye + NIR irradiation synergizes with αPD-1, promoting curative responses in the 4T1.2 tumor model.
(a) Diagram of the treatments. BALB/c mice bearing both orthotopic 4T1.2 tumor (5×10⁵ 4T1.2 tumor cells injection in the mammary gland) and lung metastasis tumors (1×10⁵ tumor cells injection via tail vein) were treated on day 7 with control IgG, αPD-1, αCD73-Dye+αPD-1, αCD73-Dye+NIR, or αCD73-Dye+NIR+αPD-1 (Combo). NIR irradiation was given on the orthotopic tumor only (other parts of the mice were shielded from light. (b) Tumor growth curves (n=5 mice/group) of the orthotopic 4T1.2 tumors after indicated treatments. (c) Some mice were euthanized on day 28 and representative lung pictures are shown. (d) Summarized lung weight of mice receiving indicated treatments (n=5 biological replicates). (e) Surviving curves of 4T1.2 tumor-bearing mice. Representative results from one of two repeated experiments are shown (n=10 mice/group). Data are mean ± SD. ****P<0.0001, Combo group compared with IgG, αPD-1, αCD73-Dye+αPD-1, or αCD73-Dye+NIR group, one-way ANOVA with Tukey’s correction (d). ***P<0.001, αCD73-Dye+NIR group compared with IgG, αPD-1, or αCD73-Dye+αPD-1 group; ****P<0.0001, Combo group compared with IgG, αPD-1, αCD73-Dye+αPD-1, or αCD73-Dye+NIR group, survival analysis was conducted by log-rank test with holm test for multiple comparisons (e).
ED Fig. 4. αCD73-Dye + NIR + αPD-1 combination treatment induced curative responses in the Pan02 tumor model.

(a) Diagram of the treatments. Pan02 tumor cells were s.c. injected on the left (2×10⁶ Pan02 cells) and right (5×10⁵ Pan02 cells) flanks of B6 mice, and treated on day 7 with control IgG, αPD-1, αCD73-Dye+αPD-1, αCD73-Dye+NIR, or αCD73-Dye+NIR+αPD-1 (Combo). NIR was performed on the left-side tumor only (right-side tumors were shielded from light). (b) Tumor growth curves of NIR-treated left tumors are shown (n=5 mice/group). (c) Tumor growth curves of non-NIR-treated right tumors are shown (n=5 mice/group). (d) Surviving curves of Pan02 tumor-bearing mice (n=10 mice/group). (e) Tumor growth curves and (f) survival curves of Pan02 tumor-bearing mice treated with αCD73-Dye+NIR+αPD-1 combo therapy together with the depletion of NK cells, CD4+ T cells or CD8+ T cells. Representative results from one of two repeated experiments are shown. Data are mean ± SD. # means ****P<0.0001, αCD73-Dye+NIR group compared with IgG, αPD-1, or αCD73-Dye+αPD-1 group; # means **P=0.00592, Combo group compared with αCD73-Dye+NIR group, ## means **** P<0.0001, Combo group compared with IgG, αPD-1, or αCD73-Dye+αPD-1 group, two-way ANOVA with Holm–Sidak test for multiple comparisons (c). ***P<0.001, αCD73-Dye+NIR group compared with IgG, αPD-1, or αCD73-Dye+αPD-1 group, ****P<0.0001, Combo group compared with IgG, αPD-1, αCD73-Dye+αPD-1, or αCD73-Dye+NIR group, survival analysis was conducted by log-rank test with holm test for multiple comparisons (d). ***P<0.001, Combo+αCD8 group compared with Combo+IgG, Combo+αNK1.1, or Combo+αCD4 group, two-way ANOVA with Holm–Sidak test for multiple comparisons (e). ***P<0.001, Combo+αCD8 group compared with Combo+IgG, Combo+αNK1.1, or Combo+αCD4 group, survival analysis was conducted by log-rank test with holm test for multiple comparisons (f).
ED Fig. 5. Effects of αCD73-Dye + NIR + αPD-1 combination treatment in the EMT6CD73 KO tumor model.

(a) FACS analysis for surface expression of CD73 in EMT6 CD73 knockout (EMT6CD73 KO) cells. (b) EMT6CD73 KO cells were treated as indicated in vitro. The percentage of dead cells was determined by FACS after PI staining (n=3 biological replicates). (c) BALB/c mice bearing both orthotopic EMT6CD73 KO tumor (5×10⁵ EMT6CD73 KO tumor cells injection in the mammary gland) and lung metastasis tumors (1×10⁵ EMT6CD73 KO tumor cells injection via tail vein) were treated on day 5 with control IgG, αPD-1, αCD73-Dye+αPD-1, αCD73-Dye+NIR, or αCD73-Dye+NIR+αPD-1 (Combo). NIR irradiation was given on the orthotopic tumor only (other parts of the mice were shielded from light). Mice survival curves (n=9/αPD-1 group, n=11/αCD73-Dye+NIR group, n=12/Combo group, n=10/other groups) are shown. Representative results from one of two repeated experiments are shown. Data are mean ± SD. # mean **P=0.00114439, Combo group compared with αCD73-Dye+NIR group; ## means ***P<0.001, Combo group compared with IgG, αPD-1, or αCD73-Dye+αPD-1 group, survival analysis was conducted by log-rank test with holm test for multiple comparisons (c).
ED Fig. 6. Effects of αCD73-Dye + NIR + αPD-1 combination therapy in human pancreatic cancer.

(a) CD73 protein levels in the HPA dataset. Most cancer tissues displayed strong to moderate membranous and cytoplasmic CD73 positivity. Lymphomas and testicular cancers showed weak positivity or were negative. (b) Cell number per 100 mg tumor tissue of indicated immune cell subsets were determined by FACS (n=3). (c) FACS analysis for surface expression of CD73 or B7H3 on cells isolated from pancreatic tumor specimens. Representative data are shown. (d) Diagram of organotypic tumor spheroids (OTS), modified from a published study62. (e) Human PDAC OTS were treated as indicated ex vivo. Cell death was tested by Nexcelom ViaStain AO/PI staining Solution. Green represents live cells; red represents dead cells. Orange bar: 50 μM. Representative data and summarized results are shown, n=8/group (2-3 OTS from each patient for each indicated treatment; and OTS from 3 patients were used). Data are mean ± SD. ***P<0.001, αCD73-Dye+NIR+αPD-1 group compared with any other groups, one-way ANOVA with Tukey’s correction (e).
Supplementary Material
Supplementary figures.
Source data
Source data
Source data
Source data
Source data
Source data
Source data
Source data
Source data
Source data
Source data
Source data
Acknowledgements
This work was supported by grants from the National Cancer Institute (NCI, 4R00CA190910-03; 1R37CA251318-01; 1R01CA248111-01A1; R01 CA258477-01; 1R01CA264102-01), NCI P30 Administrative Supplement for Cell-Based Therapy (3P30CA012197-44S5), Daryl and Marguerite Errett Discovery Award 2020, ACS Research Scholar Grant (RSG-19-149-01-LIB), Wake Forest Baptist Comprehensive Cancer Center (WFBCCC) Push Pilot projects and CPRIT Scholar (RR210067). Research reported in this publication was also supported by the National Center for Advancing Translational Sciences of the National Institutes of Health under Award Number UL1TR001420 (CTSI Pilot Grant Award 2018, CTSI Pilot Grant Award 2019, and CTSI Ignition Fund Pilot award). The authors wish to thank Indra M. Newman, Ph.D. from the Wake Forest CTSI, for manuscript editing assistance. This study was also supported by the National Cancer Institute’s Cancer Center Support Grant award number P30CA012197 issued to the Wake Forest Baptist Comprehensive Cancer Center. The content is solely the responsibility of the authors and does not necessarily represent the official views of the National Cancer Institute.
Footnotes
Competing interests
The authors declare no competing interests.
Data availability
The main data supporting the results in this study are available within the paper and its Supplementary Information. Source data for the figures are provided in this paper. The raw and analysed datasets generated during the study are too large to be publicly shared, yet they are available for research purposes from the corresponding author on reasonable request.
References
- 1.Reck M et al. Pembrolizumab versus Chemotherapy for PD-L1–Positive Non–Small-Cell Lung Cancer. N. Engl. J. Med 375, 1823–1833 (2016). [DOI] [PubMed] [Google Scholar]
- 2.Hodi FS et al. Improved survival with ipilimumab in patients with metastatic melanoma. N. Engl. J. Med 363, 711–23 (2010). [DOI] [PMC free article] [PubMed] [Google Scholar]
- 3.Adams S et al. Phase 2 study of pembrolizumab (pembro) monotherapy for previously treated metastatic triple-negative breast cancer (mTNBC): KEYNOTE-086 cohort A. ASCO 1008 (2017). doi:J Clin Oncol 2017;35 [Google Scholar]
- 4.Vonderheide RH et al. Tremelimumab in combination with exemestane in patients with advanced breast cancer and treatment-associated modulation of inducible costimulator expression on patient T cells. Clin. Cancer Res 16, 3485–3494 (2010). [DOI] [PubMed] [Google Scholar]
- 5.Patnaik A et al. Phase i study of pembrolizumab (MK-3475; Anti-PD-1 monoclonal antibody) in patients with advanced solid tumors. Clin. Cancer Res 21, 4286–4293 (2015). [DOI] [PubMed] [Google Scholar]
- 6.Brahmer JR et al. Safety and Activity of Anti–PD-L1 Antibody in Patients with Advanced Cancer. N. Engl. J. Med 366, 2455–2465 (2012). [DOI] [PMC free article] [PubMed] [Google Scholar]
- 7.Segal N et al. Preliminary data from a multi-arm expansion study of MEDI4736, an anti-PD-L1 antibody. | 2014 ASCO Annual Meeting | Abstracts | Meeting Library. Journal of Clinical Oncology 32:5s, 2014 (suppl; abstr 3002^) (2014). doi: 10.1200/jco.2014.32.15_suppl.3002 [DOI] [Google Scholar]
- 8.Royal RE et al. Phase 2 trial of single agent ipilimumab (Anti-CTLA-4) for locally advanced or metastatic pancreatic adenocarcinoma. J. Immunother 33, 828–833 (2010). [DOI] [PMC free article] [PubMed] [Google Scholar]
- 9.Sharma P, Hu-Lieskovan S, Wargo JA & Ribas A Primary, Adaptive, and Acquired Resistance to Cancer Immunotherapy. Cell 168, 707–723 (2017). [DOI] [PMC free article] [PubMed] [Google Scholar]
- 10.Granier C et al. Mechanisms of action and rationale for the use of checkpoint inhibitors in cancer. ESMO Open 2, e000213 (2017). [DOI] [PMC free article] [PubMed] [Google Scholar]
- 11.Bjoern J et al. Immunological correlates of treatment and response in stage IV malignant melanoma patients treated with Ipilimumab. Oncoimmunology 5, (2016). [DOI] [PMC free article] [PubMed] [Google Scholar]
- 12.Holmgaard RB, Zamarin D, Lesokhin A, Merghoub T & Wolchok JD Targeting myeloid-derived suppressor cells with colony stimulating factor-1 receptor blockade can reverse immune resistance to immunotherapy in indoleamine 2,3-dioxygenase-expressing tumors. EBioMedicine 6, 50–58 (2016). [DOI] [PMC free article] [PubMed] [Google Scholar]
- 13.Meyer C et al. Frequencies of circulating MDSC correlate with clinical outcome of melanoma patients treated with ipilimumab. Cancer Immunol. Immunother 63, 247–257 (2014). [DOI] [PMC free article] [PubMed] [Google Scholar]
- 14.Highfill SL et al. Disruption of CXCR2-mediated MDSC tumor trafficking enhances anti-PD1 efficacy. Sci. Transl. Med 6, (2014). [DOI] [PMC free article] [PubMed] [Google Scholar]
- 15.Gebhardt C et al. Myeloid Cells and Related Chronic Inflammatory Factors as Novel Predictive Markers in Melanoma Treatment with Ipilimumab. Clin. Cancer Res 21, 5453–9 (2015). [DOI] [PubMed] [Google Scholar]
- 16.Diaz-Montero CM, Finke J & Montero AJ Myeloid-derived suppressor cells in cancer: Therapeutic, predictive, and prognostic implications. Semin. Oncol 41, 174–184 (2014). [DOI] [PMC free article] [PubMed] [Google Scholar]
- 17.Kumar V, Patel S, Tcyganov E & Gabrilovich DI The Nature of Myeloid-Derived Suppressor Cells in the Tumor Microenvironment. Trends in Immunology 37, 208–220 (2016). [DOI] [PMC free article] [PubMed] [Google Scholar]
- 18.Talmadge JE & Gabrilovich DI History of myeloid-derived suppressor cells. Nat Rev Cancer 13, 739–752 (2013). [DOI] [PMC free article] [PubMed] [Google Scholar]
- 19.Colombo MP & Piconese S Regulatory T-cell inhibition versus depletion: The right choice in cancer immunotherapy. Nature Reviews Cancer 7, 880–887 (2007). [DOI] [PubMed] [Google Scholar]
- 20.Nishikawa H & Sakaguchi S Regulatory T cells in cancer immunotherapy. Current Opinion in Immunology 27, 1–7 (2014). [DOI] [PubMed] [Google Scholar]
- 21.Buckner JH Mechanisms of impaired regulation by CD4+CD25+FOXP3+ regulatory T cells in human autoimmune diseases. Nat. Rev. Immunol 10, 849–859 (2010). [DOI] [PMC free article] [PubMed] [Google Scholar]
- 22.Sato K, Nagaya T, Mitsunaga M, Choyke PL & Kobayashi H Near infrared photoimmunotherapy for lung metastases. Cancer Lett. 365, 112–121 (2015). [DOI] [PMC free article] [PubMed] [Google Scholar]
- 23.Mitsunaga M et al. Cancer cell-selective in vivo near infrared photoimmunotherapy targeting specific membrane molecules. Nat. Med 17, 1685–1691 (2011). [DOI] [PMC free article] [PubMed] [Google Scholar]
- 24.Sato K et al. Spatially selective depletion of tumor-associated regulatory T cells with near-infrared photoimmunotherapy. Sci. Transl. Med 8, (2016). [DOI] [PMC free article] [PubMed] [Google Scholar]
- 25.Mellman I, Coukos G & Dranoff G Cancer immunotherapy comes of age. Nature (2011). doi: 10.1038/nature10673 [DOI] [PMC free article] [PubMed] [Google Scholar]
- 26.Li P et al. BATF-JUN is critical for IRF4-mediated transcription in T cells. Nature (2012). doi: 10.1038/nature11530 [DOI] [PMC free article] [PubMed] [Google Scholar]
- 27.Elpek KG et al. The tumor microenvironment shapes lineage, transcriptional, and functional diversity of infiltrating myeloid cells. Cancer Immunol. Res (2014). doi: 10.1158/2326-6066.CIR-13-0209 [DOI] [PMC free article] [PubMed] [Google Scholar]
- 28.Tuit S et al. Transcriptional Signature Derived from Murine Tumor-Associated Macrophages Correlates with Poor Outcome in Breast Cancer Patients. Cell Rep. (2019). doi: 10.1016/j.celrep.2019.09.067 [DOI] [PMC free article] [PubMed] [Google Scholar]
- 29.Azambuja JH et al. Blockade of CD73 delays glioblastoma growth by modulating the immune environment. Cancer Immunol. Immunother (2020). doi: 10.1007/s00262-020-02569-w [DOI] [PMC free article] [PubMed] [Google Scholar]
- 30.Goswami S et al. Immune profiling of human tumors identifies CD73 as a combinatorial target in glioblastoma. Nature Medicine (2020). doi: 10.1038/s41591-019-0694-x [DOI] [PMC free article] [PubMed] [Google Scholar]
- 31.Beavis PA, Stagg J, Darcy PK & Smyth MJ CD73: A potent suppressor of antitumor immune responses. Trends in Immunology 33, 231–237 (2012). [DOI] [PubMed] [Google Scholar]
- 32.Buisseret L et al. Clinical significance of CD73 in triple-negative breast cancer: Multiplex analysis of a phase III clinical trial. Ann. Oncol (2018). doi: 10.1093/annonc/mdx730 [DOI] [PMC free article] [PubMed] [Google Scholar]
- 33.Azad A et al. PD-L1 blockade enhances response of pancreatic ductal adenocarcinoma to radiotherapy. EMBO Mol. Med 9, 167–180 (2017). [DOI] [PMC free article] [PubMed] [Google Scholar]
- 34.Corbett TH et al. Induction and Chemotherapeutic Response of Two Transplantable Ductal Adenocarcinomas of the Pancreas in C57BL/6 Mice. Cancer Res. 44, 717–726 (1984). [PubMed] [Google Scholar]
- 35.Allard B, Pommey S, Smyth MJ & Stagg J Targeting CD73 enhances the antitumor activity of anti-PD-1 and anti-CTLA-4 mAbs. Clin. Cancer Res (2013). doi: 10.1158/1078-0432.CCR-13-0545 [DOI] [PubMed] [Google Scholar]
- 36.Stagg J et al. Anti-CD73 antibody therapy inhibits breast tumor growth and metastasis. Proc. Natl. Acad. Sci. U. S. A (2010). doi: 10.1073/pnas.0908801107 [DOI] [PMC free article] [PubMed] [Google Scholar]
- 37.de Mingo Pulido Á et al. TIM-3 Regulates CD103+ Dendritic Cell Function and Response to Chemotherapy in Breast Cancer. Cancer Cell (2018). doi: 10.1016/j.ccell.2017.11.019 [DOI] [PMC free article] [PubMed] [Google Scholar]
- 38.Lin EY et al. Progression to Malignancy in the Polyoma Middle T Oncoprotein Mouse Breast Cancer Model Provides a Reliable Model for Human Diseases. Am. J. Pathol 163, 2113–2126 (2003). [DOI] [PMC free article] [PubMed] [Google Scholar]
- 39.Guy CT, Cardiff RD & Muller WJ Induction of mammary tumors by expression of polyomavirus middle T oncogene: a transgenic mouse model for metastatic disease. Mol. Cell. Biol 12, 954–961 (1992). [DOI] [PMC free article] [PubMed] [Google Scholar]
- 40.Uhlen M et al. Tissue-based map of the human proteome. Science (80-. ). 347, 1260419–1260419 (2015). [DOI] [PubMed] [Google Scholar]
- 41.Bedard PL, Hansen AR, Ratain MJ & Siu LL Tumour heterogeneity in the clinic. Nature 501, 355–364 (2013). [DOI] [PMC free article] [PubMed] [Google Scholar]
- 42.Agarwal R & Kaye SB Ovarian cancer: Strategies for overcoming resistance to chemotherapy. Nature Reviews Cancer 3, 502–516 (2003). [DOI] [PubMed] [Google Scholar]
- 43.Lackner MR, Wilson TR & Settleman J Mechanisms of acquired resistance to targeted cancer therapies. Future Oncology 8, 999–1014 (2012). [DOI] [PubMed] [Google Scholar]
- 44.Neel DS & Bivona TG Resistance is futile: overcoming resistance to targeted therapies in lung adenocarcinoma. npj Precis. Oncol 1, 3 (2017). [DOI] [PMC free article] [PubMed] [Google Scholar]
- 45.Vijayan D, Young A, Teng MWL & Smyth MJ Targeting immunosuppressive adenosine in cancer. Nat. Rev. Cancer 17, 709–724 (2017). [DOI] [PubMed] [Google Scholar]
- 46.Chen S et al. CD73 expression on effector T cells sustained by TGF-β facilitates tumor resistance to anti-4–1BB/CD137 therapy. Nat. Commun (2019). doi: 10.1038/s41467-018-08123-8 [DOI] [PMC free article] [PubMed] [Google Scholar]
- 47.De Leve S, Wirsdörfer F & Jendrossek V Targeting the immunomodulatory CD73/adenosine system to improve the therapeutic gain of radiotherapy. Frontiers in Immunology (2019). doi: 10.3389/fimmu.2019.00698 [DOI] [PMC free article] [PubMed] [Google Scholar]
- 48.Zhang B CD73: A novel target for cancer immunotherapy. Cancer Research (2010). doi: 10.1158/0008-5472.CAN-10-1544 [DOI] [PMC free article] [PubMed] [Google Scholar]
- 49.Leone RD & Emens LA Targeting adenosine for cancer immunotherapy. Journal for ImmunoTherapy of Cancer (2018). doi: 10.1186/s40425-018-0360-8 [DOI] [PMC free article] [PubMed] [Google Scholar]
- 50.Mixed Reviews for A2AR Inhibitor in NSCLC. Cancer discovery 9, OF2 (2019). [DOI] [PubMed] [Google Scholar]
- 51.Narravula S, Lennon PF, Mueller BU & Colgan SP Regulation of Endothelial CD73 by Adenosine: Paracrine Pathway for Enhanced Endothelial Barrier Function. J. Immunol (2000). doi: 10.4049/jimmunol.165.9.5262 [DOI] [PubMed] [Google Scholar]
- 52.Yu M et al. CD73 on cancer-associated fibroblasts enhanced by the A2B-mediated feedforward circuit enforces an immune checkpoint. Nat. Commun (2020). doi: 10.1038/s41467-019-14060-x [DOI] [PMC free article] [PubMed] [Google Scholar]
- 53.Seaman S et al. Eradication of Tumors through Simultaneous Ablation of CD276/B7-H3-Positive Tumor Cells and Tumor Vasculature. Cancer Cell 31, 501–515.e8 (2017). [DOI] [PMC free article] [PubMed] [Google Scholar]
- 54.Keen JC & Moore HM The genotype-tissue expression (GTEx) project: Linking clinical data with molecular analysis to advance personalized medicine. J. Pers. Med 5, 22–29 (2015). [DOI] [PMC free article] [PubMed] [Google Scholar]
- 55.Yu NYL et al. Complementing tissue characterization by integrating transcriptome profiling from the human protein atlas and from the FANTOM5 consortium. Nucleic Acids Res. 43, 6787–6798 (2015). [DOI] [PMC free article] [PubMed] [Google Scholar]
- 56.Sciarra A et al. CD73 expression in normal and pathological human hepatobiliopancreatic tissues. Cancer Immunol. Immunother (2019). doi: 10.1007/s00262-018-2290-1 [DOI] [PMC free article] [PubMed] [Google Scholar]
- 57.Bown SG et al. Photodynamic therapy for cancer of the pancreas. Gut 50, 549–57 (2002). [DOI] [PMC free article] [PubMed] [Google Scholar]
- 58.Xue G, Jin G, Fang J & Lu Y IL-4 together with IL-1β induces antitumor Th9 cell differentiation in the absence of TGF-β signaling. Nat. Commun 10, 1376 (2019). [DOI] [PMC free article] [PubMed] [Google Scholar]
- 59.Brinke A Ten et al. Monitoring T-cell responses in translational studies: Optimization of dye-based proliferation assay for evaluation of antigen-specific responses. Front. Immunol (2017). doi: 10.3389/fimmu.2017.01870 [DOI] [PMC free article] [PubMed] [Google Scholar]
- 60.Mao C, Li F, Zhao Y, Debinski W & Ming X P-glycoprotein-targeted photodynamic therapy boosts cancer nanomedicine by priming tumor microenvironment. Theranostics (2018). doi: 10.7150/thno.29580 [DOI] [PMC free article] [PubMed] [Google Scholar]
- 61.Jenkins RW et al. Ex vivo profiling of PD-1 blockade using organotypic tumor spheroids. Cancer Discov. 8, 196–215 (2018). [DOI] [PMC free article] [PubMed] [Google Scholar]
- 62.Ootani A et al. Sustained in vitro intestinal epithelial culture within a Wnt-dependent stem cell niche. Nat. Med (2009). doi: 10.1038/nm.1951 [DOI] [PMC free article] [PubMed] [Google Scholar]
- 63.Lu Y et al. Th9 cells promote antitumor immune responses in vivo. J. Clin. Invest 122, 4160–4171 (2012). [DOI] [PMC free article] [PubMed] [Google Scholar]
- 64.Lu Y et al. Th9 Cells Represent a Unique Subset of CD4+ T Cells Endowed with the Ability to Eradicate Advanced Tumors. Cancer Cell 33, 1048–1060.e7 (2018). [DOI] [PMC free article] [PubMed] [Google Scholar]
Associated Data
This section collects any data citations, data availability statements, or supplementary materials included in this article.
Supplementary Materials
Supplementary figures.
Source data
Source data
Source data
Source data
Source data
Source data
Source data
Source data
Source data
Source data
Source data
Source data
Data Availability Statement
The main data supporting the results in this study are available within the paper and its Supplementary Information. Source data for the figures are provided in this paper. The raw and analysed datasets generated during the study are too large to be publicly shared, yet they are available for research purposes from the corresponding author on reasonable request.