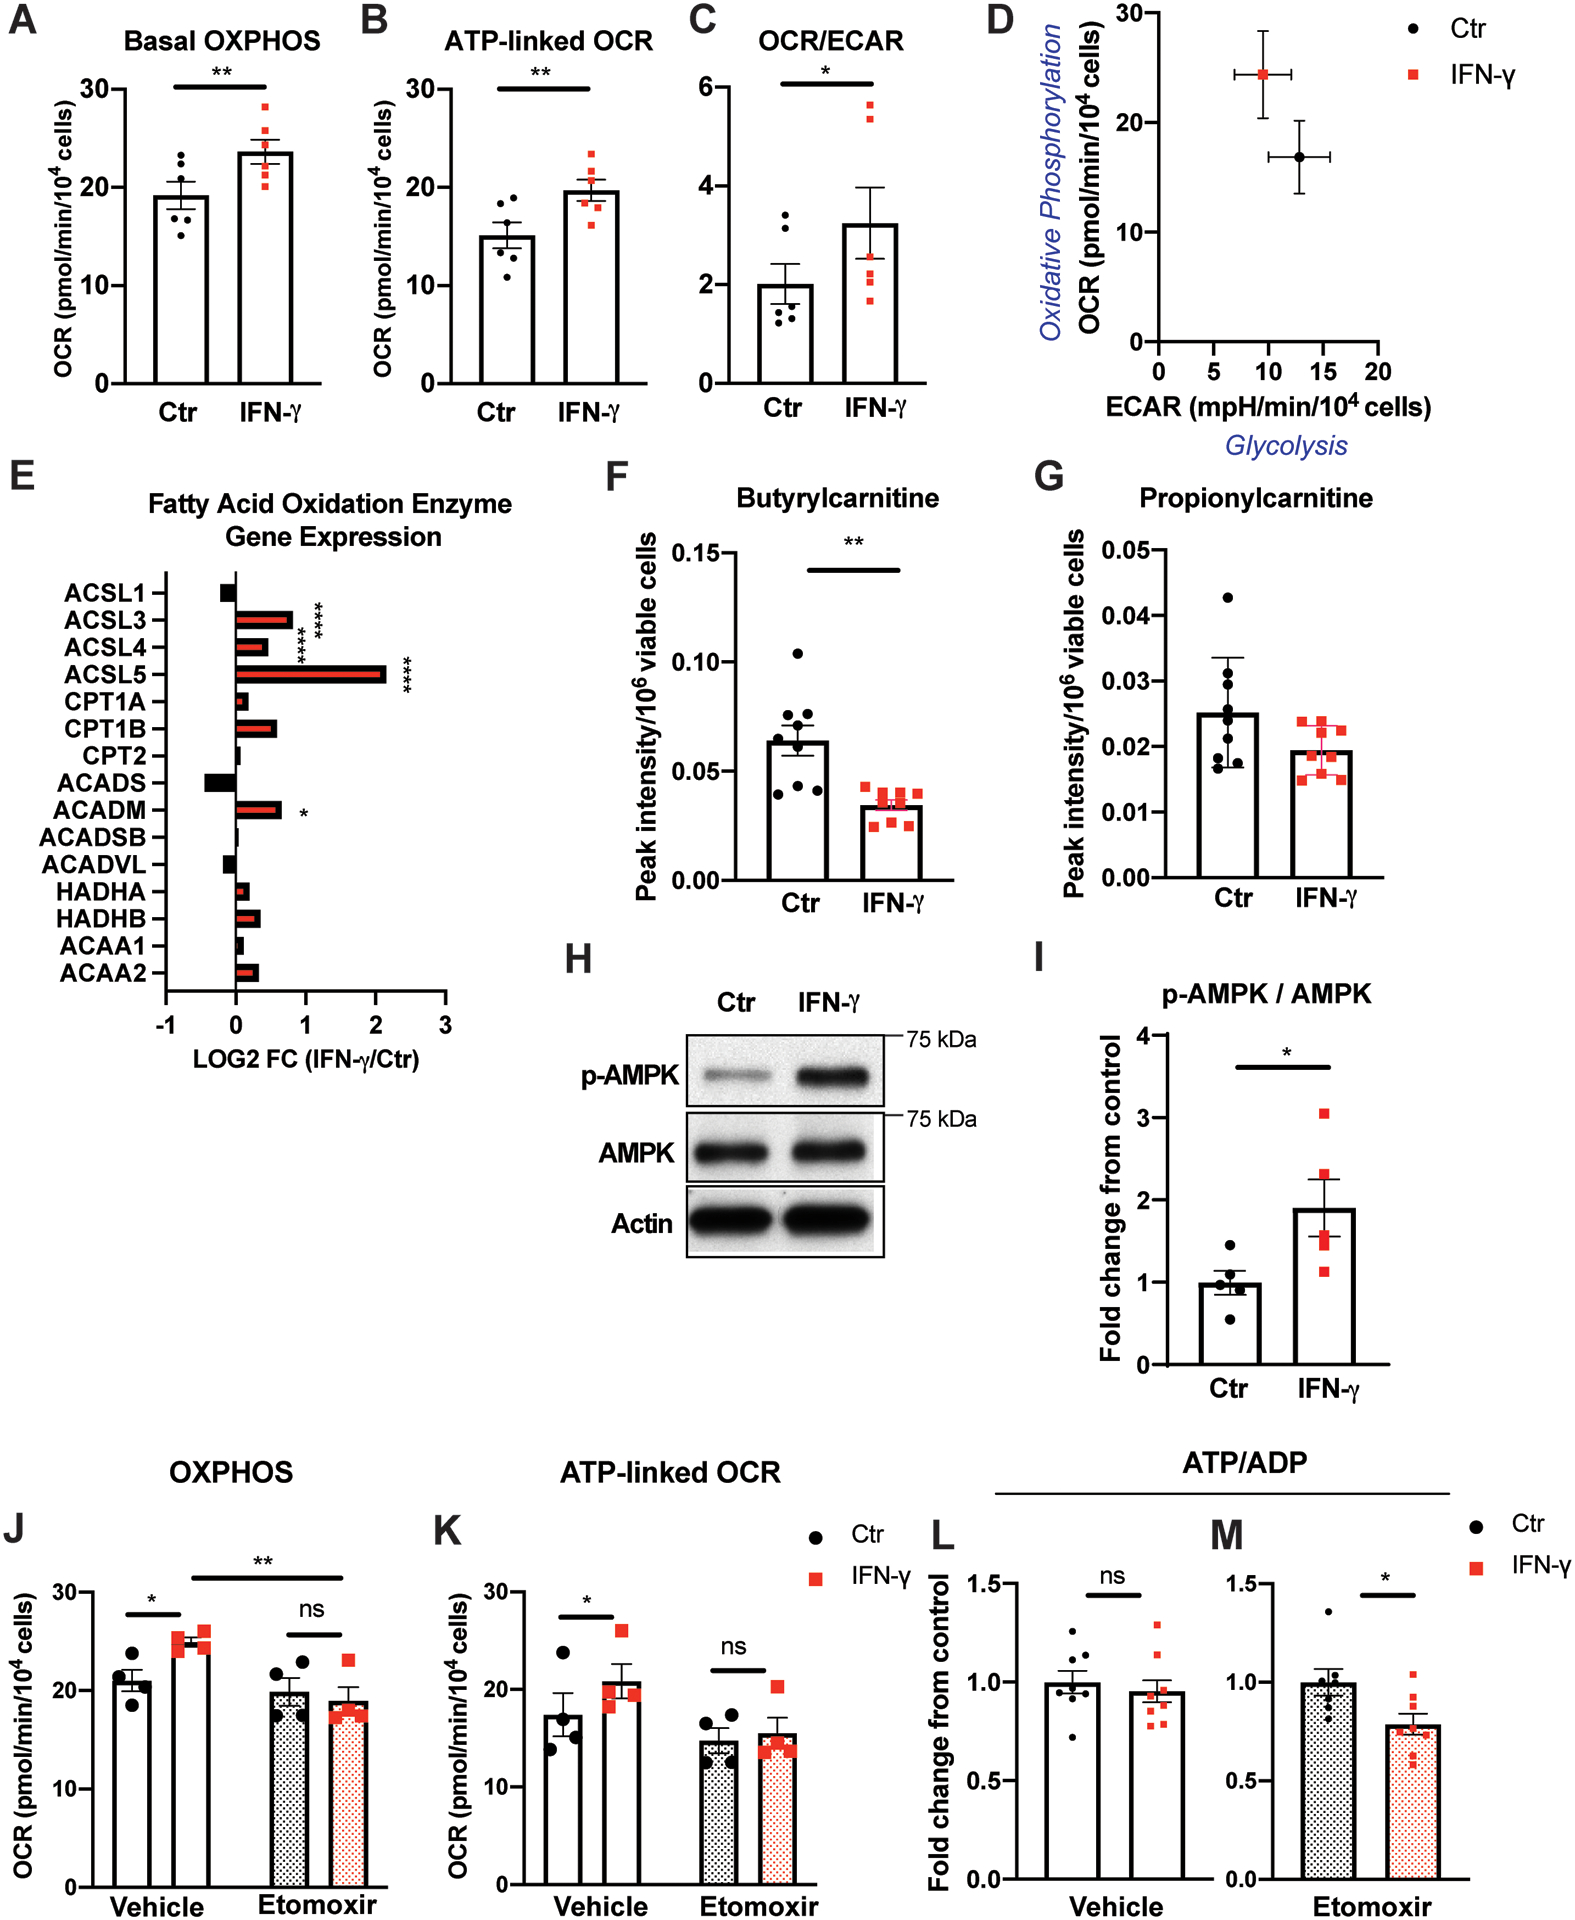
Figure 6. IFN-γ activates fatty acid oxidation in HCAEC.

A, Real time extracellular flux analysis of mitochondrial oxygen consumption rate reflecting oxidative phosphorylation (OXPHOS) of HCAEC following IFN-γ treatment at 50 ng/ml for 24 h.
B, Mitochondrial oxygen consumption associated with ATP production from the same experiments.
C, IFN-γ-induced changes in the ratio between mitochondrial OCR and ECAR representing decreased glycolysis and increased OXPHOS in HCAEC. Mean ± SEM from 6 independent experiments (A-C). Statistical significance was assessed using paired two-tailed Student’s t-tests (A-B) or Wilcoxon matched-pairs signed rank test (C).
D, Representative plot demonstrating altered basal glycolysis and oxidative phosphorylation activities in HCAEC following the same IFN-γ treatment in a single experiment. Mean ± SEM from 9–10 biological replicates.
E, IFN-γ induces gene expression changes in the fatty acid oxidation enzymes by RNASeq analysis of HCAEC obtained in biological triplicates. Statistical significance was determined based on the p-values adjusted for multiple test hypotheses by Benjamini-Hochberg procedure.
F-G, Intracellular acylcarnitines (butyrylcarnitine (F) and propionylcarnitine (G)) in HCAEC measured by LC-MS following the same IFN-γ treatment. Mean ± SEM of 9 biological replicates from 3 independent experiments. Statistical significance was assessed using Welch’s t-test.
H-I, Phosphorylation of AMP-activated protein kinase (AMPK) at Thr 172 following 7 h of IFN-γ treatment at 50 ng/mL. Representative Western blot (H) and densitometric analysis (I). Mean ± SEM from 3 independent experiments analyzed by two-tailed Student’s t-test.
J, Real time extracellular flux analysis of basal OXPHOS of HCAEC following the same IFN-γ treatment with and without 1 h 10 μM etomoxir incubation just prior to analysis.
K, Mitochondrial oxygen consumption associated with ATP production from the same experiments. Mean ± SEM from 4 independent experiments (J-K). Statistical significance was assessed by 2-way ANOVA with Sidak’s multiple comparison tests.
L-M, Intracellular ATP/ADP ratios detected in HCAEC following the IFN-γ treatment with (M) and without (L) etomoxir. Data represent mean fold changes with IFN-γ treatment compared to those not exposed to IFN-γ within each inhibitor treatment group ± SEM from 7–9 independent experiments. Statistical significance was assessed using a two-tailed Student’s t-test.
*p < 0.05, ** p < 0.01, **** p < 0.0001
ACAA: Acetyl-CoA acyltransferase, ACADM: Acyl-CoA dehydrogenase medium chain, ACADS: Acyl-CoA dehydrogenase short chain, ACADSB: Acyl-CoA dehydrogenase short/branched chain, ACADVL: Acyl-CoA dehydrogenase very long chain, ACSL: Acyl-CoA synthetase long chain family member, CPT: Carnitine palmitoyltransferase, HADH: Hydroxyacyl-CoA dehydrogenase trifunctional multienzyme complex.
