

Abstract
Objectives
We aim to analyse the trends and causes of mortality among adults in Addis Ababa.
Setting
This analysis was conducted using verbal autopsy data from the Addis Ababa Mortality Surveillance in Addis Ababa, Ethiopia.
Participants
All deceased adults aged 15 years and above between 2007–2012 and 2015–2017 were included in the analysis.
Outcome measures
We collected verbal autopsy and conducted physician review to ascertain cause of death.
Result
A total of 7911 data were included in this analysis. Non-communicable disease (NCD) accounted for 62.8% of adult mortality. Mortality from communicable diseases, maternal conditions and nutritional deficiencies followed this by accounting for 30.3% of total mortality. Injury accounted for 6.8% of total mortality. We have observed a significant decline in mortality attributed to group one cause of death (43.25% in 2007 to 12.34% in 2017, p<0.001). However, we observed a significant increase in mortality attributed to group II cause of death (from 49.95% in 2007 to 81.17% in 2017, p<0.001). The top five leading cause of death in 2017 were cerebrovascular disease (12.8%), diabetes mellitus (8.1%), chronic liver disease (6.3%), hypertension (5.7%), ischaemic heart disease (5.7%) and other specified neoplasm (5.2%).
Conclusion
We documented an epidemiological shift in cause of mortality from communicable diseases to NCD over 10 years. There is a great progress in reducing mortality due to communicable diseases over the past years. However, the burden of NCDs call for actions for improving access to quality health service, improved case detection and community education to increase awareness. Integrating NCD intervention in to a well-established and successful programme targeting communicable diseases in the country might be beneficial for improving provision of comprehensive healthcare.
Keywords: public health, epidemiology, epidemiology
Strengths and limitations of this study.
A validated verbal autopsy tool was used to ascertain the cause of death.
The exclusion of dead bodies with no close relatives or friends and those with incomplete addresses from the sampling frame could affect the finding.
Some non-residents of Addis Ababa may have been buried in Addis Ababa and some residents may be buried outside of the Addis Ababa.
Introduction
Ethiopia has achieved substantial improvement in child survival, reducing maternal mortality and life expectancy, which is mostly attributable to large-scale implementation of promotive, preventive and curative primary healthcare interventions alongside a positive trend of socioeconomic changes.1 2 In Ethiopia, death caused by communicable, maternal, neonatal and nutrition have reduced significantly. Mortality due to injury have also declined by 70%.3 However, mortality due to non-communicable disease (NCD) has increased by 38% between 2000 and 2016.4 This indicates the epidemiological transition in Ethiopia, a transition in disease burden that is mainly from infectious diseases to NCDs.5 While most global and national public health initiatives focus on reducing under 5 mortality, substantial reduction in adult mortality can also be achieved. However, focused interventions for reducing adult mortality are restrained by insufficiency of data.6–8
Policy-makers and public health officials need information about the distribution of deaths by cause to set priorities, policies, as well as for planning healthcare needs.9 However, in most low/middle-income countries, there is a lack of reliable data that can be used to guide health policy-making and measure the performance of newly developed policy frameworks and approaches.3 Ethiopia is among the countries with poorly functioning vital registration system. In addition, majority of deaths happen out of healthcare organisation mainly because of poor availability and utilisation of health services. Due to this, mortality data found from health organisations is incomplete.10
The desired standard to determine cause of death is a death certificate completed by a doctor, who is familiar with the medical history and diagnosis of the deceased based on appropriate diagnostics tests. However, in counters with poorly functioning vital registration system and where majority of deaths happen outside of health facilities, verbal autopsy (VA) is used to determine and describe distribution of causes of death.11–13 VA is an alternative method of gathering information about symptoms and circumstances for a deceased individual from relative or caregiver who closely attended the deceased before his/her death to determine their cause of death. It is used to identify the distribution of causes of mortality in population.14–16 Hence, we use the data from an ongoing mortality surveillance programme to determine the causes of death among adults in Addis Ababa, Ethiopia. Additionally, we analysed the distribution and trends (2007–2017) of causes of deaths.
Methods
Study settings
The present analysis used data from the Addis Ababa Mortality Surveillance Programme (AAMSP). The AAMSP which was established in 2001 conduct surveillance of burial continuously in all cemeteries (n=73) in Addis Ababa to monitor mortality burden. Since 2007, VA was incorporated into the surveillance to investigate cause specific mortality burden of communicable, NCDs and injury in in Addis Ababa. The present analysis used burial data collected from 2007–2012 to 2015–2017. There was interruption in data collection in 2013 and 2014.
Addis Ababa, the capital of Ethiopia, has an estimated total population of above 3 million of which 47.5% were males and 52.5% were females according to 2013 total population projection of Ethiopia.17
Data collection
The data for the AAMSP were collected by trained cemetery clerks. These trained cemetery clerks continually register name, address, age, sex, religion, marital status, place of death and perceived causes of death of the deceased (ie, Lay report of the cause of death of the deceased) from relatives or close caretaker while they are arranging the burial). This served as a sampling frame for VAs. We have used 10% of randomly selected records from the ongoing surveillance for VA after excluding the deceased whose address was not registered and those bodies that were buried by municipal, police and hospitals. The sampling frame was all recorded death within a month from all burial sites. Using this sampling frame, the data manger draws 10% of the records randomly. Next, VA was conducted between 2 and 3 months by taking the mourning period into consideration.
We ascertained cause of death through physician review. Reviewer physicians were trained on the appropriate use of the International Classification of Disease (ICD) manual. Two physicians independently reviewed the completed VA questionnaire to determine probable cause/s of death. VA reviews that were inconsistent among the first two physicians were reviewed by a third independent physician. When the cause of death determined by all three physicians is different, the three physicians sat for panel and assigned cause of death together. If the three physicians did not agree on the cause of death it was classified as undetermined cause of death. When physicians had difficulties to classify disease based on the provided information the case was classified as ‘unspecified causes of death (VA-99)’.
Classification of causes of death
The 2006 Global Burden of Diseases classification was adapted to classify the cause of deaths in our study. This classification categorised diseases into group I (communicable diseases, maternal conditions and nutritional deficiencies); group II (non-communicable causes) and group III (injuries).18 Group I cause of death includes mortality due to infectious and parasitic disease, nutritional disorder and pregnancy childbirth and puerperium-related disorders. Group II cause of death includes mortality due to disease of the circulatory system, gastrointestinal disorders, mental and nervous system, neoplasms, perinatal cause of death, renal disorders, respiratory disorders, endocrine disorders and other specified cause of death. Group III cause of death includes mortality due to external cause of death, drugs, medicaments and biological substances, drugs, medicaments and biological substances causing adverse effects in therapeutic use and misadventure to patient during surgical and medical care.
Data management and analysis
Data were double entered to Access Microsoft Office spreadsheet and cleaned using STATA. We analysed the data using Stata V.16.0 (Stata). We used frequencies and proportions to describe the sociodemographic characteristics of the deceased individuals. Percentages and proportional mortality ratios were calculated. Differences in the cause of death, among groups were reported using Pearson’s χ2 test. Statistical significance was set at p<0.05. This article is prepared following the reporting checklist for cross sectional study (STROBE).19
Patients and public involvement
Patients and the public were not involved in this study, including data collection, analysis and interpretation.
Result
A total of 133 170 deaths were recorded in all 73 cemeteries in Addis Ababa from 2007 to 2017. We initially included a total of 8842 death, out of this we have excluded 931 (10.53%) unspecified cause of death. Out of the total unspecified cause of death, 422 (9.26%) were recorded among male and 509 (11.88%) were recorded among female. After excluding unspecified cause of death, we have included 7911 sample for the present analysis. Table 1 shows the sociodemographic characteristics of the deceased. As indicated in the table 34.2% of the deceased were between the ages of 55 and 74 years. The median age of the deceased was 60 years. Of the total deceased, 44.1% were married and 38.6% were illiterate (table 1).
Table 1.
Sociodemographic characteristics of deceased in Addis Ababa, Ethiopia from 2007 to 2017
| Characteristics of deceased | N (%) |
| Sex | |
| Male | 4137 (52.3) |
| Female | 3774 (47.7) |
| Age group | |
| 15–34 | 1270 (16.1) |
| 35–54 | 2032 (25.6) |
| 55–74 | 2704 (34.2) |
| 74+ | 1905 (24.1) |
| Education | |
| Above Secondary | 687 (9.4) |
| Secondary | 1542 (21.2) |
| Primary | 1740 (23.9) |
| Illiterate | 2808 (38.6) |
| Others | 235 (3.2) |
| unknown | 267 (3.7) |
| Marital status | |
| Single | 1370 (18.8) |
| Married | 3209 (44.1) |
| Divorced | 724 (9.9) |
| Widowed | 1954 (26.9) |
| Unknown | 22 (0.3) |
| Religion | |
| Orthodox | 6412 (88.1) |
| Muslim | 619 (8.5) |
| Others | 248 (3.4) |
Table 2 shows the distribution of the causes of mortality in three groups across gender. The highest cause of deaths was attributed to ‘BoD group I’ - NCDs (62.8%; 95% CI 61.8% to 63.9%). The second highest cause of death was attributed to ‘BoD group II’—communicable diseases (30.3%; 95% CI 29.3% to 31.4%). In addition, 6.8% (94% CI 6.3% to 7.4%) of the total deaths was attributed to ‘BoD group III’—injuries. We observed difference in the distribution of the causes of death by sex. As indicated below a larger proportion of females (32.7%) compared with males (28.2%) has died from ‘BoD group I’ (χ2=18.5929, p<0.001). Similarly, distribution of death from ‘BoD group II’ disease was higher among female (64.4%) compared with male (61.4%) (χ2=7.8167, p<0.005). In contrast, a higher proportion of males (10.4%) than female (2.9%) died from ‘BoD group III’ disease (χ2=174.4141, p<0.001).
Table 2.
Causes of mortality distribution by gender in Addis Ababa, Ethiopia, 2007–2017
| Cause of death | No | % (95% CI) | ||
| Male | Female | Total | ||
| Group I | 2400 | 28.2 (26.9 to 29.6) | 32.7 (31.2 to 34.2) | 30.3 (29.3 to 31.4) |
| HIV/AIDS | 975 | 10.7 (9.8 to 11.6) | 14.1 (13.1 to 15.3) | 12.3 (11.6 to 13.1) |
| Tuberculosis | 519 | 7.3 (6.6 to 8.2) | 5.7 (5 to 6.5) | 6.6 (6 to 7.1) |
| Acute lower respiratory Infections | 202 | 2.5 (2.1 to 3.1) | 2.6 (2.1 to 3.1) | 2.6 (2.2 to 2.9) |
| Meningitis | 80 | 0.8 (0.6 to 1.1) | 1.2 (0.9 to 1.6) | 1.0 (0.8 to 1.3) |
| Pregnancy childbirth and puerperium-related disorders | 28 | – | 0.7 (0.5 to 1.1) | 0.4 (0.2 to 0.5) |
| Perinatal causes of death | 3 | – | 0.1 (0 to 0.2) | 0.0 (0.0 to 0.1) |
| Nutritional deficiency | 14 | 0.2 (0.1 to 0.4) | 0.2 (0.1 to 0.4) | 0.2 (0.1 to 0.3) |
| Other infectious and parasitic diseases | 582 | 6.7 (6 to 7.5) | 8.1 (7.3 to 9) | 7.4 (6.8 to 8) |
| Group II | 4970 | 61.4 (59.9 to 62.8) | 64.4 (62.9 to 65.9) | 62.8 (61.8 to 63.9) |
| Neoplasm | 963 | 9.1 (8.3 to 10) | 15.5 (14.4 to 16.7) | 12.2 (11.5 to 12.9) |
| Diabetes mellitus | 415 | 5.8 (5.1 to 6.5) | 4.7 (4 to 5.4) | 5.2 (4.8 to 5.8) |
| Hypertension | 780 | 9.6 (8.7 to 10.5) | 10.2 (9.2 to 11.2) | 9.9 (9.2 to 10.5) |
| Neuropsychiatric conditions | 227 | 2.8 (2.3 to 3.4) | 2.9 (2.4 to 3.5) | 2.9 (2.5 to 3.3) |
| Cardiovascular diseases | 800 | 9.9 (9.01 to 10.8) | 10.4 (9.4 to 11.4) | 10.1 (9.5 to 10.8) |
| Cerebrovascular diseases | 565 | 7.03 (6.3 to 7.9) | 7.3 (6.5 to 8.1) | 7.1 (6.6 to 7.7) |
| Respiratory diseases | 219 | 2.6 (2.2 to 3.1) | 2.9 (2.4 to 3.4) | 2.7 (2.4 to 3.1) |
| Digestive diseases | 668 | 10.5 (9.6 to 11.4) | 6.2 (5.5 to 7) | 8.4 (7.9 to 9.1) |
| Genitourinary disease | 317 | 4 (3.4 to 4.6) | 4.1 (3.5 to 4.7) | 4.0 (3.6 to 4.5) |
| Group III | 541 | 10.4 (9.5 to 11.4) | 2.9 (2.4 to 3.5) | 6.8 (6.3 to 7.4) |
| Unintentional | 397 | 7.4 (6.6 to 8.2) | 2.4 (2 to 3) | 5 (4.6 to 5.5) |
| Intentional | 114 | 3 (2.6 to 3.6) | 0.5 (0.3 to 0.8) | 1.8 (1.5 to 2.1) |
Among NCDs, the leading cause of death is cardiovascular disease accounting for 27.1% of total deaths. Among communicable diseases, HIV/AIDS is the leading cause of death accounting for 14.1% of total death.
Figure 1 shows causes of death across different age groups. As indicated below the distribution of death from ‘BoD group I’ and ‘BoD group III’ cause of death was more common among adults aged 15–34 (p<0.001) while distribution of death from ‘BoD group II’ cause of death was more common among adults aged 35 and above (p<0.001).
Figure 1.

Mortality from a group I, II and III diseases across different age groups in Addis Ababa, Ethiopia from 2007 to 2017.
Figure 2 shows the distribution of cause of death in three groups over 10-year period. Significant decline in the distribution of death from ‘BoD group I’ diseases was observed with a reduction from 43.25% in 2007 to 12.34% in 2017 (χ2=461.1855, p<0.001). However, an overall trend of significant increase (χ2=418.9887, p<0.001) from 49.95% in 2007 to 81.17% in 2017 was observed in the distribution of death from ‘BoD group II’ diseases. In addition, the distribution of top 10 causes of death over 10-year period can be found in online supplemental annex 1.
Figure 2.

Trend of mortality from group I, II and III diseases, Addis Ababa, Ethiopia, 2007–2017.
bmjopen-2020-047095supp001.pdf (120.2KB, pdf)
Table 3 shows 10 top leading cause of death by sex. The top five leading cause of death among males were cerebrovascular disease (12.8%), diabetes mellitus (8.1%), chronic liver disease (7.8%), ischaemic heart disease (6.7%) and hypertensive disease (6.15%). Among females, the top five leading cause of death were cerebrovascular disease (12.9%), diabetes mellitus (8.1%), congestive heart failure (5.9%), hypertensive disease (5.1%), malignant neoplasm of breast (4.8%) and malignant neoplasm of cervix (4.8%). In addition, the top 15 cause of death disaggregated by sex, age and year can be found in online supplemental annex 2.
Table 3.
Mortality distribution by gender for top 10 causes of death in 2017
| Top 10 leading cause of death for male | ||
| Rank | Cause of death | % (95% CI) |
| 1 | Cerebrovascular disease | 12.8 (9.7 to 16.64) |
| 2 | Diabetes mellitus | 8.1 (5.65 to 11.35) |
| 3 | Chronic liver disease | 7.8 (5.42 to 11.04) |
| 4 | Ischaemic heart disease | 6.7 (4.5 to 9.75) |
| 5 | Hypertensive diseases | 6.1 (4.05 to 9.11) |
| 6 | Other specified neoplasm | 5.8 (3.83 to 8.78) |
| 7 | Congestive heart failure | 4.2 (2.52 to 6.8) |
| 8 | Other transport accident* | 4.2 (2.52 to 6.8) |
| 9 | Renal failure | 3.6 (2.1 to 6.12) |
| 10 | Tuberculosis | 3.6 (2.1 to 6.12) |
| 11 | Acute lower respiratory tract infection | 3.3 (1.9 to 5.78) |
| 12 | Intentional self-harm† | 3.1 (1.69 to 5.43) |
| Top 10 leading cause of death for female | ||
| Rank | Cause of death | % (95% CI) |
| 1 | Cerebrovascular disease | 12.9 (9.37 to 17.4) |
| 2 | Diabetes Mellitus | 8.1 (5.38 to 11.98) |
| 3 | Congestive heart failure | 5.9 (3.63 to 9.39) |
| 4 | Hypertensive diseases | 5.1 (3.06 to 8.51) |
| 5 | Malignant neoplasm of breast | 4.8 (2.79 to 8.06) |
| 5 | Malignant neoplasm of cervix | 4.8 (2.79 to 8.06) |
| 6 | HIV‡ | 4.4 (2.51 to 7.6) |
| 6 | Chronic liver disease | 4.4 (2.51 to 7.61) |
| 6 | Ischaemic heart disease | 4.4 (2.51 to 7.61) |
| 6 | Other specified neoplasm | 4.4 (2.51 to 7.61) |
| 7 | Tuberculosis | 4.0 (2.25 to 7.16) |
| 8 | Disorder of kidney, ureter, unspecified§ | 3.3 (1.72 to 6.24) |
| 9 | Asthma‡ | 2.9 (1.47 to 5.77) |
| 10 | Renal failure | 2.6 (1.22 to 5.3) |
| 10 | Acute lower respiratory tract infection | 2.6 (1.22 to 5.3) |
| 10 | Specified mental disorder¶ | 2.6 (1.22 to 5.3) |
*Rank 15th for female top cause of death.
†Rank 14th for female top cause of death.
‡Rank 13th for male top cause of death.
§Rank 11th for male top cause of death.
¶Rank 14th for male top cause of death.
Figure 3 shows the leading cause of deaths ranked and compared between 2007 and 2017. In 2007, the first five causes of deaths were from both communicable and NCDs (HIV/AIDS (first), hypertensive disease (second), chronic liver disease (third), tuberculosis (fourth) and cerebrovascular disease (fifth)). On the contrary, in 2017, the causes of death that ranked first to fifth were all NCDs (cerebrovascular disease (first), chronic liver disease (second), congestive heart failure (third), diabetes mellitus (fourth) and hypertensive disease (fifth)). From the five leading causes in 2007 HIV/AIDS, hypertensive disease and tuberculosis, all saw a reduction while chronic liver disease and cerebrovascular disease saw increment from 2007 to 2017. HIV/AIDS has dropped from the first leading cause of death in 2007 to the ninth cause of death in 2017 with a 22.9% reduction. Hypertensive disease and tuberculosis had a 6.61% and 1.64% reduction, respectively. On the contrary, chronic liver disease showed a 0.79% increase, however, it was the third leading cause of death both in 2007 and in 2017. Similarly, cerebrovascular disease had 8.35% increase, ranking first in 2017.
Figure 3.
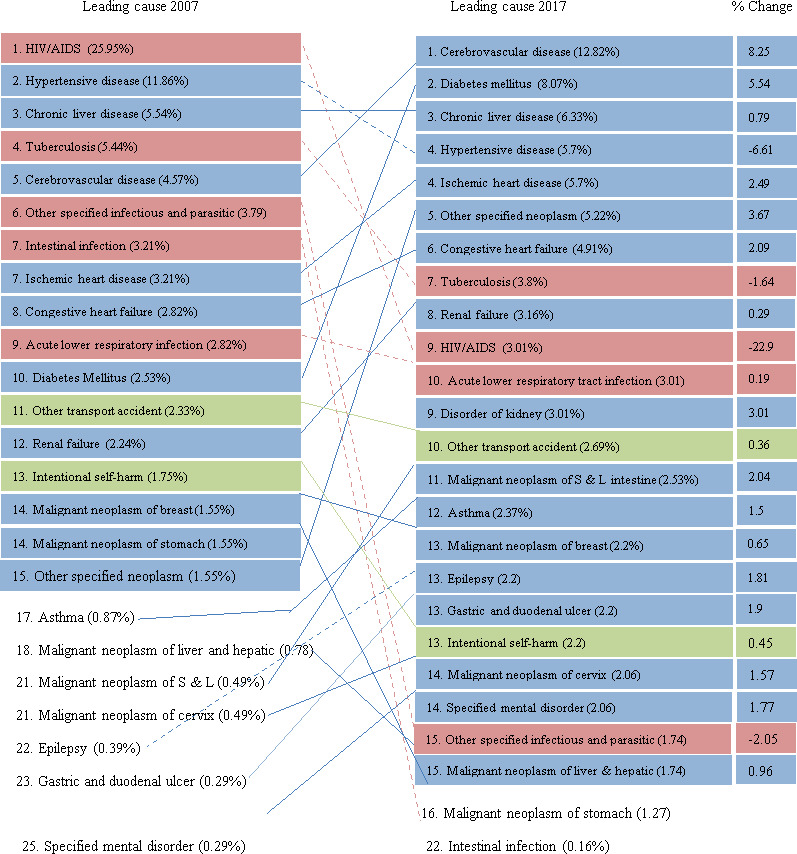
Leading 15 causes of death for both sex combined for 2007 and 2017, with percentage change Addis Ababa, Ethiopia.
Discussion
We analysed data collected from 73 burial sites of Addis Ababa, capital of Ethiopia for the period 2007–2012 and 2015–2017. In this analysis, we have explored the distribution of death from a specific cause among adults (ie, age greater than 15 years) and its distribution over time, sex and age group. The present analysis showed more than half of death was due to NCDs (62.8%), followed by death due to communicable diseases, maternal conditions, and nutritional deficiencies (30.3%). Mortality due to NCD increased by 31% while mortality due CMND decreased by 31% over 10 years. Among specific causes, the leading cause of death in 2017 was mortality from cerebrovascular diseases, which accounts for 27.1 %, followed by mortality from diabetes mellitus, which accounted for 8.07%.
In this analysis, 62.8% deaths were attributed to NCDs and this is consistent with reports from previous studies conducted in Ethiopia. A study conducted in Addis Ababa between 2006 and 2009 reported a similar finding.20 However, a study conducted in Kersa health and demographic surveillance system (Kersa HDSS), eastern Ethiopia reported that 26.4% of adult deaths were due to NCD.21 Similarly, the Ethiopian national estimates form the Global Burden of Diseases reported that 39.3% of the total death was due to NCD.4 This difference might be due to the setting in which the studies have been conducted. Our study was done in urban setting where us Kersa study population is predominantly composed of rural residents.
The finding in our paper indicates the epidemiological transition from communicable disease to NCD with a 31% increase in mortality due to NCD over 10 years. This finding was similar with another study where 38% increment in mortality due to NCD was reported from 2000 to 2016.4 In addition, the top five leading cause of death in 2017 were all NCDs both in male and in female. The top five leading cause of death in male were cerebrovascular disease, diabetes mellitus, chronic liver disease, ischaemic heart disease and hypertensive disease. Similarly, in females, the top five leading cause of death were cerebrovascular disease, diabetes mellitus, congestive heart failure, hypertensive disease, malignant neoplasm of breast and malignant neoplasm of cervix.
An increasing surge in burden of NCD was observed not only in Ethiopia but in sub-Saharan Africa as well over the past two decades. Rapid urbanisation and population ageing could be possible factor for the observed result. As the number of surviving citizens, increase prevalence of disease such as cancer and cardiovascular disease might increase.22 23 In addition, behavioural factors such as unhealthy diet, lack of physical activity, obesity and substance use that are amplified in urban setting such as Addis Ababa could explain the observed result.24 On top of this, it is relatively recently that chronic NCDs in low-income and middle-income countries started to get attention.25 The same is true for Ethiopia, where National Strategic Action plan for prevention and control of NCD was in place only in 2010.26 There is lack of availability of NCD-related services with only half of health facilities in Ethiopia ready to provide general NCD services.27 Among health facilities in Ethiopa only 22%, 41% and 2% of health facilities are ready to provide service for diabetes, cardiovascular disease and cervical cancer, respectively.28 Gaps in the healthcare delivery such as shortage of NCD drugs, diagnostic facilities and lack of treatment guidelines could also attribute to increased mortality from NCD.28
Communicable diseases were the second leading causes of death accounting for 30.3% death among adults. This finding was in line with other studies conducted in Ethiopia and other parts of the world.10 29 A study conducted in Addis Ababa from 2006 to 2009 reported communicable diseases accounts for 42% of total death. We have also observed significant decline in the proportion of death from communicable diseases over 10-year period.20 Other studies have also shown the burden of mortality from communicable disease has decreased significantly.3 20 29 This might be due to the improvements in the health and socioeconomic status of the population over the years.30 31 In addition, the national healthcare programme, which focuses on health promotion and prevention of communicable diseases has also played a significant role.10 A significant increase in availability of primary healthcare services could also be one factor for the observed finding.
With a total percentage change of 22.9%, HIV has moved from being the leading cause of death in 2007 to being the ninth cause of death in 2017. This finding was similar with another study conducted in Ethiopia where 11% change in mortality was observed between 2003 and 2015.32 Another study also showed 33% reduction in mortality due to HIV from 2001 to 2009.33 The expansion of health facilities providing ART, increased ART coverage and the progressive improvement in retention in care could be a factor for this improvement.34
Similarly, tuberculosis has moved from being the fourth leading cause of death in 2007 to the seventh leading cause of death in 2017 with 1.64% change. This finding was similar with another study conducted in Ethiopia where 75% decrement was observed from 1990 to 2016.35 This could be explained by improved access to care and treatment and implementation of case detection at community level.36 In addition, implementation of directly observed treatment for TB could have an impact on the observed change in rate of mortality.
This analysis revealed that injury was responsible for 6.8% of all adult deaths. Our finding is in line with studies conducted in Addis Ababa, which reported injury accounted for 6% and 7% of total adult death.20 37 This finding is much lower than many hospital-based studies conducted in Addis Ababa, Ethiopia where injury accounts for the majority of all deaths.38–40 This might be because most of the studies used data from emergency departments of hospitals, where injury-related visits are very high.38 40 Furthermore, our findings show that majority of adult injury-related deaths were higher among males. Similar findings reported that the proportion of deaths from injury is higher among men compared with women.38 41 42 This might because males are highly involved in activities that can cause physical injury.43 44 The majority of injury-related death occur in people aged 15–34 years. Similar findings was reported by studies conducted in Ethiopia,39 45 and other low-income and middle-income countries.43 46 The higher proportion of deaths from injuries for people aged 15–34 might be because younger adults are more subjected to violence and self-harm as compared with the older adults.43 47
This study provides an important information on leading causes of death and the proportion of death over ten years in Addis Ababa and its implication. The finding from this analysis could be generalised to Addis Ababa and other urban settings with similar setup like Addis Ababa. However, it is important to acknowledge the limitation of this study, exclusion of dead bodies with no close relatives or friends and those with incomplete addresses from the sampling frame could affect the finding. We may have introduced selection bias as some nonresidents may be buried in Addis Ababa and some residents may be buried outside of the Addis Ababa. Some of the sampled deceased were not included in the analysis; for the main reason houses of the deceased were not found and either caregivers or families of the deceased refused to give information for VA interviews. Another limitation is that we didn’t use automated VA interpretation and there has been changes in the panel of the physician coders. However, to overcome any inconsistencies among coders, new physicians were trained and they were given manuals. In addition, the previous physicians brief the new physicians before they handover the job. The other limitation is there was an interruption of data collection in the year 2013 and 2014. This interruption might create uneven/irregular trend in mortality.
Conclusion
In the present analysis, we showed an epidemiological shift in cause of mortality from communicable diseases to NCDs over 10 years. NCDs were the leading cause of death in Addis Ababa in 2017, followed by communicable disease. There is a great progress in reducing mortality due to communicable diseases over the past years. However, the progress towards NCD is not to the level of expectation causing NCD to be the leading cause of death. Although NCDs are getting attention there should be a great commitment in implementing prevention and control strategies to curb the burden they pose. There should be improved access to quality health service, improved case detection and community education to increase awareness. In addition, multisectoral collaboration by involving different sectors including education section, mass communication that promotes healthy life style and agriculture to support healthy dietary practice. Besides collaboration, integrating NCD intervention in to a well-established and successful programme targeting communicable diseases might be beneficial for improving provision of comprehensive healthcare there by addressing both the double burden of communicable and NCDs.
Supplementary Material
Acknowledgments
We want to acknowledge all individuals who have participated in the data collection, supervision and data management.
Footnotes
Contributors: BSE made the conception and design, analysis and interpretation of findings, draft the manuscript and revise it. BSE is responsible for the overall content as a guarantor. EHF conducted the analysis and interpretation of findings, draft the manuscript and revise it. BGS conducted the analysis and interpretation of findings, draft the manuscript and revise it. SHG conducted the analysis and interpretation of findings, draft the manuscript and revise it.
Funding: The Addis Ababa mortalty surveillance program was made possible with financial support from the Centers for Diease Control and Prevention (EPHA-CDC Cooperative Agreement). The program is currently supported by Addis Ababa university thematic research funding. The finding of this study is solely the responsibility of the authors, not the funding organizations.
Competing interests: The authors declare no competing interest.
Provenance and peer review: Not commissioned; externally peer reviewed.
Supplemental material: This content has been supplied by the author(s). It has not been vetted by BMJ Publishing Group Limited (BMJ) and may not have been peer-reviewed. Any opinions or recommendations discussed are solely those of the author(s) and are not endorsed by BMJ. BMJ disclaims all liability and responsibility arising from any reliance placed on the content. Where the content includes any translated material, BMJ does not warrant the accuracy and reliability of the translations (including but not limited to local regulations, clinical guidelines, terminology, drug names and drug dosages), and is not responsible for any error and/or omissions arising from translation and adaptation or otherwise.
Data availability statement
Data are available on reasonable request.
Ethics statements
Patient consent for publication
Not applicable.
Ethics approval
The programme protocol was approved by the Institutional Review Board (IRB) of the College of Health Sciences, Addis Ababa University, and the National Ethics Review of Committee of the Ethiopian Ministry of Science and Technology. We have also obtained permission from Labor and Social Affair Bureau which is an institution that manages municipal cemetery and all religious authorities prior to conducting the surveillance. Verbal autopsy was conducted after written informed consent was obtained from the caregiver of the deceased by explaining the purpose of the study. The collected data was kept confidential and it was accessible for the research team only. The ID for approval is 048/20/SPH.
References
- 1.Rippin N. The sustainable development goals of the post-2015 agenda: comments on the OWG and SDSN proposals, 2015 2015;6. [Google Scholar]
- 2.Kuruvilla S, Schweitzer J, Bishai D, et al. Success factors for reducing maternal and child mortality. Bull World Health Organ 2014;92:533–44. 10.2471/BLT.14.138131 [DOI] [PMC free article] [PubMed] [Google Scholar]
- 3.Misganaw A, Haregu TN, Deribe K, et al. National mortality burden due to communicable, non-communicable, and other diseases in Ethiopia, 1990-2015: findings from the global burden of disease study 2015. Popul Health Metr 2017;15:29. 10.1186/s12963-017-0145-1 [DOI] [PMC free article] [PubMed] [Google Scholar]
- 4.Girum T, Mesfin D, Bedewi J, et al. The burden of noncommunicable diseases in Ethiopia, 2000-2016: analysis of evidence from global burden of disease study 2016 and global health estimates 2016. Int J Chronic Dis 2020;2020:1–10. 10.1155/2020/3679528 [DOI] [PMC free article] [PubMed] [Google Scholar]
- 5.Omran AR. The epidemiologic transition: a theory of the epidemiology of population change. 1971. Milbank Q 2005;83:731–57. 10.1111/j.1468-0009.2005.00398.x [DOI] [PMC free article] [PubMed] [Google Scholar]
- 6.Gore FM, Bloem PJN, Patton GC, et al. Global burden of disease in young people aged 10-24 years: a systematic analysis. Lancet 2011;377:2093–102. 10.1016/S0140-6736(11)60512-6 [DOI] [PubMed] [Google Scholar]
- 7.Patton GC, Coffey C, Sawyer SM, et al. Global patterns of mortality in young people: a systematic analysis of population health data. Lancet 2009;374:881–92. 10.1016/S0140-6736(09)60741-8 [DOI] [PubMed] [Google Scholar]
- 8.Viner RM, Coffey C, Mathers C, et al. 50-Year mortality trends in children and young people: a study of 50 low-income, middle-income, and high-income countries. Lancet 2011;377:1162–74. 10.1016/S0140-6736(11)60106-2 [DOI] [PubMed] [Google Scholar]
- 9.Begg S, Rao C, Lopez AD. Design options for sample-based mortality surveillance. Int J Epidemiol 2005;34:1080–7. 10.1093/ije/dyi101 [DOI] [PubMed] [Google Scholar]
- 10.Melaku YA, Sahle BW, Tesfay FH, et al. Causes of death among adults in northern Ethiopia: evidence from verbal autopsy data in health and demographic surveillance system. PLoS One 2014;9:e106781. 10.1371/journal.pone.0106781 [DOI] [PMC free article] [PubMed] [Google Scholar]
- 11.Lulu K, Berhane Y. The use of simplified verbal autopsy in identifying causes of adult death in a predominantly rural population in Ethiopia. BMC Public Health 2005;5:58. 10.1186/1471-2458-5-58 [DOI] [PMC free article] [PubMed] [Google Scholar]
- 12.Morris SK, Bassani DG, Kumar R, et al. Factors associated with physician agreement on verbal autopsy of over 27000 childhood deaths in India. PLoS One 2010;5:e9583. 10.1371/journal.pone.0009583 [DOI] [PMC free article] [PubMed] [Google Scholar]
- 13.Misganaw A, Mariam DH, Araya T, et al. Validity of verbal autopsy method to determine causes of death among adults in the urban setting of Ethiopia. BMC Med Res Methodol 2012;12:130. 10.1186/1471-2288-12-130 [DOI] [PMC free article] [PubMed] [Google Scholar]
- 14.Soleman N, Chandramohan D, Shibuya K. Verbal autopsy: current practices and challenges. Bull World Health Organ 2006;84:239–45. 10.2471/blt.05.027003 [DOI] [PMC free article] [PubMed] [Google Scholar]
- 15.Fottrell E, Byass P. Verbal autopsy: methods in transition. Epidemiol Rev 2010;32:38–55. 10.1093/epirev/mxq003 [DOI] [PubMed] [Google Scholar]
- 16.Setel PW, Sankoh O, Rao C, et al. Sample registration of vital events with verbal autopsy: a renewed commitment to measuring and monitoring vital statistics. Bull World Health Organ 2005;83:611–7. doi:/S0042-96862005000800015 [PMC free article] [PubMed] [Google Scholar]
- 17.Federal Democratic Republic of Ethiopia Population Census Commission AA, Ethiopia . Summary and statistical report of the 2007 population and housing census, 2008. [Google Scholar]
- 18.Lopez AD, Mathers CD, Ezzati M. Global burden of disease and risk factors: the world bank, 2006. [PubMed] [Google Scholar]
- 19.von Elm E, Altman DG, Egger M, et al. The strengthening the reporting of observational studies in epidemiology (STROBE) statement: guidelines for reporting observational studies. PLoS Med 2007;4:e296. 10.1371/journal.pmed.0040296 [DOI] [PMC free article] [PubMed] [Google Scholar]
- 20.Misganaw A, Mariam DH, Araya T. The double mortality burden among adults in Addis Ababa, Ethiopia, 2006-2009. Prev Chronic Dis 2012;9:E84. 10.5888/pcd9.110142 [DOI] [PMC free article] [PubMed] [Google Scholar]
- 21.Ashenafi W, Eshetu F, Assefa N, et al. Trend and causes of adult mortality in Kersa health and demographic surveillance system (Kersa HDSS), eastern Ethiopia: verbal autopsy method. Popul Health Metr 2017;15:22. 10.1186/s12963-017-0144-2 [DOI] [PMC free article] [PubMed] [Google Scholar]
- 22.Streatfield PK, Khan WA, Bhuiya A, et al. Adult non-communicable disease mortality in Africa and Asia: evidence from indepth health and demographic surveillance system sites. Glob Health Action 2014;7:25365. 10.3402/gha.v7.25365 [DOI] [PMC free article] [PubMed] [Google Scholar]
- 23.Bouhdiba S. The epidemiologic transition in Africa: end of the process?.
- 24.Misganaw A, Mariam DH, Ali A, et al. Epidemiology of major non-communicable diseases in Ethiopia: a systematic review. J Health Popul Nutr 2014;32:1–13. [PMC free article] [PubMed] [Google Scholar]
- 25.Prevett M. Chronic non-communicable diseases in ethiopia-a hidden burden. Ethiop J Health Sci 2012;22:1–2. [PMC free article] [PubMed] [Google Scholar]
- 26.Non-Communicable O . National Strategic Action Plan (Nsap) for Prevention & Control of Non-Communicable Diseases in Ethiopia: Google Scholar.
- 27.Commission EN . Addressing the impact of noncommunicable diseases and injuries in Ethiopia: findings and recommendations from the noncommunicable diseases and injuries (NCDI) Commission of Ethiopia Addis Ababa, Ethiopia Minister of health, 2008. [DOI] [PMC free article] [PubMed] [Google Scholar]
- 28.Shiferaw F, Letebo M, Misganaw A. Non-Communicable diseases in Ethiopia: disease burden gaps in health care delivery and strategic directions 2018;32. [Google Scholar]
- 29.Misganaw A, Mariam DH, Araya T, et al. Patterns of mortality in public and private hospitals of Addis Ababa, Ethiopia. BMC Public Health 2012;12:1007. 10.1186/1471-2458-12-1007 [DOI] [PMC free article] [PubMed] [Google Scholar]
- 30.FMOH A. Health sector development Program—IV 2010/11—2014/15: federal Democratic Republic of Ethiopia Addis Ababa, 2010. [Google Scholar]
- 31.Ababa A. Ethiopia: building on progress a plan for accelerated and sustained development to end poverty (PASDEP), 2006. [Google Scholar]
- 32.Deribew A, Biadgilign S, Deribe K, et al. The burden of HIV/AIDS in Ethiopia from 1990 to 2016: evidence from the global burden of diseases 2016 study. Ethiop J Health Sci 2019;29:859–68. 10.4314/ejhs.v29i1.7 [DOI] [PMC free article] [PubMed] [Google Scholar]
- 33.Araya T, Tensou B, Davey G, et al. Burial surveillance detected significant reduction in HIV--related deaths in Addis Ababa, Ethiopia. Trop Med Int Health. In Press 2011;16:1483–9. 10.1111/j.1365-3156.2011.02867.x [DOI] [PubMed] [Google Scholar]
- 34.Assefa Y, Alebachew A, Lera M, et al. Scaling up antiretroviral treatment and improving patient retention in care: lessons from Ethiopia, 2005-2013. Global Health 2014;10:43. 10.1186/1744-8603-10-43 [DOI] [PMC free article] [PubMed] [Google Scholar]
- 35.Deribew A, Deribe K, Dejene T, et al. Tuberculosis burden in Ethiopia from 1990 to 2016: evidence from the global burden of diseases 2016 study. Ethiop J Health Sci 2018;28:519–28. 10.4314/ejhs.v28i5.2 [DOI] [PMC free article] [PubMed] [Google Scholar]
- 36.Datiko DG, Yassin MA, Theobald SJ, et al. Health extension workers improve tuberculosis case finding and treatment outcome in Ethiopia: a large-scale implementation study. BMJ Glob Health 2017;2:e000390. 10.1136/bmjgh-2017-000390 [DOI] [PMC free article] [PubMed] [Google Scholar]
- 37.Anteneh A, Endris BS. Injury related adult deaths in Addis Ababa, Ethiopia: analysis of data from verbal autopsy. BMC Public Health 2020;20:926. 10.1186/s12889-020-08944-7 [DOI] [PMC free article] [PubMed] [Google Scholar]
- 38.Tsegaye F, Abdella K, Ahmed E. Pattern of fatal injuries in Addis Ababa, Ethiopia: a one-year audit 2010;15:10–17. [Google Scholar]
- 39.Gemechu T, Tinsae M, Ashenafi S, et al. Most common causes of natural and injury-related deaths in Addis Ababa, Ethiopia. Pathol Res Pract 2009;205:608–14. 10.1016/j.prp.2009.02.007 [DOI] [PMC free article] [PubMed] [Google Scholar]
- 40.Hunchak C, Teklu S, Meshkat N, et al. Patterns and predictors of early mortality among emergency department patients in Addis Ababa, Ethiopia. BMC Res Notes 2015;8:605. 10.1186/s13104-015-1592-z [DOI] [PMC free article] [PubMed] [Google Scholar]
- 41.Weldearegawi B, Ashebir Y, Gebeye E, et al. Emerging chronic non-communicable diseases in rural communities of northern Ethiopia: evidence using population-based verbal autopsy method in Kilite Awlaelo surveillance site. Health Policy Plan 2013;28:891–8. 10.1093/heapol/czs135 [DOI] [PubMed] [Google Scholar]
- 42.Azaj A, Seyoum N, Nega B. Trauma in Ethiopia revisited: a systematic review. East and Central African Journal of Surgery 2013;18:108–18. [Google Scholar]
- 43.Chasimpha S, McLean E, Chihana M, et al. Patterns and risk factors for deaths from external causes in rural Malawi over 10 years: a prospective population-based study. BMC Public Health 2015;15:1036. 10.1186/s12889-015-2323-z [DOI] [PMC free article] [PubMed] [Google Scholar]
- 44.Adane MM, Gelaye KA, Beyera GK, et al. Occupational injuries among building construction workers in Gondar City, Ethiopia. Occup Med Health Aff 2013;01. 10.4172/2329-6879.1000125 [DOI] [Google Scholar]
- 45.Bashah DT, Dachew BA, Tiruneh BT. Prevalence of injury and associated factors among patients visiting the emergency departments of Amhara regional state referral hospitals, Ethiopia: a cross-sectional study. BMC Emerg Med 2015;15:20. 10.1186/s12873-015-0044-3 [DOI] [PMC free article] [PubMed] [Google Scholar]
- 46.Ae-Ngibise KA, Masanja H, Kellerman R, et al. Risk factors for injury mortality in rural Tanzania: a secondary data analysis. BMJ Open 2012;2. 10.1136/bmjopen-2012-001721. [Epub ahead of print: 19 11 2012]. [DOI] [PMC free article] [PubMed] [Google Scholar]
- 47.Courtenay WHJTJoMss . Behavioral factors associated with disease, injury, and death among men: evidence and implications for prevention 2000;9:81–142. 10.3149/jms.0901.81 [DOI] [Google Scholar]
Associated Data
This section collects any data citations, data availability statements, or supplementary materials included in this article.
Supplementary Materials
bmjopen-2020-047095supp001.pdf (120.2KB, pdf)
Data Availability Statement
Data are available on reasonable request.