

Abstract
When a dose-response relationship is monotonic, the EMAX model has been shown to provide a good empirical fit for designing and analyzing dose-response data across a wide range of pharmaceutical studies. However, the EMAX model has never been applied to a finite mixture distribution. Motivated by a proposal investigating DHA dose effect on preterm birth (PTB, <37 weeks gestation) rate, we developed an innovative Bayesian EMAX mixture model incorporating the three normal components finite mixture model into the EMAX framework. The proposed Bayesian EMAX mixture model analyzes gestational age as a continuous variable, which allows for statistically efficient estimates of PTB rate using various cut point with the same parsimonious model. For example, we can estimate the rate of early PTB (ePTB, <34 weeks gestation), PTB (<37 weeks gestation), and late-term birth (>41 weeks gestation) using the same model. We compared our proposed EMAX mixture model with an EMAX logistic model and an independent doses logistic model for a dichotomized endpoint using extensive simulations. Across the scenarios under consideration, the EMAX mixture model achieved higher power than the EMAX logistic model and the independent doses logistic model in detecting the effect of DHA supplementation on the PTB rate. The EMAX mixture model also resulted in smaller mean squared errors (MSE) in PTB rate estimates.
Keywords: EMAX model, dose-response model, Bayesian analysis, normal mixture distributions
1. Introduction
Preterm birth (PTB) is defined as birth before 37 weeks gestation. One in 10 U.S. pregnancies ends in PTB, yielding nearly half a million preterm infants born each year. PTB is the primary cause of infant mortality, costs the U.S. health system billions of dollars annually, and, for many of the infants who survive, results in continued individual, family, and societal challenges due to associated morbidity and disabilities. Despite the significant investment of the National Institutes of Health (NIH), the Centers for Disease Control and Prevention (CDC), and foundations such as the March of Dimes toward understanding and preventing PTB, researchers have only recently identified prevention strategies for spontaneous PTB. In a November 2018 Cochrane Review (1), researchers concluded there was strong evidence that consumption of the omega-3 fatty acid docosahexaenoic acid (DHA) could reduce PTB by 11%, and early PTB (ePTB, <34 weeks gestation) by 42%. These results are compelling. However, additional research is necessary to move from an observed effect of DHA to a scalable preventive intervention for PTB. The critical issue is that the DHA dose needed to reduce PTB is unknown. At present, the National Academy of Medicine does not set a Dietary Reference Intake (DRI) for DHA in pregnancy because the amount of DHA required to reduce PTB has not been established. Most prenatal supplements available in the U.S. contain ~0.2g DHA, a much lower dose than provided in most randomized controlled trials (RCTs) included in the Cochrane Review (≥0.6g DHA). A dose-response study is necessary to develop evidence-based policy and advise women about the DHA dose needed to reduce PTB. Our goal is to identify an efficient trial design to evaluate the effect of DHA dose on PTB.
One frequently used dose-response model is the pairwise independent doses model. In this model, no functional relationship is assumed between the dose and effect, and all doses are modeled independently and compared with each other. The independent doses model is often inefficient and results in lower power because of its lack of functional relationship assumption. When the dose-response relationship can be assumed monotonic, an EMAX (MAXimum Effect) model has been shown to provide a good empirical fit for designing and analyzing dose-response data across a wide range of pharmaceutical studies (2). The EMAX model assumes the dose-response relationship follows a nonlinear monotonic function with a parameter representing the maximum effect that can be achieved when dose approaches to infinity and another parameter representing the dose that achieves 50% of the maximum effect. One option to evaluate the DHA dose effect on PTB is to apply the EMAX model treating PTB as a dichotomous endpoint. However, studies have shown that dichotomizing continuous endpoints results in a loss of information and reduced power (3,4,5). We propose a Bayesian EMAX model that analyzes gestational age as continuous. Schwartz et al. showed that the distribution of gestational age can be described by a mixture of three normal distributions (6). Thus, we developed our EMAX mixture model for a continuous endpoint with a mixture distribution. We compared our model with two models that dichotomize gestational age: the EMAX model (EMAX logistic model) and the independent doses logistic model. Extensive simulations showed that the EMAX Mixture model achieved a much higher power for detecting the DHA dose effect on PTB than the other two models and resulted in much smaller mean squared errors (MSEs) in estimates of PTB rates. Additionally, the EMAX Mixture model is attractive because it allows for statistically efficient estimates of PTB rates using different gestational age cut-points within the same parsimonious model. For example, we can estimate the rate of early preterm birth (<34 weeks gestation), preterm birth (<37 weeks gestation), and late-term birth (>41 weeks gestation) using the same model.
The remainder of the article is organized as follows. In Sections 2.1 and 2.2, we describe the study motivation and cover the three statistical models in detail (EMAX Mixture, EMAX logistic, and independent doses logistic). Section 2.3 describes the simulation scenarios used to assess model operating characteristics. Section 2.4 is model calibration and type I error, and Section 2.5 provides simulation details. The simulation results are summarized in Section 3. In Section 4, we apply the three models to a simulated dataset to illustrate the models’ application. In Section 5, we conclude from our analysis and discuss the advantages and limitations of the EMAX Mixture model and future work.
2. Methods
2.1. Study summary
Our research was motivated by a proposal whose primary aim was to evaluate the dose-response relationship for DHA supplementation on PTB by leveaging the data from six NICHD supported randomized clinical trials (RCTs) of DHA supplementation in pregnancy conducted between 2006 and 2020 (R21 HD058269, R21 HD059019; R01 HD084586; R01 HD086001, R01 HD047315, R01 HD083292). The trials combined enrolled over 2000 U.S. women with a singleton pregnancy in four metropolitan areas (Kansas City, Chicago, Cincinnati, and Columbus). Six DHA doses were used across the trials: 0g (n=350), 0.2g (n=700), 0.45g (n=175), 0.6g (n=180), 0.8g (n=150) and 1g (n=550).
As a secondary aim, DHA supplementation was hypothesized to have a bigger effect on ePTB and/or PTB in participants with a lower phospholipid DHA level at enrollment. By dividing the participants into two groups according to their phospholipid DHA (as a percent of total fatty acids) at enrollment (Low: phospholipid DHA <6%; High: phospholipid DHA ≥ 6%), the proposal wanted to determine if phospholipid DHA status at enrollment influences the effect of DHA supplement on ePTB and/or PTB.
Our goal was to identify an efficient trial design to evaluate the primary and secondary aims of the proposal.
2.2. Statistical models
Let Tdi denote the gestational age for participant i in arm d, where d represents the DHA supplement dose and can take values of 0g, 0.2g, 0.45g, 0.6g, 0.8g, and 1g. The number of participants in each arm, denoted by nd, is 350, 700, 175, 180, 150, and 550 for the 6 doses, respectively. Let yd be the number of ePTBs in dose d, which can be determined by , where . This section will describe statistical models for the independent doses logistic model, EMAX logistic model, and the EMAX Mixture model.
2.2.1. Independent doses logistic model
Let pd be the probability of an ePTB in dose d. The number of ePTBs in dose d follows a binomial distribution, yd ~ Bin(nd,pd), and it is modeled independently for each dose. A normal distribution N(0,52) is used as a vague prior for . When transformed back to probability scale using an anti-logit function, the prior yields a 95% equal-tailed interval of (0.001, 0.999). Hamiltonian Monte Carlo (Betancourt; Gelman et al., 2014) is used to obtain the posterior distribution of θd. The posterior probability pd can be calculated using . The posterior probability of dose d being better than the control arm, Pr(pd < p0 | data), can be estimated as the proportion of Monte Carlo draws satisfying pd < p0. The trial success is achieved when max(Pr(pd < p0 | data)) > δind.1. The threshold δind.1 is chosen by simulations to ensure a 5% type I error rate.
To determine whether phospholipid DHA at enrollment influences the effect of DHA supplementation, we model the high phospholipid DHA cohort and low phospholipid DHA cohort using the same model described above, but separately. We denote the odds ratio between the arm with the highest dose (d = 1g) and the control arm (d = 0g) using . The posterior probability of having a bigger DHA effect in the low phospholipid DHA cohort than in the high phospholipid DHA cohort is Pr(OL < OH | data). It can be calculated as the proportion of Monte Carlo draws satisfying OL < OH. Trial success is achieved when Pr(OL < OH | data) > δind.2. The threshold δind.2 is chosen by simulations to ensure a 5% type I error rate.
2.2.2. EMAX logistic model
As in the independent doses logistic model, yd ~ Bin(nd, pd). Instead of modeling θd independently for each dose d, the EMAX function is used to model the relationship between θd and .
a1 is a constant offset. When d = 0, a1 determines θ0 solely, which in turn determines the ePTB rate in the control arm.
a2 is a scalar coefficient reflecting the dose effect. It is the theoretical maximum effect above the constant offset that can be achieved. As dose tends to infinity the theoretical maximum efficacy on the logit scale is a1 + a2, thus the model is called the EMAX model.
a3 is a positive scalar representing the effective dose strength that achieves 50% of the theoretical maximal effect above the constant offset. For an effective dose of d=a3 the efficacy on logit scale is .
A non-informative prior distribution N(0,4) is used for a1 and a2. For a3, a half-normal prior N(0,1) is used so that a3 can take positive values only. Hamiltonian Monte Carlo (Betancourt; Gelman et al., 2014) is used to obtain the posterior distribution of a1, a2 and a3 and the posterior probability pd can be calculated using . It is easy to prove that when a2 is negative, θd decreases as d increases. Therefore, the success of a trial is defined as having a posterior probability of a2 < 0 greater than a cutoff value, Pr(a2 < 0) >δEMAX.1. The threshold δEMAX.1 is chosen by simulations to ensure a 5% type I error rate.
To determine whether phospholipid DHA at enrollment influences the effect of DHA supplementation on PTB, we model the high and low phospholipid DHA cohorts using the same model described above separately. Let a2H and a2L denote EMAX parameters a2 in the high and low phospholipid DHA cohorts, respectively. The success of the trial is defined as having a posterior probability of a2L < a2H greater than a cutoff, Pr(a2L < a2H | data) > δEMAX.2, where Pr(a2L < a2H | data) can be estimated using the proportion of Monte Carlo draws satisfying a2L < a2H, and the threshold δEMAX.2 is chosen by simulations to ensure a 5% type I error rate.
2.2.3. EMAX Mixture model
In the finite mixture model developed by Schwartz et al.(6), gestational age Tdi follows a finite mixture model with three normal components that describe the mixture of high-, medium-, and low-risk groups: N1 = N(33.29,13.23), N2 = N(38.26, 2.48), and N3 = N(39.59, 0.960). The probability distribution function of Tdi is f(Tdi | Δ1d,Δ2d,Δ3d) =
Δ1dϕ(Tdi | 33.29, 13.23) + Δ2dϕ(Tdi | 38.26,2.48) + Δ3dϕ(Tdi | 39.59,0.96), where ϕ(T | μ, σ2) is the normal probability density function with mean μ and variance σ2, and Δ1d, Δ2d, and Δ3d are the mixture weights for arm d, which can take values between 0 and 1 and with Δ1d + Δ2d + Δ3d = 1. The three components represent the high, medium, and low-risk groups for ePTB and can model different populations by adjusting the mixture weights. Schwartz’s choice of three-component was driven by model identifiability and Bayesian Information Criterion instead of clinical significance. The component means and variances were derived by Schwartz from the North Carolina Detailed Birth Record (NCDBR) registry, with 336,129 records included in the final analysis. It has been proven to be representative and generalizable and has been used successfully in other studies of PTB (12,13,14).
Based on Schwartz’s finite mixture model, we propose a dose-response model that applies the EMAX function to finite mixture distributions. We call it the EMAX Mixture model. Let represent the odds ratio of the mixture weights for the high- versus the low-risk groups’ normal components. Similarly, is the odds ratio for the medium- versus low-risk groups’ normal components. The EMAX function is employed to model the relationship between the odds ratio comparing high- and low-risk groups, θ1d, and dose d. This relationship is given by . Without losing the model generalizability, we assume the odds ratio comparing medium- to low-risk groups, θ2d, stays constant for all doses: θ2d = a4.
a1 and a4 are the constant offsets. They determine the three mixture weights when the effective dose strength is 0: , and .
a2 is the scalar coefficient reflecting the dose effect. When it is negative, as the dose increases the mixture weight of the 1st component (high risk) decreases and the mixing weights of the 2nd (median risk) and 3rd (low risk) components increase. a2 determines the theoretical maximum effect (the minimum weight of the 1st component) above the constant offset that can be achieved. When the effective dose strength is not 0: , , and .
a3 is a positive scalar representing the effective dose strength that achieves 50% of the theoretical maximal effect.
We use a vague prior N(0,4) for a1, a2, and a4, and a half-normal N(0,1) for a3 to restrict it to be positive. Hamiltonian Monte Carlo (Betancourt; Gelman et al., 2014) is used to obtain the posterior distribution of a1, a2, a3 and a4. The posterior distribution for mixture weights Δ1d,Δ2d,Δ3d can be calculated using the formulas given above. The posterior probability of having ePTB (<34 weeks gestation age) for dose d can be calculated using . By changing the upper integration bound, we can calculate the posterior probability of PTB rates at different cutoffs. For example, the posterior probability of having PTB (<37 weeks gestation age) is . Allowing for statistically efficient PTB rate estimates using various cut points with the same parsimonious model makes the EMAX Mixture model attractive.
The success of a trial is defined as having a posterior probability of a2 < 0 greater than a threshold, Pr(a2 < 0) >δEMAX_Mix.1. The posterior probability of a2 < 0 can be estimated using the proportion of Monte Carlo draws with a2 < 0. δEMAX_Mix.1 is chosen using simulations to ensure a 5% type I error rate.
The high and low baseline phospholipid DHA cohorts are modeled separately using the same model described above to investigate whether phospholipid DHA at enrollment influences the effect of DHA supplementation. Let a2H and a2L denote the EMAX parameters a2 in the high and low phospholipid DHA cohorts, respectively. The success of the trial is defined as Pr(a2L < a2H | data) > δEMAX_Mix.2. The posterior probability of a2L < a2H can be estimated using the proportion of Monte Carlo draws with a2L < a2H. δEMAX_Mix.2 is chosen using simulations to ensure a 5% type I error rate.
2.3. Simulation scenarios
Two sets of simulations were performed to compare the operating characteristics of the three models in consideration. The first set of simulations evaluates the dose-response relationship for the effect of DHA supplement. The second set evaluates whether phospholipid DHA at enrollment impacts the effect of DHA supplement.
Four virtual scenarios (Table 1) with realistic ePTB rates derived from an existing clinical trial were used to evaluate the dose-response relationship between DHA and ePTB. The “expected” scenario represents the most likely response we believe based on the result from Kansas University DHA Outcome Study (KUDOS) (7). The “optimistic” and “pessimistic” scenarios reflect the 97.5th and 2.5th percentiles of the expected response. Lastly, the improbable scenario that serves as our null hypothesis is labeled “no effect” in Table 1. In this scenario, the assumed rates of ePTB are the same across different doses. Therefore, the extent to which this scenario is “successful” actually reflects the Type I error rate.
Table 1.
Virtual scenarios (rate of ePTB) for evaluating dose-response relationship for the effect of DHA.
| Dose (g/day) | ||||||
|---|---|---|---|---|---|---|
| Scenario | 0 (n=350) | 0.2 (n=700) | 0.45 (n=175) | 0.6 (n=180) | 0.8 (n=150) | 1 (n=550) |
| 1 (optimistic) | 6.27% | 4.90% | 3.91% | 3.52% | 3.13% | 2.85% |
| 2 (expected) | 3.34% | 2.60% | 2.00% | 1.74% | 1.47% | 1.27% |
| 3 (pessimistic) | 1.56% | 1.17% | 0.87% | 0.75% | 0.63% | 0.54% |
| 4 (no effect) | 3.34% | 3.34% | 3.34% | 3.34% | 3.34% | 3.34% |
Simulation scenarios investigating whether phospholipid DHA at enrollment impact DHA supplement’s effect are given in Table 2. In the “optimistic” scenario, the high phospholipid DHA group has a very low but constant ePTB rate of 1.56% across different doses. The low phospholipid DHA group has decreasing ePTB rates that range from 11.01% when d = 0g to 4.16% when d = 1g. The average ePTB rates of the high and low groups are equal to the “optimistic” scenario in Table 1 (6.27%, 4.9%, 3.91%, 3.52%, 3.31%, and 2.85% for dose of 0g, 0.2g, 0.45g, 0.6g, 0.8g, and 1g, respectively). The “no effect” scenario represents the null hypothesis where both high and low groups have ePTB rates equal to the “optimistic” scenario in Table 1.
Table 2.
Scenarios (rate of ePTB) for investigating whether DHA status at enrollment impacts the effect of DHA supplementation.
| Dose (g/day) | |||||||
|---|---|---|---|---|---|---|---|
| Scenario | DHA | 0 (n=350) | 0.2 (n=700) | 0.45 (n=175) | 0.6 (n=180) | 0.8 (n=150) | 1 (n=550) |
| 1 (optimistic) | High | 1.56% | 1.56% | 1.56% | 1.56% | 1.56% | 1.56% |
| Low | 11.01% | 8.19% | 6.20% | 5.43% | 4.69% | 4.16% | |
| 2 (no effect) | High | 6.27% | 4.90% | 3.91% | 3.52% | 3.13% | 2.85% |
| Low | 6.27% | 4.90% | 3.91% | 3.52% | 3.13% | 2.85% | |
2.4. Model calibration
According to the U.S. Department of Health and Human Services Food and Drug Administration, Center for Drug Evaluation and Research (CDER), and Center for Biologics Evaluation and Research (CBER), the type I error rate can be estimated by the proportion of simulations that meet the success threshold in null scenarios (8), and power can be estimated by the proportion of simulations that meet the success threshold in alternative scenarios. To make designs comparable, success thresholds are chosen to achieve similar type I error rates across designs using simulations. This process is called model calibration. For example, Figure 1 is the plot of the proportion of successes (type 1 error rate) by threshold values (δEMAX_Mix.1) based on simulations using the EMAX Mixture model under the null scenario. As the threshold increases, the proportion of simulations meeting the success criterion decreases. When the threshold is 0.845, the type I error rate is roughly 5%. The more simulations we run for each scenario, the more precise the type I error rate can be. Using the same method, we identified δEMAX_Mix.1 = 0.845 and for the EMAX Mixture model, δEMAX.1 = 0.955 and δEMAX,2 = 0.92 for the EMAX logistic model, and δind.1 = 0.992 and δind,2 = 0.97 for the independent doses logistic model. With these chosen thresholds, the null scenarios’ success rates were controlled under 5% in all models.
Figure 1.
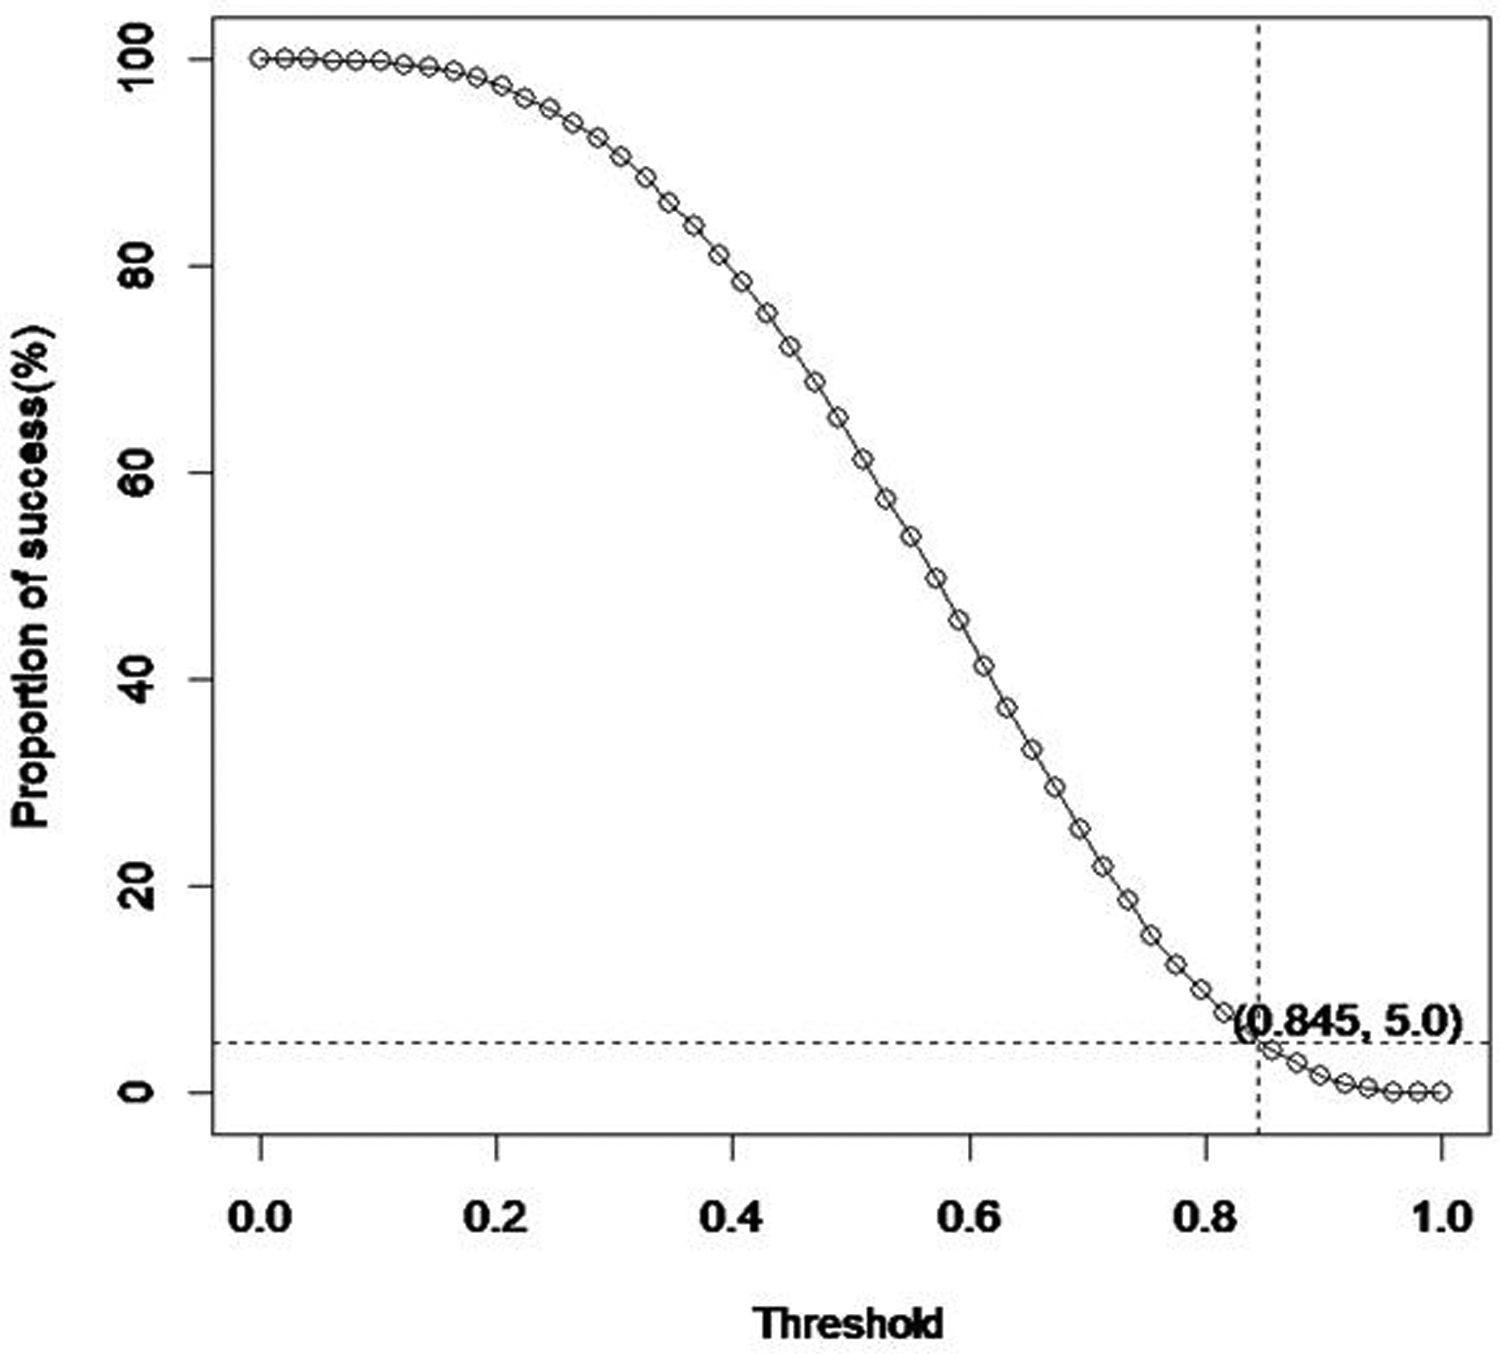
Type I error rate (Proportion of success) by threshold (δEMAX_Mix.1) based on simulations for the EMAX Mixture model in the null scenario
2.5. Simulations
For the independent doses logistic model and the EMAX logistic model, we simulated the number of participants with ePTB (yd) using binomial distributions with nd ∈ {350, 700, 175, 180, 150} and pd given in Table 1 and Table 2.
For the EMAX mixture model, we first used a trial and error method to find values of (a1, a2, a3, a4) that would result in the early preterm birth rates specified in Table 1 and Table 2. These values are given in Table 3 and Table 4, respectively. We then calculated (Δ1d, Δ2d, Δ3d) for each dose using the formulas: , , and . And finally, we used the normal mixture distributions f (Tdi | Δ1d, Δ2d, Δ3d) to generate gestational ages Tdi.
Table 3.
Parameters used to simulate gestation ages for scenarios in Table 1.
| Scenario | a 1 | a 2 | a 3 | a 4 |
|---|---|---|---|---|
| 1 (optimistic) | −2.00 | −1.85 | 1.15 | −2.16 |
| 2 (expected) | −2.64 | −3.6 | 2.5 | −1.72 |
| 3 (pessimistic) | −3.53 | −3.3 | 2 | −2.52 |
| 4 (no effect) | −2.64 | 0 | NA | −1.72 |
Table 4.
Parameters used to simulate gestation ages for scenarios in Table 2.
| Scenario | DHA | a 1 | a 2 | a 3 | a 4 |
|---|---|---|---|---|---|
| 1 (optimistic) | High | −3.53 | 0 | NA | −2.52 |
| Low | −1.30 | −2.5 | 1.15 | −1.85 | |
| 2 (no effect) | High | −2.00 | −1.85 | 1.15 | −2.16 |
| Low | −2.00 | −1.85 | 1.15 | −2.16 | |
For each model and each scenario in Table 1 and Table 2, we ran 10,000 simulations. The maximum 95% margin of error for the estimated type I error rate and the model power is . For a true type 1 error rate of 5%, the margin of error for the estimated type I error rate is . For a true power of 90%, the margin of error is .
The simulations were implemented in R (9 and 10) and Stan (11). R was used to generate gestation age data, and Stan was used to perform analyses.
3. Simulation Results
In this section, we report the simulation results comparing the three models under different scenarios described in Section 2.3. We assessed two critical aspects of model performance: statistical power in detecting the effect of DHA supplementation on the PTB rate and mean squared errors (MSE) and bias in PTB rate estimates.
3.1. Power
Table 5 shows the simulation results for power (proportions of success simulations) for the optimistic, expected, and pessimistic scenarios in Table 1, where the goal was to evaluate the dose-response relationship. The EMAX Mixture model had the highest power and independent doses logistic model had the lowest power across all scenarios. In the order of EMAX Mixture, EMAX logistic, and independent doses logistic, power was 99.98%, 84.89%, and 59.86% in the optimistic scenario; 99.79%, 73.35%, and 48.43% in the expected scenario; and 96.76%, 48.92%, and 24.75% in the pessimistic scenario.
Table 5.
Power for the effective scenarios in Table 1 where the goal was to evaluate the dose-response relationship for effect of DHA supplement on ePTB
| Scenario | EMAX Mixture | EMAX logistic | Independent logistic |
|---|---|---|---|
| 1 (optimistic) | 99.98% | 84.89% | 59.86% |
| 2 (expected) | 99.79% | 73.35% | 48.43% |
| 3 (pessimistic) | 96.76% | 48.92% | 24.75% |
Table 6 shows the simulation results for power for the optimistic scenario in Table 2, where the aim was to investigate whether DHA level at enrollment impacted the effect of DHA supplement. The EMAX Mixture model had the highest power of 95.4%, and the EMAX logistic model of 35.1% followed it. The independent doses logistic model had the lowest power of 27.6%.
Table 6.
Power for the effective scenarios in Table 2 where the aim was to investigate whether DHA level at enrollment had an impact on the effect of DHA supplement on PTBs
| Scenario | EMAX Mixture | EMAX logistic | Independent logistic |
|---|---|---|---|
| 1 (optimistic) | 95.4% | 35.1% | 27.6% |
Compared with the independent doses logistic model, the EMAX Mixture and EMAX logistic models are more efficient because they take advantage of the monotonic dose-response relationship by using the EMAX function. Compared with the EMAX logistic model, the EMAX Mixture model is more efficient because it treats gestational age as a continuous variable, while the EMAX logistic model uses a dichotomized gestational age variable. Studies have shown that dichotomizing continuous endpoints results in a loss of information and reduced power (3,4,5).
3.2. MSE and bias
As described in Section 2.2, the posterior distribution of the probability of ePTB, pd, can be obtained using Monte Carlo simulations. Let denote the posterior mean of pd, the expected posterior probability of ePTB can be obtained as the average of across simulations, where S is the number of simulations. The sample variance, , can be calculated as . The bias is the difference between the expected posterior probability and the true probability , . The mean squared error is .
Table 7 shows the simulation results for MSE× 105 of . Across all scenarios and doses, the EMAX Mixture model had the lowest MSE, and the independent doses logistic model had the highest MSE. When averaged across different doses, MSE× 105 for the three models (EMAX Mixture, EMAX logistic, and independent doses logistic) were 1.12, 3.97, and 16.27, respectively, in the Optimistic scenario; 0.79, 2.09, and 8.18, respectively, in the Expected scenario; 0.32, 0.89, 3.61, respectively, in the Pessimistic scenario; 0.81, 2.77, and 14.11, respectively, in the no effect scenario.
Table 7.
MSE × 105 of the expected estimated posterior ePTB rate
| Scenario | Model | Dose(g/day) | Average | |||||
|---|---|---|---|---|---|---|---|---|
| 0 | 0.2 | 0.45 | 0.6 | 0.8 | 1 | |||
| Optimistic | EMAX Mixture | 2.31 | 0.92 | 0.58 | 0.68 | 0.96 | 1.29 | 1.12 |
| EMAX logistic | 11.04 | 3.00 | 2.04 | 2.17 | 2.56 | 3.01 | 3.97 | |
| Independent logistic | 18.23 | 6.82 | 25.66 | 19.99 | 21.81 | 5.13 | 16.27 | |
| Expected | EMAX Mixture | 2.02 | 0.65 | 0.37 | 0.35 | 0.51 | 0.81 | 0.79 |
| EMAX logistic | 5.99 | 1.61 | 1.02 | 1.02 | 1.27 | 1.65 | 2.09 | |
| Independent logistic | 10.12 | 3.68 | 13.23 | 9.56 | 10.17 | 2.30 | 8.18 | |
| Pessimistic | EMAX Mixture | 0.93 | 0.25 | 0.15 | 0.14 | 0.18 | 0.25 | 0.32 |
| EMAX logistic | 2.66 | 0.64 | 0.43 | 0.44 | 0.52 | 0.64 | 0.89 | |
| Independent logistic | 4.67 | 1.67 | 5.70 | 4.25 | 4.37 | 0.97 | 3.61 | |
| No effect | EMAX Mixture | 1.56 | 0.57 | 0.51 | 0.59 | 0.74 | 0.90 | 0.81 |
| EMAX logistic | 5.26 | 1.93 | 1.65 | 1.95 | 2.55 | 3.26 | 2.77 | |
| Independent logistic | 9.93 | 4.78 | 21.93 | 18.65 | 23.52 | 5.82 | 14.11 | |
Table 8 shows the simulation result for bias of . In most cases, independent doses logistic model had the lowest bias. EMAX Mixture and the EMAX logistic had a comparable amount of bias. Nevertheless, the differences were very small in comparison with sample variance.
Table 8.
Bias of expected estimated posterior ePTB rate
| Scenario | Model | Dose(g/day) | Average | |||||
|---|---|---|---|---|---|---|---|---|
| 0 | 0.2 | 0.45 | 0.6 | 0.8 | 1 | |||
| Optimistic | EMAX Mixture | 0.0004 | −0.0013 | 0.0000 | 0.0008 | 0.0017 | 0.0024 | 0.0007 |
| EMAX logistic | 0.0011 | −0.0013 | −0.0002 | 0.0005 | 0.0013 | 0.0019 | 0.0005 | |
| Independent logistic | −0.0001 | 0.0000 | 0.0001 | −0.0001 | −0.0001 | 0.0000 | 0.0000 | |
| Expected | EMAX Mixture | 0.0019 | −0.0013 | −0.0005 | 0.0003 | 0.0013 | 0.0021 | 0.0006 |
| EMAX logistic | 0.0016 | −0.0014 | −0.0005 | 0.0004 | 0.0014 | 0.0022 | 0.0006 | |
| Independent logistic | −0.0001 | 0.0000 | 0.0001 | −0.0001 | −0.0001 | −0.0001 | 0.0000 | |
| Pessimistic | EMAX Mixture | 0.0014 | −0.0007 | −0.0002 | 0.0002 | 0.0007 | 0.0011 | 0.0004 |
| EMAX logistic | 0.0012 | −0.0006 | 0.0001 | 0.0005 | 0.0010 | 0.0015 | 0.0006 | |
| Independent logistic | 0.0000 | 0.0000 | −0.0001 | 0.0000 | 0.0000 | 0.0000 | 0.0000 | |
| No effect | EMAX Mixture | 0.0016 | 0.0004 | 0.0000 | −0.0002 | −0.0002 | −0.0003 | 0.0002 |
| EMAX logistic | 0.0020 | 0.0005 | −0.0001 | −0.0002 | −0.0002 | −0.0001 | 0.0003 | |
| Independent logistic | −0.0001 | 0.0001 | 0.0000 | 0.0001 | −0.0002 | 0.0000 | 0.0000 | |
4. Application to a simulated data set
To illustrate the three models’ application, we simulated a dataset using the expected scenario in Table 1. We then applied the three models to the simulated dataset and reported the analysis results.
4.1. Generating the simulated dataset
According to Section 2.5, to simulate a cohort with the true ePTB rates in the expected scenario in Table 1, a1 =−2.64, a2 = −3.6, a3= 2.5, and a4 = −1.72. The mixture weights for each dose were calculated using the formulas in Section 2.5 and they are given in Table 9. Gestational ages were then simulated using the normal mixture distributions. The descriptive statistics of the simulated data are given in Table 10. For dose 0 g/day, 0.2 g/day, 0.45 g/day, 0.6 g/day, 0.8 g/day, and 1g/day, we simulated 325, 690, 150, 175, 140, and 550 gestational ages, respectively. The mean gestational ages were 39.00, 39.05, 39.16, 39.08, 39.12, 39.15 weeks, respectively. The proportions of ePTB (<34 weeks) were 3.69%, 3.19%, 2.00%, 1.71%, 1.43%, and 1.45%, respectively. The proportions of PTB (<37 weeks) were 8.00%, 7.83%, 5.33%, 6.86%, 7.14%, and 6.00%, respectively.
Table 9.
Mixture weights used to simulate dataset.
| Mixture weights | Dose(g/day) | |||||
|---|---|---|---|---|---|---|
| 0 | 0.2 | 0.45 | 0.6 | 0.8 | 1 | |
| Δ1d | 0.0570 | 0.0442 | 0.0337 | 0.0292 | 0.0246 | 0.0212 |
| Δ2d | 0.1430 | 0.1449 | 0.1465 | 0.1472 | 0.1479 | 0.1484 |
| Δ3d | 0.8000 | 0.8108 | 0.8197 | 0.8236 | 0.8275 | 0.8304 |
Table 10.
Descriptive statistics of the simulated dataset
| Dose (g/day) | n | mean | sd | min | Q1 | median | Q3 | max | ePTB (%) | PTB (%) |
|---|---|---|---|---|---|---|---|---|---|---|
| 0 | 325 | 39.00 | 1.83 | 30.31 | 38.60 | 39.33 | 40.01 | 42.02 | 3.69% | 8.00% |
| 0.2 | 690 | 39.05 | 2.00 | 24.96 | 38.61 | 39.40 | 40.11 | 42.50 | 3.19% | 7.83% |
| 0.45 | 150 | 39.16 | 2.04 | 22.52 | 38.60 | 39.33 | 40.19 | 43.40 | 2.00% | 5.33% |
| 0.6 | 175 | 39.08 | 2.06 | 23.83 | 38.62 | 39.36 | 40.11 | 42.54 | 1.71% | 6.86% |
| 0.8 | 140 | 39.12 | 1.57 | 31.74 | 38.39 | 39.27 | 40.22 | 42.74 | 1.43% | 7.14% |
| 1 | 550 | 39.25 | 1.66 | 23.92 | 38.77 | 39.44 | 40.13 | 42.21 | 1.45% | 6.00% |
4.2. Analysis of the simulated data
The simulated gestational ages were analyzed as a continuous variable using the EMAX Mixture model. The numbers of ePTBs were analyzed as a binomial variable using the EMAX logistic model and independent doses logistic model. The STAN code for the three models can be found in the appendix.
The posterior distribution of model parameters for the EMAX Mixture model, independent logistic model and EMAX logistic model were summarized in table 11, table 12, and table 13, respectively.
The posterior probabilities of ePTB and their credible intervals are reported in Figure 2. The credible intervals of all three models covered the true values (box in the plot). The independent doses logistic model had the widest credible intervals. The EMAX Mixture model and the EMAX logistic model had similar lengths of credible intervals.
Figure 2.
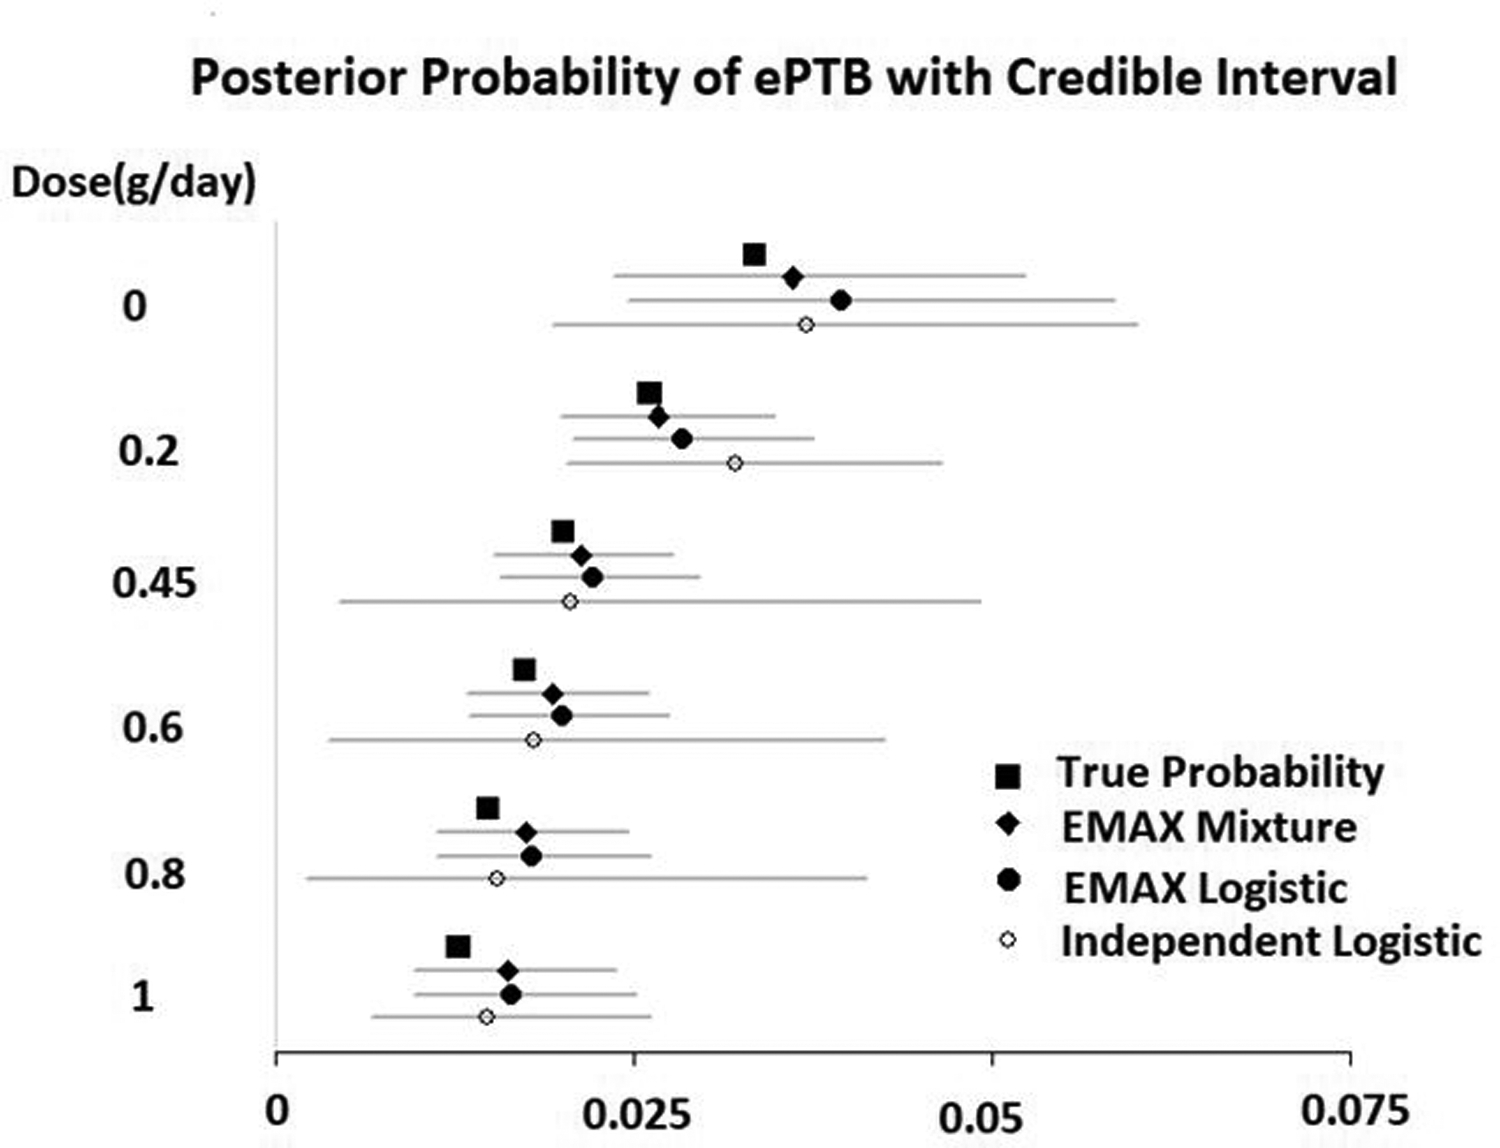
Analysis result for the simulated dataset: the posterior probability of ePTB
Both the EMAX Mixture model and EMAX logistic model had a Pr(a2 < 0) greater than their corresponding cutoffs and can be claimed as successful: EMAX Mixture, Pr(a2 < 0) = 0.994 > 0.845; EMAX logistic, Pr(a2 < 0) = 0.989 > 0.955. The independent doses logistic model had a max(Pr(pd < p0 | data)) = 0.984, which is less than the cutoff of 0.992. The trial was not a success when the independent doses logistic model was used.
As mentioned in Section 2.2, one advantage of the EMAX Mixture model is that it can estimate the posterior probability of different cut points. For example, the posterior probability of PTB (<37weeks) was 8.66%, 7.34%, 6.59%, 6.31%, 6.05%, and 5.87%, respectively. If we were to estimate the probabilities of PTBs (<37weeks) using the EMAX logistic model and independent doses logistic model, we would have to conduct another set of analyses using the numbers of gestational ages < 37 weeks.
5. Conclusion and discussion
The EMAX model has never been applied to finite mixture distributions. The Bayesian EMAX Mixture model we proposed applies the EMAX model to a three normal components finite mixture distribution developed for gestational age by Schwartz et al. We compared the EMAX Mixture model with the EMAX logistic model and the independent doses logistic model using extensive simulations. Across different scenarios, the EMAX Mixture model achieved significantly higher power in detecting DHA effect on ePTB and resulted in much smaller MSE in the posterior expected estimate of ePTB rate. The EMAX Mixture model had comparable bias to the EMAX logistic model, but was slightly worse than the independent doses logistic model.
Another attractive feature of the EMAX Mixture model is that it allows for statistically efficient estimates of PTB rates using various cut points with the same parsimonious model. For example, we can estimate the rate of early preterm birth (<34 weeks gestation), preterm birth (<37 weeks gestation), and late-term birth (>41 weeks gestation) using the same model. In future work, when we conduct analyses on the data collected in the 6 RCTs, it will be valuable to report these estimates.
Though the EMAX Mixture model was motivated by the three normal finite mixture model used for gestational age, it can have a much wider range of applications. It can be modified to accommodate almost all kinds of mixture distributions. For example, if there are two, instead of three, normal components in the mixture distribution, the EMAX Mixture model can be easily adapted by removing θ2d from the model and the mixture weight can be written as: , and . Additionally, the EMAX Mixture model can also be applied to non-normal finite mixture distributions by modifying the density function f (Tdi | Δ1d, Δ2d, Δ3d) accordingly.
One limitation of our study is that we assumed the mean and variance of the three normal distributions for gestational age determined by Schwartz et al. from NCDBR fit the new data well. Although these parameters had been used successfully in the past (12,13,14), it is possible but unlikely that the data from the 6 RCTs under consideration are very different from the NCDBR registry. In that case, one possible solution is to allow the model to estimate the mean and variance of the three normal distributions. The model will be more complicated and may have convergence issues. This will be explored in our future work.
6. Acknowledgement
This study was partially supported by NIH Clinical and Translational Science Award UL1TR002366.
8. Appendix
Stan code for EMAX Mixture model
data {
  int<lower=1> K; // number of mixture components
  int<lower=1> N; // number of data points
  real y[N]; // observations
  real<lower=0> dose[N];//treatment
  ordered[K] mu;
  vector<lower=0>[K] sigma;
}
parameters{
  real a11;
  real a12;
  real<lower=0> a13;
  real a21;
}

model {
  vector[K] theta;
  real beta1;
  real beta2;
  vector[K] lps;
  a11 ~ normal (0, 2);
  a12 ~ normal (0, 2);
  a13 ~ normal (0, 1);
  a21 ~ normal (0, 2);

  for (n in 1:N) {
    beta1 = exp(a11+a12*dose[n]/(a13+dose[n]));
    beta2 = exp(a21);
    theta[1] = beta1/(1+beta1+beta2);
    theta[2] = beta2/(1+beta1+beta2);
    theta[3] = 1/(1+beta1+beta2);
    lps=log(theta);
    for (k in 1:K)
        lps[k] += normal_lpdf(y[n] | mu[k], sigma[k]);
    target += log_sum_exp(lps);
    }
}
Stan code for EMAX logistic model
data {
  int<lower=1> N; // number of data points
  int<lower=0, upper=1> y[N]; // observations
  real<lower=0> dose[N];//treatment
}

parameters{
  real a11;
  real a12;
  real<lower=0> a13;
}

model {
  real theta;
  a11 ~ normal (0, 2);
  a12 ~ normal (0, 2);
  a13 ~ normal (0.5, 1);
  for (n in 1:N) {
    theta = a11+a12*dose[n]/(a13+dose[n]);
    y[n]~ bernoulli_logit(theta);
  }
}
Stan code for independent doses logistic model
data {
  int<lower=1> N; // number of data points
  int<lower=0, upper=1> y[N]; // observations
  matrix[N,6] dose;//6 treatments
}
parameters{
  vector[6] beta;
 }

model {
  beta ~ normal(0,5);
  y~ bernoulli_logit(dose * beta);
 }
7. References
- 1.Middleton P, Gomersall JC, Gould JF, Shepherd E, Olsen SF, Makrides M. Omega-3 fatty acid addition during pregnancy. Cochrane Database Syst Rev. 2018; 11 (11) [DOI] [PMC free article] [PubMed] [Google Scholar]
- 2.Thomas N, Sweeney K, Somayaji V. Meta-analysis of clinical dose-response in a large drug development portfolio. Stat Biopharm Res. 2014;6(4):302–317. [Google Scholar]
- 3.Altman DG, Royston P. The cost of dichotomising continuous variables. BMJ (Clinical research ed). 2006; 332:1080. [DOI] [PMC free article] [PubMed] [Google Scholar]
- 4.Deyi BA, Kosinski AS, Snapinn SM. Power considerations when a continuous outcome variable is dichotomized. Journal of biopharmaceutical statistics. 1998; 8:337–52. [DOI] [PubMed] [Google Scholar]
- 5.Peacock JL, et al. Dichotomising continuous data while retaining statistical power using a distributional approach. Statistics in medicine. 2012; 31:3089–103. [DOI] [PubMed] [Google Scholar]
- 6.Schwartz S, Gelfand A, and Miranda M, “Joint Bayesian Analysis of Birthweight and Censored Gestational Age Using Finite Mixture Models,” Statistics in Medicine. 2010; 29: 1710–1723. [DOI] [PMC free article] [PubMed] [Google Scholar]
- 7.Carlson SE, et al. DHA supplementation and pregnancy outcomes. The American journal of clinical nutrition. 2013; 97:808–15. [DOI] [PMC free article] [PubMed] [Google Scholar]
- 8.U.S. Department of Health and Human Services Food and Drug Administration, Center for Drug Evaluation and Research (CDER), Center for Biologics Evaluation and Research (CBER). Adaptive Designs for Clinical Trials of Drugs and Biologics Guidance for Industry. November. 2019.
- 9.R Core Team(2017). R: a Language and Environment for Statistical Computing. Vienna: R Foundation for Statistical Computing [Google Scholar]
- 10.Stan Development Team (2017) RStan: the R interface to Stan, version 2.16.1. (Available from http://mc-stan.org.)
- 11.Stan Development Team: Stan Modeling Language User’s Guide and Reference Manual, Version 2.16.0.. (Available from http://mc-stan.org.)
- 12.Lei Y, et al. Comparison of Dichotomized and Distributional Approaches in Rare Event Clinical Trial Design: a Fixed Bayesian Design. Journal of applied statistics. 2017; 44(8): 1466–1478 [DOI] [PMC free article] [PubMed] [Google Scholar]
- 13.Yelland LN, et al. Predicting the effect of maternal docosahexaenoic acid (DHA) supplementation to reduce early preterm birth in Australia and the United States using results of within country randomized controlled trials. Prostaglandins Leukot Essent Fatty Acids. 2016. September; 112: 44–49. [DOI] [PMC free article] [PubMed] [Google Scholar]
- 14.Gajewski BJ, Reese CS, Colombo J, & Carlson S (2016), “Commensurate Priors on a Finite Mixture Model for Incorporating Repository Data in Clinical Trials,” Statistics in Biopharmaceutical Research, 8(2), 151–160.. [DOI] [PMC free article] [PubMed] [Google Scholar]