

Abstract
An evidence gap exists in comparing the effectiveness of angiotensin receptor II blockers (ARBs) vs. angiotensin-converting enzyme inhibitors (ACEIs). We identified elderly hypertensive patients who initiated ACEI/ARBs after a hospitalization for coronary artery disease, heart failure, or stroke eligible for Medicare and state pharmacy assistance programs. Among 18,801 initiators of ACEIs and 2,641 initiators of ARBs, 2,535 deaths were identified. We observed substantial differences in characteristics between ARB and ACEI initiators, suggesting that ARB users were more health-seeking. The incidence of death and sudden cardiac death (SCD) in ACEI initiators was 77 and 22 per 1000 person-years, respectively. The relative risk for SCD was 0.69 (95% CI 0.50–0.96) in ARB initiators, which was 1.1 after restricting to low ejection fraction (EF) patients. The reduced risk of SCD is explained, at least partly, by 1) residual confounding by ARB users being healthier on unobserved domains and 2) lack of data on EF.
Keywords: comparative effectiveness, angiotensin system blockers, elderly, cardiovascular comorbidities
BACKGROUND
Angiotensin-converting enzyme inhibitors (ACEIs) are widely used to treat hypertension, especially among patients with comorbidities such as diabetes, coronary artery disease (CAD), heart failure (HF), stroke, and chronic kidney disease (CKD). Angiotensin receptor II blockers (ARBs) are a newer class of drugs considered to have similar efficacy and indications as ACEIs. While the risks of treatment-associated hyperkalemia and renal dysfunction are similar between these classes, ARBs are not associated with cough(1). Although clinicians often assume that ARBs and ACEIs can be used interchangeably except for patients with ACEI-induced coughs, some studies suggest possible differences in the actions of ACEIs and ARBs (2–4).
Recently, a systematic review of randomized trials directly comparing ARBs and ACEIs for the treatment of hypertension was conducted(5). The review included 61 clinical trials that directly compared ACEIs with ARBs in adult patients with hypertension, and found that ACEIs and ARBs have similar effects on blood pressure control and similar rates of side effects except that ACEIs have higher rates of cough than ARBs. Most importantly, the study identified an evidence gap regarding the longer-term effects of ARBs vs. ACEIs on important clinical outcomes such as death or major cardiovascular (CV) events especially among the elderly and subgroups with comorbidities such as HF.
The purpose of the current study is to investigate whether the longer-term risks of developing major CV events such as acute myocardial infarction (MI), HF and stroke, and/or death were higher in ACEI users than in ARB users among elderly hypertensive patients with 1) HF, 2) CAD and 3) stroke.
RESULTS
Study Patients
We identified 44,081, 46,620, and 19,255 patients who were hospitalized for CAD, HF, or stroke, respectively, and were dispensed ACEI or ARB within 90 days after the index hospitalization. Among those, 14,151, 14,668, and 4,084 were new users, respectively. After restricting these samples to patients with presumed hypertension, the final study population consisted of 9,728 patients (8,675 initiators of ACEIs and 1,053 initiators of ARBs) in the CAD cohort, 9,150 patients (8,084 initiators of ACEIs and 1,066 initiators of ARBs) in the HF cohort, and 2,564 patients (2,042 initiators of ACEIs and 522 initiators of ARBs) in the stroke cohort.
The characteristics of the study cohorts are summarized in Table 1. Patients in the HF and stroke cohorts were somewhat older than patients in the CAD cohort. HF patients had more CV and non-CV comorbidities in general than patients in the CAD or stroke cohorts. In the CAD cohort, ARB initiators were more likely to be female, have CKD, and to have used CV drugs including statins, beta-blockers, and non-aspirin antiplatelet drugs as well as preventive medications such as osteoporosis drugs compared to ACEI initiators. They were also more likely to have received preventive services including mammography and pneumococcal vaccines and have more hospitalizations, physician visits, and had used a greater number of distinct generic drugs. However, ARB users were less likely to have a history of HF or recent hospitalizations for HF or acute coronary syndrome (ACS).
Table 1.
Characteristics of the Study Population
| CAD (N=9,728) | HF (N=9,150) | Stroke (N=2,564) | |||||||
|---|---|---|---|---|---|---|---|---|---|
|
| |||||||||
| Variables | ARB (n=1,053) |
ACE (n= 8,675) |
p-value | ARB (n=1,066) |
ACE (n= 8,084) |
p-value | ARB (n=522) |
ACE (n= 2,042) |
p-value |
| Demographic | |||||||||
| Age | 78.7 (6.9) | 79.0 (6.9) | 0.14 | 81.0 (7.1) | 81.5 (7.2) | <.05 | 80.6 (6.8) | 80.2 (6.8) | 0.17 |
| Gender (female) | 793 (75.3) | 6241 (71.9) | <.05 | 811 (76.1) | 6161 (76.2) | 0.92 | 425 (81.4) | 1610 (78.8) | 0.20 |
| Black | 89 (8.5) | 586 (6.8) | <.05 | 87 (8.2) | 621 (7.7) | 0.59 | 59 (11.3) | 186 (9.1) | 0.13 |
| CV Risk Factors and Comorbidities | |||||||||
| Diabetes | 271 (25.7) | 2297 (26.5) | 0.61 | 310 (29.1) | 2116 (26.2) | <.05 | 113 (21.7) | 500 (24.5) | 0.18 |
| Prior CAD | 1023 (97.2) | 8471 (97.7) | 0.32 | 623 (58.4) | 4599 (56.9) | 0.34 | 173 (33.1) | 712 (34.9) | 0.46 |
| Atrial fibrillation | 251 (23.8) | 2026 (23.4) | 0.73 | 436 (40.9) | 3388 (41.9) | 0.53 | 112 (21.5) | 481 (23.6) | 0.31 |
| Cerebrovascular disease | 49 (4.7) | 506 (5.8) | 0.12 | 67 (6.3) | 607 (7.5) | 0.15 | 515 (98.7) | 2027 (99.3) | 0.18 |
| Prior HF | 375 (35.6) | 3523 (40.6) | <.01 | 1064 (99.8) | 8042 (99.5) | 0.14 | 74 (14.2) | 289 (14.2) | 0.99 |
| Valvular heart disease | 224 (21.3) | 1829 (21.1) | 0.89 | 340 (31.9) | 2544 (31.5) | 0.78 | 79 (15.1) | 308 (15.1) | 0.98 |
| Ventricular arrhythmia | 79 (7.5) | 690 (7.9) | 0.61 | 79 (7.4) | 591 (7.3) | 0.91 | 18 (3.5) | 60 (2.9) | 0.55 |
| Recent HF hospitalization (<1 year) | 212 (20.1) | 1992 (23.0) | <.05 | 1058 (99.3) | 7995 (98.9) | 0.30 | 23 (4.4) | 99 (4.9) | 0.67 |
| Recent ACS hospitalization (<1 year) | 709 (67.3) | 6799 (78.4) | <.0001 | 80 (7.5) | 767 (9.5) | <.05 | 11 (2.1) | 60 (2.9) | 0.30 |
| Recent stroke (< 1year) | 7 (0.7) | 97 (1.1) | 0.18 | 16 (1.5) | 139 (1.7) | 0.60 | 513 (98.3) | 2020 (98.9) | 0.23 |
| CV Drugs | |||||||||
| Nitrates | 530 (50.3) | 4243 (48.9) | 0.39 | 494 (46.3) | 3406 (42.1) | <.01 | 127 (24.3) | 506 (24.78) | 0.83 |
| Calcium channel blockers | 578 (54.9) | 4848 (55.9) | 0.54 | 594 (55.7) | 4303 (53.2) | 0.13 | 251 (48.1) | 950 (46.52) | 0.52 |
| Non-aspirin antiplatelets | 180 (17.1) | 898 (10.4) | <.0001 | 124 (11.6) | 625 (7.7) | <.0001 | 60 (11.5) | 239 (11.7) | 0.89 |
| Beta-blockers | 562 (53.4) | 4162 (48.0) | <.001 | 468 (43.9) | 3291 (40.7) | 0.05 | 266 (51.0) | 889 (43.54) | <.01 |
| Digoxin | 140 (13.3) | 1121 (12.9) | 0.73 | 278 (26.1) | 2030 (25.1) | 0.49 | 67 (12.8) | 275 (13.47) | 0.71 |
| Non-statin lipid lowering drugs | 84 (8.0) | 464 (5.4) | <0.001 | 69 (6.5) | 323 (4.0) | <.001 | 19 (3.6) | 84 (4.11) | 0.62 |
| Spironolactone | 20 (1.9) | 174 (2.0) | 0.82 | 63 (5.9) | 304 (3.8) | <.001 | 6 (1.2) | 30 (1.47) | 0.58 |
| Statins | 413 (39.2) | 2405 (27.7) | <.0001 | 282 (26.5) | 1565 (19.4) | <.0001 | 145 (27.8) | 436 (21.35) | <.01 |
| Thiazide diuretics | 123 (11.7) | 816 (9.4) | <.05 | 163 (15.3) | 863 (10.7) | <.0001 | 61 (11.7) | 215 (10.5) | 0.45 |
| Warfarin | 130 (12.4) | 862 (9.9) | <.05 | 266 (25.0) | 1704 (21.1) | <.01 | 62 (11.9) | 236 (11.6) | 0.84 |
| Other comorbidities | |||||||||
| Chronic pulmonary disease | 249 (23.7) | 1922 (22.2) | 0.28 | 412 (38.7) | 2586 (32.0) | <.0001 | 107 (20.5) | 328 (16.1) | 0.02 |
| Prior fractures | 19 (1.8) | 159 (1.8) | 0.95 | 43 (4.0) | 305 (3.8) | 0.68 | 16 (3.1) | 57 (2.8) | 0.74 |
| Cancer | 34 (3.2) | 323 (3.7) | 0.42 | 71 (6.7) | 432 (5.3) | 0.08 | 14 (2.7) | 75 (3.7) | 0.27 |
| Chronic kidney disease | 170 (16.1) | 945 (10.9) | <.0001 | 336 (31.5) | 1409 (17.4) | <.0001 | 81 (15.5) | 174 (8.5) | <.0001 |
| Dementia | 86 (8.2) | 731 (8.4) | 0.78 | 108 (10.1) | 1043 (12.9) | 0.01 | 120 (23.0) | 552 (27.0) | 0.06 |
| Mood disorders | 109 (10.4) | 954 (11.0) | 0.53 | 147 (13.8) | 1106 (13.7) | 0.92 | 79 (15.1) | 304 (14.9) | 0.89 |
| Other drugs | |||||||||
| Hormone replacement therapy | 37 (3.5) | 238 (2.7) | 0.15 | 29 (2.7) | 190 (2.4) | 0.46 | 19 (3.6) | 63 (3.1) | 0.52 |
| Glaucoma drugs | 117 (11.1) | 921 (10.6) | 0.62 | 121 (11.4) | 858 (10.6) | 0.46 | 84 (16.1) | 248 (12.1) | <.05 |
| Osteoporosis drugs | 109 (10.4) | 682 (7.9) | 0.005 | 112 (10.5) | 585 (7.2) | <.001 | 59 (11.3) | 170 (8.3) | <.05 |
| Preventive Services | |||||||||
| BMD test | 57 (5.4) | 339 (3.9) | 0.02 | 55 (5.2) | 208 (2.6) | <.0001 | 34 (6.5) | 78 (3.8) | <.01 |
| Prostate specific antigen test | 73 (6.9) | 712 (8.2) | 0.15 | 79 (7.4) | 477 (5.9) | 0.05 | 34 (6.5) | 112 (5.5) | 0.37 |
| Fecal occult blood test | 80 (7.6) | 758 (8.7) | 0.21 | 75 (7.0) | 621 (7.7) | 0.45 | 41 (7.9) | 165 (8.1) | 0.87 |
| Influenza vaccination | 551 (52.3) | 4333 (50.0) | 0.15 | 516 (48.4) | 4029 (49.8) | 0.38 | 244 (46.7) | 962 (47.1) | 0.88 |
| Screening mammography | 163 (15.5) | 1024 (11.8) | <.001 | 123 (11.5) | 599 (7.4) | <.0001 | 75 (14.4) | 211 (10.3) | <.01 |
| Pneumococcal vaccination | 96 (9.1) | 626 (7.2) | <.05 | 82 (7.7) | 596 (7.4) | 0.71 | 32 (6.1) | 137 (6.7) | 0.63 |
| Health Services Measures | |||||||||
| Prior nursing home admission | 39 (3.7) | 345 (4.0) | 0.67 | 113 (10.6) | 782 (9.7) | 0.34 | 44 (8.4) | 121 (5.9) | 0.04 |
| Number hospitalizations | 0.7 (1.2) | 0.6 (1.2) | <.05 | 1.21 (1.6) | 1.0 (1.5) | <.0001 | 0.6 (0.9) | 0.6 (1.1) | 0.31 |
| Number physician visits | 11.3 (7.3) | 9.9 (6.9) | <.0001 | 12.3 (8.8) | 10.2 (7.7) | <.0001 | 10.4 (7.3) | 9.2 (6.7) | <.001 |
| Number medications used | 11.5 (6.2) | 10.1 (5.7) | <.0001 | 13 (6.4) | 11.2 (6.1) | <.0001 | 10.0 (5.8) | 9.1 (5.5) | <.001 |
| Charlson_Score | 3.5 (2.2) | 3.4 (2.1) | 0.47 | 4.5 (2.5) | 3.9 (2.3) | <.0001 | 3.7 (2.2) | 3.7 (2.2) | 0.94 |
The value represent count (%) for binary variables and mean (SD) for continuous variables
In the HF cohort, ARB initiators were more likely to have diabetes, chronic pulmonary disease, and CKD. They used more CV medications and osteoporosis drugs and were more likely to have received preventive services such as bone mineral density tests, prostate specific antigen tests, and screening mammography. The number of hospitalizations, physician visits, and medications used were also higher in ARB initiators compared to ACEI initiators. However, ARB initiators were less likely to have had a recent hospitalization for ACS.
In the stroke cohort, ARB initiators were more likely to have CKD, to have used beta blockers, statins, glaucoma drugs, osteoporosis drugs, and to have undergone preventive procedures such as bone mineral density tests and mammography. ARB initiators also had more hospitalizations, physician visits, and greater medication use during the baseline year.
Use of and Adherence to ACEIs and ARBs
The most frequently used ACEI was enalapril (32.1%) followed by lisinopril (27.8%), ramipril (13.1%), captopril (12.9%), and quinapril (8.7%). The most frequently used ARB was losartan (55.0%) followed by valsartan (28.2%) and irbesartan (8.8%). (Appendix A for the complete list of counts in each generic drug)
In general, the proportion of days covered by the study medications (PDC) decreased from 100% to approximately 70% in 2 months and to below 60% between 7–10 months after initiation. The PDC remained about the same during 11–60 months in both groups. There was no substantial difference in the monthly PDCs between users of ACEIs and ARBs in all three cohorts. (Appendix B1–3)
The Number of Events and Incidence of Specified Outcomes
The number of each specified event, person-time and incidence rates for the events are shown in Table 2A–C. We identified a total of 2,535 deaths and 4,163 CV events in all study patients in our three cohorts. The mean follow-up until death or end of eligibility was 1.6 years (standard deviation, SD: 2.0 years) with a maximum of 12 years’ follow-up. The incidence rate for all-cause mortality was twice as high in the HF cohort (97.7 per 10,000 person-years) compared to the CAD or stroke cohorts (45.9 and 43.8 per 10,000 person-years respectively). The incidence rate for any subsequent CV hospitalization for MI, HF or stroke was also highest in the HF cohort mainly due to the high incidence of repeated HF hospitalizations. When comparing the ARB and ACEI initiators for each specific outcome, the crude rate ratios (RRs) for ARBs vs. ACEIs for death ranged from 0.47 (for sudden cardiac death, SCD in the HF cohort) to 1.38 (for SCD in the stroke cohort). However, most crude RRs for death and hospitalization outcomes were less than 1 indicating that ARB might be more favorable.
Table 2.
| A. Number of Events, Person-Years, Incidence
Rate and Crude Incidence Rate Ratio in the Main Cohort with CAD (N=9,728) | |||||||
|---|---|---|---|---|---|---|---|
|
| |||||||
| ARB (N=1053) | ACEI (N=8675) | ARB vs. ACEI | |||||
| # events |
Person- year |
Incidence rate | # events |
Person- year |
Incidence rate | Crude Incidence Rate Ratio |
|
| Death | 83 | 1810.4 | 45.9 (36.0 – 55.7) | 924 | 15543.6 | 59.5 (55.6 – 63.3) | 0.76 (0.62 – 0.94) |
| Cardiovascular Death | 43 | 1447.9 | 29.7 (20.8 – 38.6) | 579 | 13581.6 | 42.6 (39.2 – 46.1) | 0.69 (0.51 – 0.93) |
| Cardiac Death | 38 | 1447.9 | 26.3 (17.9 – 34.6) | 533 | 13581.6 | 39.2 (35.9 – 42.6) | 0.66 (0.48 – 0.90) |
| Sudden Cardiac Death | 16 | 1447.9 | 11.1 (5.6 – 16.5) | 270 | 13581.6 | 19.9 (17.5 – 22.3) | 0.55 (0.34 – 0.89) |
| Myocardial Infarction | 92 | 1721.7 | 53.4 (42.5 – 64.4) | 1064 | 14346.9 | 74.2 (69.7 – 78.6) | 0.70 (0.58 – 0.85) |
| Stroke | 53 | 1746.0 | 30.4 (22.2 – 38.5) | 418 | 15017.0 | 27.8 (25.2 – 30.5) | 1.07 (0.81 – 1.43) |
| Heart Failure | 147 | 1661.2 | 88.5 (74.2 – 102.8) | 1355 | 13895.4 | 97.5 (92.3 – 102.7) | 0.89 (0.75 – 1.05) |
| CV hospitalizations | 253 | 1546.4 | 163.6 (144.6–185.1) | 2384 | 12657.9 | 188.3 (180.9–196.1) | 0.85 (0.75 – 0.96) |
| B. Number of Events, Person-Years, Incidence
Rate and Crude Incidence Rate Ratio in the Main Cohort with HF (N=9,150) | |||||||
|---|---|---|---|---|---|---|---|
|
| |||||||
| ARB (N=1066) | ACEI (N=8084) | ARB vs. ACEI | |||||
| # events |
Person- year |
Incidence rate | # events |
Person- year |
Incidence rate | Incidence Rate Ratio | |
| Death | 121 | 1238.8 | 97.7 (80.3 – 115.1) | 1204 | 11035.6 | 109.1 (102.9 – 115.3) | 0.86 (0.71 – 1.03) |
| Cardiovascular Death | 59 | 1052.3 | 56.1 (41.8 – 70.4) | 721 | 10017.0 | 72.0 (66.7 – 77.2) | 0.75 (0.60 – 0.94) |
| Cardiac Death | 55 | 1052.3 | 52.3 (38.5 – 66.1) | 649 | 10017.0 | 64.8 (59.8 – 69.8) | 0.78 (0.61 – 0.98) |
| Sudden Cardiac Death | 15 | 1052.3 | 14.3 (7.0 – 21.5) | 305 | 10017.0 | 30.5 (27.0 – 33.9) | 0.45 (0.27 – 0.77) |
| Myocardial Infarction | 54 | 1206.3 | 44.8 (32.8 – 56.7) | 582 | 10560.2 | 55.1 (50.6 – 59.6) | 0.78 (0.60 – 1.02) |
| Stroke | 45 | 1203.1 | 37.4 (26.5 – 48.3) | 370 | 10769.4 | 34.4 (30.9 – 37.9) | 1.05 (0.79 – 1.40) |
| Heart Failure | 303 | 986.7 | 307.1 (272.5 – 341.7) | 2206 | 8854.8 | 249.1 (238.7 – 259.5) | 1.15 (1.02 – 1.29) |
| CV hospitalizations | 361 | 962.7 | 378.9(341.8 – 420.1) | 2792 | 8366 | 333.7(321.6–346.3) | 1.07 (0.97 – 1.19) |
| C. Number of Events, Person-Years, Incidence
Rate and Crude Incidence Rate Ratio in the Main Cohort with Stroke (N=2,564) | |||||||
|---|---|---|---|---|---|---|---|
|
| |||||||
| ARB (N=522) | ACEI (N=2042) | ARB vs. ACEI | |||||
| # events |
Person- year |
Incidence rate | # events |
Person- year |
Incidence rate | Incidence Rate Ratio | |
| Death | 37 | 844.5 | 43.8 (29.7 – 57.9) | 166 | 3360.9 | 49.4 (41.9 – 56.9) | 0.88 (0.61 – 1.28) |
| Cardio-vascular Death | 18 | 685.3 | 26.3 (14.1 – 38.4) | 88 | 2947.9 | 29.9 (23.6 – 36.1) | 0.87 (0.54 – 1.40) |
| Cardiac Death | 12 | 685.3 | 17.5 (7.6 – 27.4) | 55 | 2947.9 | 18.7 (13.7 – 23.6) | 0.92 (0.51 – 1.69) |
| Sudden Cardiac Death | 8 | 685.3 | 11.7 (3.6 – 19.8) | 25 | 2947.9 | 8.5 (5.2 – 11.8) | 1.34 (0.63 – 2.85) |
| Myocardial Infarction | 23 | 825.4 | 27.9 (16.5 – 39.3) | 100 | 3269.2 | 30.6 (24.6 – 36.6) | 0.91 (0.61 – 1.37) |
| Stroke | 59 | 794.4 | 74.3 (55.3 – 93.2) | 290 | 2986.0 | 97.1 (85.9 – 108.3) | 0.76 (0.58 – 0.99) |
| Heart Failure | 30 | 820.5 | 36.6 (23.5 – 49.6) | 122 | 3229.7 | 37.8 (31.1 – 44.5) | 0.95 (0.65 – 1.40) |
| CV hospitalizations | 96 | 761.9 | 126.0(103.1–153.9) | 459 | 2819.4 | 162.8(148.6–178.4) | 0.78 (0.63 – 0.95) |
Incidence rate: per 10,000 person –years
Comparative Effectiveness of ARBs vs. ACEIs (Adjusted Analyses)
After adjusting for multiple predefined factors in multivariate Cox models, we observed no clinically meaningful difference in the risk of all-cause death for ARB vs. ACEI initiators in the CAD (hazard ratio (HR) 0.92; 95% CI 0.74–1.15) or stroke cohorts (HR 1.04; 95% CI 0.68–1.58). However, the risk of death was lower in ARB initiators by 15% in the HF cohort (HR 0.85; 95% CI 0.71–1.02), leading to a 12% reduction in the risk of death for ARB initiators in the combined cohort (HR 0.88; 95% CI 0.77–1.01) (Table 3). For the specific causes of deaths, we observed a large reduction in the risk for SCDs by 49% in the HF cohort (HR 0.51; 95% CI 0.30–0.86) and by 31% in the combined cohort (HR 0.69; 95% CI 0.50–0.96). The risk of CV and cardiac death was also reduced by 16% for ARB vs. ACEI in the combined cohort. The risk of HF or stroke hospitalization was similar for both ARB and ACEI initiators in any cohort.
Table 3.
| A. Effectiveness of ARBs vs. ACEIs (Adjusted
Hazard Ratios Comparing ARBs to ACEIs) on Specified Outcomes in the CAD and HF Cohorts | ||||||
|---|---|---|---|---|---|---|
|
| ||||||
| CAD Cohort (N=9,728) |
HF Cohort (N=9,150) |
|||||
| Unadjusted Cox Model |
Multivariate analyses |
hd-PS analyses | Unadjusted Cox Model |
Multivariate analyses |
hd-PS analyses | |
| Death | 0.76 (0.62 – 0.94) | 0.92 (0.74 – 1.15) | 0.91 (0.73 – 1.14) | 0.86 (0.71 – 1.03) | 0.85 (0.71 – 1.02) | 0.89 (0.73 – 1.08) |
| Cardiovascular Death* | 0.69(0.51 – 0.93) | 0.85 (0.61 – 1.17) | 0.91 (0.66 – 1.25) | 0.75 (0.60 – 0.94) | 0.80 (0.63 – 1.01) | 0.80 (0.62 – 1.04) |
| Cardiac Death* | 0.66 (0.48 – 0.90) | 0.80 (0.56 – 1.12) | 0.90 (0.64 – 1.26) | 0.78 (0.61 – 0.98) | 0.84 (0.66 – 1.07) | 0.85 (0.65 – 1.11) |
| Sudden Cardiac Death* | 0.55 (0.34 – 0.89) | 0.70 (0.42 – 1.18) | 0.68 (0.40 – 1.14) | 0.45 (0.27 – 0.77) | 0.51 (0.30 – 0.86) | 0.48 (0.27 – 0.85) |
| Cerebro-vascular Death* | 1.33 (0.48 – 3.67) | 2.13 (0.98 – 4.62) | 1.49 (0.50 – 4.38) | 0.58 (0.18 – 1.89) | 0.52 (0.14 – 1.95) | 0.59 (0.19 – 1.84) |
| MI Hospitalization | 0.70 (0.58 – 0.85) | 0.80 (0.65 – 0.98) | 0.82 (0.66 – 1.03) | 0.78 (0.60 – 1.02) | 0.76 (0.58 – 1.00) | 0.70 (0.53 – 0.92) |
| HF Hospitalization | 0.89(0.75 – 1.05) | 1.02 (0.87 – 1.19) | 1.00 (0.83 – 1.19) | 1.15 (1.02 – 1.29) | 1.08 (0.96 – 1.22) | 1.11 (0.97 – 1.26) |
| Stroke Hospitalization | 1.07 (0.81 – 1.43) | 1.15 (0.86 – 1.54) | 1.13 (0.83 – 1.55) | 1.05 (0.79 – 1.40) | 1.18 (0.87 – 1.60) | 1.10 (0.77 – 1.57) |
| All CV hospitalizations | 0.85 (0.75 – 0.96) | 0.96 (0.85 – 1.08) | 0.96 (0.84 –1.10) | 1.07 (0.97 – 1.19) | 1.04 (0.93 – 1.15) | 1.05(0.93 – 1.17) |
| B. Effectiveness of ARBs vs. ACEIs (Adjusted
Hazard Ratios Comparing ARBs to ACEIs) on Specified Outcomes in the Stroke and Combined Cohorts | ||||||
|---|---|---|---|---|---|---|
|
| ||||||
| Stroke Cohort (N=2,564) |
Combined Cohort (N=21,442) |
|||||
| Unadjusted Cox Model |
Multivariate analyses |
hd-PS analyses | Unadjusted Cox Model |
Multivariate analyses |
hd-PS analyses | |
| Death | 0.88 (0.61 – 1.28) | 1.04 (0.68 – 1.58) | 1.06 (0.65 – 1.73) | 0.80 (0.70 – 0.92) | 0.88 (0.77 – 1.01) | 0.89 (0.77 – 1.04) |
| Cardiovascular Death* | 0.87 (0.54 – 1.40) | 1.20 (0.66 – 2.20) | 1.56 (0.85 – 2.87) | 0.73 (0.61 – 0.87) | 0.84 (0.70 – 1.01) | 0.87 (0.71 – 1.07) |
| Cardiac Death* | 0.92 (0.51 – 1.69) | 1.29 (0.61 – 2.74) | 1.69 (0.78 – 3.66) | 0.73 (0.60 – 0.89) | 0.84 (0.69 – 1.03) | 0.89 (0.72 – 1.11) |
| Sudden Cardiac Death* | 1.34 (0.63 – 2.85) | 2.09 (0.83 – 5.25) | 2.66 (0.93 – 7.64) | 0.59 (0.43 – 0.81) | 0.69 (0.50 – 0.96) | 0.67 (0.47 – 0.95) |
| Cerebro-vascular Death* | 0.71(0.29 – 1.77) | 1.26 (0.52 – 3.04) | 1.12 (0.41 – 3.05) | 0.80 (0.46 – 1.37) | 0.91 (0.51 – 1.64) | 0.93 (0.51 – 1.69) |
| MI Hospitalization | 0.91 (0.61 – 1.37) | 1.03 (0.67 – 1.57) | 0.95 (0.55 – 1.64) | 0.75 (0.65 – 0.87) | 0.81 (0.69 – 0.94) | 0.80 (0.67 – 0.95) |
| HF Hospitalization | 0.95 (0.65 – 1.40) | 1.15 (0.73 – 1.79) | 0.94 (0.52 – 1.69) | 1.01 (0.92 – 1.1) | 1.02 (0.93 – 1.12) | 1.03 (0.93 – 1.14) |
| Stroke Hospitalization | 0.76 (0.58 – 0.99) | 0.82 (0.61 – 1.09) | 0.82 (0.59 – 1.13) | 0.92 (0.77 – 1.08) | 0.99 (0.83 – 1.18) | 0.96 (0.79 – 1.16) |
| All CV hospitalizations | 0.78 (0.63 – 0.95) | 0.83 (0.67 – 1.03) | 0.81(0.63 – 1.04) | 0.92 (0.85 – 0.99) | 0.95 (0.88 – 1.02) | 0.96 (0.88 – 1.04) |
Values represent hazard ratio (95% confidence limits).
All models were stratified by calendar year for the index use of the study drug and accounted for clustering by providers.
Information on cause of death is available in the subsets (up to 2005 in PA and up to 2004 in NJ) and the analyses were restricted to 2005 in PA and 2004 in NJ
Multivariate analyses were adjusted for demographic information(age, gender, and race), cardiovascular comorbidities (history of ischemic heart disease, heart failure, valvular heart disease, Cardiomyopathy, atrial fibrillation/flutter, diabetes, ventricular arrhythmia, cerebrovascular disease, conduction disorders and well as recent hospitalization for heart failure, acute coronary syndrome, or stroke), cardiovascular drug use (nitrates, calcium channel blockers, beta blockers, digoxin, statins, spironolactone, antiplatelet drugs, diuretics, other lipid lowering drugs, and warfarin), non-cardiovascular diagnoses (cancer, osteoporosis, chronic kidney disease, chronic obstructive pulmonary disease, mood disorder, psychotic disorder, dementia, delirium, fracture, anxiety, and other mental disorders), non-CV preventive medications (hormone replacement therapy, glaucoma drugs, and osteoporosis drugs), preventive services (bone mineral density test, prostate specific antigen test, fecal occult blood test, mammogram, influenza vaccine, and pneumococcal vaccine), and health service use measures (number of prior hospitalizations, number of office visits, number of generic medications, prior nursing home admission, and Charlson comorbidity score)
The risk of any CV hospitalization was close to unity (HR 0.95; 95% CI 0.88–1.02) in the combined cohort as well as in each specific cohort (Table 3). However, we observed 19–24% reduction in the risk for MI hospitalization for ARB initiators vs. ACEI initiators in the CAD, HF, and combined cohorts. The estimates from high dimensional propensity score (hd-PS) analyses adjusting for deciles of hd-PS were very similar to the results from the primary multivariate analyses, although the effect estimates from the hd-PS analyses tended to be slightly closer to the null (Table 3). Secondary analyses using continuous exposure or intention-to-treat (ITT) methods produced similar results to the primary analyses (data available upon request).
Agent-Specific and Subgroup Analyses
When we assessed the effectiveness of commonly prescribed specific ARBs (losartan and valsartan) compared to commonly prescribed specific ACEIs (enalapril and lisinopril), we observed that the HRs were not different from the main analyses comparing all ARBs to ACEIs (Appendix C).
In the exploratory subgroup analyses, ARBs appeared more protective for death in patients who were < 80 years old, whereas ARBs appeared less protective for all CV hospitalization in patients who were < 80 years old (Figure 1). For all 3 outcomes presented in Figure 1, ARBs appeared less protective (closer to or greater than 1) in men than women, black patients than non-black patients, or those with diabetes. Although the power of subgroup analyses for the SCD outcome was especially limited, we observed that the point estimate comparing ARBs and ACEIs was closer to 1 in male, black or diabetes patients as well as those who had ejection fraction (EF) < 45%.
Figure 1.
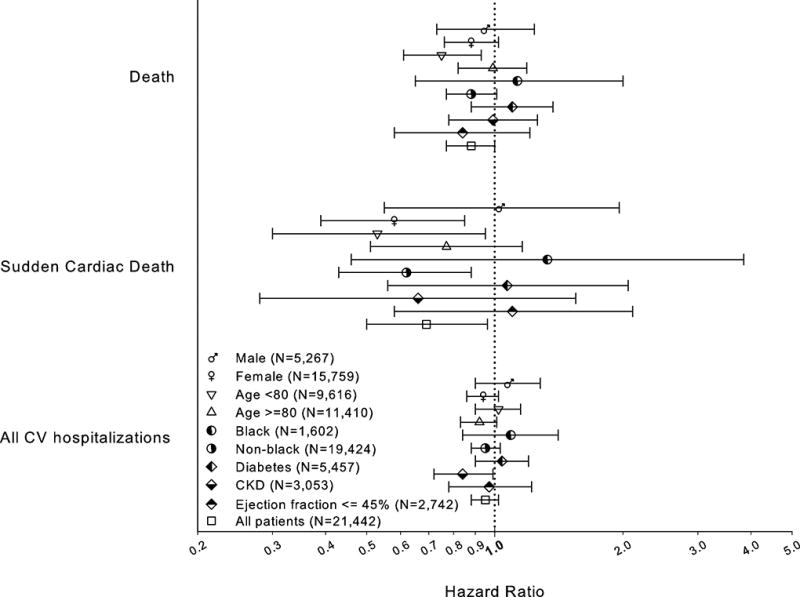
Comparative Effectiveness of ARB vs. ACEI (Adjusted Hazard Ratios) on Selected Outcomes in Subgroups of Patients Defined by Gender, Race, Age, and Comorbidities among All Patients (The CAD, HF, and Stroke Cohorts Combined)
Sensitivity Analyses
Figure 2 illustrates the potential impact of unmeasured EF on SCD outcomes. We fixed the prevalence of low EF at 60% and the observed HR at 0.51, 0.30 or 0.86 (point estimate and the upper and lower 95% CI for the SCD outcome in the HF cohort). When the observed HR was 0.51, a large imbalance in the prevalence of low EF is required for the corrected HRs (true HR) to be close to 1 (the null). However, when the observed HR was 0.86, only a small imbalance (less than 15% difference in the prevalence) would be necessary for the true HR to be 1.
Figure 2.
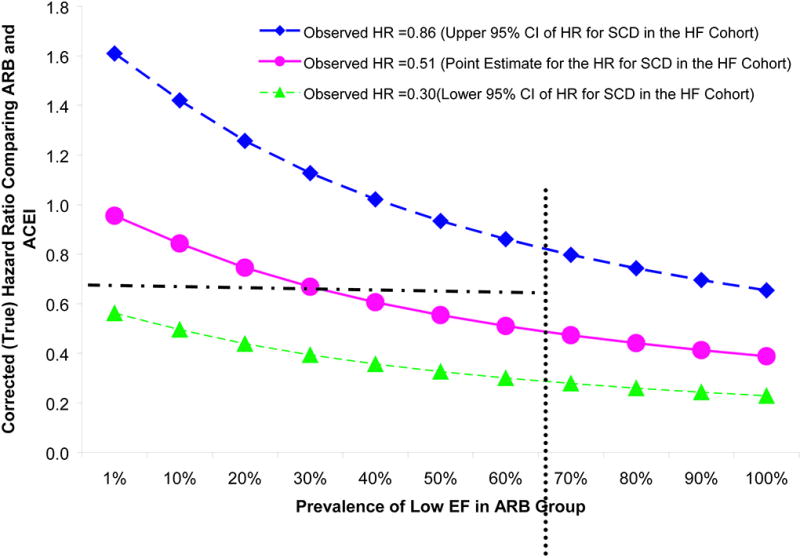
Sensitivity Analyses Assessing the Impact of Ejection Fraction on Sudden Cardiac Death Outcome.
The HR comparing ARBs to ACEIs was fixed at 0.30 (green line), 0.51 (pink line), and 0.86 (dark blue line) (the point estimate and upper and lower 95% CI for the observed HR in HF cohort). The risk ratio between low EF (<45%) vs. high EF (>=45%) and SCD was assumed to be 2.5. The prevalence of low EF was fixed at 60% in the ACEI group and varied from 1% to 100% in ARB group. When the observed HR was 0.51, a large imbalance in the prevalence of low EF between ARB and ACEI group (60% difference in the actual prevalence) is needed for the corrected HR to be close to the null. When the observed HR was 0.86, less than 15 % difference in the prevalence of low EF in the two groups was necessary for the corrected HF to be 1(the null).
CONCLUSION
The effectiveness of ARBs on CV hospitalizations for HF and stoke may be comparable to that of ACEIs. The observed reduction in the risk of SCDs and MI may be explained, at least in part, by 1) lack of data on EF and 2) the differential health-seeking behavior (healthy user bias). However, a protective effect of ARBs in the risk for SCD and MI in ARB users cannot be ruled out. While Medicare data provides excellent generalizability and longitudinal follow-up for clinical outcomes in a large population underrepresented in trials, the validity of studies using the data may be hindered by lack of important clinical information and behavioral characteristics for some outcomes. Researchers may link administrative data with other data sources with clinical information to enhance the validity of observational comparative effectiveness research (CER), e.g., linking Medicare Part A, B, and D data to nationwide clinical registries(6–7) or electronic medical records. Furthermore, payors such as the Centers for Medicare and Medicaid Services may consider strategies to improve clinical practice and the utility of the data for observational research such as collecting additional behavioral or socioeconomic information or clinical data for prevalent conditions such as EF in HF for reimbursement.
DISCUSSION
We conducted an observational study assessing the comparative effectiveness of ARBs vs. ACEIs using healthcare utilization data with detailed information for medication and health services use in Medicare patients. We observed similar incidence rates of CV hospitalizations among users of ARBs compared to users of ACEIs. However, we found that, compared to ACEI initiators, ARB initiators had 12% lower all-cause mortality, and a 31% reduction in SCD in the combined cohort. We also observed 19–24% reduction in MI hospitalizations in ARB initiators compared to ACEI initiators in the CAD, HF and combined cohorts.
ARBs are a newer, more expensive class of drugs considered to have similar efficacy and indications as ACEIs. The risk of treatment-associated hyperkalemia and renal dysfunction was shown to be similar between these classes (1), yet more cough is reported in ACEI users. Three major trials comparing an ABR to an ACEI for the treatment of MI and/or HF regardless of the presence of hypertension (OPTIMAAL, VALIANT, and ELITE II) did not prove superiority of ARBs to ACEIs in patients with MI and/or HF (8–10) on mortality (RR= 1·13, p=0·07 for OPTIMAAL, RR=1.0, p=0.98 for VALIANT, and RR= 1.13, p=0.16 for ELITE II), SCD(RR=1.19, p=0.07 for OPTIMAAL, RR=1.25, p=0.08 for ELITE II), or re-infarction (RR= 1·03, p=0·72 for OPTIMAAL). We previously compared the effectiveness of ARBs vs. ACEIs among elderly patients after MI with or without hypertension and found no meaningful differences in outcomes among users of these two classes(11). Despite the suggested mechanistic differences in pharmacological actions between ACEIs and ARBs, these clinical studies support similarity in the effect between the two classes but failed to prove superiority of ARBs over ACEIs.
The current study illustrates opportunities and challenges in CER using Medicare data. Observational studies using large Medicare databases like this provide valid information on drug use and outcomes, long-term follow-up with minimal loss to follow-up, large sample size and representative populations, which are important factors determining the internal and external validity of CER. All or some of these characteristics are not usually seen in clinical trials or studies using other data sources. However, the biggest threat to the validity for observational studies using administrative databases is confounding due to lack of more detailed clinical, behavioral, and socioeconomic information.
Although we anticipated that users of ACEIs and ARBs would be comparable, our data showed substantial differences in the patient characteristics between users of these two classes. The non-comparability between ACEI and ARB users may arise from either self-selection or variations in physicians’ prescribing practices. For example, we observed that ARBs were often prescribed to those with chronic kidney diseases, which may be driven by the belief that ARBs are less harmful to the kidney (12). We also observed that ARB users were more likely to use preventive medications such as statins and osteoporosis drugs and preventive services such as screening mammography and a bone mineral density test, suggesting that ARB users may have a better access to health care and may be more engaged in health seeking behaviors, potentially leading to a healthy user bias. The healthy user bias has been observed in users of preventive medications such as statins) (7, 13))or hormone replacement therapy(14) causing distortion of their effect in observational studies assessing the benefits or harms. Because ARBs are newer and more expensive medications that are actively advertised to consumers, it is possible that users were more health-seeking and/or affluent leading to similar bias observed in users of preventive medications. We may not have fully controlled potential biases for these outcomes, even after adjusting for multiple factors including use of preventive drugs and services and using hd-PS analyses.
The observed 31 to 49% reduction in the risk of SCDs may be explained, at least in part, by healthy user bias as well as lack of data on EF in Medicare data. As the HF guidelines recommend ACEIs as the first line therapy(15) and low EF is associated with higher incidence of SCD(16), physicians may be more likely to prescribe ACEIs for patients with systolic dysfunction. The sensitivity analysis showed that the imbalance in the prevalence of low EF between ARB and ACEI users might have caused a downward bias (i.e. closer to the null if the effect is harmful (>1) or away from the null if the effect is protective (< 1)) if ACEI users are more likely to have low EF. In subgroup analyses, although the 95% confidence limits were wide, the effect of ARB on SCD was closer to the null in those with low EF (<45%).
METHOD
Data Sources
We used data from Pharmaceutical Assistance Contract for the Elderly (PACE) program linked with Medicare files in Pennsylvania (PACE/Medicare) from 1994 to 2006 and Pharmaceutical Assistance for the Aged and Disabled (PAAD) program linked with Medicare files in New Jersey (PAAD/Medicare) from 1994 to 2006.
The PACE program was established in 1984 to assist residents of Pennsylvania (PA) aged 65 years or older who are not eligible for Medicaid and may be unable to pay for their prescription medications. PACE provides complete pharmacy benefits for all drugs with a small co-payment ($6–9). The eligibility criteria for PACE changed slightly over time but as of 2009 they were an annual income <$14,500 if single and <$17,700 if married during the study period. PACE covers approximately 12% of Medicare-eligible persons in Pennsylvania.
The PAAD program in New Jersey (NJ) is quite similar to PACE. There is no deductible and a small co-payment of $5. The current income eligibility criteria for PAAD were an annual income between $24,432 and $29,956 for a married couple. PAAD covers approximately 17% of NJ Medicare patients.
We also used aggregated national clinical registry data for HF/CAD patients from several quality improvement and accreditation programs managed on the same platform from Outcome Sciences Inc. using common data elements, data clarification procedures, and quality assurance practices(17). Data were available from the states of NJ and PA from 7/1/1999 to 12/31/2005 with approximately 10,000 HF and 10,000 CAD patients.
Study Cohorts
All individuals were ≥ 65 years old at the time of an index hospitalization for HF, CAD, or stroke during the study period of 1/1/95-12/31/06. We used previously validated definitions for hospitalizations for CAD, HF, and stroke with high positive predictive values (PPV) of >90%. HF hospitalization was defined as an admission with International Classification of Diseases, 9th revision (ICD-9) code of 428 as a primary diagnosis.(18) CAD was defined as an admission with ICD9 codes of 410–414 as a primary diagnosis(19), and stroke was defined as an admission with ICD9 of 433.x1, 434.x1, 435, 436, 437.1x, or 437.9x as a primary diagnosis(19).
To ensure a 12-month eligibility period prior to the index hospitalization, all study subjects were required to have utilized ≥1 medical service and ≥1 prescription, both within the 6 months as well as during the 6–12 months prior to the index hospitalization. To minimize potential biases due to including prevalent users(14) patients entered the initiator (new user) cohorts if they filled a first prescription for an ACEI or ARB within 90 days after the index hospitalization. They were also required to have had ≥ 2 diagnoses of hypertension or 1 diagnosis of hypertension plus 1 dispensed prescription for any hypertensive medications such as thiazide diuretics, calcium channel blockers, beta-blockers, and alpha-blockers but not for ACEIs or ARBs during the 6-month period prior to the index hospitalization.
Exposure
The exposure of interest was use of any ARB, which includes candesartan, eprosartan, irbesartan, losartan, olmesartan, medoxomil, telmisartan, and valsartan. The comparison was the use of any ACEI, which includes captopril, benazepril, enalapril, lisinopril, fosinopril, ramipril, perindopril, quinapril, moexipril, and trandolapril. The use of ARBs or ACEIs was assessed longitudinally. For each patient we created a diary of study drug coverage during the follow-up by linking consecutive dispensings based on dispensing dates and reported days’ supply.
In primary analyses, subjects were considered exposed beginning on the first fill and ending 14 days (grace period) after the last fill in the study period. As secondary analyses, we considered the following: 1) continuous exposure: Subjects were considered exposed beginning on the first fill and ending when they have been without available supply for 14 days for the first time. 2) ITT: In an analog to an intention-to-treat analysis, subjects were considered exposed to the initial drug regardless of subsequent usage patterns. In the ITT analyses, follow-up for this study was restricted to 12 months to minimize bias due to potential exposure misclassification.
Study Outcomes
Study outcomes of interest included death from any-cause, CV death, cardiac death, and SCD as well as hospitalizations for CV events, i.e., MI(20), HF(18), and stroke(21), (22)As the information from death certificates was available only up to 12/31/2005 in PA and 12/31/2004 in NJ, the analyses for cause-specific deaths were restricted to the available years. To define hospitalization events, we used previously validated definitions with high PPV to minimize misclassification bias.(23) Each of the definitions for MI, HF, and stroke had previously been shown to have PPV of 94–96% (18), (20–21), and the definition for SCD was shown to have a PPV of 86%.(24)
Censoring
Patients were censored at the first event of the following: 1) death, 2) loss of PACE, PAAD or Medicare eligibility, 3) admission to a nursing home or hospice, 5) discontinuation of the drug class initiated or 6) switching to the other drug class of study.
Potential Confounders and Effect Modifiers
We defined various patient characteristics using information during the 12 months prior to the date of the index hospitalization for HF, CAD, or stroke.
Demographic information
Age at the index hospitalization, gender, and race.
Comorbidities
We employed ICD-9 diagnostic codes(16), procedure codes,(6) and medication use to define clinical conditions that may be associated with risk of the outcomes of interest. The conditions included prior cerebrovascular disease(19), prior HF (18–19), prior CAD(19), CKD(25), ventricular arrhythmia(26), atrial fibrillation(27), other evidence of ischemic heart disease (e.g., angina, percutaneous coronary intervention, coronary artery bypass graft, or nitroglycerin use), other CV conditions (e.g., valvular disease, aneurysms, peripheral vascular disease(19)), cancer, diabetes, dementia, mood disorders, and other psychiatric disorders.
Preventive services and healthcare utilization
Use of preventive and other health care services that is potentially predictive of healthy user behaviors were also assessed including screening mammography, bone mineral density tests, prostate specific antigen testing, influenza and pneumococcal vaccines, number of hospitalizations, prior nursing home stay, number of physician visits, and total number of medications used (excluding ACEIs/ARBs and drugs used to define covariates).(9)
Statistical Analyses
Descriptive Analysis
Patient characteristics were compared among initiators of ARBs and ACEIs. We evaluated differences between drug classes using chi-square tests (binary variables) and t-tests (continuous variables). Adherences to ACEIs and ARBs was measured using the proportion of days covered (PDC), a valid and widely-used adherence metric(28). PDC was calculated for each calendar month based for each patient by dividing the number of days with ACEI/ARB supply available by the number of patient-days contributed in that calendar month(29).
Event counts, person-time of follow-up and incidence rates for the individual outcomes among ARB and ACE users as well as unadjusted RR with 95% confidence intervals (CI) comparing ARBs to ACEIs were reported.
Multivariate Analysis (Primary)
We assessed the associations among exposure and each outcome, adjusted for pre-specified covariates, using multivariable Cox proportional hazards models. We adjusted for the pre-specified characteristics and variables including demographic information, CV comorbidities, CV drug use, non-CV comorbidities, non-CV preventive medications, preventive services, and health service utilization patterns (Table 1).
High-dimensional Propensity Score Analysis (Secondary)
We also used the hd-PS to account for covariates that may collectively be proxies for unobserved factors. The details of the method are described elsewhere(30). Briefly, we used data from the 365 days prior to the index date to identify the 200 most prevalent diagnoses, procedures or drugs dispensed. The covariates identified empirically as well as the aforementioned predefined variables were entered into a logistic regression model with exposure (ARB vs. ACEI) as an outcome.
Both multivariate and hd-PS adjusted Cox models included calendar year of the index hospitalization and state as a stratification variable allowing baseline differences in the incidence of outcomes in each calendar year and state. The models also accounted for clustering within hospital providers by using the robust sandwich estimator of Wei et al.(31) We estimated fully adjusted RRs within each cohort as well as in the combined cohort with CAD, HF, and stroke patients using cohort as a stratification variable allowing for different baseline risks.
Exploratory Subgroup Analyses
We conducted exploratory subgroup analyses in patients defined by gender, race (white vs. others), age group (≥80 vs. <80), presence of diabetes, or diagnosed CKD. In addition, we used a claims-based definition of systolic dysfunction to identify patients whose ejection fraction (EF) was less than 45%.The definition required patients to have no diagnosis of atrial fibrillation during 180 days before or during the index hospitalization and to receive digoxin during 180 days prior to the index hospitalization. This definition had a PPV of 87% for identifying patients EF <45% in 558 Medicare/PAAD or PACE patients in PA or NJ linked to the Outcome HF/CAD registry and had a quantitative assessment of EF during the hospitalization.
Sensitivity Analyses
As the guidelines for HF recommend ACEI as the first line treatment of symptomatic or asymptomatic systolic dysfunction, patients in the ARB group may have less systolic dysfunction compared to those in the ACEI group. It is also likely that ARBs are more frequently used for patients with preserved EF HF as a few trials tested the efficacy of an ARB in patients with preserved EF and found a trend toward reduced cardiovascular death or HF hospitalization. It is also suggested that the risk of SCD is higher in HF patients with low EF(16). Altogether, these potential imbalances could have resulted in an apparent protective effect of ARBs on the SCD outcome. We, therefore, conducted sensitivity analyses assessing the impact of unmeasured EF on SCD(32). We estimated that HF patients with low EF (< 45%) had approximately 2.5 times higher a risk of SCD compared to those with higher EF (≥ 45%)(16). As the prevalence of low EF in general HF patients was 50%(33–34), we assumed that the prevalence of low EF in ACEI group would be 60%. We then varied the prevalence of low EF patients in ACEI and ARB groups to quantitatively estimate the corrected association between ARBs vs. ACEIs and SCD.
Acknowledgments
Funding Sources: This project was funded under Contract No.HHSA290-2005-0016-I -TO3 from the Agency for Healthcare Research and Quality, US Department of Health and Human Services as part of the Developing Evidence to Inform Decisions about Effectiveness (DEcIDE) program. The authors of this report are responsible for its content. Statements in the report should not be construed as endorsement by the Agency for Healthcare Research and Quality or the US Department of Health and Human Services. Dr. Setoguchi is supported by a mid-career development award grant K02-HS017731 from the Agency for Healthcare Research and Quality, US Department of Health and Human Services. Dr. Shrank is supported by a career development award from the National Heart, Lung and Blood Institute (HL-090505).
Appendix
Table 1.
Characteristics of the Study Population
| CAD (N=9,728) | HF (N=9,150) | Stroke (N=2,564) | |||||||
|---|---|---|---|---|---|---|---|---|---|
|
| |||||||||
| Variables | ARB (n=1,053) |
ACE (n= 8,675) |
p-value | ARB (n=1,066) |
ACE (n= 8,084) |
p-value | ARB (n=522) |
ACE (n= 2,042) |
p-value |
| Demographic | |||||||||
| Age | 78.7 (6.9) | 79.0 (6.9) | 0.14 | 81.0 (7.1) | 81.5 (7.2) | <.05 | 80.6 (6.8) | 80.2 (6.8) | 0.17 |
| Gender (female) | 793 (75.3) | 6241 (71.9) | <.05 | 811 (76.1) | 6161 (76.2) | 0.92 | 425 (81.4) | 1610 (78.8) | 0.20 |
| Black | 89 (8.5) | 586 (6.8) | <.05 | 87 (8.2) | 621 (7.7) | 0.59 | 59 (11.3) | 186 (9.1) | 0.13 |
| CV Risk Factors and Comorbidities | |||||||||
| Diabetes | 271 (25.7) | 2297 (26.5) | 0.61 | 310 (29.1) | 2116 (26.2) | <.05 | 113 (21.7) | 500 (24.5) | 0.18 |
| Prior CAD | 1023 (97.2) | 8471 (97.7) | 0.32 | 623 (58.4) | 4599 (56.9) | 0.34 | 173 (33.1) | 712 (34.9) | 0.46 |
| Atrial fibrillation | 251 (23.8) | 2026 (23.4) | 0.73 | 436 (40.9) | 3388 (41.9) | 0.53 | 112 (21.5) | 481 (23.6) | 0.31 |
| Cerebrovascular disease | 49 (4.7) | 506 (5.8) | 0.12 | 67 (6.3) | 607 (7.5) | 0.15 | 515 (98.7) | 2027 (99.3) | 0.18 |
| Prior HF | 375 (35.6) | 3523 (40.6) | <.01 | 1064 (99.8) | 8042 (99.5) | 0.14 | 74 (14.2) | 289 (14.2) | 0.99 |
| Valvular heart disease | 224 (21.3) | 1829 (21.1) | 0.89 | 340 (31.9) | 2544 (31.5) | 0.78 | 79 (15.1) | 308 (15.1) | 0.98 |
| Ventricular arrhythmia | 79 (7.5) | 690 (7.9) | 0.61 | 79 (7.4) | 591 (7.3) | 0.91 | 18 (3.5) | 60 (2.9) | 0.55 |
| Recent HF hospitalization (<1 year) | 212 (20.1) | 1992 (23.0) | <.05 | 1058 (99.3) | 7995 (98.9) | 0.30 | 23 (4.4) | 99 (4.9) | 0.67 |
| Recent ACS hospitalization (<1 year) | 709 (67.3) | 6799 (78.4) | <.0001 | 80 (7.5) | 767 (9.5) | <.05 | 11 (2.1) | 60 (2.9) | 0.30 |
| Recent stroke (< 1year) | 7 (0.7) | 97 (1.1) | 0.18 | 16 (1.5) | 139 (1.7) | 0.60 | 513 (98.3) | 2020 (98.9) | 0.23 |
| CV Drugs | |||||||||
| Nitrates | 530 (50.3) | 4243 (48.9) | 0.39 | 494 (46.3) | 3406 (42.1) | <.01 | 127 (24.3) | 506 (24.78) | 0.83 |
| Calcium channel blockers | 578 (54.9) | 4848 (55.9) | 0.54 | 594 (55.7) | 4303 (53.2) | 0.13 | 251 (48.1) | 950 (46.52) | 0.52 |
| Non-aspirin antiplatelets | 180 (17.1) | 898 (10.4) | <.0001 | 124 (11.6) | 625 (7.7) | <.0001 | 60 (11.5) | 239 (11.7) | 0.89 |
| Beta-blockers | 562 (53.4) | 4162 (48.0) | <.001 | 468 (43.9) | 3291 (40.7) | 0.05 | 266 (51.0) | 889 (43.54) | <.01 |
| Digoxin | 140 (13.3) | 1121 (12.9) | 0.73 | 278 (26.1) | 2030 (25.1) | 0.49 | 67 (12.8) | 275 (13.47) | 0.71 |
| Non-statin lipid lowering drugs | 84 (8.0) | 464 (5.4) | <0.001 | 69 (6.5) | 323 (4.0) | <.001 | 19 (3.6) | 84 (4.11) | 0.62 |
| Spironolactone | 20 (1.9) | 174 (2.0) | 0.82 | 63 (5.9) | 304 (3.8) | <.001 | 6 (1.2) | 30 (1.47) | 0.58 |
| Statins | 413 (39.2) | 2405 (27.7) | <.0001 | 282 (26.5) | 1565 (19.4) | <.0001 | 145 (27.8) | 436 (21.35) | <.01 |
| Thiazide diuretics | 123 (11.7) | 816 (9.4) | <.05 | 163 (15.3) | 863 (10.7) | <.0001 | 61 (11.7) | 215 (10.5) | 0.45 |
| Warfarin | 130 (12.4) | 862 (9.9) | <.05 | 266 (25.0) | 1704 (21.1) | <.01 | 62 (11.9) | 236 (11.6) | 0.84 |
| Other comorbidities | |||||||||
| Chronic pulmonary disease | 249 (23.7) | 1922 (22.2) | 0.28 | 412 (38.7) | 2586 (32.0) | <.0001 | 107 (20.5) | 328 (16.1) | 0.02 |
| Prior fractures | 19 (1.8) | 159 (1.8) | 0.95 | 43 (4.0) | 305 (3.8) | 0.68 | 16 (3.1) | 57 (2.8) | 0.74 |
| Cancer | 34 (3.2) | 323 (3.7) | 0.42 | 71 (6.7) | 432 (5.3) | 0.08 | 14 (2.7) | 75 (3.7) | 0.27 |
| Chronic kidney disease | 170 (16.1) | 945 (10.9) | <.0001 | 336 (31.5) | 1409 (17.4) | <.0001 | 81 (15.5) | 174 (8.5) | <.0001 |
| Dementia | 86 (8.2) | 731 (8.4) | 0.78 | 108 (10.1) | 1043 (12.9) | 0.01 | 120 (23.0) | 552 (27.0) | 0.06 |
| Mood disorders | 109 (10.4) | 954 (11.0) | 0.53 | 147 (13.8) | 1106 (13.7) | 0.92 | 79 (15.1) | 304 (14.9) | 0.89 |
| Other drugs | |||||||||
| Hormone replacement therapy | 37 (3.5) | 238 (2.7) | 0.15 | 29 (2.7) | 190 (2.4) | 0.46 | 19 (3.6) | 63 (3.1) | 0.52 |
| Glaucoma drugs | 117 (11.1) | 921 (10.6) | 0.62 | 121 (11.4) | 858 (10.6) | 0.46 | 84 (16.1) | 248 (12.1) | <.05 |
| Osteoporosis drugs | 109 (10.4) | 682 (7.9) | 0.005 | 112 (10.5) | 585 (7.2) | <.001 | 59 (11.3) | 170 (8.3) | <.05 |
| Preventive Services | |||||||||
| BMD test | 57 (5.4) | 339 (3.9) | 0.02 | 55 (5.2) | 208 (2.6) | <.0001 | 34 (6.5) | 78 (3.8) | <.01 |
| Prostate specific antigen test | 73 (6.9) | 712 (8.2) | 0.15 | 79 (7.4) | 477 (5.9) | 0.05 | 34 (6.5) | 112 (5.5) | 0.37 |
| Fecal occult blood test | 80 (7.6) | 758 (8.7) | 0.21 | 75 (7.0) | 621 (7.7) | 0.45 | 41 (7.9) | 165 (8.1) | 0.87 |
| Influenza vaccination | 551 (52.3) | 4333 (50.0) | 0.15 | 516 (48.4) | 4029 (49.8) | 0.38 | 244 (46.7) | 962 (47.1) | 0.88 |
| Screening mammography | 163 (15.5) | 1024 (11.8) | <.001 | 123 (11.5) | 599 (7.4) | <.0001 | 75 (14.4) | 211 (10.3) | <.01 |
| Pneumococcal vaccination | 96 (9.1) | 626 (7.2) | <.05 | 82 (7.7) | 596 (7.4) | 0.71 | 32 (6.1) | 137 (6.7) | 0.63 |
| Health Services Measures | |||||||||
| Prior nursing home admission | 39 (3.7) | 345 (4.0) | 0.67 | 113 (10.6) | 782 (9.7) | 0.34 | 44 (8.4) | 121 (5.9) | 0.04 |
| Number hospitalizations | 0.7 (1.2) | 0.6 (1.2) | <.05 | 1.21 (1.6) | 1.0 (1.5) | <.0001 | 0.6 (0.9) | 0.6 (1.1) | 0.31 |
| Number physician visits | 11.3 (7.3) | 9.9 (6.9) | <.0001 | 12.3 (8.8) | 10.2 (7.7) | <.0001 | 10.4 (7.3) | 9.2 (6.7) | <.001 |
| Number medications used | 11.5 (6.2) | 10.1 (5.7) | <.0001 | 13 (6.4) | 11.2 (6.1) | <.0001 | 10.0 (5.8) | 9.1 (5.5) | <.001 |
| Charlson_Score | 3.5 (2.2) | 3.4 (2.1) | 0.47 | 4.5 (2.5) | 3.9 (2.3) | <.0001 | 3.7 (2.2) | 3.7 (2.2) | 0.94 |
The value represent count (%) for binary variables and mean (SD) for continuous variables
Table 2.
| A. Number of Events, Person-Years,
Incidence Rate and Crude Incidence Rate Ratio in the Main
Cohort with CAD (N=9,728) | |||||||
|---|---|---|---|---|---|---|---|
|
| |||||||
| ARB (N=1053) | ACEI (N=8675) | ARB vs. ACEI | |||||
| # events |
Person- year |
Incidence rate | # events |
Person- year |
Incidence rate | Crude Incidence Rate Ratio |
|
| Death | 83 | 1810.4 | 45.9 (36.0 – 55.7) | 924 | 15543.6 | 59.5 (55.6 – 63.3) | 0.76 (0.62 – 0.94) |
| Cardiovascular Death | 43 | 1447.9 | 29.7 (20.8 – 38.6) | 579 | 13581.6 | 42.6 (39.2 – 46.1) | 0.69 (0.51 – 0.93) |
| Cardiac Death | 38 | 1447.9 | 26.3 (17.9 – 34.6) | 533 | 13581.6 | 39.2 (35.9 – 42.6) | 0.66 (0.48 – 0.90) |
| Sudden Cardiac Death | 16 | 1447.9 | 11.1 (5.6 – 16.5) | 270 | 13581.6 | 19.9 (17.5 – 22.3) | 0.55 (0.34 – 0.89) |
| Myocardial Infarction | 92 | 1721.7 | 53.4 (42.5 – 64.4) | 1064 | 14346.9 | 74.2 (69.7 – 78.6) | 0.70 (0.58 – 0.85) |
| Stroke | 53 | 1746.0 | 30.4 (22.2 – 38.5) | 418 | 15017.0 | 27.8 (25.2 – 30.5) | 1.07 (0.81 – 1.43) |
| Heart Failure | 147 | 1661.2 | 88.5 (74.2 – 102.8) | 1355 | 13895.4 | 97.5 (92.3 – 102.7) | 0.89 (0.75 – 1.05) |
| CV hospitalizations | 253 | 1546.4 | 163.6 (144.6–185.1) | 2384 | 12657.9 | 188.3 (180.9–196.1) | 0.85 (0.75 – 0.96) |
| B. Number of Events, Person-Years,
Incidence Rate and Crude Incidence Rate Ratio in the Main
Cohort with HF (N=9,150) | |||||||
|---|---|---|---|---|---|---|---|
|
| |||||||
| ARB (N=1066) | ACEI (N=8084) | ARB vs. ACEI | |||||
| # events |
Person- year |
Incidence rate | # events |
Person- year |
Incidence rate | Incidence Rate Ratio | |
| Death | 121 | 1238.8 | 97.7 (80.3 – 115.1) | 1204 | 11035.6 | 109.1 (102.9 – 115.3) | 0.86 (0.71 – 1.03) |
| Cardiovascular Death | 59 | 1052.3 | 56.1 (41.8 – 70.4) | 721 | 10017.0 | 72.0 (66.7 – 77.2) | 0.75 (0.60 – 0.94) |
| Cardiac Death | 55 | 1052.3 | 52.3 (38.5 – 66.1) | 649 | 10017.0 | 64.8 (59.8 – 69.8) | 0.78 (0.61 – 0.98) |
| Sudden Cardiac Death | 15 | 1052.3 | 14.3 (7.0 – 21.5) | 305 | 10017.0 | 30.5 (27.0 – 33.9) | 0.45 (0.27 – 0.77) |
| Myocardial Infarction | 54 | 1206.3 | 44.8 (32.8 – 56.7) | 582 | 10560.2 | 55.1 (50.6 – 59.6) | 0.78 (0.60 – 1.02) |
| Stroke | 45 | 1203.1 | 37.4 (26.5 – 48.3) | 370 | 10769.4 | 34.4 (30.9 – 37.9) | 1.05 (0.79 – 1.40) |
| Heart Failure | 303 | 986.7 | 307.1 (272.5 – 341.7) | 2206 | 8854.8 | 249.1 (238.7 – 259.5) | 1.15 (1.02 – 1.29) |
| CV hospitalizations | 361 | 962.7 | 378.9(341.8 – 420.1) | 2792 | 8366 | 333.7(321.6–346.3) | 1.07 (0.97 – 1.19) |
| C. Number of Events, Person-Years,
Incidence Rate and Crude Incidence Rate Ratio in the Main
Cohort with Stroke (N=2,564) | |||||||
|---|---|---|---|---|---|---|---|
|
| |||||||
| ARB (N=522) | ACEI (N=2042) | ARB vs. ACEI | |||||
| # events |
Person- year |
Incidence rate | # events |
Person- year |
Incidence rate | Incidence Rate Ratio | |
| Death | 37 | 844.5 | 43.8 (29.7 – 57.9) | 166 | 3360.9 | 49.4 (41.9 – 56.9) | 0.88 (0.61 – 1.28) |
| Cardio-vascular Death | 18 | 685.3 | 26.3 (14.1 – 38.4) | 88 | 2947.9 | 29.9 (23.6 – 36.1) | 0.87 (0.54 – 1.40) |
| Cardiac Death | 12 | 685.3 | 17.5 (7.6 – 27.4) | 55 | 2947.9 | 18.7 (13.7 – 23.6) | 0.92 (0.51 – 1.69) |
| Sudden Cardiac Death | 8 | 685.3 | 11.7 (3.6 – 19.8) | 25 | 2947.9 | 8.5 (5.2 – 11.8) | 1.34 (0.63 – 2.85) |
| Myocardial Infarction | 23 | 825.4 | 27.9 (16.5 – 39.3) | 100 | 3269.2 | 30.6 (24.6 – 36.6) | 0.91 (0.61 – 1.37) |
| Stroke | 59 | 794.4 | 74.3 (55.3 – 93.2) | 290 | 2986.0 | 97.1 (85.9 – 108.3) | 0.76 (0.58 – 0.99) |
| Heart Failure | 30 | 820.5 | 36.6 (23.5 – 49.6) | 122 | 3229.7 | 37.8 (31.1 – 44.5) | 0.95 (0.65 – 1.40) |
| CV hospitalizations | 96 | 761.9 | 126.0(103.1–153.9) | 459 | 2819.4 | 162.8(148.6–178.4) | 0.78 (0.63 – 0.95) |
Incidence rate: per 10,000 person –years
Table 3.
| A. Effectiveness of ARBs vs. ACEIs
(Adjusted Hazard Ratios Comparing ARBs to ACEIs) on
Specified Outcomes in the CAD and HF Cohorts | ||||||
|---|---|---|---|---|---|---|
|
| ||||||
| CAD Cohort (N=9,728) |
HF Cohort (N=9,150) |
|||||
| Unadjusted Cox Model |
Multivariate analyses |
hd-PS analyses | Unadjusted Cox Model |
Multivariate analyses |
hd-PS analyses | |
| Death | 0.76 (0.62 – 0.94) | 0.92 (0.74 – 1.15) | 0.91 (0.73 – 1.14) | 0.86 (0.71 – 1.03) | 0.85 (0.71 – 1.02) | 0.89 (0.73 – 1.08) |
| Cardiovascular Death* | 0.69(0.51 – 0.93) | 0.85 (0.61 – 1.17) | 0.91 (0.66 – 1.25) | 0.75 (0.60 – 0.94) | 0.80 (0.63 – 1.01) | 0.80 (0.62 – 1.04) |
| Cardiac Death* | 0.66 (0.48 – 0.90) | 0.80 (0.56 – 1.12) | 0.90 (0.64 – 1.26) | 0.78 (0.61 – 0.98) | 0.84 (0.66 – 1.07) | 0.85 (0.65 – 1.11) |
| Sudden Cardiac Death* | 0.55 (0.34 – 0.89) | 0.70 (0.42 – 1.18) | 0.68 (0.40 – 1.14) | 0.45 (0.27 – 0.77) | 0.51 (0.30 – 0.86) | 0.48 (0.27 – 0.85) |
| Cerebro-vascular Death* | 1.33 (0.48 – 3.67) | 2.13 (0.98 – 4.62) | 1.49 (0.50 – 4.38) | 0.58 (0.18 – 1.89) | 0.52 (0.14 – 1.95) | 0.59 (0.19 – 1.84) |
| MI Hospitalization | 0.70 (0.58 – 0.85) | 0.80 (0.65 – 0.98) | 0.82 (0.66 – 1.03) | 0.78 (0.60 – 1.02) | 0.76 (0.58 – 1.00) | 0.70 (0.53 – 0.92) |
| HF Hospitalization | 0.89(0.75 – 1.05) | 1.02 (0.87 – 1.19) | 1.00 (0.83 – 1.19) | 1.15 (1.02 – 1.29) | 1.08 (0.96 – 1.22) | 1.11 (0.97 – 1.26) |
| Stroke Hospitalization | 1.07 (0.81 – 1.43) | 1.15 (0.86 – 1.54) | 1.13 (0.83 – 1.55) | 1.05 (0.79 – 1.40) | 1.18 (0.87 – 1.60) | 1.10 (0.77 – 1.57) |
| All CV hospitalizations | 0.85 (0.75 – 0.96) | 0.96 (0.85 – 1.08) | 0.96 (0.84 –1.10) | 1.07 (0.97 – 1.19) | 1.04 (0.93 – 1.15) | 1.05(0.93 – 1.17) |
| B. Effectiveness of ARBs vs. ACEIs
(Adjusted Hazard Ratios Comparing ARBs to ACEIs) on
Specified Outcomes in the Stroke and Combined Cohorts | ||||||
|---|---|---|---|---|---|---|
|
| ||||||
| Stroke Cohort (N=2,564) |
Combined
Cohort (N=21,442) |
|||||
| Unadjusted Cox Model |
Multivariate analyses |
hd-PS analyses | Unadjusted Cox Model |
Multivariate analyses |
hd-PS analyses | |
| Death | 0.88 (0.61 – 1.28) | 1.04 (0.68 – 1.58) | 1.06 (0.65 – 1.73) | 0.80 (0.70 – 0.92) | 0.88 (0.77 – 1.01) | 0.89 (0.77 – 1.04) |
| Cardiovascular Death* | 0.87 (0.54 – 1.40) | 1.20 (0.66 – 2.20) | 1.56 (0.85 – 2.87) | 0.73 (0.61 – 0.87) | 0.84 (0.70 – 1.01) | 0.87 (0.71 – 1.07) |
| Cardiac Death* | 0.92 (0.51 – 1.69) | 1.29 (0.61 – 2.74) | 1.69 (0.78 – 3.66) | 0.73 (0.60 – 0.89) | 0.84 (0.69 – 1.03) | 0.89 (0.72 – 1.11) |
| Sudden Cardiac Death* | 1.34 (0.63 – 2.85) | 2.09 (0.83 – 5.25) | 2.66 (0.93 – 7.64) | 0.59 (0.43 – 0.81) | 0.69 (0.50 – 0.96) | 0.67 (0.47 – 0.95) |
| Cerebro-vascular Death* | 0.71(0.29 – 1.77) | 1.26 (0.52 – 3.04) | 1.12 (0.41 – 3.05) | 0.80 (0.46 – 1.37) | 0.91 (0.51 – 1.64) | 0.93 (0.51 – 1.69) |
| MI Hospitalization | 0.91 (0.61 – 1.37) | 1.03 (0.67 – 1.57) | 0.95 (0.55 – 1.64) | 0.75 (0.65 – 0.87) | 0.81 (0.69 – 0.94) | 0.80 (0.67 – 0.95) |
| HF Hospitalization | 0.95 (0.65 – 1.40) | 1.15 (0.73 – 1.79) | 0.94 (0.52 – 1.69) | 1.01 (0.92 – 1.1) | 1.02 (0.93 – 1.12) | 1.03 (0.93 – 1.14) |
| Stroke Hospitalization | 0.76 (0.58 – 0.99) | 0.82 (0.61 – 1.09) | 0.82 (0.59 – 1.13) | 0.92 (0.77 – 1.08) | 0.99 (0.83 – 1.18) | 0.96 (0.79 – 1.16) |
| All CV hospitalizations | 0.78 (0.63 – 0.95) | 0.83 (0.67 – 1.03) | 0.81(0.63 – 1.04) | 0.92 (0.85 – 0.99) | 0.95 (0.88 – 1.02) | 0.96 (0.88 – 1.04) |
Values represent hazard ratio (95% confidence limits).
All models were stratified by calendar year for the index use of the study drug and accounted for clustering by providers.
Information on cause of death is available in the subsets (up to 2005 in PA and up to 2004 in NJ) and the analyses were restricted to 2005 in PA and 2004 in NJ
Multivariate analyses were adjusted for demographic information(age, gender, and race), cardiovascular comorbidities (history of ischemic heart disease, heart failure, valvular heart disease, Cardiomyopathy, atrial fibrillation/flutter, diabetes, ventricular arrhythmia, cerebrovascular disease, conduction disorders and well as recent hospitalization for heart failure, acute coronary syndrome, or stroke), cardiovascular drug use (nitrates, calcium channel blockers, beta blockers, digoxin, statins, spironolactone, antiplatelet drugs, diuretics, other lipid lowering drugs, and warfarin), non-cardiovascular diagnoses (cancer, osteoporosis, chronic kidney disease, chronic obstructive pulmonary disease, mood disorder, psychotic disorder, dementia, delirium, fracture, anxiety, and other mental disorders), non-CV preventive medications (hormone replacement therapy, glaucoma drugs, and osteoporosis drugs), preventive services (bone mineral density test, prostate specific antigen test, fecal occult blood test, mammogram, influenza vaccine, and pneumococcal vaccine), and health service use measures (number of prior hospitalizations, number of office visits, number of generic medications, prior nursing home admission, and Charlson comorbidity score)
Figure 1.

Comparative Effectiveness of ARB vs. ACEI (Adjusted Hazard Ratios) on Selected Outcomes in Subgroups of Patients Defined by Gender, Race, Age, and Comorbidities among All Patients (The CAD, HF, and Stroke Cohorts Combined)
Figure 2.

Sensitivity Analyses Assessing the Impact of Ejection Fraction on Sudden Cardiac Death Outcome.
The HR comparing ARBs to ACEIs was fixed at 0.30 (green line), 0.51 (pink line), and 0.86 (dark blue line) (the point estimate and upper and lower 95% CI for the observed HR in HF cohort). The risk ratio between low EF (<45%) vs. high EF (>=45%) and SCD was assumed to be 2.5. The prevalence of low EF was fixed at 60% in the ACEI group and varied from 1% to 100% in ARB group. When the observed HR was 0.51, a large imbalance in the prevalence of low EF between ARB and ACEI group (60% difference in the actual prevalence) is needed for the corrected HR to be close to the null. When the observed HR was 0.86, less than 15 % difference in the prevalence of low EF in the two groups was necessary for the corrected HF to be 1(the null).
References
- 1.Granger CB, et al. Effects of candesartan in patients with chronic heart failure and reduced left-ventricular systolic function intolerant to angiotensin-converting-enzyme inhibitors: the CHARM-Alternative trial. Lancet. 2003;362:772–6. doi: 10.1016/S0140-6736(03)14284-5. [DOI] [PubMed] [Google Scholar]
- 2.Gainer JV, Morrow JD, Loveland A, King DJ, Brown NJ. Effect of bradykinin-receptor blockade on the response to angiotensin-converting-enzyme inhibitor in normotensive and hypertensive subjects. N Engl J Med. 1998;339:1285–92. doi: 10.1056/NEJM199810293391804. [DOI] [PubMed] [Google Scholar]
- 3.Stoll M, Steckelings UM, Paul M, Bottari SP, Metzger R, Unger T. The angiotensin AT2-receptor mediates inhibition of cell proliferation in coronary endothelial cells. J Clin Invest. 1995;95:651–7. doi: 10.1172/JCI117710. [DOI] [PMC free article] [PubMed] [Google Scholar]
- 4.Tomiyama H, et al. Kinins contribute to the improvement of insulin sensitivity during treatment with angiotensin converting enzyme inhibitor. Hypertension. 1994;23:450–5. doi: 10.1161/01.hyp.23.4.450. [DOI] [PubMed] [Google Scholar]
- 5.Matchar DB, et al. Systematic review: comparative effectiveness of angiotensin-converting enzyme inhibitors and angiotensin II receptor blockers for treating essential hypertension. Ann Intern Med. 2008;148:16–29. doi: 10.7326/0003-4819-148-1-200801010-00189. [DOI] [PubMed] [Google Scholar]
- 6.Hammill BG, Hernandez AF, Peterson ED, Fonarow GC, Schulman KA, Curtis LH. Linking inpatient clinical registry data to Medicare claims data using indirect identifiers. Am Heart J. 2009;157:995–1000. doi: 10.1016/j.ahj.2009.04.002. [DOI] [PMC free article] [PubMed] [Google Scholar]
- 7.Setoguchi S, Glynn RJ, Avorn J, Mogun H, Schneeweiss S. Statins and the risk of lung, breast, and colorectal cancer in the elderly. Circulation. 2007;115:27–33. doi: 10.1161/CIRCULATIONAHA.106.650176. [DOI] [PubMed] [Google Scholar]
- 8.Dickstein K, Kjekshus J. Effects of losartan and captopril on mortality and morbidity in high-risk patients after acute myocardial infarction: the OPTIMAAL randomised trial. The Lancet. 2002;360:752–60. doi: 10.1016/s0140-6736(02)09895-1. [DOI] [PubMed] [Google Scholar]
- 9.Pfeffer MA, et al. Valsartan, captopril, or both in myocardial infarction complicated by heart failure, left ventricular dysfunction, or both. N Engl J Med. 2003;349:1893–906. doi: 10.1056/NEJMoa032292. [DOI] [PubMed] [Google Scholar]
- 10.Pitt B, et al. Effect of losartan compared with captopril on mortality in patients with symptomatic heart failure: randomised trial--the Losartan Heart Failure Survival Study ELITE II. Lancet. 2000;355:1582–7. doi: 10.1016/s0140-6736(00)02213-3. [DOI] [PubMed] [Google Scholar]
- 11.Winkelmayer WC, Fischer MA, Schneeweiss S, Levin R, Avorn J. Angiotensin inhibition after myocardial infarction: does drug class matter? J Gen Intern Med. 2006;21:1242–7. doi: 10.1111/j.1525-1497.2006.00590.x. [DOI] [PMC free article] [PubMed] [Google Scholar]
- 12.Factors Associates with Serum Potassium Monitoring in Veterans using Renin-Angiotensin-Aldosterone inhibitors. 24th Health Services Research and Development Service National Meeting 2006 [Google Scholar]
- 13.Glynn RJ, Knight EL, Levin R, Avorn J. Paradoxical relations of drug treatment with mortality in older persons. Epidemiology. 2001;12:682–9. doi: 10.1097/00001648-200111000-00017. [DOI] [PubMed] [Google Scholar]
- 14.Ray WA. Evaluating medication effects outside of clinical trials: new-user designs. Am J Epidemiol. 2003;158:915–20. doi: 10.1093/aje/kwg231. [DOI] [PubMed] [Google Scholar]
- 15.EVIDENCE, W.G.T.R.N. et al. 2009 Focused Update: ACCF/AHA Guidelines for the Diagnosis and Management of Heart Failure in Adults: A Report of the American College of Cardiology Foundation/American Heart Association Task Force on Practice Guidelines: Developed in Collaboration With the International Society for Heart and Lung Transplantation. Circulation. 2009;119:1977–2016. doi: 10.1161/CIRCULATIONAHA.109.192064. [DOI] [PubMed] [Google Scholar]
- 16.Solomon SD, et al. Influence of ejection fraction on cardiovascular outcomes in a broad spectrum of heart failure patients. Circulation. 2005;112:3738–44. doi: 10.1161/CIRCULATIONAHA.105.561423. [DOI] [PubMed] [Google Scholar]
- 17.LaBresh KA, Ellrodt AG, Gliklich R, Liljestrand J, Peto R. Get with the guidelines for cardiovascular secondary prevention: pilot results. Arch Intern Med. 2004;164:203–9. doi: 10.1001/archinte.164.2.203. [DOI] [PubMed] [Google Scholar]
- 18.Lee DS, et al. Comparison of coding of heart failure and comorbidities in administrative and clinical data for use in outcomes research. Med Care. 2005;43:182–8. doi: 10.1097/00005650-200502000-00012. [DOI] [PubMed] [Google Scholar]
- 19.Birman-Deych E, Waterman AD, Yan Y, Nilasena DS, Radford MJ, Gage BF. Accuracy of ICD-9-CM codes for identifying cardiovascular and stroke risk factors. Med Care. 2005;43:480–5. doi: 10.1097/01.mlr.0000160417.39497.a9. [DOI] [PubMed] [Google Scholar]
- 20.Kiyota Y, Schneeweiss S, Glynn RJ, Cannuscio CC, Avorn J, Solomon DH. Accuracy of Medicare claims-based diagnosis of acute myocardial infarction: estimating positive predictive value on the basis of review of hospital records. Am Heart J. 2004;148:99–104. doi: 10.1016/j.ahj.2004.02.013. [DOI] [PubMed] [Google Scholar]
- 21.Kokotailo RA, Hill MD. Coding of stroke and stroke risk factors using international classification of diseases, revisions 9 and 10. Stroke. 2005;36:1776–81. doi: 10.1161/01.STR.0000174293.17959.a1. [DOI] [PubMed] [Google Scholar]
- 22.Roumie CL, Mitchel E, Gideon PS, Varas-Lorenzo C, Castellsague J, Griffin MR. Validation of ICD-9 codes with a high positive predictive value for incident strokes resulting in hospitalization using Medicaid health data. Pharmacoepidemiol Drug Saf. 2008;17:20–6. doi: 10.1002/pds.1518. [DOI] [PubMed] [Google Scholar]
- 23.Kelsey JW, AS Evans AS, Thompson WD. Methods in observational epidemiology. 2. Oxford University Pres; New York, NY: 1996. pp. 341–90. [Google Scholar]
- 24.Ray WA, Chung CP, Murray KT, Hall K, Stein CM. Atypical Antipsychotic Drugs and the Risk of Sudden Cardiac Death. N Engl J Med. 2009;360:225–35. doi: 10.1056/NEJMoa0806994. [DOI] [PMC free article] [PubMed] [Google Scholar]
- 25.Winkelmayer WC, Schneeweiss S, Mogun H, Patrick AR, Avorn J, Solomon DH. Identification of individuals with CKD from Medicare claims data: a validation study. Am J Kidney Dis. 2005;46:225–32. doi: 10.1053/j.ajkd.2005.04.029. [DOI] [PubMed] [Google Scholar]
- 26.De Bruin ML, van Hemel NM, Leufkens HG, Hoes AW. Hospital discharge diagnoses of ventricular arrhythmias and cardiac arrest were useful for epidemiologic research. J Clin Epidemiol. 2005;58:1325–9. doi: 10.1016/j.jclinepi.2005.04.009. [DOI] [PubMed] [Google Scholar]
- 27.Singh JA, Holmgren AR, Noorbaloochi S. Accuracy of Veterans Administration databases for a diagnosis of rheumatoid arthritis. Arthritis Rheum. 2004;51:952–7. doi: 10.1002/art.20827. [DOI] [PubMed] [Google Scholar]
- 28.Steiner JF, Prochazka AV. The assessment of refill compliance using pharmacy records: methods, validity, and applications. J Clin Epidemiol. 1997;50:105–16. doi: 10.1016/s0895-4356(96)00268-5. [DOI] [PubMed] [Google Scholar]
- 29.Schneeweiss S, Patrick AR, Maclure M, Dormuth CR, Glynn RJ. Adherence to Statin Therapy Under Drug Cost Sharing in Patients With and Without Acute Myocardial Infarction: A Population-Based Natural Experiment. Circulation. 2007;115:2128–35. doi: 10.1161/CIRCULATIONAHA.106.665992. [DOI] [PubMed] [Google Scholar]
- 30.Schneeweiss S, Rassen JA, Glynn RJ, Avorn J, Mogun H, Brookhart MA. High-dimensional Propensity Score Adjustment in Studies of Treatment Effects Using Health Care Claims Data. Epidemiology. 2009;20:512–22. doi: 10.1097/EDE.0b013e3181a663cc. [DOI] [PMC free article] [PubMed] [Google Scholar]
- 31.Wei LJ, Lin DY, Weissfeld L. Regression Analysis of Multivariate Incomplete Failure Time Data by Modeling Marginal Disributions. Journal of the American Statistical Association. 1989;84:1065–73. [Google Scholar]
- 32.Schneeweiss S. Sensitivity analysis and external adjustment for unmeasured confounders in epidemiologic database studies of therapeutics. Pharmacoepidemiol Drug Saf. 2006;15:291–303. doi: 10.1002/pds.1200. [DOI] [PubMed] [Google Scholar]
- 33.Bhatia RS, et al. Outcome of heart failure with preserved ejection fraction in a population-based study. N Engl J Med. 2006;355:260–9. doi: 10.1056/NEJMoa051530. [DOI] [PubMed] [Google Scholar]
- 34.Owan TE, Hodge DO, Herges RM, Jacobsen SJ, Roger VL, Redfield MM. Trends in prevalence and outcome of heart failure with preserved ejection fraction. N Engl J Med. 2006;355:251–9. doi: 10.1056/NEJMoa052256. [DOI] [PubMed] [Google Scholar]