

Abstract
Autism spectrum disorder (ASD) comprises a multi-dimensional set of quantitative behavioral traits expressed along a continuum in autistic and neurotypical individuals. ASD diagnosis—a dichotomous trait—is known to be highly heritable and has been used as the phenotype for most ASD genetic studies. But less is known about the heritability of autism spectrum quantitative traits, especially in adults, an important prerequisite for gene discovery. We sought to measure the heritability of many autism-relevant quantitative traits in adults high in autism spectrum traits and their extended family members. Among adults high in autism spectrum traits (n = 158) and their extended family members (n = 245), we calculated univariate and bivariate heritability estimates for 19 autism spectrum traits across several behavioral domains. We found nearly all tested autism spectrum quantitative traits to be significantly heritable (h2 = 0.24–0.79), including overall ASD traits, restricted repetitive behaviors, broader autism phenotype traits, social anxiety, and executive functioning. The degree of shared heritability varied based on method and specificity of the assessment measure. We found high shared heritability for the self-report measures and for most of the informant-report measures, with little shared heritability among performance-based cognition tasks. These findings suggest that many autism spectrum quantitative traits would be good, feasible candidates for future genetics studies, allowing for an increase in the power of autism gene discovery. Our findings suggest that the degree of shared heritability between traits depends on the assessment method (self-report vs. informant-report vs. performance-based tasks), as well as trait-specificity.
Keywords: adult, autism spectrum disorder, family studies, heritability, phenotype, quantitative trait
Lay Summary
We found that the scores from questionnaires and tasks measuring different types of behaviors and abilities related to autism spectrum disorder (ASD) were heritable (strongly influenced by gene variants passed down through a family) among autistic adults and their family members. These findings mean that these scores can be used in future studies interested in identifying specific genes and gene variants that are associated with different behaviors and abilities related with ASD.
INTRODUCTION
Autism spectrum disorder (ASD) is a heterogeneous condition that is highly heritable (Sandin et al., 2017; Tick et al., 2016; Xie et al., 2020). Most prior autism genetic studies have used a dichotomous trait as the phenotype of interest (presence vs. absence of ASD diagnosis) (Gaugler et al., 2014; Hallmayer et al., 2011; Sandin et al., 2017; Xie et al., 2020). But, rather than being an all-or-nothing phenomenon, the autism spectrum comprises a multidimensional set of quantitative behavioral traits. The core defining domains of ASD in the Diagnostic and Statistical Manual of Mental Disorders, 5th edition (DSM-5) are social communication differences as well as restricted interests and repetitive behaviors (American Psychiatric Association, 2013). Social communication differences in ASD include differences in social engagement and social cognition and higher levels of social anxiety (Calkins et al., 2013; Chevallier et al., 2013; Maddox & White, 2015; Morrison et al., 2019; Spain et al., 2018). ASD is also associated with executive functioning differences (Hill, 2004). There is heterogeneity among autistic individuals in the degree to which these various phenotypes are affected. There is a strong need for gene discovery studies using quantitative phenotypes, as this approach has increased power to detect genephenotype associations and can more precisely determine the effects of gene variants on specific phenotypes, including pleiotropic effects of genes.
The first step toward using quantitative phenotypes in autism genetics studies is assessing the heritability of those phenotypes. Since autism spectrum behaviors are expressed continuously at varying levels in individuals on and off the autism spectrum (Constantino & Todd, 2003), assessing quantitative behavioral measures as traits in heritability analyses (a) allows for the measurement of additive genetic contributions to phenotypic variance in ASD (which studies of ASD diagnosis alone do not), (b) provides a more accurate representation of behavioral variability in the general population, and (c) can form the basis of gene discovery studies using quantitative phenotypes. Previous studies of the heritability of quantitative ASD traits have been limited. These have predominantly used twin study design rather than extended family design; focused on child/adolescent probands, rather than adult autistic probands; or, in some cases, have not been studied in an autism spectrum-relevant sample (Calkins et al., 2010; Castelbaum et al., 2020; Constantino & Todd, 2003; Frazier et al., 2014; Greenwood et al., 2007; Hoekstra et al., 2007; Pohl et al., 2019; Stein et al., 2017; Warrier et al., 2018). We are not aware of prior studies that measured the heritability of many autism spectrum quantitative traits in the same sample of adults and therefore sought to do so in this study.
Given the known heritability of ASD as a categorical phenotype (Sandin et al., 2017; Tick et al., 2016; Xie et al., 2020), we expected many tested measures of quantitative ASD traits to be heritable. Our sample differs from previous heritability estimates of overall ASD traits in that we (a) focused exclusively on adults high in autism spectrum traits and their family members, (b) were inclusive of more distant relatives than in most previously reported samples using an extended family study design, and (c) quantified the heritability of many quantitative traits across multiple behavioral domains in a single sample. Relative to a twin study design, the use of an extended family design in the present study provides the opportunity to see more variability in quantitative ASD traits while allowing quantitative traits to be scaled with degree of relatedness.
METHODS AND MATERIALS
Sample
One hundred and fifty-eight adults high in autism spectrum traits were recruited for the Autism Spectrum Program of Excellence at the University of Pennsylvania as probands based on the following: (a) a detailed clinical and developmental history that met DSM-5 criteria for ASD and (b) an intelligence quotient (IQ) above 70 measured by the Shipley-2 (Shipley et al., 2009). Proband clinical and developmental history, including information on social communication, repetitive behaviors, sensory sensitivities and behaviors, psychiatric treatment, and medical history, was collected during a phone screen with a research coordinator. In order to determine eligibility, the potential proband’s score on the Social Communication Questionnaire (SCQ) and phone screen were reviewed by the research coordinators and a psychiatrist (E.S.B.) specializing in ASD and its presentations in adulthood. Potential probands were excluded based on: (a) a history of intellectual disability, severe head trauma, or neurological disorder; (b) recent (within the last 4 weeks) severe mood or psychotic symptoms; or (c) recent severe aggressive or self-injurious behaviors. Additionally, 245 extended family members of probands (148 first-degree relatives, 56 second-degree relatives, 17 third-degree relatives, 2 fourth-degree and above relatives, and 22 spouses of probands or their family members) were recruited on the basis of their familial relationship with the proband. Among first-degree relatives of probands, there were 5 adult-aged children, 108 parents, and 35 siblings. Family members with recent self-injurious behaviors, severe mood disorder symptoms, or psychotic symptoms were excluded from the study. All study methods were approved by the University of Pennsylvania Institutional Review Board, and participants underwent an informed consent process prior to participation. Demographics of the sample are reported in Table 1.
TABLE 1.
Demographics of the sample
| Probands | Family members | |
|---|---|---|
| Enrolled (N) | 158 | 245 |
| Self-report measures (N) | 150 | 230 |
| Informant-report measures (N) | 108 | 190 |
| Performance-based measures, CNB (N) | 129 | 168 |
| Sex (% female) | 45.5 | 60.3 |
| Age (range, years) | 18–78 | 18–87 |
| Age (mean [SD], years) | 35.1 (14.7) | 48.9(16.2) |
| Race (% American Indian/Alaska Native) | 0.6 | 0 |
| Race (% Asian) | 3.2 | 3.4 |
| Race (% Black) | 3.9 | 3.9 |
| Race (% Multiracial) | 5.2 | 3.4 |
| Race (% White) | 77.3 | 86.2 |
| Race (% Other) | 1.9 | 1.7 |
Measures
Participants completed an extensive battery of questionnaires and performance-based cognition tasks, measuring multiple domains of autism spectrum-related behaviors. Study data were collected and managed using Research Electronic Data Capture (REDCap) tools hosted at the University of Pennsylvania (Harris et al., 2009, 2019). The questionnaires were collected as self-report and/or informant-report depending on the questionnaire. Informants were individuals who knew the participants well and included relatives (parents, children, siblings), spouses, therapists, and close friends.
Social communication questionnaire
The social communication questionnaire (SCQ) was developed and validated as an informant-report diagnostic tool for autism and pervasive developmental disorder not otherwise specified for ages 4 years and above (Berument et al., 1999; Chesnut et al., 2017; Sappok et al., 2015). In this study, the SCQ-Lifetime form, which evaluates behavior over the course of lifetime development, was used.
Social responsiveness scale-2 for adults
Overall autistic behaviors were measured using social responsiveness scale-2 for adults (SRS-2A) total score (Constantino et al., 2003). Inter-rater reliability of the questionnaire ranged from moderate to high (0.75–0.91) (Constantino et al., 2003). Social cognition was quantified using the Social Cognition subscale of the SRS-2A, and restricted, repetitive behaviors were quantified using the Restricted Interests and Repetitive Behavior subscale. Both self-report and informant-report versions of the questionnaire were used in this study.
Autism spectrum quotient
The autism spectrum quotient (AQ) is a self-report measure of overall autistic behaviors and has five subscales: attention to detail, social skills, communication, attention switching, and imagination (Baron-Cohen et al., 2001). It has good test–retest reliability (r = 0.7) and internal consistency (Cronbach’s alpha = 0.72) (Baron-Cohen et al., 2001; Ingersoll et al., 2011).
Broad autism phenotype questionnaire
The broad autism phenotype questionnaire (BAPQ) measures behaviors associated with the broad autism phenotype, defined here as behaviors and traits related to ASD genetic liability commonly seen in parents of ASD individuals (Hurley et al., 2007; Piven & Sasson, 2014). The Aloof Personality subscale serves as an indicator for social motivation. Both the entire questionnaire and the Aloof subscale have high internal consistency (Cronbach’s alpha = 0.94–0.95) (Hurley et al., 2007). The self-report version of the BAPQ was used in this study.
Liebowitz social anxiety scale
Social anxiety severity was quantified using the self-report Liebowitz social anxiety scale (LSAS) (Fresco et al., 2001). Internal consistency was high in both clinical and non-clinical populations (Cronbach’s alpha = 0.94–0.95) (Fresco et al., 2001).
Behavior rating inventory of executive function-adult
The behavior rating inventory of executive function-adult (BRIEF-A) assesses multiple domains of executive functioning, using self-reporting and informant-reporting (Gioia et al., 2000). It was shown to have high internal consistency (Cronbach’s alpha = 0.80–0.98) and test-retest correlations (r = 0.86–0.91) (Gioia et al., 2000).
Aberrant behavior checklist
The aberrant behavior checklist (ABC) is an informant-report questionnaire that assesses several categories of behaviors, including irritability, agitation, and crying; lethargy, social withdrawal; stereotypic behavior; hyperactivity, noncompliance; and inappropriate speech (Aman et al., 1985a). Both test–retest reliability (r = 0.96–0.98) and internal consistency (Cronbach’s alpha = 0.86–0.94) of the subscales are high (Aman et al., 1985b).
Penn computerized neurocognitive battery
Part of the Penn computerized neurocognitive battery (CNB), the Emotion Recognition Test (ER40) is a task designed to test the ability to recognize emotion expressions in faces (Gur et al., 2002). The task asks participants to select the emotion of the faces shown for a choice of “angry,” happy,“” no“ feeling,” “sad,” or “scared.” Emotion intensity shown varies between trials. The Penn Conditional Exclusion Test (PCET) measures abstraction and mental flexibility (Kurtz et al., 2004). The PCET asks participants to choose which of four objects does not belong based on either line thickness, shape, or size. Participants get feedback on whether they chose correctly or not, and after 10 trials choosing in line with the correct principle, the principle changes until all 3 classification rules are identified. The Penn Matrix Reasoning Test (PMAT) measures complex cognition (Gur et al., 2001, 2010). In the PMAT, participants are shown an arrangement of patterns (matrices) and asked to choose the piece that would complete the sequence. As a matrix reasoning task, the PMAT can be used as a measure of fluid intelligence (i.e., a measure of the ability to solve problems in novel situations) and as a proxy for IQ (Swagerman et al., 2016).
Group differences in quantitative traits
Following tests for normality (via Shapiro–Wilk test) and equal variance (via Levene’s test), one-way Analysis of Variance (ANOVA) procedures were completed to compare probands, first-degree relatives, and all other family members on each quantitative trait. If variances were equal between groups for a particular trait and there was a significant interaction, a Tukey HSD post-hoc analysis was completed. If variances were not equal and there was a significant interaction, Welch’s two-sample t-tests were conducted to compare group means.
Univariate and bivariate heritability
To calculate heritability, SOLAR-Eclipse software (http://www.solar-eclipse-genetics.org) was used. SOLAR-Eclipse is designed to conduct variance component analysis and related genetic computations in pedigrees of varying sizes (Almasy & Blangero, 1998). Estimates of narrow-sense heritability in SOLAR-Eclipse were calculated using polygenic linear mixed models. For all heritability analyses, age, sex, and their interaction were incorporated as covariates. Each measure was normalized before analyses were conducted using rank-based inverse normal transformation, which has been shown to reduce Type I error and increase power for detecting genetic associations (Auer et al., 2016; Beasley et al., 2009; McCaw et al., 2020). Additionally, the kurtosis of each trait following normalization was evaluated to ensure that the results were not affected by deviation of the trait distribution from the assumption of normality. Bivariate heritability was calculated in the form of genetic correlation coefficients for every possible pair of measures that were found to be heritable in the univariate analyses within each collection method (i.e., Penn CNB, self-report, and informant-report).
RESULTS
Group differences in quantitative traits
Examination of quantitative autism spectrum traits in probands and family members showed continuous distributions of all traits across each group (see Figures 1–3). We also found expected group differences between probands and family members, with probands scoring higher on all self-report and informant-report metrics (see Figures 1 and 2). Among CNB metrics, only ER40 correct responses differed between the probands and family members, with fewer correct responses among probands as compared with first-degree family members, but no difference between the probands and other family members (see Figure 3(a)). There were no significant differences among probands and other family members in PMAT scores, a proxy measure for intelligence (Figure 3(b,e)).
FIGURE 1.
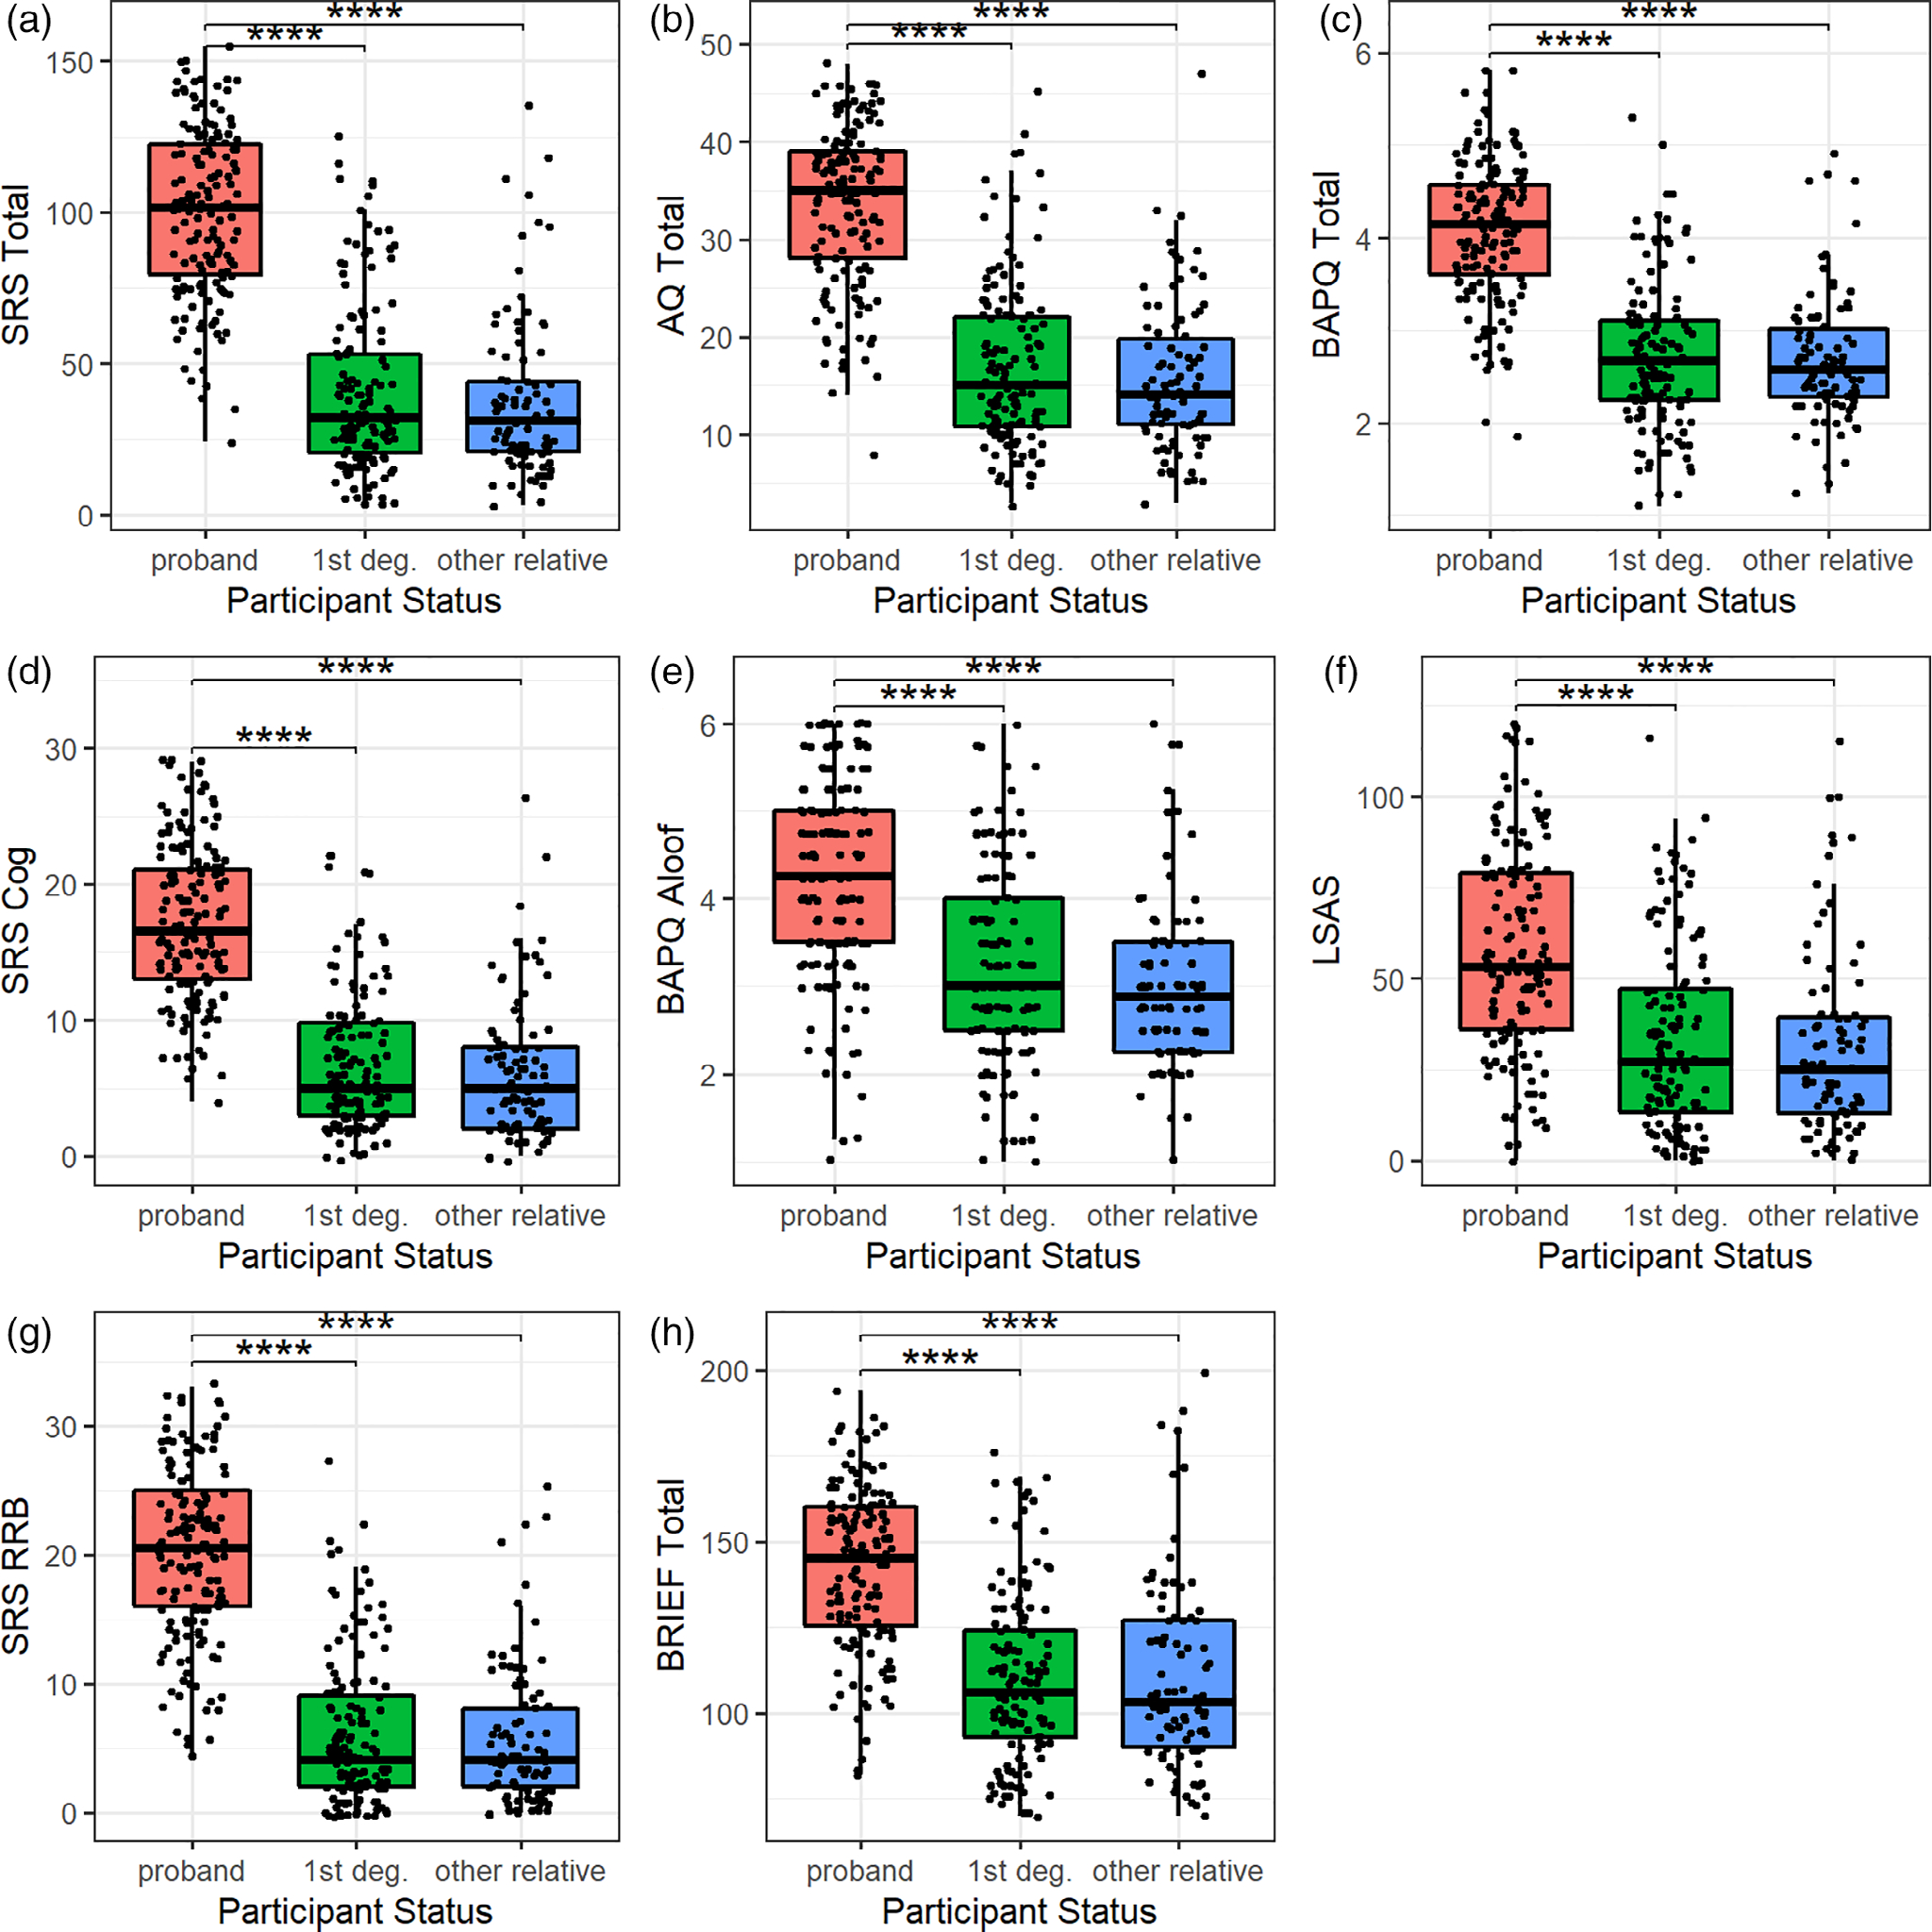
All self-report metrics were higher in probands than in family members. (a) SRS-2A Total, (b) AQ Total, (c) BAPQ Total, (d) SRS-2A Social Cognition Subscale, (e) BAPQ Aloof Personality Subscale, (f) LSAS, (g) SRS-2A Restricted Interests and Repetitive Behavior Subscale, (h) BRIEF Total significant group differences with p-values passing Benjamini–Hochberg correction are indicated with an asterisk. AQ, Autism Quotient; BAPQ, Broad Autism Phenotype Questionnaire; BRIEF, Behavior Rating Inventory of Executive Function; SRS-2A, Social Responsiveness Scale-2 Adult
FIGURE 3.

Of all Penn computerized neurocognitive battery metrics, only ER40 correct responses differ between groups. (a) ER40 correct responses, (b) PMAT correct responses, (c) PCET accuracy score, (d) ER40 reaction time, (e) PMAT reaction time, (f) PCET reaction time significant group differences with p-values passing Benjamini–Hochberg correction are indicated with an asterisk. ER40CR, Penn Emotion Recognition Test correct response; ER40RT, Penn Emotion Recognition Test reaction time; PCET, Penn Conditional Exclusion Test; PMAT, Penn Matrix Reasoning Test
FIGURE 2.
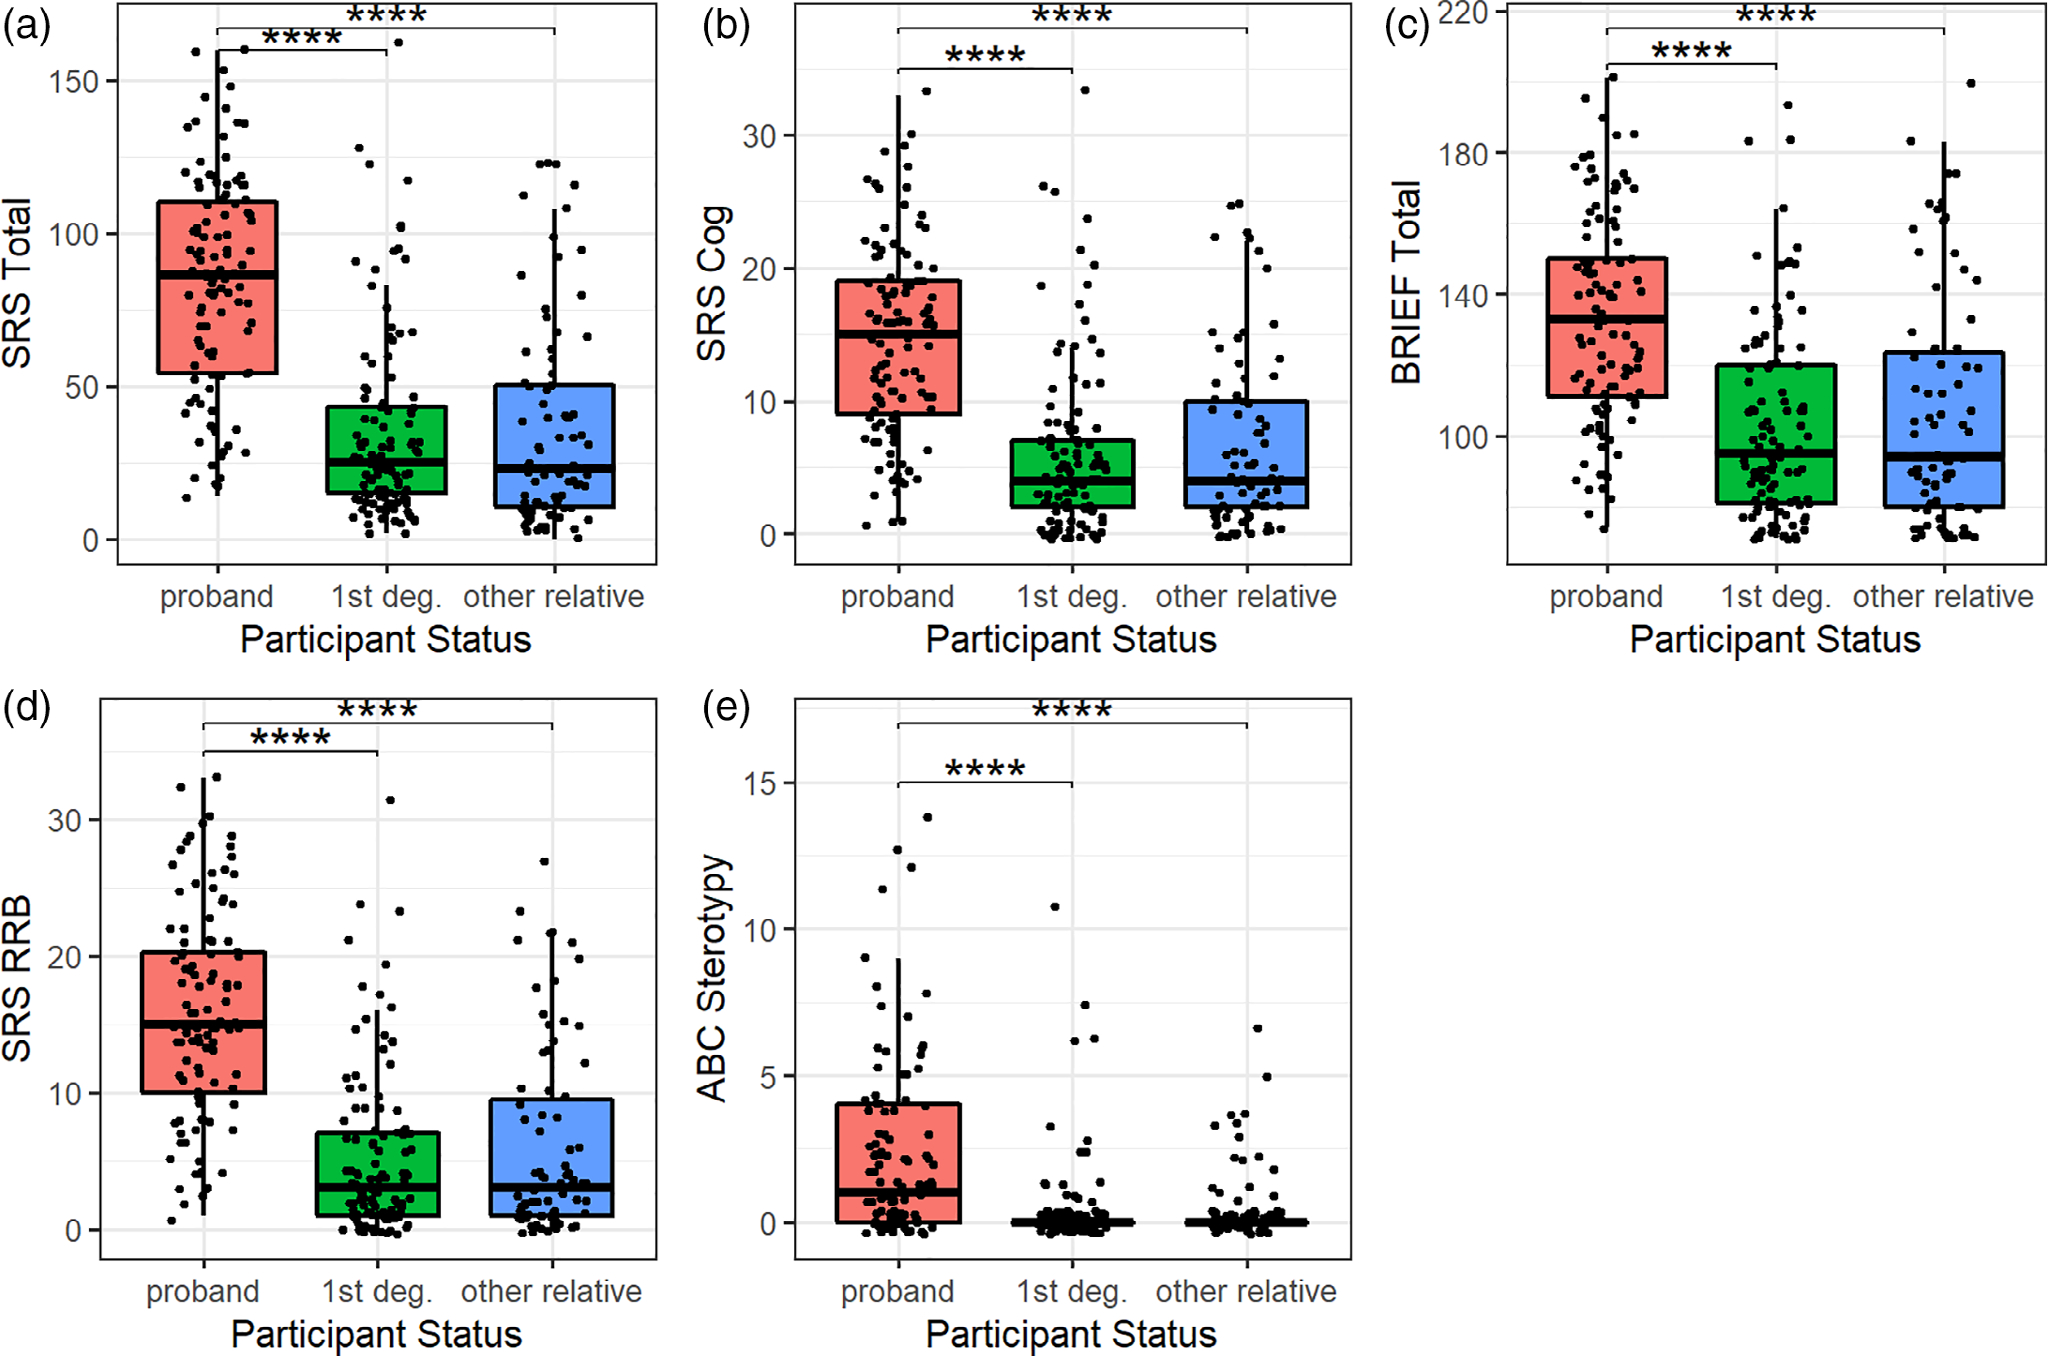
All informant-report metrics were higher in probands than in family members. (a) SRS-2A total, (b) SRS-2A Social Cognition Subscale, (c) BRIEF Total, (d) SRS-2A Restricted Interests and Repetitive Behavior Subscale, (e) ABC Stereotype Subscale significant group differences with p-values passing Benjamini–Hochberg correction are indicated with an asterisk. ABC, Aberrant Behavior Checklist; BRIEF, Behavior Rating Inventory of Executive Function; SRS-2A, Social Responsiveness Scale-2 Adult total score
Univarirate heritability
All tested ASD-related phenotypes, except PMAT correct response, PMAT reaction time, and PCET accuracy, were found to be significantly heritable after adjusting for covariates, namely sex, age, and the interaction of age and sex (see Figure 4). Following normalization, each trait had a residual kurtosis within an acceptable range (below 0.8, where zero is the kurtosis value for a normal distribution). Overall autistic behavior measures had moderate heritability estimates ranging from 0.48 to 0.63. Similarly, BAPQ total had a heritability of 0.46. Heritability of the social motivation metric, BAPQ Aloof, was moderate at h2 = 0.43. The social anxiety measure, LSAS, was one of the more heritable of the measures tested, with h2 = 0.57. Heritability of measures of social cognition, including ER40 metrics and SRS-2A social cognition subscale scores, was variable and ranged from 0.33 to 0.77. The heritability estimates of executive functioning measures were generally in a lower range, with the exception of PCET reaction time. Restricted interests and repetitive behavior measures had heritability estimates ranging from 0.24 to 0.54.
FIGURE 4.

All tested ASD-related phenotypes were heritable, with the exceptions of PMAT correct response, PMAT reaction time, and PCET accuracy. Heritability values controlled for age, sex, and age * sex are plotted for each metric. Significant values surviving Benjamini–Hochberg multiple testing correction are indicated with an asterisk, while non-significant values are indicated with “NS.” ABC, Aberrant Behavior Checklist Stereotypy subscale; AQ, Autism Quotient total score; BAPQ aloof, Broad Autism Phenotype Questionnaire aloof personality subscale; BAPQ total, Broad Autism Phenotype Questionnaire total; BRIEFir, informant-report Behavioral Rating Inventory of Executive Functioning global executive composite score; BRIEFsr, self-report Behavioral Rating Inventory of Executive Functioning global executive composite score; ER40CR, Penn Emotion Recognition Test correct response; ER40RT, Penn Emotion Recognition Test reaction time; LSAS, Liebowitz Social Anxiety Scale; PCETACC, Penn Conditional Exclusion Test accuracy score; PCETRT, Penn Conditional Exclusion Test reaction time; PMATCR, Penn Matrix Reasoning Test correct response; PMATRT, Penn Matrix Reasoning Test reaction time; SRSirCog, informant-report Social Responsiveness Scale Social Cognition subscale score; SRSirRRB, informant-report Social Responsiveness Scale Restricted Interests and Repetitive Behavior subscale score; SRSirTotal, informant-report Social Responsiveness Scale total score; SRSsrCog, self-report Social Responsiveness Scale Social Cognition subscale score; SRSsrRRB, self-report Social Responsiveness Scale Restricted Interests and Repetitive Behavior subscale score; SRSsrTotal, self-report Social Responsiveness Scale total score
Bivariate heritability
All of the self-report measures were highly genetically correlated (see Figure 5(a)). Among the CNB measures, none of the traits were significantly genetically related (see Figure 5(b)). For the informant-report measures, BRIEF-A total, SRS-2A total, SRS-2A social cognition, and SRS-2A restricted interests and repetitive behavior subscale were all highly genetically correlated, but ABC stereotypy was only related to SRS-2A restricted interests and repetitive behavior subscale (rg = 0.90, p < 0.01; see Figure 5(c)).
FIGURE 5.

Bivariate heritability. Most informant-report measures were positively genetically correlated with each other, and all tested self-report metrics were highly positively genetically correlated with each other. (a) Genetic correlation coefficient (RhoG) values for each pair of self-report metrics. (b) RhoG values for each pair of CNB metrics. (c) RhoG values for each pair of informant-report metrics. All RhoG values are controlled for age, sex, and age * sex. Significant values passing Benjamini–Hochberg multiple testing correction are on a square with a color indicating the strength and direction of the correlation, while non-significant values have a gray background. ABC, Aberrant Behavior Checklist Stereotypy subscale; AQ, Autism Quotient total score; BAPQ aloof, Broad Autism Phenotype Questionnaire aloof personality subscale; BAPQ total, Broad Autism Phenotype Questionnaire total; BRIEFir, informant-report Behavior Rating Inventory of Executive Function global executive composite score; BRIEFsr, self-report Behavior Rating Inventory of Executive Function global executive composite score; ER40CR, Penn Emotion Recognition Test correct response; ER40RT, Penn Emotion Recognition Test reaction time; LSAS, Liebowitz Social Anxiety Scale; PCETRT, Penn Conditional Exclusion Test reaction time; SRSirCog, informant-report Social Responsiveness Scale Social Cognition subscale score; SRSirRRB, informant-report Social Responsiveness Scale Restricted Interests and Repetitive Behavior subscale score; SRSirTotal, informant-report Social Responsiveness Scale total score; SRSsrCog, self-report Social Responsiveness Scale Social Cognition subscale score; SRSsrRRB, self-report Social Responsiveness Scale Restricted Interests and Repetitive Behavior subscale score; SRSsrTotal, self-report Social Responsiveness Scale total score
DISCUSSION
We found all measures of overall ASD traits to be moderately heritable. Previous estimates of informant-report SRS heritability differ among studies with varying populations and methods, yet all indicate moderate to high heritability of the measure in children and/or adolescents (Castelbaum et al., 2020; Constantino & Todd, 2003; Frazier et al., 2014; Pohl et al., 2019). The h2 value for the AQ in the present study was comparable in magnitude to that previously reported (57%) in a general population twin sample in late adolescence (Hoekstra et al., 2007). Importantly, all of the previous studies were in samples of children and/or adolescents and relied on twin heritability estimates (which are inflated compared with estimates from extended family-design). The extended family-design takes advantage of family structure to efficiently increase power to estimate heritability and does not have the potential limitations on generalizability inherent to the twin study design (Ronald & Hoekstra, 2011). Heritability estimates of the broad autism phenotype have not been previously quantified to our knowledge; however, correlations of parent BAPQ scores with child SCQ scores have been performed to determine the relationship between broad autism phenotype features in parents and prevalence of ASD traits in children (Sasson et al., 2013). In line with the implication that the broad autism phenotype of family members may be related to the autism spectrum phenotype in children, we found BAPQ scores to be moderately heritable.
Additionally, we found the core autism spectrum behavioral domains and their subdomains to be heritable. For restricted, repetitive behaviors, we found the narrow-sense heritability of SRS-2A restricted interests and repetitive behavior subscale to be moderate, with some variability in self-report versus informant-report heritability. Heritability of informant-report SRS-2A restricted interests and repetitive behavior subscale in autistic children has been previously calculated in a twin-study design, using group heritability derived from an ACE model (h2g = 1.18) (Frazier et al., 2014). Within the social communication domain, the current study found moderate to high levels of heritability for social cognition, depending on the metric, which were higher than estimates from previous work for either the SRS social cognition subscale in a general population sample or for the ER-40 in a schizophrenia sample (Calkins et al., 2010, 2013; Greenwood et al., 2007; Gur et al., 2007; Warrier et al., 2018). Similarly, social anxiety had significant SNP-based heritability in a prior general population sample (Stein et al., 2017), which is consistent with our findings of moderate heritability of social anxiety in a sample rich with autism spectrum traits. The present study is, to our knowledge, the first to quantify the heritability of a social motivation metric related to autism. Given the argument that social motivation may be central to the social traits of ASD (Chevallier et al., 2013), the moderate heritability of social motivation in our sample, as well as its high level of shared heritability with other ASD-related traits measured, suggest that it could be a useful quantitative trait to explore in future genetics studies.
Among executive functioning and cognition measures, we found the BRIEF-A to be heritable in both its self-report and informant-report formats, though the self-report measure seemed to be less heritable than the informant-report. For the CNB abstraction and cognitive flexibility measures, the only heritable metric was PCET reaction time. This finding is in partial contrast with previous work in schizophrenia samples that found PCET accuracy and reaction time to be heritable as well as a previous study in a population-based twin-family sample that found PMAT accuracy and reaction time to be heritable (Calkins et al., 2010, 2013; Greenwood et al., 2007; Gur et al., 2007; Swagerman et al., 2016).
We found strong genetic correlations among self-report measures and among informant-report measures, suggesting that there is likely shared genetic contribution for many of the self-report traits, as well as for many of the informant-report traits. Among informant-report measures, it seems that stereotypy in particular may be dissociable from other ASD traits. Two previous studies examining genetic relationships among ASD traits, one in a child twin sample and one in a population-based sample, found social and non-social traits to be largely dissociable with little shared genetic contribution (Ronald et al., 2005; Ronald et al., 2006; Warrier et al., 2019). One previous study found high genetic correlation between social and restricted, repetitive behaviors in a child twin-sample (Frazier et al., 2014). Among CNB performance-based metrics, we found that few traits were significantly genetically correlated, in line with previous study in schizophrenia (Greenwood et al., 2007). Given the lack of shared heritability among performance-based tasks found in this study, we propose that they may have different underlying genetics and may reflect different aspects of the underlying biology of ASD. Though additional studies are needed to confirm these results, our findings seem to support the idea that it is valuable for clinicians to assess patients through multiple modalities (performance-based tasks, self-report of patients, and informant-report), in order to get the most complete set of data on patients’ history and functioning. Our findings would suggest that the genetic relationships among traits may depend on the assessment method (self-report vs. informant-report vs. CNB), as well as trait-specificity. For example, stereotypic behaviors—but not restricted, repetitive behaviors in general—are dissociable from other autism spectrum traits.
Nearly all measures tested in the present study were found to be heritable and, as such, could be good candidates for future genetic studies related to autism spectrum in adulthood. This, in addition to the phenotypic heterogeneity in the sample, suggests that these quantitative traits may be useful for identifying quantitative trait-specific genes, which could help to elucidate the mechanisms of genetic heterogeneity in ASD, as well as the mechanisms behind previously identified ASD loci. Heritability as calculated by SOLAR-Eclipse means that the phenotypic correlations among the relatives in these extended families decay with the degree of relationship, supporting an additive genetic model (possibly polygenic) in which the same variants are affecting variation in these quantitative traits in probands and family members. A previous case–control study of heritability of ASD diagnosis suggests that the degree to which heritability is additive may vary between simplex and multiplex families, which should be explored in future studies of quantitative ASD traits (Klei et al., 2012). The heritability estimates among the CNB measures would suggest that more power may be needed to determine the suitability of abstraction and cognitive flexibility metrics as phenotypes for genetic studies related to ASD, but that emotion recognition metrics would be good candidates for study. Across our results, we found that there did not seem to be a consistent pattern in the level of heritability of self-report and informant-report measures of the same questionnaire. In some cases, self-report and informant-report versions of the same questionnaire seemed similar in how heritable they were, while in others the heritability seemed to vary between the self-report and the informant-report (i.e., self-report heritability seemed higher or informant-report heritability seemed higher). Accordingly, we recommend that future genetics studies in adults on the autism spectrum use both self-report and informant-report measures, as they may be carrying unique sets of information. Future studies could also examine whether heritabilities of the traits are affected by the sex of the parent or by assortative mating.
In sum, this study quantified the heritability and the shared heritability of many quantitative traits across multiple behavioral domains in a single sample of adults high in autism spectrum traits and their family members, resulting in a list of phenotypes that are promising for future genetic study. The traits with the highest heritabilities should be prioritized for future study. Identifying a core set of heritable and co-heritable dimensional autism spectrum phenotypes gives us insight into the genetic architecture of ASD and will enhance power and interpretability of future gene localization studies.
ACKNOWLEDGMENTS
This study was supported by the Autism Spectrum Program of Excellence at the University of Pennsylvania as well as the National Institute of Mental Health (F31MH125539).
Funding information
Autism Spectrum Program of Excellence; National Institute of Mental Health, Grant/Award Number: F31MH125539
REFERENCES
- Almasy L, & Blangero J (1998). Multipoint quantitative-trait linkage analysis in general pedigrees. American Journal of Human Genetics, 62(5), 1198–1211. 10.1086/301844 [DOI] [PMC free article] [PubMed] [Google Scholar]
- Aman MG, Singh NN, Stewart AW, & Field CJ (1985). Psychometric characteristics of the aberrant behavior checklist. American Journal of Mental Deficiency, 89(5), 492–502. [PubMed] [Google Scholar]
- Aman MG, Singh NN, Stewart AW, & Field CJ (1985). The aberrant behavior checklist: A behavior rating scale for the assessment of treatment effects. American Journal of Mental Deficiency, 89(5), 485–491. [PubMed] [Google Scholar]
- American Psychiatric Association. (2013). Diagnostic and statistical manual of mental disorders. (5th ed.,). 10.1176/appi.books.9780890425596. [DOI]
- Auer PL, Reiner AP, & Leal SM (2016). The effect of phenotypic outliers and non-normality on rare-variant association testing. European Journal of Human Genetics, 24(8), 1188–1194. 10.1038/ejhg.2015.270 [DOI] [PMC free article] [PubMed] [Google Scholar]
- Baron-Cohen S, Wheelwright S, Skinner R, Martin J, & Clubley E (2001). The autism-spectrum quotient (AQ): Evidence from Asperger syndrome / high-functioning autism, males and females, scientists and mathematicians. Journal of Autism and Developmental Disorders, 31(1), 5–17. 10.1023/A:1005653411471 [DOI] [PubMed] [Google Scholar]
- Beasley TM, Erickson S, & Allison DB (2009). Rank-based inverse normal transformations are increasingly used, but are they merited? Behavior Genetics, 39(5), 580–595. 10.1007/s10519-009-9281-0 [DOI] [PMC free article] [PubMed] [Google Scholar]
- Berument SK, Rutter M, Lord C, Pickles A, & Bailey A (1999). Autism screening questionnaire: Diagnostic validity. British Journal of Psychiatry, 175(5), 444–451. [DOI] [PubMed] [Google Scholar]
- Calkins ME, Ray A, Gur RC, Freedman R, Green MF, Greenwood TA, Light GA, Nuechterlein KH, Olincy A, Radant AD, Seidman LJ, Siever LJ, Silverman JM, Stone WS, Sugar C, Swerdlow NR, Tsuang DW, Tsuang MT, Turetsky BI, Braff DL, Lazzeroni LC, & Gur RE (2013). Sex differences in familiality effects on neurocognitive performance in schizophrenia. Biological Psychiatry, 73(10), 976–984. 10.1016/j.biopsych.2012.12.021 [DOI] [PMC free article] [PubMed] [Google Scholar]
- Calkins ME, Tepper P, Gur RC, Ragland D, Klei L, Wiener HW, Richard J, Savage RM, Allen TB, O’Jile J, Devlin B, Kwentus J, Aliyu MH, Bradford D, Edwards N, Lyons PD, Nimgaonkar VL, Santos AB, Go RCP, & Gur RE (2010). Project among African-Americans to explore risks for schizophrenia (PAARTNERS): Evidence for impairment and heritability of neurocognitive functioning in families of schizophrenia patients. American Journal of Psychiatry, 167(4), 459–472. 10.1176/appi.ajp.2009.08091351 [DOI] [PMC free article] [PubMed] [Google Scholar]
- Castelbaum L, Sylvester CM, Zhang Y, Yu Q, & Constantino JN (2020). On the nature of monozygotic twin concordance and discordance for autistic trait severity: A quantitative analysis. Behavior Genetics, 50(4), 263–272. 10.1007/s10519-019-09987-2 [DOI] [PMC free article] [PubMed] [Google Scholar]
- Chesnut SR, Wei T, Barnard-Brak L, & Richman DM (2017). A meta-analysis of the social communication questionnaire: Screening for autism spectrum disorder. Autism, 21(8), 920–928. 10.1177/1362361316660065 [DOI] [PubMed] [Google Scholar]
- Chevallier C, Kohls G, Troiani V, Brodkin ES, & Schultz RT (2013). The social motivation theory of autism. Trends in Cognitive Neuroscience, 16(4), 231–239. 10.1016/j.tics.2012.02.007 [DOI] [PMC free article] [PubMed] [Google Scholar]
- Constantino JN, Davis SA, Todd RD, Schindler MK, Gross MM, Brophy SL, Metzger LM, Shoushtari CS, Splinter R, & Reich W (2003). Validation of a brief quantitative measure of autistic traits: Comparison of the social responsiveness scale with the autism diagnostic interview-revised. Journal of Autism and Developmental Disorders, 33(4), 427–433. 10.1023/A:1025014929212 [DOI] [PubMed] [Google Scholar]
- Constantino JN, & Todd RD (2003). Autistic traits in the general population: A twin study. Archives of General Psychiatry, 60(5), 524–530. 10.1001/archpsyc.60.5.524. [DOI] [PubMed] [Google Scholar]
- Frazier TW, Georgiades S, Bishop SL, & Hardan AY (2014). Behavioral and cognitive characteristics of females and males with autism in the simons simplex collection. Journal of the American Academy of Child and Adolescent Psychiatry, 53(3), 329–340. 10.1016/j.jaac.2013.12.004 [DOI] [PMC free article] [PubMed] [Google Scholar]
- Frazier TW, Thompson L, Youngstrom EA, Law P, & Hardan AY (2014). A twin study of heritable and shared environmental contributions to autism. Journal of Autism and Developmental Disorders, 44(8), 2013–2025. 10.1007/s10803-014-2081-2 [DOI] [PMC free article] [PubMed] [Google Scholar]
- Fresco DM, Coles ME, Heimberg RG, Liebowitz MR, Hami S, Stein MB, & Goetz D (2001). The Liebowitz social anxiety scale: A comparison of the psychometric properties of self-report and clinician-administered formats. Psychological Medicine, 31(6), 1025–1035. 10.1017/S0033291701004056 [DOI] [PubMed] [Google Scholar]
- Gaugler T, Klei L, Sanders SJ, Bodea CA, Goldberg AA, Lee AB, Mahajan M, Manaa D, Pawitan Y, Reichert J, Ripke S, Sandin S, Sklar P, Svantesson O, Reichenberg A, Hultman CM, Devlin B, Roeder K, & Buxbaum JD (2014). Most genetic risk for autism resides with common variation. Nature Genetics, 46(8), 881–885. 10.1038/ng.3039 [DOI] [PMC free article] [PubMed] [Google Scholar]
- Gioia GA, Isquith PK, Guy SC, & Kenworthy L (2000). Behavior rating inventory of executive function. Child Neuropsychology, 6(3), 235–238. 10.1076/chin.6.3.235.3152 [DOI] [PubMed] [Google Scholar]
- Greenwood TA, Braff DL, Light GA, Cadenhead IS, Calkins ME, Dobie DJ, Freedman R, Green MF, Gur RE, Gur RC, Mintz J, Nuechterlein KH, Olincy A, Radant AD, Seidman LJ, Siever LJ, Silverman JM, Stone WS, Swerdlow NR, … Schork NJ (2007). Initial heritability analyses of endophenotypic measures for schizophrenia: The consortium on the genetics of schizophrenia. Archives of General Psychiatry, 64(11), 1242–1250. 10.1001/archpsyc.64.11.1242 [DOI] [PMC free article] [PubMed] [Google Scholar]
- Gur RC, Ragland JD, Moberg PJ, Turner TH, Bilker WB, Kohler C, Siegel SJ, & Gur RE (2001). Computerized neurocognitive scanning: I. methodology and validation in healthy people. Neuropsychopharmacology, 25(5), 766–776. 10.1016/S0893-133X(01)00278-0 [DOI] [PubMed] [Google Scholar]
- Gur RC, Richard J, Hughett P, Calkins ME, Macy L, Bilker WB, Brensinger C, & Gur RE (2010). A cognitive neuroscience based computerized battery for efficient measurement of individual differences: Standardization and initial construct validation. Journal of Neuroscience Methods, 187(2), 254–262. 10.1016/j.jneumeth.2009.11.017 [DOI] [PMC free article] [PubMed] [Google Scholar]
- Gur RC, Sara R, Hagendoorn M, Marom O, Hughett P, Macy L, Turner T, Bajcsy R, Posner A, & Gur RE (2002). A method for obtaining 3-dimensional facial expressions and its standardization for use in neurocognitive studies. Journal of Neuroscience Methods, 115(2), 137–143. 10.1016/S0165-0270(02)00006-7 [DOI] [PubMed] [Google Scholar]
- Gur RE, Nimgaonkar VL, Almasy L, Calkins ME, Ragland JD, Pogue-Geile MF, Kanes S, Blangero J, & Gur RC (2007). Neurocognitive endophenotypes in a multiplex multigenerational family study of schizophrenia. American Journal of Psychiatry, 164(5), 813–819. 10.1176/ajp.2007.164.5.813 [DOI] [PubMed] [Google Scholar]
- Hallmayer J, Cleveland S, Torres A, Phillips J, Cohen B, Torigoe T, Miller J, Fedele A, Collins J, Smith K, Lotspeich L, Croen LA, Ozonoff S, Grether JK, & Risch N (2011). Genetic heritabilty and shared environmental factors among twin pairs with autism. Archives of General Psychiatry, 68(11), 1095–1102. 10.1001/archgenpsychiatry.2011.76 [DOI] [PMC free article] [PubMed] [Google Scholar]
- Harris PA, Taylor R, Minor BL, Elliott V, Fernandez M, Neal LO, Mcleod L, Delacqua G, Delacqua F, Duda SN, & REDCapConsortium. (2019). The REDCap consortium: Building an international community of software platform partners. Journal of Biomedical Informatics, 95,1–24. 10.1016/j.jbi.2019.103208 [DOI] [PMC free article] [PubMed] [Google Scholar]
- Harris PA, Taylor R, Thielke R, Payne J, Gonzalez N, & Conde JG (2009). Research electronic data capture (REDCap)-A metadata-driven methodology and workflow process for providing translational research informatics support. Journal of Biomedical Informatics, 42(2), 377–381. 10.1016/j.jbi.2008.08.010 [DOI] [PMC free article] [PubMed] [Google Scholar]
- Hill EL (2004). Executive dysfunction in autism. Trends in Cognitive Sciences, 8(1), 26–32. 10.1016/j.tics.2003.11.003 [DOI] [PubMed] [Google Scholar]
- Hoekstra RA, Bartels M, Verweij CJH, & Boomsma DI (2007). Heritability of autistic traits in the general population. Archives of Pediatrics and Adolescent Medicine, 161(4), 372–377. 10.1001/archpedi.161.4.372 [DOI] [PubMed] [Google Scholar]
- Hurley RSE, Losh M, Parlier M, Reznick JS, & Piven J (2007). The broad autism phenotype questionnaire. Journal of Autism and Developmental Disorders, 37(9), 1679–1690. 10.1007/s10803-006-0299-3 [DOI] [PubMed] [Google Scholar]
- Ingersoll B, Hopwood CJ, Wainer A, & Brent Donnellan M (2011). A comparison of three self-report measures of the broader autism phenotype in a non-clinical sample. Journal of Autism and Developmental Disorders, 41(12), 1646–1657. 10.1007/s10803-011-1192-2 [DOI] [PubMed] [Google Scholar]
- Klei L, Sanders SJ, Murtha MT, Hus V, Lowe JK, Willsey AJ, Moreno-De-Luca D, Yu TW, Fombonne E, Geschwind D, Grice DE, Ledbetter DH, Lord C, Mane SM, Martin CL, Martin DM, Morrow EM, Walsh CA, Melhem NM, … Devlin B (2012). Common genetic variants, acting additively, are a major source of risk for autism. Molecular Autism, 3(1), 1–13. 10.1186/2040-2392-3-9 [DOI] [PMC free article] [PubMed] [Google Scholar]
- Kurtz MM, Ragland JD, Moberg PJ, & Gur RC (2004). The Penn conditional exclusion test: A new measure of executive-function with alternate forms for repeat administration. Archives of Clinical Neuropsychology, 19(2), 191–201. 10.1016/S0887-6177(03)00003-9 [DOI] [PubMed] [Google Scholar]
- Maddox BB, & White SW (2015). Comorbid social anxiety disorder in adults with autism apectrum disorder. Journal of Autism and Developmental Disorders, 45(12), 3949–3960. 10.1007/s10803-015-2531-5 [DOI] [PubMed] [Google Scholar]
- McCaw ZR, Lane JM, Saxena R, Redline S, & Lin X (2020). Operating characteristics of the rank-based inverse normal transformation for quantitative trait analysis in genome-wide association studies. Biometrics, 76(4), 1262–1272. 10.1111/biom.13214 [DOI] [PMC free article] [PubMed] [Google Scholar]
- Morrison KE, Pinkham AE, Kelsven S, Ludwig K, Penn DL, & Sasson NJ (2019). Psychometric evaluation of social cognitive measures for adults with autism. Autism Research, 12(5), 766–778. 10.1002/aur.2084 [DOI] [PMC free article] [PubMed] [Google Scholar]
- Piven J, & Sasson NJ (2014). On the misapplication of the broad autism phenotype questionnaire in a study of autism. Journal of Autism and Developmental Disorders, 44(8), 2077–2078. 10.1007/s10803-014-2076-z [DOI] [PubMed] [Google Scholar]
- Pohl A, Jones WR, Marrus N, Zhang Y, Klin A, & Constantino JN (2019). Behavioral predictors of autism recurrence are genetically independent and influence social reciprocity: Evidence that polygenic ASD risk is mediated by separable elements of developmental liability. Translational Psychiatry, 9(1), 202. 10.1038/s41398-019-0545-z [DOI] [PMC free article] [PubMed] [Google Scholar]
- Ronald A, Happé F, Bolton P, Butcher LM, Price TS, Wheelwright S, Baron-Cohen S, & Plomin R (2006). Genetic heterogeneity between the three components of the autism spectrum: A twin study. Journal of the American Academy of Child and Adolescent Psychiatry, 45(6), 691–699. 10.1097/01.chi.0000215325.13058.9d [DOI] [PubMed] [Google Scholar]
- Ronald A, Happé F, & Plomin R (2005). The genetic relationship between individual differences in social and nonsocial behaviours characteristic of autism. Developmental Science, 8(5), 444–458. 10.1111/j.1467-7687.2005.00433.x [DOI] [PubMed] [Google Scholar]
- Ronald A, & Hoekstra RA (2011). Autism spectrum disorders and autistic traits: A decade of new twin studies. American Journal of Medical Genetics, Part B: Neuropsychiatric Genetics, 156(3), 255–274. 10.1002/ajmg.b.31159 [DOI] [PubMed] [Google Scholar]
- Sandin S, Lichtenstein P, Kuja-Halkola R, Hultman C, Larsson H, & Reichenberg A (2017). The heritability of autism spectrum disorder analysis. JAMA, 318(12), 1182–1184. 10.1001/jama.2017.12141 [DOI] [PMC free article] [PubMed] [Google Scholar]
- Sappok T, Diefenbacher A, Gaul I, & Bölte S (2015). Validity of the social communication questionnaire in adults with intellectual disabilities and suspected autism spectrum disorder. American Journal on Intellectual and Developmental Disabilities, 120(3), 203–214. 10.1352/1944-7558-120.3.203 [DOI] [PubMed] [Google Scholar]
- Sasson NJ, Lam KSL, Parlier M, Daniels JL, & Piven J (2013). Autism and the broad autism phenotype: Familial patterns and intergenerational transmission. Journal of Neurodevelopmental Disorders, 5, 11. 10.1186/1866-1955-5-11 [DOI] [PMC free article] [PubMed] [Google Scholar]
- Shipley WC, Gruber CP, Martin TA, & Klein AM (2009). Shipley-2 manual. Western Psychological Services. [Google Scholar]
- Spain D, Sin J, Linder KB, McMahon J, & Happé F (2018). Social anxiety in autism spectrum disorder: A systematic review. Research in Autism Spectrum Disorders, 52,51–68. 10.1016/j.rasd.2018.04.007 [DOI] [Google Scholar]
- Stein MB, Chen CY, Jain S, Jensen KP, He F, Heeringa SG, Kessler RC, Maihofer AX, Nock MK, Ripke S, Sun X, Thomas ML, Ursano RJ, Smoller JW, Gelernter J, & Army STARRS Collaborators. (2017). Genetic risk variants for social anxiety. American Journal of Medical Genetics, Part B: Neuropsychiatric Genetics, 174(2), 120–131. 10.1002/ajmg.b.32520 [DOI] [PMC free article] [PubMed] [Google Scholar]
- Swagerman SC, De Geus EJC, Kan KJ, Van Bergen E, Nieuwboer HA, Koenis MMG, HulshoffPol HE, Gur RE, Gur RC, & Boomsma DI (2016). The computerized neurocognitive battery: Validation, aging effects, and heritability across cognitive domains. Neuropsychology, 30(1), 53–64. 10.1037/neu0000248 [DOI] [PubMed] [Google Scholar]
- Tick B, Bolton P, Happé F, Rutter M, & Rijsdijk F (2016). Heritability of autism spectrum disorders: A meta-analysis of twin studies. Journal of Child Psychology and Psychiatry and Allied Disciplines, 57(5), 585–595. 10.1111/jcpp.12499 [DOI] [PMC free article] [PubMed] [Google Scholar]
- Warrier V, Grasby KL, Uzefovsky F, Toro R, Smith P, Chakrabarti B, Khadake J, Mawbey-Adamson E, Litterman N, Hottenga JJ, Lubke G, Boomsma DI, Martin NG, Hatemi PK, Medland SE, Hinds DA, Bourgeron T, & Baron-Cohen S (2018). Genome-wide meta-analysis of cognitive empathy: Heritability, and correlates with sex, neuropsychiatric conditions and cognition. Molecular Psychiatry, 23(6), 1402–1409. 10.1038/mp.2017.122 [DOI] [PMC free article] [PubMed] [Google Scholar]
- Warrier V, Toro R, Won H, Leblond CS, Cliquet F, Delorme R, De Witte W, Bralten J, Chakrabarti B, Børglum AD, Grove J, Poelmans G, 23andMe Research Team, Hinds DA, Bourgeron T, & Baron-Cohen S (2019). Social and non-social autism symptoms and trait domains are genetically dissociable. Communications Biology, 2, 328. 10.1038/s42003-019-0558-4 [DOI] [PMC free article] [PubMed] [Google Scholar]
- Xie S, Karlsson H, Dalman C, Widman L, Rai D, Gardner RM, Magnusson C, Sandin S, Tabb LP, Newschaffer CJ, & Lee BK (2020). The familial risk of autism spectrum disorder with and without intellectual disability. Autism Research, 13(12), 2242–2250. 10.1002/aur.2417 [DOI] [PMC free article] [PubMed] [Google Scholar]