

Abstract
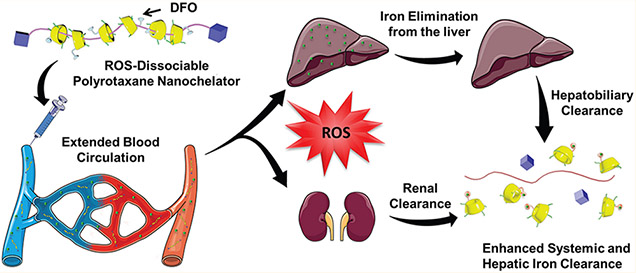
Chronic blood transfusions are used to alleviate anemic symptoms in thalassemia and sickle cell anemia patients but can eventually result in iron overload (IO) and subsequently lead to severe oxidative stress in cells and tissues. Deferoxamine (DFO) is clinically approved to treat transfusional IO, but the use of the iron chelator is hindered by nonspecific toxicity and poor pharmacokinetic (PK) properties in humans, resulting in the need to administer the drug via long-term infusion regimens that can often lead to poor patient compliance. Herein, a nanochelator system that uses the characteristic IO physiological environment to dissociate was prepared through the incorporation of DFO and reactive oxygen species (ROS)-sensitive thioketal groups into an α-cyclodextrin-based polyrotaxane platform (rPR-DFO). ROS-induced dissociation of this nanochelator (ca. 10 nm) into constructs averaging 2 nm in diameter significantly increased urine and fecal elimination of excess iron in vivo. In addition to significantly improved PK properties, rPR-DFO was well-tolerated in mice and no adverse side effects were noted in single high dose or multiple dose acute toxicity studies. The overall features of rPR-DFO as a promising system for iron chelation therapy can be attributed to a combination of the nanochelator’s improved PK, favorable distribution to the liver, and ROS-induced dissociation properties into constructs <6 nm for faster renal elimination. This ROS-responsive nanochelator design may serve as a promising alternative for safely prolonging the circulation of DFO and more rapidly eliminating iron chelates from the body in iron chelation therapy regimens requiring repeated dosing of nanochelators.
Keywords: reactive oxygen species, polyrotaxane, thioketal, iron overload, nanochelator, deferoxamine
Graphical Abstract
Thalassemia and sickle cell anemia are hereditary diseases characterized by the body’s inability to make sufficient amounts of functional hemoglobin and can lead to severe cases of anemia, requiring chronic blood transfUsions to alleviate symptoms.1-3 When red blood cells (RBCs) become senescent, they are primarily phagocytized by macrophages in the liver, and the iron is either reused for various physiological functions or stored as ferritin or hemosiderin within cells.4-6 Unfortunately, the human body does not have efficient means of excreting excess iron and progressive blood transfusions in patients eventually disrupt the iron homeostatic system. The introduction of excess iron through transfusions leads to the saturation of iron transport and storage proteins and, subsequently, the presence of reactive non-transferrin-bound iron (NTBI) in circulation.7,8 NTBI can be extremely dangerous in humans due to iron’s catalytic capacity to generate highly toxic ROS via the Haber–Weiss reaction:9,10
The ROS produced through this intracellular reaction is able to induce the oxidation of DNA, the damage of proteins, and the peroxidation of membrane lipids, further leading to cell death. In addition, IO is correlated with an increased risk of liver cirrhosis and cancer, diabetes, arthritis, and premature death due to iron-induced cardiomyopathy and the acceleration of neurodegenerative diseases.7 Regular iron homeostasis at the systemic and cellular levels is therefore critical in maintaining human health.
Systemic iron chelation therapy through the infusion of DFO is still employed by clinicians to remove excess iron from IO patients.11,12 Due to its short blood circulation time (half-life of ca. 20 min in humans) and rapid elimination, DFO must be infused over several hours for consecutive days but is known to induce neurotoxicity issues in patients at high doses.13 To optimize the outcome of IO treatments, it would be desirable to prolong the circulation time of DFO by conjugating it to a macromolecule to form a “nanochelator”.14-17 Since the liver has been identified as the primary organ responsible for RBC iron recycling18 and liver macrophages have been implicated to be heavily involved in the storage of excess iron in the form of ferritin, favorable trafficking of these nanochelators to the liver can facilitate the elimination of large amounts of excess iron from the body. However, the dichotomy with using large macromolecules to improve PK properties is that it is also highly desirable to simultaneously retain the favorable elimination properties of smaller hydrophilic drugs for faster elimination of iron chelates in order to minimize safety concerns in repeated dosing regimens. To achieve all these objectives, we report on the design and characterization of a rPR-DFO nanochelation system averaging 10 nm to improve on the PK of DFO while retaining the favorable renal elimination properties of molecules < 6 nm.19 We specifically investigate here whether the dissociation of rPR-DFO into molecules < 6 nm improves overall clearance of iron from the body through the incorporation of a thioketal linker sensitive to ROS. We found that the presence of the ROS-sensitive thioketal linker results in the release of cyclodextrins–DFO conjugates (CD-DFO) (ca. 2 nm) from rPR-DFO (ca. 10 nm) at a rate that is both time- and ROS concentration-dependent in vitro. In vivo studies in IO mice subsequently also confirmed that the dissociation of rPR-DFO into smaller constructs < 6 nm significantly improved total renal and fecal elimination of iron from the body in comparison to control PR-DFO in spite of both constructs possessing similar PK properties.
In terms of the specific design, the rPR-DFO nanochelation system was formed by threading α-cyclodextrins through noncovalent interactions onto a linear polyethylene glycol (PEG) chain (MW 4000 Da),20,21 subsequently capped by bulky adamantane end groups through thioketal linkers, and DFO was consequently conjugated to resulting threaded CD (Figure 1A). The conjugation of DFO’s terminal amines to CD is advantageous as it significantly reduces the reported cytotoxic properties of this reactive terminal amino group in vivo.14-17 The polyrotaxane (PR) core structure was chosen as a therapeutic platform due to its known ability to extend the blood circulation of bound drugs, and recent studies have shown that highly threaded PR preferentially deposits into the liver.22,23 Since the liver is heavily involved in the storage of excess iron and thus naturally characterized by elevated ROS levels due to the Haber–Weiss reaction,18 monitoring the elimination efficiency of rPR-DFO compared to PR-DFO from this specific organ is particularly beneficial to assess whether elimination of rPR-DFO is accelerated in that organ compared to PR-DFO. Previous environmental triggers that have been investigated for the release of bound drugs from PR include pH, enzyme, or reduction mechanisms,24-26 but these triggers are not rational for use in the context of iron-overloaded cells. We demonstrate here the superior ability of rPR-DFO to enhance the circulation time of DFO, preferentially distribute to the liver, and significantly improve total urine and fecal elimination of iron following ROS-triggered dissociation of rPR-DFO into constructs sized ca. 2 nm. In spite of similar PK properties between rPR-DFO and PR-DFO, the dissociative feature of rPR-DFO below the renal threshold cutoff (<6 nm) enhanced the elimination of systemic and hepatic iron in an IO mouse model. Encouragingly no adverse side effects were noted in single high dose or multiple dose acute toxicity studies conducted in animals involving rPR-DFO, making it a promising nanochelation system for repeated dosing regimens.
Figure 1.

Preparation and characterization of rPR-DFO. (A) Schematic representation for preparing rPR-DFO. (B) Representative TEM image of rPR-DFO (scale bar equals 50 nm). (C) Cumulative CD-DFO release from rPR-DFO at various H2O2 concentrations in the presence of 1 μM FeSO4. (D) In vitro dissociation was further assessed by incubating fluorescent FL-rPR-DFO or control FL-PR-DFO with IO J774A.1 and HepG2 cells (50 or 100 μM FAC). Where relevant, all the data are presented as mean ± SD (n = 3); “ns” means the difference was not significant and ****p < 0.0001.
RESULTS AND DISCUSSION
Synthesis and Characterization of rPR-DFO.
The ROS-cleavable end-capping reagent, thioketal-adamantine (TAd), was synthesized as described in the Supporting Information, and the final chemical structure was confirmed by 1H NMR spectroscopy (Figures S1 and S2). The synthetic scheme for preparing the rPR-based nanochelator is briefly described as follows (Figure S3): (1) pseudopolyrotaxane (PPR) was first produced by threading α-CDs onto a linear poly(ethylene glycol) di(carboxylic acid) (bis-PEG-COOH, Mn = 4000) polymer chain, (2) the bulky ROS-cleavable TAd was utilized to cap the ends of PPR, affording rPR; (3) next, the hydroxyl groups of CD were activated by carbonyldiimidazole (CDI) and coupled to the terminal amines of DFO (the terminal amines are not used in binding iron); (4) last, the remaining CDI groups were conjugated to ethanolamine (EA) to increase the water solubility of the carrier,27,28 affording the final rPR-DFO.
In the 1H NMR spectra of rPR (Figure S4), the peaks belonging to PEG were found at 3.48 ppm (─CH2─) and the peaks belonging to α-CD were observed at 3.10–3.95 ppm (C2─H, C3─H, C4─H, C5─H, C6─H), 4.46 ppm (C6─OH), 4.80 ppm (C1─H), 5.53 ppm (C3─OH), and 5.69 ppm (C2─OH), and there was also a broad multiple peak observed at 1.57–2.02 ppm corresponding to the protons of TAd. Compared with the narrow proton signals of PPR, the proton signals of rPR were broad and unresolved due to the stable supramolecular architecture of rPR in DMSO and the decrease of conformational flexibility of CD and PEG moieties during rotaxanation.29 By comparing the integral intensities of the α-CD C1─H (4.80 ppm) and proton of adamantine (1.90–2.00 ppm) signals and assuming one CD threads over every two repeating units of ethylene glycol in the full-coverage state, the number of CD molecules per chain was estimated to be 34, which corresponds to an inclusion ratio of ca. 74% and an average molecular weight of about 39 kDa. High threading of PR was desired and achieved in order to maximize liver deposition of the construct.26 Two-dimensional rotating-frame Overhauser effect spectroscopy (2D ROESY) of rPR shows clear cross-peaks corresponding to the nonbonding interaction of the C3─H (δ = 3.72 ppm) and C5─H (δ = 3.63 ppm) protons of α-CD and ─CH2─ (δ = 3.48 ppm) of PEG, confirming that the linear PEG threaded through the cavity of CD rings (Figure S5).
To further demonstrate the formation of stable supramolecular structures, two-dimension diffusion-ordered NMR spectroscopy (2D DOSY) was utilized to assess the diffusion coefficient (D), which corresponds to the molecular weight of rPR and PPR.30 Two separate peaks corresponding to α-CD and PEG were observed along the diffusion axis of the 2D DOSY spectrum for PPR (Figure S6). More specifically, the proton signals of α-CD and PEG were associated with the D values of ca. 8.13 × 10⁻¹¹ and 3.98 × 10⁻¹¹ m2 s−1, respectively, suggesting two different species in solution and implying that the CDs of PPR likely dethreaded from the PEG chain in DMSO. In contrast, the 2D DOSY spectrum of rPR was characterized by a single peak along the diffusion axis and all proton peaks of α-CD and PEG were characterized by the same D of approximately 1.99 × 10⁻¹¹ m2 s−1. These results confirm that the supramolecular structure of rPR is stable as a whole unit in solution.
The conjugation of DFO and EA to rPR was accomplished through CDI-mediated amide coupling. In the 1H NMR spectrum of rPR-DFO (Figure S4), peaks corresponding to the ─CH2─ of DFO (δ = 1.19–2.77 ppm) and EA groups (δ = 3.20 ppm) were observed. By comparing the integrations of the signals at 2.07 ppm (─CH3 of DFO) to those at 5.05 ppm (C1─H of α-CD), the content of DFO conjugated onto each α-CD could be estimated at ca. 10.7% w/w DFO to rPR-DFO. Furthermore, the characteristic absorption peak at 430 nm corresponding to DFO:iron(III) complex formation31 was also observed in the absorption spectrum of rPR-DFO in the presence of iron(III), which further confirms successful conjugation of DFO to rPR (Figure S7). The linear relationship between absorbance and concentration of DFO:iron(III) complexes in solution was used to calculate DFO loading as previously reported16 and was determined to be ca. 11.1% w/w DFO to rPR-DFO. The morphological structure of rPR-DFO was examined by transmission electron microscopy (TEM). Although rPR-DFO is a linear supramolecular assembly, representative TEM micrographs revealed crescent shapes averaging ca. 10.0 nm in diameter that looked spherical due to their flexibility as random coils in appropriate solvents (Figure 1B) and agrees with other reports.32 Dynamic light scattering (DLS) displayed a single peak characterized by a Z-average diameter of 9.96 ± 0.04 nm with a PDI of 0.13 ± 0.02, indicating that rPR-DFO is reasonably monodispersed. Controls for rPR-DFO that were synthesized included EA-modified rPR without DFO (rPR-OH), EA-modified CD with and without DFO (CD-DFO and CD-OH, respectively), and non-ROS-responsive EA-modified PR with and without DFO (PR-DFO and PR-OH, respectively) (Figures S4-S8). Fluorophore-labeled rPR-DFO (FL-rPR-DFO) was prepared by conjugating Fluorescein cadaverine (for in vitro studies) or Sulfo-Cyanine5.5 amine (for in vivo studies) to the final construct. The physicochemical characterization of all the nanomaterials used in these studies is summarized in Table S1.
ROS-Triggered In Vitro Dissociation Studies.
The bulky adamantane end-caps preventing dissociation of CD-DFO from rPR-DFO are conjugated to the ends through thioketal linkages, which are sensitive to ROS therefore the sensitivity of this linker to ROS was investigated in vitro.33 In this study, the addition of H2O2 and ferrous iron (Fe2+ or iron(II)) was employed to produce highly reactive hydroxyl radicals (•OH)34-36 via the Fenton reaction and also serves to mimic the type of ROS found in IO conditions. rPR-DFO was first saturated with iron(III) to completely prechelate DFO prior to the addition of the iron(II) catalyst. To investigate dissociation of the nanochelator in the presence of iron(II) and various concentrations of H2O2, rPR-DFO:iron-(III) was incubated with 0, 1, or 10 mM H2O2 plus 1 μM Fe2+ for 48 h, and the bottom filtrate was analyzed by monitoring UV/vis absorption at 430 nm at various time points for evidence of CD-DFO:iron(III) dissociation (note: intact rPR-DFO:iron(III) cannot pass through the centrifugal filtration unit of MWCO 10 000 Da and remained in the top concentrate in this assay). As shown in Figure S9, dissociated CD-DFO:iron(III) passed through the membrane, and a signal at 430 nm corresponding to the DFO:iron(III) complex was detected in the bottom filtrate, whereas no signal in the filtrate was detected for control PR-DFO:iron(III). Using the incubation and centrifugal filtration technique, Figure 1C summarizes the extent of CD-DFO release from rPR-DFO. At all time points evaluated, higher levels of ROS production correlated with increased dissociation of CD-DFO, confirming that cleavage of thioketals in rPR-DFO is sensitive to ROS levels.
To further verify cleavage, rPR-DFO dissociation in the presence of ROS was investigated by monitoring the apparent size change of rPR-DFO with DLS (Figure S10A) and high-performance liquid chromatography (HPLC) (Figure S10B). After 48 h of incubation and at 1 mM H2O2 plus 1 μM Fe2+, a peak at ca. 2 nm corresponding to CD-DFO appeared; this size is well below the cutoff size of <6 nm for renal elimination from the body.19 Similarly, at 10 mM H2O2 plus 1 μM Fe2+, there was significantly even more CD-DFO generated after 48 h. The combined data clearly demonstrate that thioketal linkages of rPR-DFO cleave in a ROS concentration-dependent manner. In contrast, there was no change in size and retention time for control PR-DFO regardless of ROS exposure levels or time of exposure. The dissociation mechanism of rPR-DFO under in vitro ROS conditions due to thioketal cleavage was further confirmed by NMR spectroscopy (Figure S11). To simplify the NMR spectrum and facilitate this study, rPR-OH (without DFO conjugation) was utilized instead of rPR-DFO. The 1H NMR spectra of rPR-OH before and after exposure to 10 mM H2O2 plus 1 μM Fe2+ after 48 h clearly show a decrease of the ─CH3 peak assigned to the thioketal linker at δ = 1.57 ppm and the appearance of acetone, a major dissociation product of thioketal cleavage at δ = 2.21 ppm. Taken together, all the data presented confirm that ROS can cleave thioketal groups of rPR-DFO in a concentration- and time-dependent manner and that this results in the proportional dissociation of CD-DFO from the PEG chain. As an additional control, thioketal linkers of rPR-DFO remained stable at pH 5.0, 7.4, and 10.0 for up to 240 as monitored by DLS and TEM (Figure S12A-C). rPR-DFO was also stable in medium and saline solutions for up to 240 h, indicating that it is a suitable construct for further in vitro and in vivo studies (Figure S12D,E).
IO is closely associated with increased levels of oxidative stress in cells due to the Haber–Weiss reaction.9,10 To confirm that ROS production generated in IO cells can cleave rPR-DFO, macrophage cells (J774A.1) and hepatoma cells (HepG2) were iron overloaded with 0, 50, or 100 μM ferric ammonium citrate (FAC) aqueous solutions for 24 h, and ROS production was measured with the DCFDA cellular ROS detection assay kit.37 The assay clearly shows a correlation between FAC concentration and increased intracellular ROS production in cells (Figure S13). To investigate the cellular dissociation properties of the construct under different IO environments, FL-rPR-DFO was incubated with the cells (0, 50, 100 μM FAC) for 24 h. Cytoplasmic extracts were collected and washed with a centrifugal filtration unit (MWCO 10 000 Da), and the fluorescence (ex/em = 493/517) of the filtrate was measured. The fluorescence intensity of cytoplasmic extracts collected from IO cells (50 or 100 μM FAC) was significantly higher compared to medium collected from noniron-overloaded (NIO) cells treated with 0 μM FAC (Figure 1D). Notably, there was no significant change in the fluorescence signals obtained from the filtrate of cells treated with control FL-PR-DFO. This confirms that rPR-DFO can dissociate at a degree proportional to the level of oxidative stress in cells.
Cytocompatibility Studies.
The use of DFO therapy has been reported to result in nonspecific toxicity in humans at high doses.38 However, here in vitro studies with J774A.1 and HepG2 cells showed that the cell viability significantly increased after treatment with rPR-DFO at the same equivalent DFO concentration compared to the free drug (Figure S14A-C). For example, IC50 for DFO was ca. 10 μM in J774A.1 cells and ca. 30 μM in HepG2 cells but was greater than 1000 μM for rPR-DFO in both cell lines, suggesting that DFO’s toxicity may be reduced by conjugating the drug’s reactive primary amino group to rPR.39 Controls PR-DFO and CD-DFO exhibited a similar cytotoxicity profile to rPR-DFO whereas controls without DFO conjugated (i.e., CD-OH, PR-OH, and rPR-OH at equivalent rPR-DFO concentrations) exhibited little cytotoxicity and possessed no iron chelation properties (Figure S15A-D). The hemolytic activity for rPR-DFO and all controls synthesized was investigated at different concentrations by monitoring RBC lysis over a 12 h incubation period. Positive and negative controls for hemolysis studies included RBCs incubated with 0.5% Triton X-100 and RBCs suspended in phosphate-buffered saline (PBS), respectively. The hemolysis percentage was <1.1% for all the groups in the concentration range tested, even at the highest concentration of 10 mg/mL equiv DFO, which suggests that rPR-DFO is hemocompatible and safe for intravenous (i.v.) administration. Finally, a byproduct of thioketal cleavage is the production of acetone in cells; therefore the addition of acetone up to 1200 μg/mL was investigated and demonstrated to be nontoxic to cells up to the 48 h time point investigated (Figure S16). Overall, these studies reveal that rPR-DFO and all controls synthesized are significantly less toxic to mammalian cells than free DFO.
In Vitro Iron Chelation Efficacy Studies.
Ferritin is the cell’s primary intracellular protein for storing iron and therefore provides a good indirect measure of overall iron body storage levels.4 The ability of our nanochelator to chelate iron from J774A.1 macrophage and HepG2 liver cells pretreated with 100 μM FAC for 24 h was evaluated through a ferritin ELISA assay. Free DFO, CD-DFO, PR-DFO, and rPR-DFO exhibited similar treatment effects based on comparable declines in ferritin concentrations at 10 μM equivalent DFO concentrations (Figure 2A), whereas CD-OH, PR-DFO, and rPR-OH had no effect on ferritin levels and confirm that DFO was responsible for the iron chelation and ferritin level reductions observed (Figure S15C). In addition, a main feature of IO cells is the increased generation of highly toxic, iron-mediated ROS via the Haber–Weiss reaction.9,10 Iron chelators should possess the ability to reduce oxidative stress levels in cells by reducing the catalytic effect of iron. To investigate this phenomenon, ROS levels in IO cells were measured using the DCFDA cellular ROS detection assay kit before and after treatment. ROS generation decreased significantly only after CD-DFO, PR-DFO, rPR-DFO, and free DFO treatments (Figure 2B), whereas CD-OH, PR-OH, and rPR-OH had no observable impact on ROS levels (Figure S15D). These results confirm that nanochelators with DFO can effectively reduce the effect of iron-mediated oxidative stress in cells through the chelation of iron.
Figure 2.

(A) Ferritin expression levels in IO J774A.1 and HepG2 cells (100 μM FAC) treated with DFO, CD-DFO, PR-DFO, and rPR-DFO (10 μM equiv DFO); results are normalized to total protein. (B) Iron-mediated oxidative stress levels in IO J774A.1 and HepG2 cells (100 μM FAC) treated with DFO, CD-DFO, PR-DFO, and rPR-DFO (10 μM equiv DFO). (C) Co-localization micrographs of FL-rPR-DFO within each organelle in IO J774A.1 and HepG2 cells at 4 h. R-Values related to co-localization within lysosomes were significantly higher than mitochondria or endoplasmic reticulum for both NIO and IO conditions, indicating preferential lysosomal accumulation of rPR-DFO (see Table S2). Where relevant, all the data are presented as mean ± SD (n = 3); “ns” means the difference was not significant, **p < 0.01, ***p < 0.001, and ****p < 0.0001.
Cellular Uptake and Subcellular Localization Behavior.
Lysosomes naturally accumulate large amounts of iron due to the important role they play in the degradation of iron-containing macromolecules (e.g., ferritin) or senescent erythrocytes (by macrophages).40 During oxidative stress, large amounts of hydrogen peroxide enter the lysosomal compartments and lead to the formation of abundant ROS via the iron-mediated Haber–Weiss reaction.41 Since lysosomes do not naturally contain hydrogen peroxide-inactivating mechanisms, the increasing presence of ROS may affect lysosomal integrity and its contents (e.g., lipid peroxidation, enzyme degradation) and lead to cellular apoptosis or necrosis.42 The successful subcellular localization of rPR-DFO to lysosomes is therefore a crucial factor to improve iron chelation efficacy and safety. In the case of rPR-DFO, the nanochelator could subsequently undergo ROS-triggered dissociation within lysosomes to release threaded CDs, facilitating the elimination of chelated iron.
Confocal laser scanning microscopy (CLSM) was used to track the cellular uptake and subcellular localization behavior of FL-rPR-DFO in J774A.1 macrophage cells and HepG2 cells (Figure 2C). Typical CLSM images show that FL-rPR-DFO was internalized by both J774A.1 macrophage cells and HepG2 liver cells under IO conditions and co-localized with LysoTracker in lysosomes, suggesting that rPR-DFO entered cells and was eventually trafficked into lysosomes within the cell. In contrast, only a small amount of FL-rPR-DFO co-localized with the mitochondria and endoplasmic reticulum. To further elucidate the localization of rPR-DFO, Pearson’s correlation coefficient (Rr) was determined by software analysis (Table S2). The R-values related to co-localization within lysosomes were significantly higher than mitochondria or endoplasmic reticulum under both NIO and IO conditions, confirming preferential lysosomal accumulation of rPR-DFO. Although it is impossible to distinguish between the green fluorescence signal from intact rPR-DFO versus released CD-DFO, data do confirm that the signals from both FL-CD-DFO and FL-PR-DFO co-localized within lysosomes; therefore rPR-DFO and the released CD-DFO appear to preferentially localize to lysosomes.
Biodistribution (BD) and PK Studies.
To monitor whole-body BD, FL-rPR-DFO was injected systemically into IO mice at the same dose via tail vein. The BD and PK were monitored over 24 h with noninvasive real-time near-infrared fluorescence (NIRF) imaging (Figure 3A,B). It can be observed from the BD images that the fluorescence signal distributed throughout the body at earlier time points and gradually decreased over time, with the signals remaining pronounced near the abdomen and bladder areas at 24 h. Compared to NIO mice as controls (Figure S17A,B), it is notable that there was a faster fluorescence signal decline in IO mice treated with FL-rPR-DFO, likely due to enhanced ROS-triggered dissociation of the construct under elevated oxidative conditions, which resulted in faster elimination of the construct from the bodies of IO mice. There was a similar fluorescence signal decline for IO and NIO mice treated with FL-PR-DFO, but the fluorescence signal of FL-CD-DFO decreased much faster compared to FL-rPR-DFO and FL-PR-DFO in both IO and NIO mice due to its smaller size.
Figure 3.

(A) Fluorescence distribution of FL-CD-DFO, FL-PR-DFO, and FL-rPR-DFO in IO mice and ex vivo fluorescence images of liver, spleen, heart, kidneys, and lungs harvested from IO mice at 12 h postinjection. (B) PK profiles of CD-DFO, PR-DFO, and rPR-DFO in IO mice. (C) Quantitative BD in major organs for NIO and IO mice at 12 h. Results are presented as mean ± SD (n = 6). Where relevant, all the data are presented as mean ± SD (n = 6); “ns” means the difference was not significant, *p < 0.05, **p < 0.01, ***p < 0.001, and ****p < 0.0001.
As a specific example, main organs including the liver, spleen, heart, kidneys, and lungs of mice were collected at 12 h for ex vivo NIR imaging. The most intense fluorescence signal at 12 h was observed in the liver and kidneys of IO mice treated with FL-rPR-DFO (Figure 3A), though the fluorescence signals from the liver and kidneys of NIO mice still appeared significantly more elevated compared to those of IO mice (Figure S17A). Quantitative tissue distribution of FL-rPR-DFO confirmed that the nanochelator accumulation trend was significantly lower in all the organs collected from IO mice compared to NIO mice (Figure 3C). This demonstrates that nanochelators tend to accumulate in the liver compared to other organs, which is advantageous for iron chelation therapy,4,6 but that a ROS-sensitive nanochelator may be more rapidly eliminated from the iron-overloaded organ. The quantitative tissue distribution analysis verifies the observations that ROS-induced dissociation of rPR-DFO may help facilitate more rapidly the elimination of the construct from the liver. The weak fluorescence signal of FL-CD-DFO in different organs further supports that the smaller dissociated fragments of rPR-DFO may lead to their faster elimination from the body.
For the PK study, the parameters of three different formulations (FL-CD-DFO, FL-PR-DFO, and FL-rPR-DFO) in NIO or IO mice were compared (Table S3). DFO has a short half-life (t1/2) of approximately 0.10 h in NIO or IO mice (Figure S18). CD-DFO was rapidly cleared from blood with a t1/2 of ~0.61 h in NIO mice and a comparable t1/2 of 0.59 h in IO mice; PR-DFO similarly extended the circulation of DFO with a t1/2 of 4.16 h in NIO mice and a t1/2 of 4.37 h in IO mice; rPR-DFO exhibited a circulation t1/2 of 4.24 h in NIO mice and 3.31 h in IO mice (Figures 3B and S17B). Since serum iron in IO mice can contribute to the formation of ROS43 and therefore enhance the dissociation of rPR-DFO, the t1/2, mean residence time (MRT), and area under the curve (AUC0→∞) of rPR-DFO in IO mice were lower than those in NIO mice, indicating that rPR-DFO exhibited shorter blood retention in IO mice. In addition, the lower elimination rate constant (Ke), volume of distribution (Vd), and total clearance (CLtot) of rPR-DFO in NIO mice compared to IO mice further confirm faster clearance of rPR-DFO from IO mice. The Vd of rPR-DFO in IO mice is slightly greater than in NIO mice, suggesting perhaps more partitioning of the construct into tissues of IO mice due to dissociation of the construct. Since PR-DFO does not dissociate in response to elevated oxidative stress, there was little difference between the PK data in IO mice compared to NIO mice. In general, the fate of PR in vivo can be tailored through specific structural modifications. In our study, highly threaded PR (threading efficiency 74%) was employed since it has been reported to be long-circulating and to deposit in the liver.25 Based on the BD and PK properties of rPR-DFO by NIRF imaging, the rPR-DFO nanochelator does preferentially accumulate in the liver, exhibits prolonged circulation compared to free DFO and CD-DFO, and is eliminated faster from the IO mouse compared to control PR-DFO. A faster nanochelator material elimination strategy may be particularly advantageous in repeated dosing regimens. As iron stores begin to normalize, the intact nanochelator is also eventually eliminated from NIO mice and is an important feature to ensure elimination of the nanomaterial from the body.
Tolerability and Safety.
The maximum tolerated dose (MTD) was investigated to determine the highest dose of treatment that can be administered without resulting in unacceptable side effects. The median lethal dose (LD50) for DFO in the mouse has been reported to be 250 mg/kg.39 All mice injected with a single dose of CD-DFO, PR-DFO, or rPR-DFO up to 500 mg/kg equiv DFO survived, and there was no evidence of acute toxicity during the two-week observation period based on body weight fluctuations (Figure S19A) or organ weights collected at the end of the study (Figure S19B), which indicates an apparent reduction in the toxicity of DFO once the drug is conjugated. Note that the MTD of rPR-DFO was not reached at 500 mg/kg equiv DFO and higher doses were not tested chiefly due to limits of the formulation in terms of solubility and viscosity even though it appears that relatively higher doses of rPR-DFO could have been tolerated. Major organs including the liver, spleen, heart, kidneys, and lungs were sectioned and stained with hematoxylin and eosin (H&E) and subjected to blinded histopathological analysis (Figure S19C). In summary, no pathological abnormality was detected in the tissues of mice treated with CD-DFO, PR-DFO, or rPR-DFO at the highest dose of 500 mg/kg equiv DFO, and the histology of mice treated with controls CD-OH, PR-OH, and rPR-OH was also similar to that of the saline-treated mice.
To further investigate the effect of multiple dose treatment on major organs, including liver and kidney functions, NIO mice were administered 6 doses of saline, DFO, CD-DFO, PR-DFO, or rPR-DFO via tail vein injection every other day and monitored for 14 days for signs of acute toxicity. The body weight and organ weights of the formulation-treated mice remained within the normal range of ±15% compared to saline-treated mice even after multiple doses were administered (Figure S20A and B). Tissue samples of major organs were sectioned and stained with H&E and blindly scored by a board-certified pathologist (Figure 4). H&E analysis of tissues indicated no detectable pathological change in any of the major organs after repeated doses. Blood was also collected to assess liver and kidney function in mice through serum biochemistry assays (Figure S20C); liver function parameters included alanine aminotransferase (ALT), alkaline phosphatase (ALP), and aspartate aminotransferase (AST) levels, and kidney function parameters included blood urea nitrogen (BUN) and creatinine (CRE) levels. There was no significant functional hepatic or kidney toxicity issues associated with the administration of up to 6-dose treatments. Notably, considering the eventual elimination of rPR-DFO from the body through the urine and feces, it is reasonable to conclude that this nanochelator is unlikely to cause long-term safety concerns in mice. There were also no abnormalities from mice treated with CD-OH, PR-OH, or rPR-OH in all these assays (Figure S21).
Figure 4.

Representative H&E-stained photomicrographs (20× magnification, scale bar = 50 μm) of liver, spleen, heart, kidney, and lung of NIO mice after 6 doses of saline, DFO, CD-DFO, PR-DFO, or rPR-DFO (100 mg/kg/dose equiv DFO).
Whole-Body Iron Chelation and Elimination Studies.
Serum ferritin concentrations indirectly correlates with the body’s iron burden levels44 and is a useful parameter for quickly assessing the systemic degree of IO in mice. Two different dosing regimens were investigated and consisted of administering either 3 or 6 doses of 100 mg/kg/dose DFO, equiv CD-DFO, equiv PR-DFO, or equiv rPR-DFO every other day for 2 weeks (Figure 5A). Serum ferritin levels remained elevated in IO mice that were administered 3 or 6 doses of DFO, CD-DFO, or PR-DFO compared to saline-treated NIO mice (Figure 5B). Free DFO or CD-DFO was unable to chelate sufficient iron to reduce serum ferritin levels presumably due to its extremely short circulation time and rapid clearance from the mice. In contrast, mice displayed significantly reduced serum ferritin levels compared to saline-treated IO mice after just 3 doses of PR-DFO or rPR-DFO. However, only 6 doses of rPR-DFO effectively returned systemic serum ferritin levels back to the normal range. CD-OH, PR-DFO, and rPR-OH had no effect on ferritin level reduction as they lacked DFO for iron chelation (Figure S22A).
Figure 5.

Chelation efficacy and iron elimination in IO mice. (A) Experimental timeline. (B) Serum ferritin levels after 3 (blue) or 6 (red) doses of saline, DFO, CD-DFO, PR-DFO, or rPR-DFO at 100 mg/kg/dose equiv DFO. (C) Total iron exclusion levels in urine and feces after 6 doses of saline, DFO, CD-DFO, PR-DFO, or rPR-DFO at 100 mg/kg/dose equiv DFO. The results are presented as mean ± SD (n = 6), where “ns” means the difference was not significant, *p < 0.05, **p < 0.01, ***p < 0.001, and ****p < 0.0001.
To compare iron elimination properties, the urine and feces were collected using metabolic cages and the iron content in the samples was measured by standard atomic absorption spectroscopy (AAS). After 6 treatment doses, significant iron elimination through the urine and feces was observed for DFO, CD-DFO, PR-DFO, and rPR-DFO compared to saline-treated mice (Figure 5C). This was not readily observed with CD-OH, PR-OH, or rPR-OH treated groups (Figure S22B,C). Notably, the higher fecal iron content in mice receiving rPR-DFO compared to DFO, CD-DFO, and PR-DFO suggests a hepatobiliary route of elimination, as evidenced by the NIRF imaging which clearly demonstrated that a majority of rPR-DFO localized preferentially to the liver, and that this resulted in the effective elimination of excess iron in the feces. In addition, rPR-DFO was also significantly superior at promoting iron elimination through the urine compared to DFO, CD-DFO, and PR-DFO. The excellent iron elimination capabilities of rPR-DFO may be due to the prolonged circulation half-life of the nanochelator, which improved the chelation efficacy of NTBI in the circulation, as well as the superior renal exclusion of CD-DFO iron nanochelates following ROS-induced dissociation of rPR-DFO iron chelates.
Monitoring Iron Elimination from the Liver with Magnetic Resonance Imaging (MRI).
The liver is the primary site for iron storage, and liver iron level (LIL) is therefore a reliable indicator of the degree of IO.45 To better understand the effect of rPR-DFO on iron elimination from the liver, MRI was used to dynamically monitor LIL over the course of a 6-dose treatment regimen of saline, 100 mg/kg/dose DFO, equiv CD-DFO, equiv CD-OH, equiv PR-DFO, equiv PR-OH, equiv rPR-DFO, and equiv rPR-OH. MRI is a noninvasive imaging modality that can be used to directly monitor LIL with high sensitivity and three-dimensional coverage of the entire liver in comparison to a liver biopsy, with limited coverage.46,47 The MR signal generated by a gradient echo (GE) pulse sequence contains an exponential decay term that is dependent on the effective transverse relaxation rate (R2*).48,49 R2* depends upon two main factors: interactions between neighboring proton spins and static magnetic field inhomogeneity. Due to iron’s paramagnetic nature, its excess presence in tissue causes static magnetic field inhomogeneity, leading to larger R2* values (faster decay of the GE signal).
Measurements of liver R2* were obtained from MRI data acquired at four time points from mice being administered different treatments (Figure 6). Following the administration of Fe/dextran to mice on day 1, clear increases in R2* were observed by day 8, and these increases correlate with serum ferritin measurements that had indicated mice were IO. Slight decreases in the R2* measurements for the NIO mouse and saline-treated IO mouse, indicative of some iron elimination, were observed by day 22 compared to day 8 and day 15. However, this is likely due to mice possessing a natural mechanism for eliminating excess iron from their bodies50 as well as being fed an iron-deficient powder diet. The R2* measurements for the DFO- or CD-DFO-treated mouse decreased slightly by day 22, but still remained elevated due to the poor pharmacokinetic properties of this drug/drug conjugate. There was a minor decrease in R2* measurements in mice treated with control CD-OH, PR-OH, and rPR-OH by day 22, but this is again likely a result of the mouse’s natural ability to eliminate excess iron and is not due to any chelation properties of the nanomaterial (Figure S23). It is interesting that a slight increase in the R2* measurements was observed on day 15 for both PR-DFO and rPR-DFO compared to the other treatment groups. This suggests an increase in LIL, possibly due to the chelation of iron by PR-DFO or rPR-DFO in other tissues followed by accumulation of iron nanochelates in the liver; by day 22 however, the LIL of the same mouse treated with rPR-DFO showed a return to day 1 pre-IO baseline levels. However, the R2* measurements of the mouse treated with PR-DFO did not return to the baseline level by day 22, suggesting that iron-bound rPR-DFO was efficiently eliminated from the liver compared to PR-DFO due to the ROS-triggered dissociation of rPR-DFO. The dynamic changes in R2* can also be observed qualitatively in both the GE magnitude images and R2* maps. Higher LIL is associated with larger R2* and corresponds to a faster GE signal decay (lower GE signal intensity). A bar plot of the averages and standard deviation of the R2* measurement is presented in Figure S24. The large standard deviations observed in the R2* measurements are likely due to multiple factors including noise, blood flow, and respiration-induced motion artifacts, the quantification throughout of a large region of interest, and the heterogeneous nature of iron distribution throughout the liver.46
Figure 6.

Representative dynamic R2* distribution histograms are shown (left), as well as the corresponding gradient echo (GE) magnitude (right top), and representative R2* images (right bottom) are shown for the same mouse at each time point.
To determine whether the differences in the measurements on days 8, 15, and 22 were significantly different from the baseline measurements obtained on day 1, Glass’ Δ was used (Table S4), which is an effect size statistic that emphasizes the size of the difference between measurements while remaining independent of sample sizes.51 For the IO mice, significant differences (∣Δ∣ > 0.8) were observed on day 8 (Glass’ Δ values in the range of [−5.80 −3.23]), and only the measurements from the mouse administered rPR-DFO were no longer significantly different from the baseline measurements on day 22 (Glass’ Δ value of 0.13), showing the superior effectiveness of rPR-DFO at removing excess iron, which is consistent with the R2* measurements obtained. In addition, the livers of these mice were sectioned and analyzed by histochemistry with Perl’s Prussian Blue to identify iron deposits. Consistent with the MRI data, only mice treated with rPR-DFO displayed significantly reduced iron deposits, as evidenced by a greater reduction of blue-stained spots throughout the tissue (Figure S25).
Clinically available DFO has significant drawbacks, including administration via infusion to patients, nonspecific toxicity at elevated doses, and poor PK properties.13 To overcome these issues, several promising DFO-based nanoformulations have been investigated in the past few years. For example, it was demonstrated previously that DFO encapsulation into polymeric nanoparticles averaging 105 nm leads to preferential liver localization and results in enhanced hepatic iron elimination from mice compared to controls, therefore the liver serves as a favorable organ for rapidly screening the chelation efficacy of nanochelators.52 The conjugation of DFO to hyperbranched polyglycerol dendrimers averaging 16 nm resulted in a 484-fold (t1/2 = 44 h) increase in circulation time compared to free DFO (~5 min),15 confirming that a modest increase in the size of the nanochelator is sufficient to significantly prolong the circulation time of DFO. Our data confirm that PR-DFO and rPR-DFO (ca. 10 nm, Table S1) were both able to prolong the circulation time of DFO approximately 50-fold in NIO and IO mice compared to free DFO (Figure S18, Table S3). Although the prolonged half-life of DFO through conjugation to a macromolecule was expected, very little work has been reported in the literature on the effect of nanochelators dissociating below the renal threshold and how this property could help promote the rate of iron elimination from the body. Promoting faster elimination of nanochelates is particularly important in chelation therapy because accumulation of iron chelates in the body can lead to safety concerns in repeated dosing regimens using nanochelators.53-55
To investigate the role of nanochelator size and dissociation on total iron clearance from the body, we incorporated a thioketal linker into the design of rPR-DFO. In the presence of ROS, rPR-DFO is designed to dissociate into smaller CD-DFO constructs averaging 2 nm, a size well below the 6 nm renal threshold cutoff. As previously reported for thioketals,56 we found that dissociation of the bulky adamantane caps and release of CD-DFO from rPR-DFO occurred in a manner dependent on ROS concentration levels as well as exposure time (Figure 2). We found that this dissociation into constructs sized below the reported <6 nm renal cutoff improved total iron eliminated from the body through the renal and fecal routes compared to intact PR-DFO in spite of the two constructs possessing similar PK properties (Figure 5). This enhanced elimination feature of the dissociable nanochelator resulted in a more rapid return to normal iron levels in the liver after the same number of treatments administered compared to free DFO and PR-DFO (Figure 6). Our work demonstrates that while improving the PK of DFO can be achieved by conjugating the drug to a macromolecule above the renal threshold cutoff (>6 nm), the incorporation of a ROS-responsive element capable of causing the dissociation of the nanochelator into constructs < 6 nm can significantly impact the rate of total iron elimination from the body. This feature may be particularly advantageous for more rapidly eliminating iron chelates from the body in the context of repeated i.v. dosing regimens using macromolecules.
CONCLUSION
In summary, a polyrotaxane-based nanochelator (rPR-DFO) averaging 10 nm was evaluated for the treatment of IO. Key features of this system include the incorporation of ROS-cleavable thioketal groups between the linear PEG axles and bulky adamantane caps and the conjugation of DFO onto threaded CDs of rPR-DFO. In vitro studies revealed that the thioketal linkers cleaved at a rate dependent on both time and ROS concentration levels. Studies conducted in IO cells revealed that rPR-DFO significantly reduced in vitro ferritin expression and iron-mediated oxidative stress levels due to its ability to chelate iron in J774A.1 macrophage and HepG2 liver cells. When administered i.v. to IO mice, the dissociation of rPR-DFO (ca. 10 nm) into constructs averaging 2 nm enhanced total iron elimination compared to control PR-DFO (ca. 10 nm) in spite of both nanochelators possessing similar PK properties. The overall features of rPR-DFO as a promising system for iron chelation therapy can be attributed to a combination of the nanochelator’s improved PK, favorable distribution to the liver, and ROS-induced dissociation properties into constructs below the renal threshold cutoff (<6 nm) for more favorable elimination. Finally, this nanochelator displayed excellent biocompatibility as there were no detectable adverse effects observed in major organs analyzed. This nanochelator design may serve as a promising alternative for safely prolonging the circulation of DFO and more rapidly eliminating excess iron from the body in repeat dosing regimens.
METHODS
Synthesis of Material Precursors.
Experimental details regarding the preparation and physical characterizations of the nanochelators are provided in the Supporting Information.
Physical and Cellular Dissociation Studies.
To evaluate the ROS-triggered dissociation profiles in vitro, CD-DFO, PR-DFO, or rPR-DFO was first mixed with FeCl3 (1:1 ratio of DFO:iron(III)) and then lyophilized. Individual glass vials were filled with 1.0 mL of CD-DFO/iron(III), PR-DFO/iron(III), or rPR-DFO/iron(III) aqueous solutions (1.0 mg/mL) under various incubation conditions (0, 1, or 10 mM H2O2 plus 1.0 μM FeSO4) at 37 °C. The vials were sealed with Parafilm to avoid contamination with dust particles. At various time intervals, an aliquot of the solution (100 μL) was withdrawn and replaced with the same volume of fresh media. The sample was washed with a centrifugal filtration unit (MWCO 10 000 Da), and the filtrates were collected and monitored for the characteristic DFO:iron(III) complex absorbance peak at 430 nm. To further confirm the dissociation property, the samples were analyzed via DLS. Afterward, the reaction mixtures were freeze-dried and dissolved in 1 mL of water for analysis via a Shimazu HPLC equipped with a C18 RP-HPLC column (BDS Hypersll 250 mm × 4.6 mm) to monitor their retention time by detection at 430 nm. All samples were clarified by filtering through Millipore membranes with a 0.22 μM pore size prior to analysis by HPLC. HPLC data were analyzed with Shimadzu LCsolution HPLC postrun software. To investigate the stability of rPR-DFO under different pH conditions, rPR-DFO was incubated in 1.0 mL buffers (PBS pH 7.4, acetate buffer pH 5.0, carbonate–bicarbonate buffer pH 10.0), saline solution, or DMEM complete medium at 37 °C (1 mg/mL); samples were then analyzed by DLS after 24 and 240 h incubations.
To study the dissociation behavior in IO cells, J774A.1 macrophage cells or HepG2 cells were seeded in six-well plates at a density of 10 000 cells per well and allowed to settle for 24 h at 37 °C, 5% CO2, and 100% humidity in DMEM complete medium. Cells were then treated with varying concentration of FAC aqueous solution (0, 50, or 100 μM) for 24 h, washed with PBS, and then treated with 10 mg/mL FL-PR-DFO or FL-rPR-DFO in DMEM complete medium solutions. After a 24 h incubation period, the cells were harvested, washed twice with PBS, subjected to repeated thawing and freezing, and centrifuged at 1000g to remove cell debris. The cytoplasmic extract was collected and washed with a centrifugal filtration unit (MWCO 10 000 Da). The fluorescence in the filtrate was measured by exciting the sample at 493 nm and measuring the emission at 517 nm on a SpectraMax Gemini EM microplate reader.
Cytotoxicity Studies.
NIO J774A.1 macrophage cells or HepG2 cells were seeded in 96-well plates at a density of 10 000 cells/well, cultured at 37 °C, 5% CO2, and 100% humidity in DMEM complete medium, and allowed to settle for 24 h. Cells were then treated with 1 mM free DFO, CD-DFO, PR-DFO, rPR-DFO, or rPR-DFO at equiv DFO concentrations (prepared by 1:3 serial dilutions) for 48 h. Equivalent CD-OH, PR-OH, or rPR-OH concentrations based on w/v compared to rPR-DFO were also investigated as a control for the toxicity of the nanomaterial. The in vitro cytotoxicity was measured with the metabolism-based resazurin assay. Briefly, the substrate resazurin was dissolved in cell culture medium at a concentration of 44 μM, added to each well (100 μL), and incubated at 37 °C for 4 h before measuring the fluorescence (excitement at 560 nm, emission at 590 nm on a SpectraMax Gemini EM microplate reader). Readings from wells without cells served as Eblank, and the readings from control cells without treatment (Econtrol) represented 100% cell viability. A total of three independent experiments (n = 3) were done for each assay. Cytotoxicity was also similarly evaluated in IO cells, with the difference being that cells were IO for 24 h through the addition of culture medium containing 100 μM FAC (cells >80% viable), prior to adding formulations as described above. The viability of NIO and IO cells exposed to the various formulations was calculated using eq 1:
| (1) |
Hemolysis Studies.
RBCs were collected from female BALB/c mice. The RBC sample was washed with sterile PBS 5× by centrifugation at 5000 rpm for 5 min. The concentration of the resultant RBCs was diluted to a final concentration of 2 × 10⁷ cells/mL. Next, 100 μL of each test solution was mixed with 1 mL aliquots of RBCs to obtain varying concentrations (0.1–20 mg/mL at equiv DFO concentrations) and incubated in a humidified atmosphere containing 5% CO2 at 37 °C for 1, 4, or 12 h. At predetermined incubation times, corresponding samples were centrifuged for 5 min at 5000 rpm, and 100 μL aliquots of each supernatant was transferred to a flat-bottomed 96-well plate. Released hemoglobin due to lysis of the RBCs was monitored by measuring the absorbance at 405 nm.52 Positive and negative controls for hemolysis were RBCs lysed with 0.5% Triton X-100 and PBS, respectively. All hemolysis assays were conducted with five replicates. The hemolysis percentage was calculated using eq 2:
| (2) |
Evaluating Cellular Ferritin Expression Levels.
J774A.1 macrophage cells or HepG2 cells were seeded in six-well plates at a density of 30 000 cells/well and allowed to settle for 24 h at 37 °C, 5% CO2, and 100% humidity in DMEM complete medium. Cells were treated with 100 μM FAC for 24 h, washed with PBS, and treated with free DFO, CD-DFO, PR-DFO, or rPR-DFO at 10 equiv DFO concentrations for 48 h. At the end of the incubation period, cells were subsequently lysed with cell lysis buffer (150 mM NaCl, 10 mM Tris, 1% Triton X-100, and protease inhibitor cocktail, pH 7.4). Total protein concentration was measured with the BCA protein assay kit, and cellular ferritin concentration was measured with a mouse or human ferritin ELISA kit. The final results are plotted as the ratio of ferritin (ng)/total protein concentration (μg for J774A.1 and mg for HepG2 cells).
Evaluating Iron-Induced Cellular Oxidative Stress Levels.
The DCFDA cellular ROS detection assay kit was used to determine the capability of reducing iron-mediated oxidative stress in IO cells. Briefly, J774A.1 macrophage cells or HepG2 cells were seeded in 96-well plates at a density of 10 000 cells/well and incubated at 37 °C, 5% CO2, and 100% humidity in DMEM complete medium for 24 h. Next, cells were washed, and culture medium containing 50 or 100 μM FAC was added to the cells for 24 h to induce IO (i.e., overexpression of ferritin). Subsequently, cells were washed with PBS and treated with each test compound solution for 8 h. Afterward, DCFDA solution was added to each well at a final concentration of 20 μM for 30 min at 37 °C. Subsequently, cells were washed, and the fluorescence change was measured at the indicated times using a SpectraMax Gemini EM microplate reader by exciting the samples at 485 nm and measuring emission at 535 nm at 37 °C. NIO cells treated with DCFDA served as control blanks.
Cellular Uptake and Subcellular Localization Behavior of rPR-DFO.
J774A.1 macrophage cells or HepG2 cells were seeded in glass-bottom culture dishes (NEST Biotechnology Co., Ltd.) at a density of 10 000 cells/well and allowed to settle for 24 h at 37 °C. Next, the cell culture medium was replaced with 0 or 100 μM FAC and allowed to incubate for 24 h. Cells were then washed with PBS and returned to the incubator for an additional 48 h. Cells were washed three times with PBS and incubated with 5 mg/mL FL-CD-DFO, FL-PR-DFO, or FL-rPR-DFO in culture medium for 4 h at 37 °C. Afterward, LysoTracker Red DND-99, MitoTracker Deep Red FM, or ER-Tracker Red was added to wells at a final concentration of 1 μg/mL for 30 min at 37 °C. Subsequently, cells were washed three times with PBS and fixed with 4% paraformaldehyde (PFA) for 10 min at RT prior to imaging. The intracellular localization was observed by a Zeiss LSM 710 confocal microscope. All fluorescence images were captured via green and red channels. The Pearson’s correlation coefficient (Rr) is a standard measure for analyzing co-localization and was employed to describe the correlation of the intensity distribution of fluorescence signals, giving a value between −1.0 and 1.0. Rr was performed using ImageJ software ver. 1.52a (National Institutes of Health, Bethesda, MD, USA). Note that 1.0 indicates total positive correlation, 0 indicates no correlation, and −1.0 means total negative correlation.
Establishment of the IO Mouse Model.
All animal experiments were conducted in accordance with the University of Georgia’s IACUC guidelines and the NIH Guide for the Care and Use of Laboratory Animals. Female Balb/C mice (6 weeks old) were housed in microisolators in a room maintained at 20 ± 1 °C and with 12 h light and dark cycles. Food (Harlan Teklad 8604 rodent diet) and water were available ad libitum. IO in the mice was induced by a single tail vein injection of Fe/dextran (Anem-X 100, Aspen Veterinary Resources, Ltd.; 50 mg/kg of Fe, 10 μL/g body weight in normal saline) on day 1. The mice were monitored daily for 1 week to ensure IO levels remained constant based on serum ferritin measurements. On day 8, mice were randomly housed and started on iron-deficient powder diet (Teklad TD.80396.PWD) ad libitum. As normal controls, NIO mice were similarly handled and injected with saline instead of Fe/dextran.
Real-Time NIRF Imaging Studies.
FL-CD-DFO, FL-PR-DFO, or FL-rPR-DFO (5 mg/kg in normal saline) was administered to IO or NIO mice via tail vein. In vivo real-time NIRF images were acquired at predetermined time points on a Maestro II imaging system (PerkinElmer) using a red emission filter (670–900 nm) for up to 24 h. The mice for imaging were anesthetized with isoflurane at different time points postinjection. At the completion of the study, the mice were euthanized, and the main organs (heart, liver, spleen, kidneys, and lung) were harvested for ex vivo imaging.
PK and BD Studies.
For the PK study, NIO mice and IO mice were divided into 10 groups (3 mice/time point) corresponding to time points of 0.083, 0.5, 1, 2, 4, 8, 12, and 24 h. In general, NIO and IO mice were i.v. administered a single bolus injection of saline solution of 5 mg/kg FL-CD-DFO, PR-DFO, or rPR-DFO via tail vein. Whole blood samples for each mouse were drawn via cardiac puncture at select time points and collected into individually preweighed heparin-treated tubes for storage on ice. Plasma was separated out from the whole blood samples, and the fluorescence signal from each sample was measured. A standard curve was generated as previously reported57 by measuring the fluorescence intensity of different amounts of FL-CD-DFO, PR-DFO, or rPR-DFO added in the plasma from untreated mice. The PK profile of DFO was determined by HPLC with detection at a wavelength of 430 nm. A standard curve was prepared using a series of DFO dilutions of known concentrations. PK parameters were estimated by noncompartmental analysis with PKSolver, a Microsoft Excel add-in application.58
For the BD study, mice were injected with FL-labeled CD-DFO, PR-DFO, or rPR-DFO (5 mg/kg in normal saline) and euthanized by CO2 inhalation followed by cardiac puncture to ensure death at 12 h. At each time point, the main organs, including the heart, liver, spleen, lungs, and kidneys, were collected. The collected organs were rinsed in cold PBS and blotted with filter paper prior to weighing in preweighed vials. Rather than measuring fluorescence from intact organs, the organ homogenate was used to more precisely quantify the amount of each test compound. The homogenate solution for each organ was obtained via complete ultrasonication of tissues in saline.59 Next, the different tissue homogenates were washed and allowed to sediment by centrifugation two times. The BD was quantified based on the fluorescence signal measured from the corresponding organ homogenates.
Biocompatibility Studies.
For the MTD study, normal female Balb/c mice (6 weeks old) were randomly divided into 8 groups (6 mice/group) and administered escalating single doses of CD-DFO, PR-DFO, or rPR-DFO (50, 100, 250, and 500 mg/kg equiv DFO) or equiv CD─OH, PR─OH, or rPR─OH (w/v based on rPR-DFO) via tail-vein injections (10 μL/g). The control group was injected with the same volume of saline. Animals were monitored for 14 days for signs of acute toxicity, including body weight loss greater than 15% compared to normal saline-treated mice, changes in appetite, and behavioral changes such as altered gait and lethargy. At the end of the study, mice were euthanized by CO2 inhalation, and the main organs (lungs, heart, spleen, kidneys, and liver) were harvested, rinsed with fresh PBS, blotted dry with Whatman filter paper, and weighed (note that organ weight is reported as mg of total organ weight per g of animal body weight, mg/g). The organ samples were fixed in neutral buffered formalin and embedded in paraffin, sectioned into 5 μm slices, and stained with H&E. Optical micrographs were captured using a digital microscope camera at 20× magnification. A board-certified pathologist blindly analyzed tissues for abnormalities.
For the multiple dose study, normal female Balb/c mice (6 weeks old) were randomly divided into 3 groups (6 mice/group) and treated via tail-vein injection (10 μL/g) with multiple doses of DFO, equiv CD-DFO, PR-DFO, or rPR-DFO (100 mg/kg/dose), or equiv CD─OH, PR─OH, or rPR─OH (same concentrations as rPR-DFO based on w/v) every other day for a total of 6 doses. Animals were then monitored for 14 days after the last treatment for signs of acute toxicity by noting changes in body weight, appetite, and behavior. Blood was collected via the retro-orbital route, and functional biochemical assays were performed on the serum to evaluate kidney and liver functions. Indicators of kidney function included measuring BUN and CRE; indicators of liver function measured included ALT, ALP, and AST. Upon completion of the blood collection, mice were euthanized by CO2 overdose. Major organs (lungs, heart, spleen, kidneys, and liver) were collected and embedded and sectioned for H&E staining as described earlier. Optical micrographs were captured using a digital microscope camera at 20× magnification, and a blinded board-certified pathologist analyzed tissues for abnormalities.
Chelation Efficacy and Elimination Studies in IO Mice.
NIO and IO mice were randomly divided into 18 groups (6 mice/group) on day 8 postinjection of Fe/dextran (day 1) and administered the following treatments every other day (10 μL/g body weight): group 1-1 = NIO mice received saline for a total of 3 doses; group 1-2 = NIO mice received saline for a total of 6 doses; group 2-1 = IO mice received saline for a total of 3 doses; group 2-2 = IO mice received saline for a total of 6 doses; group 3-1 = IO mice received 100 mg/kg/dose DFO for a total of 3 doses; group 3-2 = IO mice received 100 mg/kg/dose DFO for a total of 6 doses; group 4-1 = IO mice received equiv CD-OH (based on w/v of rPR-DFO) for a total of 3 doses; group 4-2 = IO mice received equiv. CD-OH (based on w/v to rPR-DFO) for a total of 6 doses; group 5-1 = IO mice received 100 mg/kg/dose CD-DFO of equiv DFO for a total of 3 doses; group 5-2 = IO mice received 100 mg/kg/dose CD-DFO of equiv DFO for a total of 6 doses; group 6-1 = IO mice received equiv PR-OH (based on w/v of rPR-DFO) for a total of 3 doses; group 6-2 = IO mice received equiv PR-OH (based on w/v to rPR-DFO) for a total of 6 doses; group 7-1 = IO mice received 100 mg/kg/dose PR-DFO of equiv DFO for a total of 3 doses; group 7-2 = IO mice received 100 mg/kg/dose PR-DFO of equiv DFO for a total of 6 doses; group 8-1 = IO mice received equiv rPR-OH (based on w/v of rPR-DFO) for a total of 3 doses; group 8-2 = IO mice received equiv rPR-OH (based on w/v to rPR-DFO) for a total of 6 doses; group 9-1 = IO mice received 100 mg/kg/dose rPR-DFO of equiv DFO for a total of 3 doses; group 9-2 = IO mice received 100 mg/kg/dose rPR-DFO of equiv DFO for a total of 6 doses.
Mice were euthanized on day 14 or day 21 by CO2 overdose. Blood was directly collected via cardiac puncture and added to microcentrifuge tubes to isolate the serum for ferritin measurements by ELISA based on the manufacturer’s instructions. The lungs, heart, spleen, kidneys, and liver of the mice were subsequently harvested, rinsed with fresh PBS, and blotted dry with Whatman filter paper before portions of organ samples fixed in neutral buffered formalin were embedded in paraffin, sectioned into 5 μm slices, and stained with Perls’ Prussian Blue for histological analysis. A blinded board-certified pathologist analyzed the images for iron deposits in the tissue specimens collected. Optical micrographs were captured using a digital microscope camera at 20× magnification.
To quantify elimination of iron from animals, feces and urine were collected daily from metabolic chambers and weighed throughout the duration of the study. Fecal material was homogenized in distilled water, iron was extracted from the homogenate by the addition of 5% trichloroacetic acid/1.5 N HCl, and the extract was heated to 70 °C for 90 min. Final iron concentration in urine and feces was measured by standard AAS (GBC Scientific Equipment model 932AA).
Monitoring Liver Iron Levels with MRI.
Noninvasive MRI was used to directly monitor the iron level in the liver of mice. As described earlier, mice were iron overloaded on day 1. On day 8, IO mice were administered one of the following treatments every other day for a total of six doses: saline, 100 mg/kg/dose of DFO, equiv CD-DFO, equiv PR-DFO, equiv rPR-DFO, equiv CD-OH, equiv PR-OH, and equiv rPR-OH. MRI was conducted using a 7 T Magnex MRI scanner (Agilent Technologies, Santa Clara, CA, USA). The mice were scanned on day 1, day 8, day 15, and day 22 using a 3D multigradient-echo sequence (repetition time TR = 15 ms, flip angle FA = 5 degrees, initial echo time TEi = 1.7 ms, echo spacing ΔTE = 0.67 ms, 8 echoes, field of view FOV = 60 × 30 × 30 mm, a matrix size of 64 × 128 × 128, and 6 acquisitions for averaging). Spatial maps of R2* were created for each MR data set using a methodology previously described,32 and regions of interest were manually drawn covering approximately the middle third of the liver while avoiding motion artifacts due to major blood vessels and other susceptibility artifacts at the air/tissue interface.
Statistical Analysis.
Statistical analysis was performed with GraphPad Prism 5.0 software. Statistical significance between groups was assessed with one way ANOVA; p < 0.05 was considered statistically significant.
Supplementary Material
ACKNOWLEDGMENTS
We would like to thank Dr. John Shields (Georgia Electron Microscopy Laboratory, UGA) and Dr. Muthugapatti K. Kandasamy (Biomedical Microscopy Core, UGA) for their technical assistance. This work was supported by NIH grant R01DK099596 awarded to M.P.X.
Footnotes
Supporting Information
The Supporting Information is available free of charge at https://pubs.acs.org/doi/10.1021/acsnano.0c01083.
Synthesis details of formulations as well as physical, in vitro, and in vivo characterization data for controls in the form of additional figures and summary tables (PDF)
The authors declare no competing financial interest.
Contributor Information
Zhi Liu, Department of Pharmaceutical & Biomedical Sciences, College of Pharmacy, University of Georgia, Athens, Georgia 30602, United States.
Gregory A. Simchick, Bioimaging Research Center and Department of Physics and Astronomy, University of Georgia, Athens, Georgia 30602, United States
Jing Qiao, Department of Pharmaceutical & Biomedical Sciences, College of Pharmacy, University of Georgia, Athens, Georgia 30602, United States.
Morgan M. Ashcraft, Department of Pharmaceutical & Biomedical Sciences, College of Pharmacy, University of Georgia, Athens, Georgia 30602, United States
Shuolin Cui, Department of Pharmaceutical & Biomedical Sciences, College of Pharmacy, University of Georgia, Athens, Georgia 30602, United States.
Tamas Nagy, Department of Pathology, College of Veterinary Medicine, University of Georgia, Athens, Georgia 30602, United States.
Qun Zhao, Bioimaging Research Center and Department of Physics and Astronomy, University of Georgia, Athens, Georgia 30602, United States.
May P. Xiong, Department of Pharmaceutical & Biomedical Sciences, College of Pharmacy, University of Georgia, Athens, Georgia 30602, United States.
REFERENCES
- (1).Weatherall DJ; Clegg JB Thalassemia-A Global Public Health Problem. Nat. Med 1996, 2, 847–849. [DOI] [PubMed] [Google Scholar]
- (2).Weatherall DJ; Clegg JB Inherited Haemoglobin Disorders: An Increasing Global Health Problem. Bull. W. H. O 2001, 79, 704–712. [PMC free article] [PubMed] [Google Scholar]
- (3).Kato GJ; Piel FB; Reid CD; Gaston MH; Ohene-Frempong K; Krishnamurti L; Smith WR; Panepinto JA; Weatherall DJ; Costa FF; Vichinsky EP Sickle Cell Disease. Nat. Rev. Dis. Primers 2018, 4, 18010. [DOI] [PubMed] [Google Scholar]
- (4).De Domenico I; McVey Ward D; Kaplan J Regulation of Iron Acquisition and Storage: Consequences for Iron-Linked Disorders. Nat. Rev. Mol. Cell Biol 2008, 9, 72–81. [DOI] [PubMed] [Google Scholar]
- (5).Sankaran VG; Weiss MJ Anemia: Progress in Molecular Mechanisms and Therapies. Nat. Med 2015, 21, 221–230. [DOI] [PMC free article] [PubMed] [Google Scholar]
- (6).Hentze MW; Muckenthaler MU; Galy B; Camaschella C Two to Tango: Regulation of Mammalian Iron Metabolism. Cell 2010, 142, 24–38. [DOI] [PubMed] [Google Scholar]
- (7).Brissot P; Pietrangelo A; Adams PC; de Graaff B; McLaren CE; Loréal O; Haemochromatosis. Nat. Rev. Dis. Primers 2018, 4, 18016. [DOI] [PMC free article] [PubMed] [Google Scholar]
- (8).Fleming RE; Ponka P Iron Overload in Human Disease. N. Engl. J. Med 2012, 366, 348–359. [DOI] [PubMed] [Google Scholar]
- (9).Puntarulo S Iron, Oxidative Stress and Human Health. Mol. Aspects Med 2005, 26, 299–312. [DOI] [PubMed] [Google Scholar]
- (10).Dixon S; Stockwell BR The Role of Iron and Reactive Oxygen Species in Cell Death. Nat. Chem. Biol 2014, 10, 9–17. [DOI] [PubMed] [Google Scholar]
- (11).Mobarra N; Shanaki M; Ehteram H; Nasiri H; Sahmani M; Saeidi M; Goudarzi M; Pourkarim H; Azad M A Review on Iron Chelators in Treatment of Iron Overload Syndromes. Int. J. Hematol. Oncol. Stem Cell Res 2016, 10, 239–247. [PMC free article] [PubMed] [Google Scholar]
- (12).Hoffbrand AV; Taher A; Cappellini MD How I Treat Transfusional Iron Overload. Blood 2012, 120, 3657–3669. [DOI] [PubMed] [Google Scholar]
- (13).Porter JB; Faherty A; Stallibrass L; Brookman L; Hassan I; Howes C A Trial to Investigate the Relationship between DFO Pharmacokinetics and Metabolism and DFO-Related Toxicity. Ann. N. Y. Acad. Sci 1998, 850, 483–487. [DOI] [PubMed] [Google Scholar]
- (14).Liu Z; Qiao J; Nagy T; Xiong MP ROS-Triggered Degradable Iron-Chelating Nanogels: Safely Improving Iron Elimination in Vivo. J. Controlled Release 2018, 283, 84–93. [DOI] [PMC free article] [PubMed] [Google Scholar]
- (15).Imran ul-haq M; Hamilton JL; Lai BF; Shenoi RA; Horte S; Constantinescu I; Leitch HA; Kizhakkedathu JN Design of Long Circulating Nontoxic Dendritic Polymers for the Removal of Iron in Vivo. ACS Nano 2013, 7, 10704–10716. [DOI] [PubMed] [Google Scholar]
- (16).Liu Z; Lin TM; Purro M; Xiong MP Enzymatically Biodegradable Polyrotaxane-Deferoxamine Conjugates for Iron Chelation. ACS Appl. Mater. Interfaces 2016, 8, 25788–25797. [DOI] [PMC free article] [PubMed] [Google Scholar]
- (17).Wang Y; Liu Z; Lin TM; Chanana S; Xiong MP Nanogel-DFO Conjugates as a Model to Investigate Pharmacokinetics, Biodistribution, and Iron Chelation in Vivo. Int. J. Pharm 2018, 538, 79–86. [DOI] [PMC free article] [PubMed] [Google Scholar]
- (18).Theurl I; Hilgendorf I; Nairz M; Tymoszuk P; Haschka D; Asshoff M; He S; Gerhardt LM; Holderried TA; Seifert M; Sopper S; Fenn AM; Anzai A; Rattik S; McAlpine C; Theurl M; Wieghofer P; Iwamoto Y; Weber GF; Harder NK; et al. On-Demand Erythrocyte Disposal and Iron Recycling Requires Transient Macrophages in the Liver. Nat. Med 2016, 22, 945–951. [DOI] [PMC free article] [PubMed] [Google Scholar]
- (19).Longmire M; Choyke PL; Kobayashi H Clearance Properties of Nano-Sized Particles and Molecules as Imaging Agents: Considerations and Caveats. Nanomedicine 2008, 3, 703–717. [DOI] [PMC free article] [PubMed] [Google Scholar]
- (20).Wenz G; Han BH; Muller A Cyclodextrin Rotaxanes and Polyrotaxanes. Chem. Rev 2006, 106, 782–817. [DOI] [PubMed] [Google Scholar]
- (21).Ceccato M; LoNostro P; Baglioni P α-Cyclodextrin/Polyethylene Glycol Polyrotaxane: A Study of the Threading Process. Langmuir 1997, 13, 2436–2439. [Google Scholar]
- (22).Zhou Z; Mondjinou Y; Hyun SH; Kulkarni A; Lu ZR; Thompson DH Gd3+−1,4,7,10-Tetraazacyclododecane-1,4,7-triacetic-2-hydroxypropyl-β-cyclodextrin/Pluronic Polyrotaxane as a Long Circulating High Relaxivity MRI Contrast Agent. ACS Appl. Mater. Interfaces 2015, 7, 22272–22276. [DOI] [PMC free article] [PubMed] [Google Scholar]
- (23).Collins CJ; Mondjinou Y; Loren B; Torregrosa-Allen S; Simmons CJ; Elzey BD; Ayat N; Lu ZR; Thompson D Influence of Molecular Structure on the in Vivo Performance of Flexible Rod Polyrotaxanes. Biomacromolecules 2016, 17, 2777–2786. [DOI] [PMC free article] [PubMed] [Google Scholar]
- (24).Ooya T; Choi HS; Yamashita A; Yui N; Sugaya Y; Kano A; Maruyama A; Akita H; Ito R; Kogure K; Harashima H Biocleavable Polyrotaxane-Plasmid DNA Polyplex for Enhanced Gene Delivery. J. Am. Chem. Soc 2006, 128, 3852–3853. [DOI] [PubMed] [Google Scholar]
- (25).Ooya T; Yui N Synthesis and Characterization of Biodegradable Polyrotaxane as a Novel Supramolecular-Structured Drug Carrier. J. Biomater. Sci., Polym. Ed 1997, 8, 437–455. [DOI] [PubMed] [Google Scholar]
- (26).Loethen S; Ooya T; Choi HS; Yui N; Thompson DH Synthesis, Characterization, and pH-Triggered Dethreading of α-Cyclodextrin-Poly(ethylene Glycol) Polyrotaxanes Bearing Cleavable Endcaps. Biomacromolecules 2006, 79, 2501–2506. [DOI] [PubMed] [Google Scholar]
- (27).Yui N; Ooya T; Kawashima T; Saito Y; Tamai I; Sai Y; Tsuji A Inhibitory Effect of Supramolecular Polyrotaxane-Dipeptide Conjugates on Digested Peptide Uptake via Intestinal Human Peptide Transporter. Bioconjugate Chem. 2002, 13, 582–587. [DOI] [PubMed] [Google Scholar]
- (28).Tamura A; Yui N Lysosomal-Specific Cholesterol Reduction by Biocleavable Polyrotaxanes for Ameliorating Niemann-Pick Type C Disease. Sci. Rep 2015, 4, 4356. [DOI] [PMC free article] [PubMed] [Google Scholar]
- (29).Yu S; Zhang Y; Wang X; Zhen X; Zhang Z; Wu W; Jiang X Synthesis of Paclitaxel-Conjugated β-Cyclodextrin Polyrotaxane and Its Antitumor Activity. Angew. Chem., Int. Ed 2013, 52, 7272–7277. [DOI] [PubMed] [Google Scholar]
- (30).Yu S; Yuan J; Shi J; Ruan X; Wang Y; Gao S; Du Y One-Pot Synthesis of Water-Soluble, β-Cyclodextrin-Based Polyrotaxanes in a Homogeneous Water System and Its Use in Bio-Applications. J. Mater. Chem. B 2015, 3, 5277–5283. [DOI] [PubMed] [Google Scholar]
- (31).Liu Z; Purro M; Qiao J; Xiong MP Multifunctional Polymeric Micelles for Combining Chelation and Detection of Iron in Living Cells. Adv. Healthcare Mater 2017, 6, 170016. [DOI] [PMC free article] [PubMed] [Google Scholar]
- (32).Zhao TJ; Beckham HW Direct Synthesis of Cyclodextrin-Rotaxanated Poly(ethylene Glycol)s and Their Self-Diffusion Behavior in Dilute Solution. Macromolecules 2003, 36, 9859–9865. [Google Scholar]
- (33).Saravanakumar G; Kim J; Kim WJ Reactive-Oxygen-Species-Responsive Drug Delivery Systems: Promises and Challenges. Adv. Sci 2017, 4, 1600124. [DOI] [PMC free article] [PubMed] [Google Scholar]
- (34).Zhang C; Bu WB; Ni DL; Zhang SJ; Li Q; Yao ZW; Zhang JW; Yao HL; Wang Z; Shi JL Synthesis of Iron Nanometallic Glasses and Their Application in Cancer Therapy by a Localized Fenton Reaction. Angew. Chem., Int. Ed 2016, 55, 2101–2106. [DOI] [PubMed] [Google Scholar]
- (35).Hu P; Wu T; Fan W; Chen L; Liu Y; Ni D; Bu W; Shi J Near Infrared-Assisted Fenton Reaction for Tumor-Specific and Mitochondrial DNA-Targeted Photochemotherapy. Biomaterials 2017, 141, 86–95. [DOI] [PubMed] [Google Scholar]
- (36).Yin W; Ke W; Chen W; Xi L; Zhou Q; Mukerabigwi JF; Ge Z Integrated Block Copolymer Prodrug Nanoparticles for Combination of Tumor Oxidative Stress Amplification and ROS-Responsive Drug Release. Biomaterials 2019, 195, 63–74. [DOI] [PubMed] [Google Scholar]
- (37).Kalyanaraman B; Darley-Usmar V; Davies KJ; Dennery PA; Forman HJ; Grisham MB; Mann GE; Moore K; Roberts LJ II; Ischiropoulos H Measuring Reactive Oxygen and Nitrogen Species with Fluorescent Probes: Challenges and Limitations. Free Radical Biol. Med 2012, 52, 1–6. [DOI] [PMC free article] [PubMed] [Google Scholar]
- (38).Brittenham GM Iron-Chelating Therapy for Transfusional Iron Overload. N. Engl. J. Med 2011, 364, 146–156. [DOI] [PMC free article] [PubMed] [Google Scholar]
- (39).Hallaway PE; Eaton JW; Panter SS; Hedlund BE Modulation of Deferoxamine Toxicity and Clearance by Covalent Attachment to Biocompatible Polymers. Proc. Natl. Acad. Sci. U. S. A 1989, 86, 10108–10112. [DOI] [PMC free article] [PubMed] [Google Scholar]
- (40).Kurz T; Terman A; Gustafsson B; Brunk UT Lysosomes in Iron Metabolism, Ageing and Apoptosis. Histochem. Cell Biol 2008, 129, 389–406. [DOI] [PMC free article] [PubMed] [Google Scholar]
- (41).Terman A; Kurz T Lysosomal Iron, Iron Chelation, and Cell Death. Antioxid. Redox Signaling 2013, 18, 888–898. [DOI] [PubMed] [Google Scholar]
- (42).Kurz T; Eaton JW; Brunk UT The Role of Lysosomes in Iron Metabolism and Recycling. Int. J. Biochem. Cell Biol 2011, 43, 1686–1697. [DOI] [PubMed] [Google Scholar]
- (43).Esposito BP; Breuer W; Sirankapracha P; Pootrakul P; Hershko C; Cabantchik ZI Labile Plasma Iron in Iron Overload: Redox Activity and Susceptibility to Chelation. Blood 2003, 102, 2670–2677. [DOI] [PubMed] [Google Scholar]
- (44).Daru J; Colman K; Stanworth SJ; De La Salle B; Wood EM; Pasricha S R Serum Ferritin as an Indicator of Iron Status: What Do We Need to Know? Am. J. Clin. Nutr 2017, 106, 1634S–1639S. [DOI] [PMC free article] [PubMed] [Google Scholar]
- (45).Angelucci E; Brittenham GM; McLaren CE; Ripalti M; Baronciani D; Giardini C; Galimberti M; Polchi P; Lucarelli G Hepatic Iron Concentration and Total Body Iron Stores in Thalassemia Major. N. Engl. J. Med 2000, 343, 327–331. [DOI] [PubMed] [Google Scholar]
- (46).Simchick G; Liu Z; Nagy T; Xiong MP; Zhao Q Assessment of MR-Based R2* and Quantitative Susceptibility Mapping for the Quantification of Liver Iron Concentration in a Mouse Model at 7T. Magn. Reson. Med 2018, 80, 2081–2093. [DOI] [PMC free article] [PubMed] [Google Scholar]
- (47).Wood JC; Enriquez C; Ghugre N; Tyzka JM; Carson S; Nelson MD; Coates TD MRI R2 and R2* Mapping Accurately Estimates Hepatic Iron Concentration in Transfusion-Dependent Thalassemia and Sickle Cell Disease Patients. Blood 2005, 106, 1460–1465. [DOI] [PMC free article] [PubMed] [Google Scholar]
- (48).Hernando D; Levin YS; Sirlin CB; Reeder SB Quantification of Liver Iron with MRI: State of the Art and Remaining Challenges. J. Magn. Reson. Imaging 2014, 40, 1003–1021. [DOI] [PMC free article] [PubMed] [Google Scholar]
- (49).Hankins JS; McCarville MB; Loeffler RB; Smeltzer MP; Onciu M; Hoffer FA; Li CS; Wang WC; Ware RE; Hillenbrand CM R2* Magnetic Resonance Imaging of the Liver in Patients with Iron Overload. Blood 2009, 113, 4853–4855. [DOI] [PMC free article] [PubMed] [Google Scholar]
- (50).Musumeci M; Maccari S; Massimi A; Stati T; Sestili P; Corritore E; Pastorelli A; Stacchini P; Marano G; Catalano L Iron Excretion in Iron Dextran-Overloaded Mice. Blood Transfus 2014, 12, 485–490. [DOI] [PMC free article] [PubMed] [Google Scholar]
- (51).Hentschke H; Stuttgen MC Computation of Measures of Effect Size for Neuroscience Data Sets. Eur. J. Neurosci 2011, 34, 1887–1894. [DOI] [PubMed] [Google Scholar]
- (52).Guo S; Liu G; Frazer DM; Liu T; You L; Xu J; Wang Y; Anderson GJ; Nie G Polymeric Nanoparticles Enhance the Ability of Deferoxamine to Deplete Hepatic and Systemic Iron. Nano Lett. 2018, 18, 5782–5790. [DOI] [PubMed] [Google Scholar]
- (53).Kang H; Han M; Xue J; Baek Y; Chang J; Hu S; Nam H; Jo MJ; EI Fakhri G; Hutchens MP; Choi HS; Kim J Renal Clearable Nanochelators for Iron Overload Therapy. Nat. Commun 2019, 10, 5134. [DOI] [PMC free article] [PubMed] [Google Scholar]
- (54).Jones G; Goswami SK; Kang H; Choi HS; Kim J Combating Iron Overload: A Case for Deferoxamine-Based Nanochelators. Nanomedicine (London, U. K.) 2020, 15, 1341–1356. [DOI] [PMC free article] [PubMed] [Google Scholar]
- (55).Abbina S; Abbasi U; Gill A; Wong K; Kalathottukaren MT; Kizhakkedathu JN Design of Safe Nanotherapeutics for the Excretion of Excess Systemic Toxic Iron. ACS Cent. Sci 2019, 5, 917–926. [DOI] [PMC free article] [PubMed] [Google Scholar]
- (56).Ye H; Zhou Y; Liu X; Chen Y; Duan S; Zhu R; Liu Y; Yin L Recent Advances on Reactive Oxygen Species Responsive Delivery and Diagnosis System. Biomacromolecules 2019, 20, 2441. [DOI] [PubMed] [Google Scholar]
- (57).Zhu X; Xu Y; Solis LM; Tao W; Wang L; Behrens C; Xu X; Zhao L; Liu D; Wu J; Zhang N; Wistuba II; Farokhzad OC; Zetter BR; Shi J Long-Circulating siRNA Nanoparticles for Validating Prohibitin1-Targeted Non-Small Cell Lung Cancer Treatment. Proc. Natl. Acad. Sci. U. S. A 2015, 112, 7779–7784. [DOI] [PMC free article] [PubMed] [Google Scholar]
- (58).Zhang Y; Huo M; Zhou J; Xie S Pksolver: An Add-In Program for Pharmacokinetic and Pharmacodynamic Data Analysis in Microsoft Excel. Comput. Methods Programs Biomed 2010, 99, 306–314. [DOI] [PubMed] [Google Scholar]
- (59).Wan H; Yue J; Zhu S; Uno T; Zhang X; Yang Q; Yu K; Hong G; Wang J; Li L; Ma Z; Gao H; Zhong Y; Su J; Antaris AL; Xia Y; Luo J; Liang Y; Dai H A Bright Organic NIR-II Nanofluorophore for Three-Dimensional Imaging into Biological Tissues. Nat. Commun 2018, 9, 1171. [DOI] [PMC free article] [PubMed] [Google Scholar]
Associated Data
This section collects any data citations, data availability statements, or supplementary materials included in this article.