

Abstract
A fundamental question in psychotherapy is whether interventions should target client problems (i.e., problem‐focused approaches) or client strengths (i.e., strength‐focused approaches). In this study, we first propose to address this question from a network perspective on schema modes (i.e., healthy or dysfunctional patterns of co‐occurring emotions, cognitions, and behaviours). From this perspective, schema modes mutually influence each other (e.g., healthy modes reduce dysfunctional modes). Recent evidence suggests that changes in modes that are strongly associated to other modes (i.e., central modes) could be associated with greater treatment effects. We therefore suggest research should investigate the relative centrality of healthy and dysfunctional modes. To make an exploratory start, we investigated the cross‐sectional network structure of schema modes in a clinical (comprising individuals diagnosed with paranoid, narcissistic, histrionic, and Cluster C personality disorders) and non‐clinical sample. Results showed that, in both samples, the Healthy Adult was significantly less central than several dysfunctional modes (e.g., Undisciplined Child and Abandoned and Abused Child). Although our study cannot draw causal conclusions, this finding could suggest that weakening dysfunctional modes (compared to strengthening the Healthy Adult) might be more effective in decreasing other dysfunctional modes. Our study further indicates that several schema modes are negatively associated, which could suggest that decreasing one might increase another. Finally, the Healthy Adult was among the modes that most strongly discriminated between clinical and non‐clinical individuals. Longitudinal and experimental research into the network structure of schema modes is required to further clarify the relative influence of schema modes.
Keywords: Healthy Adult mode, network analysis, problem‐focused therapy, schema modes, strength‐focused therapy
Key Practitioner Message.
-
This study proposes that schema modes may form a causal network, mutually influencing each other (e.g., Lonely Child triggers Self‐Soother).
Strengthening the Healthy Adult may not strongly reduce dysfunctional modes, or vice versa.
Although Punitive Parent and Demanding Parent are often treated on a par, our results suggest they may be separate phenomena that may need to be addressed separately.
Reducing one schema mode may potentially increase other schema modes.
The Healthy Adult more strongly discriminates between the clinical and non‐clinical sample than most other schema modes.
1. INTRODUCTION
“Health is a state of complete physical, mental and social well‐being and not merely the absence of disease of infirmity” ( World Health Organization, n.d.).
The ultimate goal of psychotherapy is to promote mental health: a durable state of psychosocial well‐being (e.g., a satisfying social life) and the absence of psychopathology (e.g., symptoms; World Health Organization, n.d.). To this end, clinicians may choose to focus on reducing psychopathology (problem‐focused approach) or building psychosocial well‐being (strength‐focused approach). In recent years, the problem‐focused approach has received criticism for suboptimal therapeutic effects (Bannink, 2012, pp. 7–8; Rashid, 2015). An important concern is that clients seek not only relief from problems such as symptoms, but also wish to attain positive mental health qualities (i.e., strengths, Duckworth et al., 2005, p. 630), such as optimism (Zimmerman et al., 2006). However, as taking away problems conceivably does not automatically build strengths (Bannink, 2012, p. 13; Duckworth et al., 2005, p. 630), the problem‐focused approach might be insufficient as a toolset to achieve full mental health. To improve the efficacy of psychotherapy, clinicians and researchers in Positive Psychology have proposed clinicians should focus not only on decreasing problems but also on increasing strengths (Bannink, 2012; Keyes, 2005) and “need to recognize that much of the best work they already do […] is to amplify strengths rather than repair the weaknesses of their clients” (Seligman & Csikszentmihalyi, 2014, p. 8; Seligman, 2002). However, as little is known about how (strongly) client strengths and problems influence each other, we do not know if amplifying strengths should be expected to yield superior therapeutic results.
The present study addresses the problems vs. strengths debate from a network perspective on psychopathology. According to this perspective, mental disorders can be conceptualized as complex, dynamical systems of mutually influencing psychopathological elements (Borsboom, 2017; Guloksuz et al., 2017; Jones et al., 2017; McNally, 2016). Examples of such elements are symptoms (e.g., compulsions; Summers et al., 2020; paranoia, Jongeneel et al., 2020), behaviours (e.g., social media use; Aalbers et al., 2019), cognitive mechanisms (e.g., attentional bias; Heeren & McNally, 2016), and maladaptive personality traits (e.g., affective instability; Richetin et al., 2017). For instance, intrusive thoughts about an apartment set ablaze might trigger individuals with obsessive compulsive disorder to compulsively check their stove.
According to the network‐theoretical framework, psychopathological elements might differ in how strongly they influence other elements. For instance, in those with a substance abuse disorder, overconsuming alcohol might be more influential than a lack of self‐worth. Determining which elements are most influential is important as targeting such elements in therapy is conceivably most effective. One method to explore which elements might potentially be most influential is cross‐sectional network analysis. This statistical method has two steps. First, researchers attempt to determine complex statistical associations among individual psychopathology elements that were measured once in multiple individuals (e.g., symptoms). If two elements are statistically related, this suggests (but does not prove) they might potentially cause each other. For instance, a positive association between insomnia and fatigue indicates that individuals with insomnia also tend to be tired, which suggests (but does not prove) insomnia causes fatigue. Second, from these estimated statistical associations, researchers calculate the “centrality” of each element, reflecting how strongly each element is associated to all others.
Several studies have found that the centrality of psychopathological elements might reflect their relative influence. First, central depression symptoms (compared to peripheral symptoms) more strongly predicted depression onset (Boschloo et al., 2016). Second, changes in complicated grief (CG) symptoms with greater centrality were associated with greater changes in other CG symptoms (Robinaugh et al., 2016). These findings suggest (but do not prove) that changing central elements might be more influential than changing peripheral elements. Therefore, determining the relative centrality of problems and strengths might potentially shed a new light on the question whether psychotherapy should focus on one or the other. It should be noted that the goal of our study is not to definitively solve this issue, but rather to suggest a way forward for future research by means of a proof‐of‐concept study. For this purpose, we explore the differential centrality of problems and strengths in a network of schema modes.
Schema modes are a concept from schema therapy (Young et al., 2003), an evidence‐based treatment for personality disorders (Bamelis et al., 2014; Dickhaut & Arntz, 2014; Fassbinder et al., 2016; Giesen‐Bloo et al., 2006; Nadort et al., 2009; Reiss et al., 2014; Skewes et al., 2015). According to schema therapy theory, personality pathology is reflected in a set of schema modes, which are transient, recurring patterns of behaviour, emotion, and cognition (Sempértegui et al., 2013). Schema modes result from the combination of an (threatening) activation of a maladaptive schema and the way a person copes with this activation (van Wijk‐Herbrink et al., 2018; Young et al., 2003). Schema modes can be divided into healthy and dysfunctional schema modes. Dysfunctional modes result from dysfunctional ways of coping with an activated maladaptive schema. The Healthy Adult is an example of a healthy mode and the Undisciplined Child is an example of an unhealthy mode (Arntz & Jacob, 2012). When in the Healthy Adult mode, individuals think and feel in an adaptive way about themselves and do things that are good for them. When in the Undisciplined Child mode, individuals are not capable of completing frustrating tasks (see Appendix A for an overview of schema modes). In contemporary schema therapy schema modes are central, both in case conceptualization (problems and symptoms are understood as resulting from specific schema modes) and in choice of technique (for each schema mode a specific set of techniques is available). Moreover, schema modes help patients and therapists to understand the current state of the patient (Arntz & Jacob, 2012). In short, the aim of schema therapy is to reduce the strength of dysfunctional modes and to increase the strength of functional modes.
Schema therapy theory suggests that schema modes are interconnected as a network (i.e., dysfunctional modes reinforce one another and diminish healthy modes and vice versa; Young et al., 2003). From a network perspective, the relative centrality of dysfunctional and healthy modes could inform us about their expected influence (EI). That is, if the Healthy Adult is more central than dysfunctional modes, we might expect a greater overall reduction in dysfunctional modes when psychotherapy strengthens the Healthy Adult than when it focusses directly on individual dysfunctional modes. This could be considered as evidence in favour of employing strength‐focused approaches to weaken dysfunctional modes. If we find dysfunctional modes to be more central than the Healthy Adult, then this could be viewed as evidence in favour of using problem‐focused approaches to decrease dysfunctional modes. However, the latter could also provide support for using a strength‐focused approach to increase the Healthy Adult. Namely, if the Healthy Adult is weakly associated with dysfunctional modes, we might expect that decreasing dysfunctional modes will not lead to a strong increase in the Healthy Adult. In that case, this mode needs to be addressed separately.
To explore how the centrality of the Healthy Adult compares to that of other schema modes, we conducted network analyses on cross‐sectional data collected in a clinical (paranoid, narcissistic, histrionic, cluster C personality disorders) and non‐clinical population (Bamelis et al., 2014). Given the exploratory nature of this study, we did not have prior expectations whether groups would differ regarding the Healthy Adult's centrality. Hence, comparing groups on this aspect was not an explicit focus of this study. In addition to centrality, we exploratively investigated how individual schema modes are directly associated to each other. We finally explored whether individuals with personality disorders had different associations between schema modes than individuals without personality disorders. Revealing associations between schema modes (and how these differ between clinical and non‐clinical individuals) might help clarify the dynamic functions of schema modes in personality pathology.
2. METHODS
2.1. Dataset
We analysed an existing dataset that consisted of scores on 192 items of the Schema Mode Inventory 2 (SMI‐2), a questionnaire to assess schema modes (Bamelis et al., 2014). These items were 6‐point Likert scales (“1 = Never/rarely, 6 = Always”). An example of an SMI‐2 item is: “When I make a mistake, I can forgive myself”. The dataset included scores of 446 participants, of which 121 were healthy volunteers and 325 were diagnosed with at least one personality disorder (paranoid, narcissistic, histrionic, cluster C). The study that collected these data was approved by the medical ethical committee of Maastricht University. In the present study, we summed these item scores to obtain 18 variables, the schema modes (Appendix A). We split the data in two subsets: the first people with a personality disorder (clinical group) and the second people without a personality disorder (non‐clinical group).
2.2. Network estimation
We used the qgraph package in the statistical programming language R to estimate and visualize a Gaussian Graphical Model (GGM; for more technical details, see Appendix B). The visualization of this model consists of nodes (i.e., circles) and edges (i.e., lines). Nodes represent schema modes and edges represent regularized partial correlations between schema modes. A partial correlation is different from a correlation in that it is the correlation between two variables, conditioning (i.e., controlling for) on all other variables in the network. They therefore represent unique relationships that cannot be explained away by other variables in the model.
For instance, a negative association between Healthy Adult and Abandoned and Abused Child suggests that individuals with high scores on the Healthy Adult tend to have low scores on the Abandoned and Abused Child, taking into account their scores on all other schema modes. This association suggests a causal relationship between these modes wherein a growth of the Healthy Adult reduces the Abandoned/Abused Child, or vice versa, or both. However, it is important to note that nonzero conditional associations signal that two variables are still related even when the remaining variables are controlled for, but cannot establish why this is this is the case. For instance, apart from the existence of (possibly reciprocal) causal relations, a second possibility is that both variables are caused by a third variable that has not been measured, and a third is that the variables have a common effect, which has been conditioned on (Kruis & Maris, 2016). Thus, by themselves conditional associations are a guide to the presence of causal relations, but not necessarily to their nature. As a result, the causal interpretation of such relations is not a statistical but a substantive inferential step that has to be justified based on theoretical rationales.
Using the R package mgm (Haslbeck & Waldorp, 2018), we estimated a Mixed Graphical Model (MGM; for more technical details, see Appendix B) comprising all schema modes and a group variable (clinical vs. non‐clinical). Additionally, we entered group as a moderator variable. Like the GGM, the MGM comprises variables that are connected by partial correlations. In addition to two‐way interactions between schema modes, it contains three‐way interactions between group and pairs of schema modes (Haslbeck et al., 2019). Similarly to moderation in multiple regression, each of these three‐way interactions can be interpreted as three different moderation effects: (1) association between Schema Mode A and Schema Mode B moderated by group, (2) association between group and Schema Mode A moderated by Schema Mode B, and (3) association between group and Schema Mode B moderated by Schema Mode A (Afshartous & Preston, 2011; Aiken et al., 1991). For instance, we might find that the association between Healthy Adult and Abandoned and Abused Child is moderated by group, whereby this association is stronger in the clinical than in the non‐clinical group. This could suggest that the potential causal interaction between these modes is stronger in the clinical group than in the non‐clinical group.
2.3. Network analysis
Typically, network researchers compute centrality indices of the network structure to index the (relative) importance of single variables (Newman, 2001; Opsahl et al., 2010). In the present study, we calculated the strength centrality index as well as one‐step EI. Strength quantifies how strongly a variable is directly associated to other variables (i.e., the sum of the absolute value of edge parameters; Epskamp et al., 2017). Using the bootstrapped difference test (described in Epskamp et al., 2018), we tested if the Healthy Adult and dysfunctional modes significantly differed in strength. This test estimates a 95% confidence interval (CI) of the difference in strength between two variables in a network. If this CI does not contain 0, then we reject the null hypothesis that two variables do not differ in strength.
Additionally, we calculated EI. EI is similar to the strength centrality index, but differs in that it takes into account negative associations between variables. It is calculated by summing all associations without first taking their absolute value (for a more in‐depth explanation and validation study, see Robinaugh et al., 2016). This value can take positive and negative values, which indicate that the sum of associations between one schema mode and the others is positive or negative. As such, EI indexes how and how strongly a mode is associated to other modes.
2.4. Network stability
We used bootnet (Epskamp et al., 2018) to assess the stability of strength and a modified version of bootnet (Jones, 2018) to assess the stability of EI. Bootnet quantifies stability using the correlation stability (CS) coefficient. If the CS coefficient is very low, this means either that the network was estimated with insufficient precision or that there are no centrality differences in the first place. However, if the CS coefficient is high, this shows centrality differences exist and were reliably estimated. A simulation study suggests the CS coefficient should not be below 0.25, and preferably above 0.5, to interpret centrality differences (Epskamp et al., 2018).
3. RESULTS
3.1. Descriptive statistics
For all schema modes in the clinical and non‐clinical group, Table 1 presents independent sample t‐tests (with correction for unequal variances) comparing the group means for each schema mode. After Bonferroni correction for multiple comparisons (.05/18 schema modes = .002), the clinical and non‐clinical group differed significantly on almost every schema mode, except for the Self‐Aggrandizer. The Attention and Approval Seeker, despite being a dysfunctional mode, was significantly weaker in the clinical than in the non‐clinical group. All other differences indicated stronger dysfunctional modes in the clinical than in the non‐clinical group.
TABLE 1.
Comparison schema modes mean levels in the clinical (CG) and non‐clinical (non‐CG) group
| Schema modes | t | df | p | d [95% CI] | Mean (SD) CG | Mean (SD) non‐CG | |
| Child modes | Lonely | 22.33 | 348.73 | <.001 | 2.38 [2.12, 2.64] | 37.25 (10.71) | 18.44 (6.57) |
| Abandoned | 23.47 | 334.18 | <.001 | 2.50 [2.23, 2.77] | 40.96 (10.61) | 20.94 (6.80) | |
| Angry | 12.93 | 304.38 | <.001 | 1.38 [1.15, 1.61] | 29.83 (9.36) | 19.57 (6.59) | |
| Enraged | 4.98 | 340.95 | <.001 | 0.53 [0.32, 0.74] | 12.39 (5.31) | 10.29 (3.34) | |
| Impulsive | 6.73 | 292.68 | <.001 | 0.72 [0.50, 0.93] | 20.32 (6.88) | 16.31 (5.03) | |
| Undisciplined | 13.17 | 271.89 | <.001 | 1.40 [1.17, 1.63] | 20.47 (5.31) | 14.14 (4.17) | |
| Dependent | 16.34 | 348.41 | <.001 | 1.74 [1.50, 1.98] | 28.78 (8.85) | 17.41 (5.43) | |
| Coping modes | Compliant | 15.91 | 255.61 | <.001 | 1.69 [1.46, 1.93] | 34.41 (7.40) | 23.34 (6.17) |
| Detached protector | 18.78 | 311.06 | <.001 | 2.00 [1.75, 2.25] | 39.16 (11.06) | 21.78 (7.62) | |
| Self‐soother | 13.86 | 218.62 | <.001 | 1.48 [1.25, 1.71] | 26.68 (6.93) | 16.60 (6.80) | |
| Avoidant protector | 18.71 | 280.00 | <.001 | 1.99 [1.75, 2.24] | 37.30 (9.27) | 21.89 (7.08) | |
| Self‐aggrandizer | 2.94 | 230.34 | 0.004 | 0.31 [0.10, 0.52] | 25.39 (8.02) | 23.02 (7.44) | |
| Perfectionistic | 13.14 | 231.45 | <.001 | 1.40 [1.17, 1.63] | 37.09 (8.33) | 26.09 (7.68) | |
| Suspicious | 10.97 | 301.72 | <.001 | 1.17 [0.95, 1.39] | 29.03 (8.92) | 20.70 (6.33) | |
| Attention seeker | −3.48 | 217.72 | 0.001 | −0.37 [−0.58, −0.16] | 11.27 (4.86) | 13.06 (4.79) | |
| Parent modes | Punitive | 18.99 | 392.99 | <.001 | 2.02 [1.77, 2.27] | 31.05 (10.03) | 17.05 (5.32) |
| Demanding | 10.74 | 229.36 | <.001 | 1.14 [0.92, 1.37] | 38.36 (8.62) | 28.88 (8.03) | |
| Healthy Adult | −21.03 | 251.14 | <.001 | −2.24 [−2.50, −1.98] | 32.97 (8.21) | 49.39 (6.97) | |
3.2. Network analyses
Figure 1 visualizes how schema modes are associated in the clinical and non‐clinical group, suggesting the network structure of schema modes differs between these groups. Figure 2 visualizes the MGM (i.e., the model based on both groups' data). This figure shows that group (i.e., clinical vs non‐clinical) is directly associated to the Healthy Adult, Abandoned and Abused Child, and Punitive Parent. Results from the MGM show group is involved in three‐way interactions with the following pairs of schema modes: Lonely Child and Self‐Soother, Lonely Child and Perfectionistic Overcontroller, Angry Child and Healthy Adult, Self‐Soother and Punitive Parent, and Self‐Aggrandizer and Attention and Approval Seeker. Group moderates the association between Lonely Child and Self‐Soother, which is present in the non‐clinical group but not in the clinical group. The relationship between Lonely Child and group membership is moderated by Perfectionistic Overcontroller: if Perfectionistic Overcontroller is equal to 0, Lonely Child is not related to group membership. However, when increasing Perfectionistic Overcontroller by one unit, the influence of Lonely Child on the log potential of the clinical group increases by 0.210. In other words, the larger the values of Perfectionistic Overcontroller, the stronger the positive relationship between Lonely Child and the likelihood of being in the clinical group. In the clinical group, there is no association between Angry Child and Healthy Adult, whereas in the non‐clinical group, this association is negative. In the clinical group, there is no association between Self‐Soother and Punitive Parent. In the non‐clinical group, this association is positive. There is a positive association between Self‐Aggrandizer and Attention and Approval Seeker in the clinical group. This association is stronger in the non‐clinical group.
FIGURE 1.
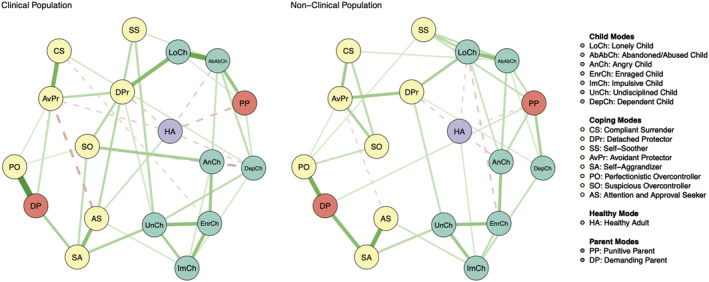
Visualization of the schema mode networks in the clinical population (left; n = 325) and non‐clinical population (right; n = 121). Circles represent different schema modes (e.g., Angry Child mode). Red circles represent dysfunctional parent modes, yellow circles represent dysfunctional coping modes, green circles represent dysfunctional child modes, and the purple circle represents the Healthy Adult mode. Green (solid) connections represent positive LASSO‐regularized partial correlations (e.g., strong Angry Child is associated with strong enraged child in both populations). Red (dotted) connections represent negative associations (e.g., strong Angry Child is associated with weak Healthy Adult in the non‐clinical population). The thickness of connections between circles corresponds to the strength of LASSO‐regularized partial correlations. To improve interpretability, we plotted only partial correlations larger than 0.1 (the Supporting Information contains network visualizations without this threshold) [Colour figure can be viewed at wileyonlinelibrary.com]
FIGURE 2.

Mixed graphical model of schema modes in the combined sample of clinical and non‐clinical individuals. Blue circles represent variables (schema modes and a group variable), grey squares represent three‐way interactions between the variables they are connected to. Green (dark solid) lines connecting the circles represent positive partial correlations. Red (dark dotted) lines represent negative partial correlations. Grey (light solid) lines represent three‐way interactions. Thicker (thinner) lines represent stronger (weaker) partial correlations [Colour figure can be viewed at wileyonlinelibrary.com]
Figures 3 and 4 show that schema modes differed in strength (CS coefficient = 0.35) and one‐step EI (CS coefficient = 0.75). That is, schema modes differed in how strongly they were associated to other schema modes. In both samples, the Healthy Adult had relatively low strength and one‐step EI (Figure 3). In the clinical group, the Healthy Adult had lower strength than the Abandoned and Abused Child, Dependent Child, Enraged Child, Undisciplined Child, Self‐Aggrandizer, Demanding Parent, and Avoidant Protector (Figure 4). In the non‐clinical group, Healthy Adult had lower strength than the Undisciplined Child, Demanding Parent, and Self‐Aggrandizer (Figure 4).
FIGURE 3.

Strength measures for the different schema modes in clinical group (left upper panel) and non‐clinical group (right upper panel), and EI indices for schema modes in the clinical group (left lower panel) and non‐clinical group (right lower panel). In the upper panel, the x axis represents z‐scores (e.g., Abandoned and Abused Child strength of 1 in the clinical network means that its strength is one SD above the mean strength of all schema modes in the clinical networks). In the lower panel, the x axis represents raw EI indices
FIGURE 4.
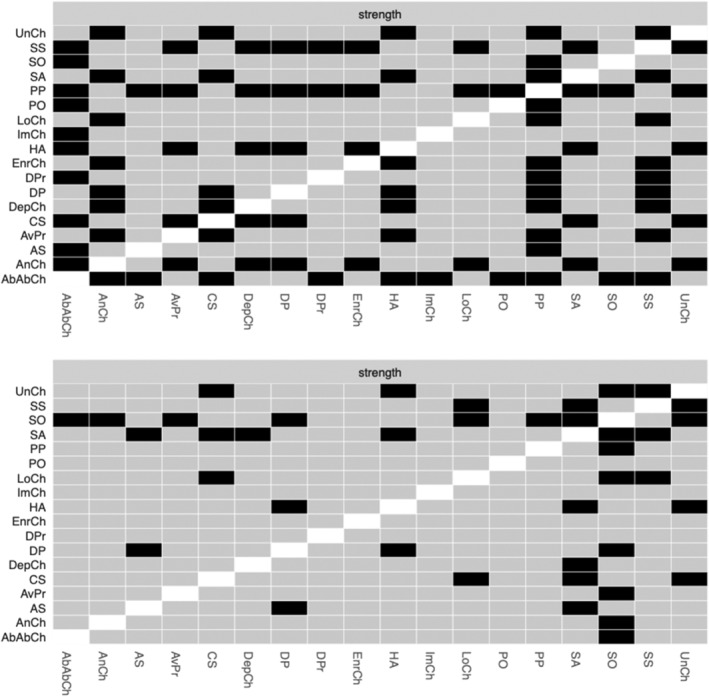
Results from the bootstrapped difference test for strength in the clinical group (upper panel) and non‐clinical group (lower panel). Black boxes indicate that the strength index of two schema modes significantly differs from one another
4. DISCUSSION
In individuals with a personality disorder (paranoid, narcissistic, histrionic, or cluster C) as well as in a non‐clinical population, we found that the Healthy Adult was significantly less central than several dysfunctional modes, such as the Abandoned and Abused Child. This finding suggests that changes in dysfunctional modes (compared to changes in the Healthy Adult) might be associated with greater changes in the overall schema mode network. Whereas our analysis does not warrant causal conclusions, its results might provide a first glimpse at the differential influence of schema modes. Assuming that differences in centrality represent differences in how individual modes affect the schema modes network as a whole, the relatively low centrality of the Healthy Adult mode might be interpreted as follows. First, an increase in the Healthy Adult might not necessarily lead to a strong reduction of dysfunctional modes. Second, decreasing dysfunctional modes may not cause a strong growth of the Healthy Adult. As recognized by other authors, specific techniques are required to directly strengthen this mode (Claassen & Pol, 2015). This interpretation of our data aligns with schema therapy protocols, in which the first part of treatment mainly focuses on decreasing dysfunctional modes and the final part on strengthening the Healthy Adult (Skewes et al., 2015; Vuijk & Arntz, 2017). Our findings warrant future research into whether and how strongly the Healthy Adult contributes to decreasing psychopathology.
The Healthy Adult was not strongly related to dysfunctional modes in the two networks, but it did strongly predict group membership (clinical vs. non‐clinical) relative to the other modes. Stated differently, although the Healthy Adult was not very informative regarding individual differences in dysfunctional modes, it was the most important mode to distinguish individuals without personality disorders from those with paranoid, narcissistic, histrionic, or cluster C personality disorders. One possible interpretation of this pattern of findings is that, although the Healthy Adult is an important variable in discriminating clinical from non‐clinical populations, it does not play an equally important role in the clinical population itself.
The network structure of schema modes might lead to important insights for schema therapy theory. First, although Punitive Parent is often considered on a par with Demanding Parent (e.g., Arntz, 2012, in van Vreeswijk et al., 2012, p. 403), these modes are not strongly associated directly and far removed from each other in both networks. This suggests that the Punitive Parent and Demanding Parent serve different dynamic functions, and that, therefore, it could be important to distinguish them in clinical practice. Second, as might be expected from schema therapy theory, Abandoned and Abused Child and Lonely Child are strongly connected (Arntz, 2012, in van Vreeswijk et al., 2012, p. 399). However, this link is weaker than the links between Detached Protector and Lonely Child and between Punitive Parent and Abandoned and Abused Child. This is a meaningful difference because it highlights that the Abandoned and Abused Child and Lonely Child, despite their strong connection, could have a different dynamic function due to their connection with other modes. Third, two internalizing child modes (i.e., Abandoned and Abused Child and Lonely Child) are not part of the same cluster as the externalizing child modes (i.e., Angry Child, Enraged Child, Undisciplined Child, Impulsive Child). However, Dependent Child (an internalizing mode) is more strongly connected to externalizing than to internalizing child modes. Potentially, Dependent Child shares features with externalizing modes or is facilitated by them. For instance, it is conceivable that a lower ability to bear negative affect (Undisciplined Child) can result in dependent behaviour, whereby negative affect is avoided by relying on others to make everyday decisions (Dependent Child). Fourth, as proposed by schema therapy theory, Demanding Parent and Perfectionistic Overcontroller are strongly connected (Arntz, 2012, in van Vreeswijk et al., 2012, p. 402). On the one hand, this association may be driven by their phenomenological similarity (e.g., perfectionistic standards vs. perfectionistic behaviour; see Appendix A). On the other hand, it is conceivable that these modes may cause each other. When someone has excessively high standards and feels shame when he does not attain them (Demanding Parent), he will be more likely to pursue his standards in an excessive manner (Perfectionistic Overcontroller). Fifth, Avoidant Protector and Compliant Surrender are strongly related. These modes are also different in their connections to other modes. Avoidant Protector is more strongly related to Detached Protector, which is not surprising because these modes share the same function (avoidance). Compliant Surrender is strongly associated to the Demanding Parent, a surprising and important finding given that, according to schema therapy theory, it is the Punitive Parent rather than the Demanding Parent that urges obedience and compliance as coping (i.e., Compliant Surrender; Arntz, 2012, in van Vreeswijk et al., 2012, p. 401).
Our analysis suggests that schema modes might have a different causal structure in individuals with personality disorders than in those without. For instance, in the latter (but not in the former), there was a positive association between Lonely Child and Self‐Soother. Possibly, individuals without personality disorders attempt to reduce the Lonely Child by adaptively soothing themselves (i.e., Self‐Soother mode), and individuals with personality disorders do not. This is a surprising finding, because Lonely Child is thought to trigger Self‐Soother in individuals with narcissistic personality disorder (Behary, 2012, in van Vreeswijk et al., 2012, pp. 82–83), who were included in our sample. The fact that our sample mainly contained individuals with other personality disorders (e.g., cluster C personality disorders, such as avoidant and obsessive–compulsive personality disorder) might be one possible explanation for this finding. Another potential explanation is that patients who engage in overcompensatory coping modes successfully block awareness of vulnerable child modes (Bamelis et al., 2011). Future research should investigate if this result can be replicated when comparing a non‐clinical group to a group of individuals with narcissistic personality disorders. The present study also found that the non‐clinical group (but not the clinical group) had positive associations between Self‐Soother and Punitive Parent, and between Self‐Aggrandizer and Attention and Approval Seeker, and a negative association between the Healthy Adult and Angry Child. Possibly, these associations represent adaptive coping behaviours. For instance, in the non‐clinical group, individuals who are strict with themselves (i.e., strong Punitive Parent) might engage in adequate self‐soothing activities to mitigate the effects of the Punitive Parent. The negative association between Healthy Adult and Angry Child in the non‐clinical group could suggest that these individuals can use the Healthy Adult to reduce the Angry Child, whereas individuals in the clinical group cannot. Moreover, present findings suggest that the larger the values of Perfectionistic Overcontroller, the stronger the positive relationship between Lonely Child and the likelihood of being in the clinical group.
A final noteworthy finding is that there are negative associations between a selection of dysfunctional schema modes (e.g., between Suspicious Overcontroller and Dependent Child), which could suggest that decreasing one mode might increase other modes. Although it is premature to draw specific causal conclusions, such associations could provide a glimpse into how psychotherapy might (temporarily) destabilize individuals with personality disorders. For instance, reducing the Suspicious Overcontroller could increase the Dependent Child (or vice versa). This finding warrants research into the effects of decreasing dysfunctional schema modes that are negatively associated to other dysfunctional schema modes. We recommend that such research use a longitudinal design to investigate if changes in one dysfunctional schema mode are negatively associated with changes in other dysfunctional schema modes.
The main limitation of the present study is its observational cross‐sectional design. As we did not experimentally manipulate schema modes in our network, we do not know if the Healthy Adult reduces dysfunctional modes, vice versa, or both, and if both, whether the Healthy Adult more strongly reduces dysfunctional modes than vice versa. A longitudinal or experimental design could provide more useful insight into whether changes in the Healthy Adult (compared to changes in dysfunctional modes) are associated with greater changes in the rest of the modes. Second, our study might have been underpowered to detect all differences between different schema modes, as the bootstrapped significance test has relatively low power to reject the null hypothesis that two variables differ in centrality indices (Epskamp et al., 2018).
All in all, the present study suggests that the Healthy Adult could be a relatively peripheral element in a network of schema modes. However, network studies on longitudinal and experimental data are required to investigate the differential influence of schema modes. Furthermore, our exploratory findings are in line with some (but not all) hypotheses from schema therapy theory. Moreover, our study suggests that two strongly connected modes (e.g., Avoidant Protector and Compliant Surrender) may serve a different dynamic function because they are connected to different modes (e.g., Avoidant Protector–Detached Protector; Compliant Surrender–Demanding Parent). Future network studies into this issue should aim to be confirmatory rather than exploratory. The findings of the present study may be used to inform potential hypotheses. Finally, our study shows that some dysfunctional modes are negatively associated, suggesting that decreasing one mode could lead to the activation of another. Potentially, network analysis could provide insight into what practitioners might expect when reducing certain schema modes and how to accordingly structure therapy. However, given the correlational nature of our study, we cannot aspire to draw any causal conclusions. Therefore, an open question for future research is: when we attempt to change one schema mode, what happens to the other schema modes? This question could be essential for practitioners interested in predicting the effects of intervening on specific schema modes. The answer to this question requires network analyses of longitudinal or experimental data (e.g., collected in a randomized controlled trial on schema therapy). From such data, we might be able to discern multiple important insights: (a) whether changes in central schema modes are associated with greater changes in other schema modes, increasing our knowledge about the potential relative importance of the Healthy Adult and specific dysfunctional modes, and (b) whether decreases in dysfunctional schema modes negatively associated with other dysfunctional schema modes are associated with increases in the latter. As such evidence could further compound evidence‐based treatment of personality disorders, we encourage researchers to continue research on the network structure of schema modes.
Supporting information
Figure S1. Visualization of the schema mode networks in the clinical population (left; n = 325) and non‐clinical population (right; n = 121). Circles represent different schema modes (e.g., Angry Child Mode). Red circles represent dysfunctional parent modes, yellow circles represent dysfunctional coping modes, green circles represent dysfunctional child modes, and the purple circle represents the Healthy Adult Mode. Green connections represent positive LASSO‐regularized partial correlations (e.g., strong Angry Child is associated with strong Enraged Child in both populations). Red connections represent negative associations (e.g., strong Angry Child is associated with weak Healthy Adult in the non‐clinical population). The thickness of connections between circles corresponds to the strength of LASSO‐regularized partial correlations.
APPENDIX A. A BRIEF DESCRIPTION OF THE SCHEMA MODES INCLUDED IN OUR ANALYSIS
| Schema mode | Description |
| Self‐aggrandizer | Believes he is superior to others and entitled to special rights. Insists he should be able to do or have what he wants, regardless of what others think. Shows off and denigrates others to augment self‐esteem. Plays superior to compensate for inner feelings of inferiority, inadequacy, or doubt. |
| Attention and approval seeker | Tries to obtain approval and attention of others by exaggerated behaviour, erotomania, or grandiosity. |
| Perfectionistic Overcontroller | Uses excessive control and perfectionism as strategy to avoid making mistakes and/or feeling guilty for things that go wrong. |
| Suspicious Overcontroller | Excessive scrutinizing control used by people with paranoid PD to cope with abundant feelings of mistrust and suspicion |
| Avoidant protector | Situational avoidance as survival strategy. Leads to loneliness, putting off decisions and important tasks, and an empty and boring life. |
| Compliant surrender | Complies with other people's wishes and suppresses own wishes as a survival strategy. This slave‐like strategy might create inner resentment. |
| Detached protector | Detaches from inner needs, emotions, and thoughts as a survival strategy. There might be interpersonal contact, but there is lack of connection. The person feels empty. |
| Self‐soother | Seeks distraction to not feel negative emotions. He achieves this by self‐soothing behaviour (e.g., sleeping or substance abuse) or by self‐stimulating activities (being fanatical or occupied with work, the internet, sport, or sex). |
| Demanding parent | Internalization of high demands by parents/caretakers about productivity, perfectionism, social status, and moral issues. Not meeting the standards leads to feeling bad and ashamed. |
| Punitive parent | Aggressive, intolerant, impatient, and unforgiving toward himself. Self‐critical and feels guilty. Ashamed of mistakes and believes he has to be punished severely for them. This mode is a reflection of what (one of) the parents or other educators used to say to the patient to belittle or punish him for expressing needs and emotions, assertiveness, and autonomy. |
| Impulsive child | Wants to satisfy his (non‐core) desires in a selfish and uncontrolled manner. Cannot control his feelings and impulses and becomes enraged and infuriated when his (non‐core) desires or impulses are not met. He often behaves like a spoiled child. |
| Undisciplined child | Has no tolerance of frustration and cannot force himself to finish routine or boring tasks. Cannot bear dissatisfaction or discomfort (pain, conflict, or overexertion) and behaves like a spoiled child. |
| Enraged child | Feels enraged for the same reason as the Angry Child, but loses control. This rage expressed in offensive and injurious actions toward people and objects, in the same way as a small child hurts his parents. |
| Angry Child | Feels intensely angry, enraged, and impatient because his core needs are not being met. Can also feel abandoned, humiliated, or betrayed. Expresses his anger in extreme manifestations, both verbal and nonverbal, just like a small child who has an outburst of anger. |
| Dependent child | State in which the person feels, thinks, and acts like a little child confronted with (practical) tasks the child does not know how to handle. |
| Abandoned/abused child | State in which the person feels the abandonment or abuse experienced as a child again, or fears repetition of such experiences. |
| Lonely child | State in which the person feels the loneliness and/or inferiority experienced as a little child. |
| Healthy Adult | State in which the person takes care of him/herself and of other people in a healthy, mature way. Good balance between own needs and those of other people. |
APPENDIX B. NETWORK ESTIMATION
First, we estimated a Graphical Gaussian Model (GGM) of schema modes in each group (Figure 1 in the article), using the graphical Least Absolute Shrinkage and Selection Operator (gLASSO) algorithm (Friedman et al., 2008) as implemented in the R‐package qgraph (Epskamp et al., 2012). The LASSO regularization parameter was selected using the EBIC (Foygel & Drton, 2010) with hyperparameter γ = 0.2. The resulting network consists of nodes and edges.
Second, we estimated a Mixed Graphical Model (MGM) of schema modes for both groups (Figure 2 in the article), using the R‐package mgm. The mgm package estimates MGMs using a nodewise LASSO regression approach, in which each node is predicted by all other nodes (and interactions between them, if specified). This approach leads to two estimates for each pairwise interaction, and three estimates for each three‐way interaction (Haslbeck et al., 2019). To combine the three estimates into a single estimate, we use the OR‐rule, which sets the final single parameter to be nonzero if at least one of the three estimates was nonzero. The OR‐rule is more liberal and has higher power than its alternative, the AND‐rule, and was therefore chosen for this exploratory analysis.
B.1. Network stability
A network with more nodes has more connections and this means that a substantial number of these connections could actually be false positives. Therefore, LASSO‐regularization shrinks the partial correlations between nodes, so that very weak partial correlations are set to 0. As a result, the false positive rate decreases. A higher tuning parameter means stricter LASSO‐regularization and results in more sparsely connected networks. Because changes in this tuning parameter may have an impact on the network structure and centrality of schema modes, we tested whether the network was stable across an increasing tuning parameter. For this purpose, we repeatedly calculated the correlation between the network with a tuning parameter of γ = 0 and an increasing tuning parameter (e.g., between parameter γ = 0 and γ = 0.01, between γ = 0 and γ = 0.02, and so on). We computed this for the adjacency matrix of the network (i.e., all the partial correlations between the schema modes), representing the overall network structure, and for centrality indices (i.e., strength and one‐step EI), representing the connectivity of specific variables. Results showed that the network structure of schema modes and the one‐step EI indices of the individual schema modes at a tuning parameter of γ = 0 correlated very strongly with those of an increasing tuning parameter until γ = 1; for strength, this correlation dropped to moderate at γ = 0.74 in the clinical group and γ = 0.96 in the non‐clinical group (Figure B1). This indicates that our results do not strongly depend on a specific parameter setting.
FIGURE B1.

Each panel depicts the correlation between the network with a tuning parameter of 0 and networks with increasing tuning parameter. The first row represents the stability of the adjacency matrix (i.e., the network structure). The second and third rows represent the stability of strength and one‐step expected influence. The left panels pertain to the clinical group, whereas the right panels pertain to the non‐clinical group
Aalbers, G. , Engels, T. , Haslbeck, J. M. B. , Borsboom, D. , & Arntz, A. (2021). The network structure of schema modes. Clinical Psychology & Psychotherapy, 28(5), 1065–1078. 10.1002/cpp.2577
DATA AVAILABILITY STATEMENT
Data available on request.
REFERENCES
- Aalbers, G. , McNally, R. J. , Heeren, A. , De Wit, S. , & Fried, E. I. (2019). Social media and depression symptoms: A network perspective. Journal of Experimental Psychology: General, 148(8), 1454–1462. 10.1037/xge0000528 [DOI] [PubMed] [Google Scholar]
- Afshartous, D. , & Preston, R. A. (2011). Key results of interaction models with centering. Journal of Statistics Education, 19(3). 10.1080/10691898.2011.11889620 [DOI] [Google Scholar]
- Aiken, L. S. , West, S. G. , & Reno, R. R. (1991). Multiple regression: Testing and interpreting interactions. Sage. [Google Scholar]
- Arntz, A. (2012). Schema therapy for cluster C personality disorders. In The Wiley‐Blackwell handbook of schema therapy: Theory, research and practice (pp. 397–414). Chichester, West Sussex: John Wiley & Sons. 10.1002/9781119962830.ch30 [DOI] [Google Scholar]
- Arntz, A. , & Jacob, G. (2012). Schema therapy in practice: An introductory guide to the schema mode approach. Chichester, West Sussex: John Wiley & Sons. [Google Scholar]
- Bamelis, L. L. M. , Evers, S. M. A. A. , Spinhoven, P. , & Arntz, A. (2014). Results of a multicentered randomised controlled trial of the clinical effectiveness of schema therapy for personality disorders. American Journal of Psychiatry, 171, 305–322. 10.1176/appi.ajp.2013.12040518 [DOI] [PubMed] [Google Scholar]
- Bamelis, L. L. M. , Renner, F. , Heidkamp, D. , & Arntz, A. (2011). Extended schema mode conceptualizations for specific personality disorders: An empirical study. Journal of Personality Disorders, 25(1), 41–58. 10.1521/pedi.2011.25.1.41 [DOI] [PubMed] [Google Scholar]
- Bannink, F. (2012). Practicing positive CBT: From reducing distress to building success. Chichester, West Sussex: John Wiley & Sons. 10.1002/9781118328941 [DOI] [Google Scholar]
- Behary, W. (2012). Schema therapy for narcissism–A case study. In van Vreeswijk, M. Broersen J., & Nadort M. (Eds.), The Wiley‐Blackwell handbook of schema therapy: Theory, research, and practice (pp. 81–90). John Wiley & Sons. [Google Scholar]
- Borsboom, D. (2017). A network theory of mental disorders. World Psychiatry, 16(1), 5–13. 10.1002/wps.20375 [DOI] [PMC free article] [PubMed] [Google Scholar]
- Boschloo, L. , van Borkulo, C. D. , Borsboom, D. , & Schoevers, R. A. (2016). A prospective study on how symptoms in a network predict the onset of depression. Psychotherapy and Psychosomatics, 85(3), 183–184. 10.1159/000442001 [DOI] [PubMed] [Google Scholar]
- Claassen, A. M. , & Pol, S. (2015). Introductie van de Schematherapie en de Gezonde Volwassene. In Schematherapie en de Gezonde Volwassene (pp. 3–15). Houten: Bohn Stafleu van Loghum. 10.1007/978-90-368-0951-1_1 [DOI] [Google Scholar]
- Dickhaut, V. , & Arntz, A. (2014). Combined group and individual schema therapy for borderline personality disorder: A pilot study. Journal of Behavior Therapy and Experimental Psychiatry, 45(2), 242–251. 10.1016/j.jbtep.2013.11.004 [DOI] [PubMed] [Google Scholar]
- Duckworth, A. , Steen, T. A. , & Seligman, M. E. (2005). Positive psychology in clinical practice. Annual Review of Clinical Psychology, 1, 629–651. 10.1146/annurev.clinpsy.1.102803.144154 [DOI] [PubMed] [Google Scholar]
- Epskamp, S. , Borsboom, D. , & Fried, E. I. (2018). Estimating psychological networks and their accuracy: A tutorial paper. Behavior Research Methods, 50, 1–18. 10.3758/s13428-017-0862-1 [DOI] [PMC free article] [PubMed] [Google Scholar]
- Epskamp, S. , Cramer, A. O. , Waldorp, L. J. , Schmittmann, V. D. , & Borsboom, D. (2012). qgraph: Network visualizations of relationships in psychometric data. Journal of Statistical Software, 48(4), 1–18. [Google Scholar]
- Epskamp, S. , Kruis, J. , & Marsman, M. (2017). Estimating psychopathological networks: Be careful what you wish for. PLoS One, 12(6), e0179891. 10.1371/journal.pone.0179891 [DOI] [PMC free article] [PubMed] [Google Scholar]
- Fassbinder, E. , Schuetze, M. , Kranich, A. , Sipos, V. , Hohagen, F. , Shaw, I. , … Schweiger, U. (2016). Feasibility of group schema therapy for outpatients with severe borderline personality disorder in Germany: A pilot study with three year follow‐up. Frontiers in Psychology, 7. 10.3389/fpsyg.2016.01851 [DOI] [PMC free article] [PubMed] [Google Scholar]
- Foygel, R. , & Drton, M. (2010). Extended Bayesian information criteria for Gaussian graphical models. In Advances in neural information processing systems (pp. 604–612). [Google Scholar]
- Friedman, J. , Hastie, T. , & Tibshirani, R. (2008). Sparse inverse covariance estimation with the graphical lasso. Biostatistics, 9(3), 432–441. 10.1093/biostatistics/kxm045 [DOI] [PMC free article] [PubMed] [Google Scholar]
- Giesen‐Bloo, J. , Van Dyck, R. , Spinhoven, P. , Van Tilburg, W. , Dirksen, C. , Van Asselt, T. , Kremers, I. , Nadort, N. , & Arntz, A. (2006). Outpatient psychotherapy for borderline personality disorder: Randomized trial of schema‐focused therapy vs transference focused psychotherapy. Archives of General Psychiatry, 63(6), 649–658.https://doi:10.1001/archpsyc.63.6.649 [DOI] [PubMed] [Google Scholar]
- Guloksuz, S. , Pries, L. K. , & van Os, J. (2017). Application of network methods for understanding mental disorders: Pitfalls and promise. Psychological Medicine, 47, 1–10.https://doi:10.1017/S0033291717001350 [DOI] [PubMed] [Google Scholar]
- Haslbeck, J. , & Waldorp, L. J. (2018). mgm: Estimating time‐varying mixed graphical models in high‐dimensional data. arXiv preprint arXiv:1510.06871 . https://arxiv.org/abs/1510.06871
- Haslbeck, J. M. , Borsboom, D. , & Waldorp, L. J. (2019). Moderated network models. Multivariate Behavioral Research, 1–32. 10.1080/00273171.2019.1677207 [DOI] [PubMed] [Google Scholar]
- Heeren, A. , & McNally, R. J. (2016). An integrative network approach to social anxiety disorder: The complex dynamic interplay among attentional bias for threat, attentional control, and symptoms. Journal of Anxiety Disorders, 42, 95–104. 10.1016/j.janxdis.2016.06.009 [DOI] [PubMed] [Google Scholar]
- Jones, P. J. (2018). Networktools: Tools for identifying important nodes in networks. R package version, 1(0), 10‐1155.
- Jones, P. J. , Heeren, A. , & McNally, R. J. (2017). Commentary: A network theory of mental disorders. Frontiers in Psychology, 8, 1305. 10.3389/fpsyg.2017.01305 [DOI] [PMC free article] [PubMed] [Google Scholar]
- Jongeneel, A. , Aalbers, G. , Bell, I. , Fried, E. I. , Delespaul, P. , Riper, H. , … Van Den Berg, D. (2020). A time‐series network approach to auditory verbal hallucinations: Examining dynamic interactions using experience sampling methodology. Schizophrenia research, 215, 148–156. 10.1016/j.schres.2019.10.055 [DOI] [PubMed] [Google Scholar]
- Keyes, C. L. (2005). Mental illness and/or mental health? Investigating axioms of the complete state model of health. Journal of Consulting and Clinical Psychology, 73(3), 539–548. https://psycnet.apa.org/doi/10.1037/0022-006X.73.3.539 [DOI] [PubMed] [Google Scholar]
- Kruis, J. , & Maris, G. (2016). Three representations of the Ising model. Scientific reports, 6, srep34175. 10.1038/srep34175 [DOI] [PMC free article] [PubMed]
- McNally, R. J. (2016). Can network analysis transform psychopathology? Behaviour Research and Therapy, 86, 95–104. 10.1016/j.brat.2016.06.006 [DOI] [PubMed] [Google Scholar]
- Nadort, M. , Arntz, A. , Smit, J. H. , Giesen‐Bloo, J. , Eikelenboom, M. , Spinhoven, P. , van Asselt, Wensing, M. , & van Dyck, R. (2009). Implementation of outpatient schema therapy for borderline personality disorder with versus without crisis support by the therapist outside office hours: A randomized trial. Behaviour Research and Therapy, 47(11), 961–973. 10.1016/j.brat.2009.07.013 [DOI] [PubMed] [Google Scholar]
- Newman, M. E. (2001). Scientific collaboration networks. II. Shortest paths, weighted networks, and centrality. Physical Review E, 64(1), 016132. 10.1103/PhysRevE.64.016132 [DOI] [PubMed] [Google Scholar]
- Opsahl, T. , Agneessens, F. , & Skvoretz, J. (2010). Node centrality in weighted networks: Generalizing degree and shortest paths. Social Networks, 32(3), 245–251. 10.1016/j.socnet.2010.03.006 [DOI] [Google Scholar]
- Rashid, T. (2015). Positive psychotherapy: A strength‐based approach. The Journal of Positive Psychology, 10(1), 25–40. 10.1080/17439760.2014.920411 [DOI] [Google Scholar]
- Reiss, N. , Lieb, K. , Arntz, A. , Shaw, I. A. , & Farrell, J. (2014). Responding to the treatment challenge of patients with severe BPD: Results of three pilot studies of inpatient schema therapy. Behavioural and Cognitive Psychotherapy, 42(3), 355–367. 10.1017/S1352465813000027 [DOI] [PubMed] [Google Scholar]
- Richetin, J. , Preti, E. , Costantini, G. , & De Panfilis, C. (2017). The centrality of affective instability and identity in borderline personality disorder: Evidence from network analysis. PLoS One, 12(10), e0186695. 10.1371/journal.pone.0186695 [DOI] [PMC free article] [PubMed] [Google Scholar]
- Robinaugh, D. J. , Millner, A. J. , & McNally, R. J. (2016). Identifying highly influential nodes in the complicated grief network. Journal of Abnormal Psychology, 125(6), 747–757. https://psycnet.apa.org/doi/10.1037/abn0000181 [DOI] [PMC free article] [PubMed] [Google Scholar]
- Seligman, M. E. (2002). Positive psychology, positive prevention, and positive therapy. Handbook of Positive Psychology, 2, 3–12. [Google Scholar]
- Seligman, M. E. , & Csikszentmihalyi, M. (2014). Positive psychology: An introduction. In Flow and the foundations of positive psychology (pp. 279–298). Netherlands: Springer. [Google Scholar]
- Sempértegui, G. A. , Karreman, A. , Arntz, A. , & Bekker, M. H. (2013). Schema therapy for borderline personality disorder: A comprehensive review of its empirical foundations, effectiveness and implementation possibilities. Clinical psychology review, 33(3), 426–447. 10.1016/j.cpr.2012.11.006 [DOI] [PubMed] [Google Scholar]
- Skewes, S. A. , Samson, R. A. , Simpson, S. G. , & van Vreeswijk, M. (2015). Short‐term group schema therapy for mixed personality disorders: A pilot study. Frontiers in Psychology, 5, 1592. 10.3389/fpsyg.2014.01592 [DOI] [PMC free article] [PubMed] [Google Scholar]
- Summers, B. J. , Aalbers, G. , Jones, P. J. , McNally, R. J. , Phillips, K. A. , & Wilhelm, S. (2020). A network perspective on body dysmorphic disorder and major depressive disorder. Journal of Affective Disorders, 262, 165–173. 10.1016/j.jad.2019.11.011 [DOI] [PMC free article] [PubMed] [Google Scholar]
- van Vreeswijk, M. , Broersen, J. , & Nadort, M. (2012). The Wiley‐Blackwell handbook of schema therapy: Theory, research, and practice. John Wiley & Sons. [Google Scholar]
- van Wijk‐Herbrink, M. F. , Bernstein, D. P. , Broers, N. J. , Roelofs, J. , Rijkeboer, M. M. , & Arntz, A. (2018). Internalizing and externalizing behaviors share a common predictor: The effects of early maladaptive schemas are mediated by coping responses and schema modes. Journal of Abnormal Child Psychology, 46(5), 907–920. 10.1007/s10802-017-0386-2 [DOI] [PMC free article] [PubMed] [Google Scholar]
- Vuijk, R. , & Arntz, A. (2017). Schema therapy as treatment for adults with autism spectrum disorder and comorbid personality disorder: Protocol of a multiple‐baseline case series study testing cognitive‐behavioral and experiential interventions. Contemporary Clinical Trials Communications, 5, 80–85. 10.1016/j.conctc.2017.01.001 [DOI] [PMC free article] [PubMed] [Google Scholar]
- World Health Organization . (n.d.). Frequently asked questions. Retrieved January 10, 2018, from http://www.who.int/suggestions/faq/en/
- Young, J. E. , Klosko, J. S. , & Weishaar, M. E. (2003). Schema therapy: A practitioner's guide. Guilford Press. [Google Scholar]
- Zimmerman, M. , McGlinchey, J. B. , Posternak, M. A. , Friedman, M. , Attiullah, N. , & Boerescu, D. (2006). How should remission from depression be defined? The depressed patient's perspective. American Journal of Psychiatry, 163(1), 148–150. 10.1176/appi.ajp.163.1.148 [DOI] [PubMed] [Google Scholar]
Associated Data
This section collects any data citations, data availability statements, or supplementary materials included in this article.
Supplementary Materials
Figure S1. Visualization of the schema mode networks in the clinical population (left; n = 325) and non‐clinical population (right; n = 121). Circles represent different schema modes (e.g., Angry Child Mode). Red circles represent dysfunctional parent modes, yellow circles represent dysfunctional coping modes, green circles represent dysfunctional child modes, and the purple circle represents the Healthy Adult Mode. Green connections represent positive LASSO‐regularized partial correlations (e.g., strong Angry Child is associated with strong Enraged Child in both populations). Red connections represent negative associations (e.g., strong Angry Child is associated with weak Healthy Adult in the non‐clinical population). The thickness of connections between circles corresponds to the strength of LASSO‐regularized partial correlations.
Data Availability Statement
Data available on request.