Abstract
The rapidly rising level of carbon dioxide in the atmosphere resulting from human activity is one of the greatest environmental problems facing our civilization today. Most technologies are not yet sufficiently developed to move existing infrastructure to cleaner alternatives. Therefore, techniques for capturing carbon dioxide from emission sources may play a key role at the moment. The structure of the UiO‐66 material not only meets the requirement of high stability in contact with water vapor but through the water pre‐adsorbed in the pores, the selectivity of carbon dioxide adsorption is increased. We successfully applied the recently developed methodology for water adsorption modelling. It allowed to elucidate the influence of water on CO2 adsorption and study the mechanism of this effect. We showed that water is adsorbed in octahedral cage and stands for promotor for CO2 adsorption in less favorable space than tetrahedral cages. Water plays a role of a mediator of adsorption, what is a general idea of improving affinity of adsorbate. On the basis of pre‐adsorption of methanol as another polar solvent, we have shown that the adsorption sites play a key role here, and not, as previously thought, only the interaction between the solvent and quadrupole carbon dioxide. Overall, we explained the mechanism of increased CO2 adsorption in the presence of water and methanol, as polar solvents, in the UiO‐66 pores for a potential post‐combustion carbon dioxide capture application.
Keywords: CO2 capture, CO2 adsorption, metal-organic frameworks, post-combustion, sustainable chemistry
MOF trap: We successfully applied a recently developed methodology for water adsorption modelling that allows to elucidate the influence of water on CO2 adsorption and study the mechanism of this effect. We show that water is adsorbed in octahedral cage and stands for promotor for CO2 adsorption in less favorable space than tetrahedral cages. We explain the mechanism of increased CO2 adsorption in the presence of water and methanol, as polar solvents, in the UiO‐66 pores for a potential post‐combustion carbon dioxide capture application.
Introduction
It comes as no surprise that one of the biggest problem in today‘s world is global warming.[ 1 , 2 ] The main source of this problem are the exhaust gases, in particular the carbon dioxide resulting from the combustion of coal. Coal‐based power is being successfully phased out in some part of Europe, e. g. in France or Germany, [3] either with the use of natural gas or renewables. Unfortunately, converting all existing infrastructure from coal‐based to cleaner alternatives is often very expensive, and because of it becomes challenging. Concerns about rising level of atmospheric carbon dioxide have led to significant interest in capture and permanent sequestration of CO2, but this is still a huge challenge. [4] So far, the use of aqueous adsorbates with amine groups is very popular for the adsorption of CO2,[ 5 , 6 , 7 , 8 ] but extending their use to industrial scale has many limitations, for example, due to the high probability of corrosion of the pipelines. These limitations have shifted the area of interest to solid materials such as metal‐organic frameworks (MOFs). Features of an ideal adsorbent for capturing CO2 from flue gas include high sorption capacity, stability under operating conditions, i.e., high temperature and humidity, as well as high selectivity towards carbon dioxide. Finding a material that meets all these assumptions is a difficult task, since many MOFs, despite their high product selectivity, are not stable in the presence of water vapor, which the exhaust gases are saturated with.[ 9 , 10 ] There are several known MOFs that are water stable, such as MIL‐100,[ 11 , 12 , 13 ] MIL‐101[ 14 , 15 ] or MIL‐53[ 16 , 17 ] but the flagship in terms of water adsorption, zirconium‐based UiO‐66, stands out.[ 18 , 19 , 20 , 21 , 22 ] Moreover, several studies have been conducted on the co‐adsorption of water and carbon dioxide in MOF materials,[ 23 , 24 , 25 , 26 ] where the pre‐adsorbed water increased the carbon dioxide adsorption capacity. Most previous works explained this fact by additional Coulomb interactions between carbon dioxide and water molecules. Research on single‐component adsorption studies of carbon dioxide in UiO‐66 has shown its selectivity[ 27 , 28 , 29 , 30 , 31 , 32 , 33 , 34 , 35 , 36 ] but so far only one study has been published on increased CO2 adsorption in the presence of water. [37] However, despite careful analysis of the impact of the defects, too little emphasis has been placed on explaining the mechanism of water adsorption to understand exactly why carbon dioxide adsorption is increased. To the best of our knowledge, so far no studies have addressed the topic of the pre‐adsorption effect of other polar solvents of similar structure and their preferential adsorption sites, for example, alcohols. Here, we focus on explaining the mechanism of enhanced adsorption of carbon dioxide in UiO‐66 material in the presence of pre adsorbed polar solvents. We preceded this research by carefully analyzing the effect of nitrogen in the exhaust gas and selecting the pressure range at which the adsorption capacity can be improved.
Results and Discussion
Pure carbon dioxide adsorption
To start working on increasing the sorption capacity of carbon dioxide in UiO‐66, one first needs to understand the mechanism of pure gas adsorption. We calculated carbon dioxide isotherm in the range 0–20 bar at 298 K. Figure 1 shows the plot of the CO2 adsorption isotherm compared with experimental isotherms and other simulated isotherms from the literature. It can be observed that, although in overall simulation results overpredict experimental data, (not only in this study but also in the other works), the agreement is good enough. The overprediction is usual when using generic force fields and can be due to many external factors, such as the synthesis method of the materials, the number of defects, the impurities present in the sample, etc. A scale factor can be used to match experiments, but as the aim of these calculations is to capture the general trend of the experiments more than accurately reproduce one of the experimental data sets, that approach is not needed for this work.
Figure 1.
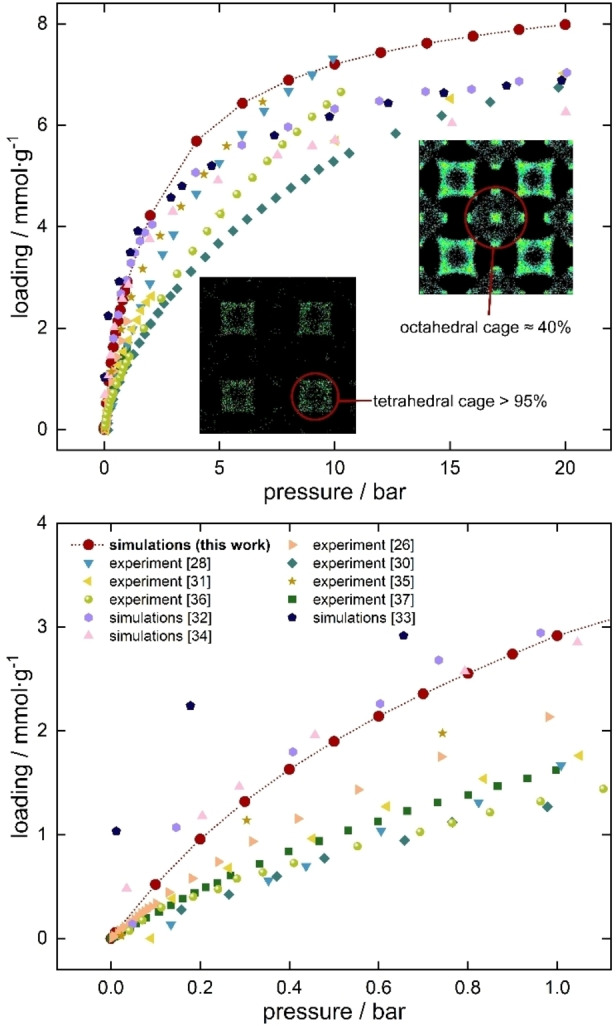
Calculated CO2 adsorption isotherm at 298 K in UiO‐66 with average occupational density profiles plotted for 1 bar and 20 bar. For comparison, experimental isotherms and other simulated results from the literature were also plotted, measured at 298 K.[ 26 , 28 , 30 , 31 , 32 , 33 , 34 , 35 , 36 , 37 ]
As can be seen in Figure 1 (top) at pressure above 1 bar, our results are closer to those from refs 28 and 35 and lead to slightly higher values than other simulation studies. However, focusing on the range 0–1 bar (Figure 1, bottom), our simulations are in line with other computational studies and provide the best agreement with experiment. In Figure 1, it is worth to note the insets representing the average occupational density profiles (AOP). It is known that UiO‐66 material contains two types of cages ‐ octahedral and tetrahedral. They differ mostly in the orientation of the terephthalic (bdc) linkers in such a way that in tetrahedral cages the organic linkers are “closer” to the inside of the pores. The two types of cages also differ in their size (tetrahedral cages ∼8 Å and octahedral cages ∼11 Å). Analyzing the AOP we can observe that carbon dioxide at pressures up to 1 bar favors filling almost only tetrahedral cages‐more than 95 % of the molecules are present there. Adsorption in octahedral cages only occurs at high pressures.
This observation may lead to conclude that the molecules of carbon dioxide perfectly fit in the corners of the tetrahedral cages but not in the octahedral cages. This is attributed to the known size entropy effect of the molecules within the pore. In other words, tetrahedral cages contain preferential adsorption sites for this gas and octahedral cages do not. This information is important for selecting the pre‐adsorbent to increase the CO2 capture capability.
Nitrogen/carbon dioxide mixture
The exhaust gases produced by combustion of coal in the air contain a relatively low content of carbon dioxide (about 20–25 %). They consist of nitrogen, as well as small amounts of water, oxygen, carbon monoxide, nitrogen oxides and sulfur oxides. [38] The gas stream is released at a total pressure up to 1 bar. Taking this into account, the next step in our research was to investigate whether the simultaneous adsorption 75 % of nitrogen and 25 % of carbon dioxide would not affect the selectivity of the UiO‐66 material to CO2 up to 1 bar. As can be seen in Figure 2, despite the higher molar fraction of nitrogen, adsorption of carbon dioxide is still predominant. We also calculated the adsorption selectivity of carbon dioxide over nitrogen from the binary mixture (CO2/N2 25 : 75). As shown in Figure 2, the adsorption selectivity does not change in the whole pressure range studied, reaching a value around 20. Stronger interactions of carbon dioxide are a consequence of its three times higher quadrupole moment than that of nitrogen. It goes in line with the computed heats of adsorption‐higher heat of CO2 adsorption in UiO‐66 reaching about 25 kJ mol−1 (Supporting Information, Figure S1), while the heat of nitrogen adsorption is about 15 kJ mol−1. The total heat of adsorption of this process increases with increasing pressure (0–1 bar) from 23 to 25 kJ⋅mol−1, which is due to the appearance of additional interactions between carbon dioxide molecules.
Figure 2.
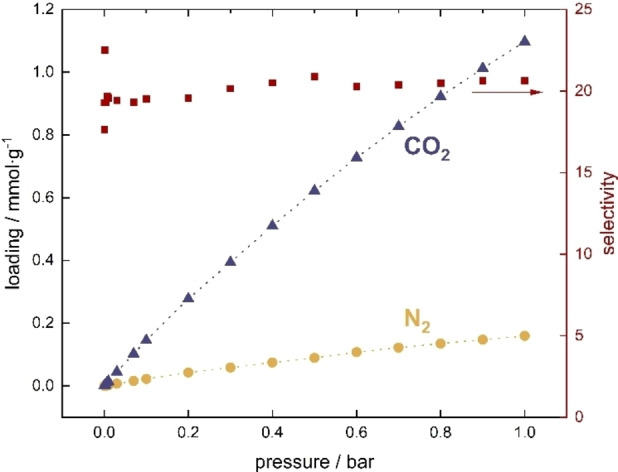
Adsorption isotherms of 0.75 molar fraction of nitrogen and of 0.25 molar fraction of carbon dioxide mixture in UiO‐66, together with CO2/N2 selectivity.
Solvent/carbon dioxide mixture
Considering that the exhaust gases are saturated with water vapor, it is necessary to determine the influence of the presence of water on the adsorption of carbon dioxide. First, however, we examined the adsorption of these two adsorbates simultaneously. As the affinity of water to UiO‐66 material is higher, its adsorption can result in preventing CO2 adsorption, by blocking adsorption space. Based on the known hydrothermal stability of the UiO‐66 MOF,[ 20 , 39 , 40 ] we simulated the co‐adsorption of increasing mole fraction (0.01, 0.025, 0.05) of water and accordingly decreasing carbon dioxide content for total pressure from 0 to 20 bar, in order to cover the full range of adsorption possibilities These amounts of water in the 0–1 bar correspond to 0–30 % RH, 0–75 % RH, and 0–150 % RH, respectively. We As expected, even a small water content in the mixture (0.01 mol fraction) results in a high water adsorption, preventing the adsorption of carbon dioxide in the structure at high pressure. Figure 3 also shows that at low pressure (from 0 to 1 bar) the increase of water in the mixture leads to a reduction of the CO2 adsorption in the framework. However, in the range down to 1 bar the simultaneous adsorption of water and carbon dioxide would be possible. Therefore, we focused on that pressure range to determine if pre‐adsorbing water in the structure will enhance the adsorption of CO2. This part of the research results in a great advantage of UiO‐66 over other materials since it turns out that it is very easy to pre‐adsorb water vapor in the pores. It is worth to emphasize that many other MOFs are known to be selective for CO2 [41] but water pre‐adsorption to increase the sorption capacity would be impossible due to their hydrophobicity, [42] contrary to UiO‐66 which hydrophobicity is not that high.
Figure 3.
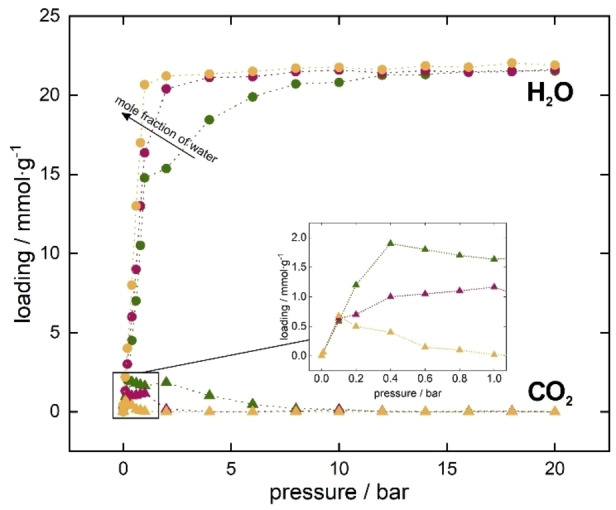
Adsorption isotherm of water (circles) and carbon dioxide (triangles) mixture in UiO‐66 from 0 to 20 bar at 298 K. Inset shows the rage from 0 to 1 bar only for carbon dioxide adsorption.
To determine what content of pre‐adsorbed water allows to increase the sorption capacity of carbon dioxide, tests were carried out with the amount from 3 to 1037 water molecules per unit cell ranging from 1 to 20 bar. The influence of presence of water on CO2 adsorption was studied in two stages. First, we carried out the adsorption of water at 298 K in the p/p0 range, which corresponds to pre‐adsorption of water (or corresponding partial pressure). This step allowed the determination of specific positions of water molecules in the unit cell at successive set pressures. Then, we performed carbon dioxide adsorption in the presence of prespecified and controlled amount of water. Figure S2 in Supporting Information shows those tests as dotted lines. The isotherm of pure CO2 is marked in gray and the cyan line refers to the adsorption of CO2 in the presence of about 100 water molecules per unit cell, i.e., about 1.8 mmol g−1. As can be seen, in the range up to 1–2 bars, difference between the value of CO2 sorption with and without H2O pre‐adsorption is positive, and from about 3–4 bar ‐ it is becoming negative. It can be observed on Figure S3 in the Supporting Information, where the difference and relative difference between carbon dioxide adsorption and carbon dioxide with pre‐adsorbed 1.8 mmol g−1 of water. A relative increase can be observed in the range of 0–4 bar, and for the low pressure range (below 0.2 bar) it reached 30 %”.
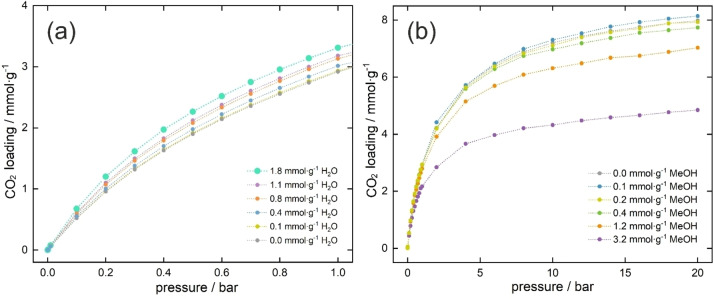
The range from 0 to 1 bar, already confirmed in previous research (Figure 4a), turned out to be optimal for obtaining enhanced CO2 adsorption capacity. The presence of 1.8 mmol g−1 water in the pores of UiO‐66 increases the adsorption by almost 20 % at 1 bar, which means that the three pre‐adsorbed water molecules per unit cell allow one extra carbon dioxide molecule to be adsorbed.
Figure 4.
a) Adsorption isotherms of carbon dioxide with 0.1 to 1.8 mmol⋅g−1 pre‐adsorbed water vapor in pores of UiO‐66 from 0 to 1 bar. b) Adsorption isotherms of carbon dioxide with different content of pre‐adsorbed methanol in pores of UiO‐66 from 0 to 20 bar.
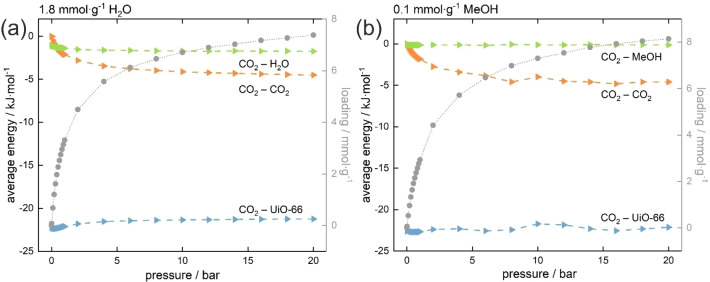
To understand the reason behind enhanced adsorption in UiO‐66, an analysis of the adsorption energy is needed. For this purpose, the contributions to the intermolecular adsorption energy‐so the guest‐host, guest‐guest and guest‐pre‐adsorbate contributions (in this case the interaction energy between carbon dioxide and UiO‐66 framework, between carbon dioxide molecules and between carbon dioxide and water molecules respectively) were calculated using Equation (1) (Figure 5):
| (1) |
Figure 5.
Guest‐guest, guest‐preads., and guest‐host adsorption energy contributions for the adsorption of CO2 with pre‐adsorbed water (a) and with pre‐adsorbed methanol (b). CO2 isotherm is added as a reference.
The most important interactions for adsorption are these between the guest molecules and the host framework. The most interesting part is the range from 0 to 1 bar (i.e., the part in which the sorption capacity increases) ‐ it can be seen that the energy of the guest‐pre‐adsorbate interaction (CO2‐H2O), is greater than the guest‐guest interaction. It can be said that the appearance of an additional stabilizing interaction with pre‐adsorbed water increases the CO2 adsorption capacity. However, the guest‐host and guest‐pre‐adsorbate energies did not change much with pressure (or loading). The radial distribution functions (RDFs) shown in Figure S4 in the Supporting Information suggest that despite the energetic conditions, at the beginning the carbon dioxide molecules accumulate at a distance of around 6 Å, and at higher pressures they approach to a distance of 4 Å. This behavior may be due to a preference for adsorption in tetrahedral cages as opposed to water which prefers to adsorb close to the metal clusters.
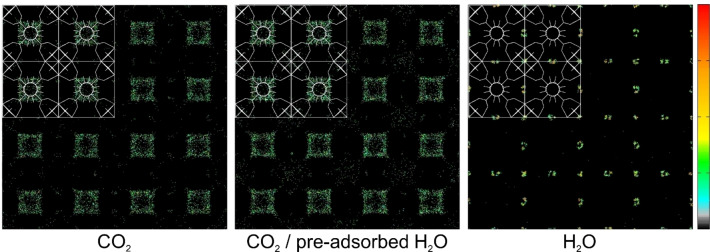
To fully understand the enhanced adsorption mechanism one can compare the average occupational density profiles (Figure 6), i.e., adsorption sites projected onto the xy plane at a pressure of 1 bar. Water molecules (right) occupy adsorption sites near zirconium clusters, so in the corners of octahedral cages. The reason why water adsorbs at the corners of octahedral cages can again be attributed to an entropy effect of the size and shape of the molecule of water. The relative orientation of the linkers creates small corners in the octahedral cages that match with the shape and size of the water molecule making them the main adsorption sites for water. After pre‐adsorption of water, carbon dioxide molecules start filling the octahedral cages even at low pressure, unlike adsorption without water vapor where the octahedral cages are almost empty. On this basis, it can be concluded that the increase in adsorption occurs as a combination of the interactions between the water dipole and the quadrupole moment of carbon dioxide and the interactions with the UiO‐66 framework. Water molecules “colonize” unfavorable adsorption sites for carbon dioxide in octahedral cages and transform them to serve as more favorable sites for carbon dioxide adsorption.
Figure 6.
Average occupational density profiles of: carbon dioxide (left), 1.8 mmol⋅g−1 of water (right) and carbon dioxide after pre‐adsorption of 1.8 mmol⋅g−1 of water (centre) at 1 bar. For better observation of the effect, water molecules were not included in the centre figure. The schemes of the structure and colour scale (representing occupancy increasing from bottom to top) are also included.
At this stage, it is important to check if other polar solvents, similar in structure to water, have the same effect on carbon dioxide adsorption. For this purpose, the first step was to calculate the co‐adsorption of 1, 2.5 and 5 mole percent of methanol and accordingly decreasing carbon dioxide content for total pressure from 0 to 20 bar (Figure 7). The observations are extremely different than those for water. Methanol does not prevent the adsorption of CO2 in the material, but it hampers it. As shown in Figure 7, only with 5 % of methanol in the mixture causes an advantage in sorption of this solvent. After this test, it can be expected that the pre‐adsorption will also take place differently.
Figure 7.
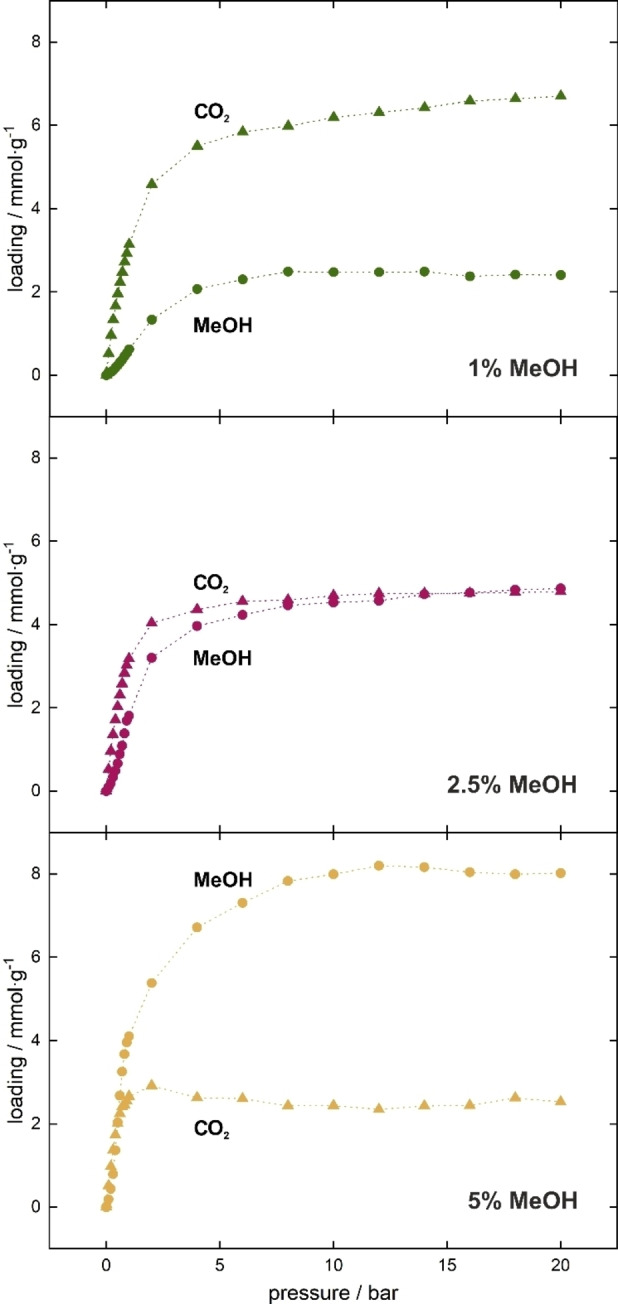
Adsorption isotherms of different molar percentage of methanol (circles) and carbon dioxide (triangles) mixtures in UiO‐66 from 0 to 20 bar at 298 K.
Next, analogous research was conducted as for the water, but with the increasing number of pre‐adsorbed methanol (Figure 4b). Unfortunately, despite the polar structure and preferred adsorption sites similar to those of water, the presence of pre‐adsorbed methanol does not increase the adsorption capacity of CO2. In fact, the effect observed is the opposite: The presence of 0.2 mmol⋅g−1 results in lowering the isotherm just from the starting point, and larger amounts reduce adsorption significantly. The only exception is the case of pre‐adsorbing 0.1 mmol g−1 methanol (which corresponds to 4 methanol molecules per unit cell) where the adsorption capacity increases by less than 5 % and only after applying high pressure.
Differences in the behavior of carbon dioxide after pre‐adsorption of water and methanol may result from differences in the adsorption sites. Similar to water, methanol adsorbs in the octahedral cages, but methanol also occupies places in tetrahedral cages, directly competing with CO2 for the adsorption in these sites and therefore reducing the sites where carbon dioxide can be adsorbed. In addition, the size of the molecules of methanol in combination with their location in the octahedral cages, do not prevent the adsorption of CO2, but do not favor its adsorption, neither. This behavior can be observed in Figure S5 in Supporting Information, where Average occupational density profiles are shown.
As with water, we also calculated the intermolecular energy contributions for pre‐adsorbed methanol (Figure 5). Similarly, the interaction between guest molecules and host framework is the greatest, however, in this case, the interaction energy between methanol and carbon dioxide is constant in practically the entire pressure range. This energy is almost zero and never is greater than the interaction CO2‐CO2, therefore the molecules of methanol are not able to act as binding sites for the molecules of carbon dioxide and the key role is played by the interaction between carbon dioxide molecules.
Conclusions
Single‐component and binary adsorption of carbon dioxide with nitrogen, water and methanol in UiO‐66 have been calculated by GCMC simulation. On the basis of nitrogen and carbon dioxide co‐adsorption studies, we determined the selectivity for the desired product. Then, based on water co‐adsorption and pre‐adsorption, it was possible to evaluate the amount of water in the pores, which increases the adsorption of CO2 by about 20 %. Based on Average occupational density profiles and contributions to intermolecular energy, it was possible to have an insight into an enhanced CO2 adsorption mechanism. We found that due to the size effect, carbon dioxide is preferentially adsorbed at the corners of the tetrahedral cages. On the other hand, water is adsorbed at the corners of the octahedral cages (although these cages are larger, their corners are sharper than those of tetrahedral cages). The population of the octahedral cages by water originates new sites that are favorable for CO2 adsorption. In this way, a combination between the dipole‐quadrupole interaction and the molecule‐framework interaction is responsible of the enhancement of CO2 adsorption when pre‐adsorbing water in the material. An attempt to extend this phenomenon to other polar molecules on the example of methanol showed that a similar structure and additional Coulomb interactions are not sufficient to achieve similar effect. In this case, although the methanol molecules allow the adsorption of carbon dioxide in the octahedral cages, this also prevents the adsorption of carbon dioxide CO2 in the tetrahedral cages. Overall effect depends on balance between these two competitive processes. To improve the carbon dioxide loading, it is crucial to turn the unfavorable space in the octahedral cages into favorable adsorption sites, which can only be achieved by pre‐adsorption of water.
Computational details
In order to describe the molecule of water we used TiP4p‐Ew model, [43] TraPPE force field [44] for methanol, for carbon dioxide the model developed by García‐Sánchez et al., [45] and for nitrogen the model from Martín‐Calvo et al. work. [46] To model the quadrupole moments of CO2 and N2 double positive charge was placed in the center of mass. [47] The calculations were performed in a 2x2x2 unit cells simulation box and the framework was modeled as rigid with applied periodic boundary conditions. [48] The pre‐adsorbed molecules of water and methanol were modeled as neutral extra‐framework molecules. The DREIDING force field [49] was used for all framework atoms, except for zirconium, where we used UFF. [50] Guest‐host interactions were calculated with the standard Lorentz‐Berthelot mixing rules (Table S1 of the Supporting Information). We used the cif file provided by Ghosh et al., [51] however, it was necessary to modify framework charges. In a previous study, we found that none of the reported works in the literature reproduced water adsorption isotherms in UiO‐66. We developed a methodology to provide a new set of charges for the framework that used in combination with UFF and DREIDING force fields, leaded to the correct representation of interactions between the framework and water molecules. [52] As the set of charges for the framework and the model of water molecule are crucial here, we used the models and charges from previous work. The cif file with modified framework charges is included in the Supporting Information. The cut‐off distance of Lennard‐Jones potential was set to 12 Å. To calculate adsorption isotherms Monte Carlo simulations in the grand‐canonical ensemble (GCMC) were used. [53] Each point on the adsorption isotherms was obtained by running 105 initialization cycles followed by 106 production cycles with equal probabilities of translation, rotation, swap and reinsertion trial moves. Adsorption selectivity CO2/NO2 was calculated by applying the following expression [Eq. 2]:
| (2) |
where q are adsorption quantities in mmol/g and x are molar fractions of components i (CO2) and j (N2). Heats of adsorption were obtained from MC simulations in the canonical ensemble using the Widom particle‐insertion method. [54] All above calculations were performed using the RASPA code.[ 55 , 56 ]
Conflict of interest
The authors declare no conflict of interest.
Supporting information
As a service to our authors and readers, this journal provides supporting information supplied by the authors. Such materials are peer reviewed and may be re‐organized for online delivery, but are not copy‐edited or typeset. Technical support issues arising from supporting information (other than missing files) should be addressed to the authors.
Supporting Information
Acknowledgements
The present study was funded by the National Science Centre Poland (grant 2018/29/B/ST4/00328) and by the Spanish Ministerio de Ciencia e Innovación (IJC2018‐038162‐I and PID2019‐111189GB−I00). We thank C3UPO for the HPC support.
G. Jajko, P. Kozyra, J. J. Gutiérrez-Sevillano, W. Makowski, S. Calero, Chem. Eur. J. 2021, 27, 14653.
Contributor Information
Dr. Paweł Kozyra, Email: kozyra@chemia.uj.edu.pl.
Dr. Juan José Gutiérrez‐Sevillano, Email: jjgutierrez@upo.es.
Prof. Sofia Calero, Email: s.calero@tue.nl.
References
- 1. Karl T. R., Trenberth K. E., Science 2003, 302, 1719–1723. [DOI] [PubMed] [Google Scholar]
- 2. Keeling C. D., Whorf T. P., Wahlen M., van der Plichtt J., Nature 1995, 375, 666–670. [Google Scholar]
- 3.IEA “World Energy Balances 2020 Edition Database Documentation”, can be found under https://www.iea.org/subscribe-to-data-services/worldenergy-balances-and-statistics, 2020.
- 4. Yazaydin A. Z., Snurr R. Q., Park T.-H., Koh K., Liu J., LeVan M. D., Benin A. I., Jakubczak P., Lanuza M., Galloway D. B., Low J. J., Willis R. R., J. Am. Chem. Soc. 2009, 131, 18198–18199. [DOI] [PubMed] [Google Scholar]
- 5. Darunte L. A., Walton K. S., Sholl D. S., Jones C. W., Curr. Opin. Chem. Eng. 2016, 12, 82–90. [Google Scholar]
- 6. Díaz E., Muñoz E., Vega A., Ordóñez S., Chemosphere 2008, 70, 1375–1382. [DOI] [PubMed] [Google Scholar]
- 7. Hao G.-P., Li W.-C., Lu A.-H., J. Mater. Chem. 2011, 21, 6447–6451. [Google Scholar]
- 8. Lu A. H., Hao G. P., Annu. Rep. Prog. Chem. Sect. A 2013, 109, 484–503. [Google Scholar]
- 9. Liu B., Vikrant K., Kim K.-H., Kumar V., Kailasa S. K., Environ. Sci.-Nano 2020, 7,1319-1347. [Google Scholar]
- 10. Han S. S., Choi S.-H., Van Duin A. C. T., Chem. Commun. 2010, 46, 5713–5715. [DOI] [PubMed] [Google Scholar]
- 11. Akiyama G., Matsuda R., Kitagawa S., Chem. Lett. 2010, 39, 360–361. [Google Scholar]
- 12. Henschel A., Senkovska I., Kaskel S., Adsorption 2011, 17, 219–226. [Google Scholar]
- 13. Jeremias F., Khutia A., Henninger S. K., Janiak C., J. Mater. Chem. 2012, 22, 10148–10151. [Google Scholar]
- 14. Ehrenmann J., Henninger S. K., Janiak C., Eur. J. Inorg. Chem. 2011, 471–474. [Google Scholar]
- 15. Ko N., Choi P. G., Hong J., Yeo M., Sung S., Cordova K. E., Park H. J., Yang J. K., Kim J., J. Mater. Chem. A 2015, 3, 2057–2064. [Google Scholar]
- 16. Liu J., Zhang F., Zou X., Yu G., Zhao N., Fan S., Zhu G., Chem. Commun. 2013, 49, 7430–7432. [DOI] [PubMed] [Google Scholar]
- 17. Sanchez-Serratos M., Bayliss P. A., Peralta R. A., González-Zamora E., Lima E., Ibarra I. A., New J. Chem. 2016, 40, 68–72. [Google Scholar]
- 18. Ma D., Han G., Peh S. B., Chen S. B., Ind. Eng. Chem. Res. 2017, 56, 12773–12782. [Google Scholar]
- 19. Buzek D., Demel J., Lang K., Inorg. Chem. 2018, 57, 14290–14297. [DOI] [PubMed] [Google Scholar]
- 20. Cavka J. H., Jakobsen S., Olsbye U., Guillou N., Lamberti C., Bordiga S., Lillerud K. P., J. Am. Chem. Soc. 2008, 130, 13850–13851. [DOI] [PubMed] [Google Scholar]
- 21. DeCoste J. B., Peterson G. W., Schindler B. J., Killops K. L., Browe M. A., Mahle J. J., J. Mater. Chem. A 2013, 1, 11922–11932. [Google Scholar]
- 22. Fang S.-Y., Zhang P., Gong J.-L., Tang L., Zeng G.-M., Song B., Cao W.-C., Li J., Ye J., Chem. Eng. J. 2020, 385, 123400. [Google Scholar]
- 23. Yazaydın A. Z., Benın A. I., Faheem S. A., Jakubczak P., Low J. J., Willis R. R., Snurr R. Q., Chem. Mater. 2009, 21, 1425–1430. [Google Scholar]
- 24. Liu J., Wang Y., Benin A. I., Jakubczak P., Willis R. R., LeVan M. D., Langmuir 2010, 26, 14301–14307. [DOI] [PubMed] [Google Scholar]
- 25. Mason J. A., McDonald T. M., Bae T.-H., Bachman J. E., Sumida K., Dutton J. J., Kaye S. S., Long J. R., J. Am. Chem. Soc. 2015, 137, 4787–4803. [DOI] [PubMed] [Google Scholar]
- 26. Liang W., Coghlan C. J., Ragon F., Rubio-Martinez M., D′Alessandro D. M., Babarao R., Dalton Trans. 2016, 45, 4496–4500. [DOI] [PubMed] [Google Scholar]
- 27. Agueda V. I., Delgado J. A., Uguina M. A., Brea P., Spjelkavik A. I., Blom R., Grande C., Chem. Eng. Sci. 2015, 124, 159–169. [Google Scholar]
- 28. Cao Y., Zhao Y., Lv Z., Song F., Zhong Q., J. Ind. Eng. Chem. 2015, 27, 102–107. [Google Scholar]
- 29. Grissom T. G., Driscoll D. M., Troya D., Sapienza N. S., Usov P. M., Morris A. J., Morris J. R., J. Phys. Chem. C 2019, 123, 13731–13738. [Google Scholar]
- 30. Cavka J. H., Grande C. A., Mondino G., Blom R., Ind. Eng. Chem. Res. 2014, 53, 15500–15507. [Google Scholar]
- 31. Cmarik G. E., Kim M., Cohen S. M., Walton K. S., Langmuir 2012, 28, 15606–15613. [DOI] [PubMed] [Google Scholar]
- 32. Jasuja H., Zang J., Sholl D. S., Walton K. S., J. Phys. Chem. C 2012, 116, 44, 23526–23532. [Google Scholar]
- 33. Wiersum A. D., Soubeyrand-Lenoir E., Yang Q., Moulin B., Guillerm V., Yahia M. B., Bourrelly S., Vimont A., Miller S., Vagner C., Daturi M., Clet G., Serre C., Maurin G., Llewellyn P. L., Chem. Asian J. 2011, 6, 3270–3280. [DOI] [PubMed] [Google Scholar]
- 34. Sladekova K., Campbell C., Grant C., Fletcher A. J., Gomes J. R. B., Jorge M., Adsorption 2020, 26, 663–685. [Google Scholar]
- 35. Pirzadeh K., Esfandiari K., Ghoreyshi A. A., Rahimnejad M., Korean J. Chem. Eng. 2020, 37, 513–524. [Google Scholar]
- 36. Edubilli S., Gumma S., Sep. Purif. Technol. 2019, 224, 85–94. [Google Scholar]
- 37. Hossain M. I., Cunningham J. D., Becker T. M., Grabicka B. E., Walton K. S., Rabideau B. D., Glover T. G., Chem. Eng. Sci. 2019, 203, 346–357. [Google Scholar]
- 38. Demessence A., D′Alessandro D. M., Foo M. L., Long J. R., J. Am. Chem. Soc. 2009, 131, 8784–8786. [DOI] [PubMed] [Google Scholar]
- 39. Shearer G. C., Chavan S., Ethiraj J., Vitillo J. G., Svelle S., Olsbye U., Lamberti C., Bordiga S., Lillerud K. P., Chem. Mater. 2014, 26, 4068–4071. [Google Scholar]
- 40. Leus K., Bogaerts T., De Decker J., Depauw H., Hendrickx K., Vrielinck H., Van Speybroeck V., Van Der Voort P., Microporous Mesoporous Mater. 2016, 226, 110–116. [Google Scholar]
- 41. Bose R., Ethiraj J., Sridhar P., Varghese J. J., Kaisare N. S., Selvam P., Adsorption 2020, 26, 1027–1038. [Google Scholar]
- 42. Ortiz A. U., Freitas A. P., Boutin A., Fuchsa A. H., Coudert F.-X., Phys. Chem. Chem. Phys. 2014, 16, 9940–9949. [DOI] [PubMed] [Google Scholar]
- 43. Horn H. W., Swope W. C., Pitera J. W., Madura J. D., Dick T. J., Hura G. L., Head-Gordon T., J. Chem. Phys. 2004, 120, 9665–9678. [DOI] [PubMed] [Google Scholar]
- 44. Chen B., Potoff J. J., Siepmann J. I., J. Phys. Chem. B 2001, 105, 3093–3104. [Google Scholar]
- 45. García-Sánchez A., Ania C. O., Parra J. B., Dubbeldam D., Vlugt T. J. H., Krishna R., Calero S., J. Phys. Chem. C 2009, 113, 8814–8820. [Google Scholar]
- 46. Martín-Calvo A., García-Pérez E., García-Sánchez A., Bueno-Pérez R., Hamad S., Calero S., Phys. Chem. Chem. Phys. 2011, 13, 11165–11174. [DOI] [PubMed] [Google Scholar]
- 47. Murthy C., Singer K., Klein M., McDonald I., Mol. Phys. 1980, 41, 1387–1399. [Google Scholar]
- 48.D. Frenkel, B. Smit, J. Tobochnik, S. R. McKay, W. Christian, Understanding Molecular Simulation, 1997.
- 49. Mayo S. L., Olafson B. D., Goddard W. A., J. Phys. Chem. 1990, 94, 8897–8909. [Google Scholar]
- 50. Rappe A. K., Casewit C. J., Colwell K. S., Goddard W. A., Ski W. M., J. Am. Chem. Soc. 1992, 114, 10024–10035. [Google Scholar]
- 51. Ghosh P., Colon Y. J., Snurr R. Q., Chem. Commun. 2014, 50, 11329–11331. [DOI] [PubMed] [Google Scholar]
- 52. Jajko G., Gutiérrez-Sevillano J. J., Sławek A., Szufla M., Kozyra P., Matoga D., Makowski W., Calero S., Microporous Mesoporous Mater. 2021, Under Review. [Google Scholar]
- 53.D. Frenkel, B. Smit, Understanding molecular simulation: From algorithms to applications,1996.
- 54. Widom B., J. Chem. Phys. 1963, 39, 2808–2812. [Google Scholar]
- 55. Dubbeldam D., Torres-Knoop A., Walton K. S., Mol. Simul. 2013, 39, 1253–1292. [Google Scholar]
- 56. Dubbeldam D., Calero S., Ellis D. E., Snurr R. Q., Mol. Simul. 2016, 42, 81–101. [Google Scholar]
Associated Data
This section collects any data citations, data availability statements, or supplementary materials included in this article.
Supplementary Materials
As a service to our authors and readers, this journal provides supporting information supplied by the authors. Such materials are peer reviewed and may be re‐organized for online delivery, but are not copy‐edited or typeset. Technical support issues arising from supporting information (other than missing files) should be addressed to the authors.
Supporting Information


