

Abstract
Objective
To explore whether magnetic resonance imaging (MRI) features suggestive of knee osteoarthritis (OA) are associated with presence of knee pain in possible early‐stage OA development.
Methods
We included 294 participants from the Osteoarthritis Initiative (mean ± SD age 50 ± 3 years; 50% women) with baseline Kellgren/Lawrence grade of 0 in both knees, all of whom had received knee MRIs at 4 different time points over 6 years (baseline, 24, 48, and 72 months). Using a linear mixed model (knees matched within individuals), we studied whether MRI features (meniscal body extrusion [in mm], cartilage area loss [score 0–39], cartilage full thickness loss [range 0–16], osteophytes [range 0–29], meniscal integrity [range 0–10], bone marrow lesions [BMLs] including bone marrow cysts [range 0–20], Hoffa‐ or effusion‐synovitis [absent/present], and popliteal cysts [absent/present]) were associated with knee‐specific pain as reported on the Knee Injury and Osteoarthritis Outcome Score (KOOS) questionnaire using a 0–100 scale (worst to best).
Results
The differences in KOOS knee pain score for a knee with a 1 unit higher score on MRI were the following: meniscal extrusion –1.52 (95% confidence interval [95% CI] –2.35, –0.69); cartilage area loss –0.23 (95% CI –0.48, 0.02); cartilage full thickness loss –1.04 (95% CI –1.58, –0.50); osteophytes –0.32 (95% CI –0.61, –0.03); meniscal integrity –0.28 (95% CI –0.58, 0.02); BMLs including potential cysts –0.19 (95% CI –0.55, 0.16); synovitis 0.23 (95% CI –1.14, 1.60); and popliteal cysts 0.86 (95% CI –0.56, 2.29).
Conclusion
Meniscal extrusion, full thickness cartilage loss, and osteophytes are associated with having more knee pain. Although these features may be relevant targets for future trials, the clinical relevance of our findings is unclear because no feature was associated with a clinically important difference in knee pain.
INTRODUCTION
Most attention in osteoarthritis (OA) research has been focused on subjects after radiographic evidence of the disease has become evident, which represents relatively late stages of the disease. Hence, significant effort has been invested in studies to determine factors relevant to OA progression and the relationship between structural features and pain (1). Much less investigated are the early preradiographic stages of the disease (1); for instance, in the knee, what determines the development of the first structural changes, knee pain, and a clinically relevant early knee OA diagnosis?
Significance & Innovations.
Magnetic resonance imaging features of meniscal extrusion, full thickness cartilage defects, and osteophytes are associated with increased knee pain when adjusted for all person‐level confounders.
The current findings shed new and important light on early disease processes in osteoarthritis, i.e., before radiographic changes are manifest.
We recently reported that the prevalence of OA based on magnetic resonance imaging (MRI) and a radiograph‐based definition (Kellgren/Lawrence [K/L] grade ≥1) of knee OA was similar after 6–8 years in a group with versus without typical OA risk factors and knee pain at baseline (2). The findings imply that incidental findings are highly frequent, and there is very limited utility of these imaging modalities in the clinical setting for OA diagnostic purposes. However, there were some interesting differences in prevalence of MRI‐based OA between groups at baseline and 1–4 years that warrant further investigations (2).
It can be hypothesized that the presence of MRI features such as meniscal integrity, meniscal body extrusion, cartilage area loss, cartilage full thickness loss, bone marrow lesions (BMLs) including bone marrow cysts (BMCs), osteophytes, effusion‐ or Hoffa‐synovitis, and popliteal cysts are associated with knee pain. Improved knowledge of any potential association of these early OA features with joint pain is relevant for improving understanding of the early pathogenesis of OA and potential suitable targets for intervention aimed at structure modification. However, knee pain is a challenging outcome to study as it is highly subjective, variable over time, and influenced by factors that are difficult to measure, such as generalized pain, psychological conditions, treatments, or coping strategies. This unique individual experience of pain may obscure potential associations between knee‐specific features and knee‐specific pain. One solution to some of these challenges is a so‐called within‐person design in which knees are matched within each individual (3).
In this study, we therefore used a sample with all knees having K/L grade 0 at baseline and aimed to explore whether the MRI features of meniscal integrity, meniscal body extrusion, cartilage area loss, cartilage full thickness loss, BMLs including BMCs, osteophytes, effusion‐ or Hoffa‐synovitis, and popliteal cysts are associated with presence of clinically relevant knee pain using a within‐person design. Under the assumption that a within‐person design can omit person‐level confounding, we hypothesized that these MRI features are causally associated with knee pain.
PATIENTS AND METHODS
We included 294 participants from the Osteoarthritis Initiative (OAI), which is a longitudinal observational study with data available for public access at http://www.oai.ucsf.edu/ (see Supplementary Appendix A, available on the Arthritis Care & Research website at http://onlinelibrary.wiley.com/doi/10.1002/acr.24394/abstract). In the current study, we included data from 4 different time points over a total of 6 years: baseline, 24, 48, and 72 months. Inclusion criteria were age between 45 and 55 years, no radiographic tibiofemoral OA of either knee at baseline (K/L grade 0 based on central readings), and not being in the “normal” control group. This resulted in 492 participants available. Furthermore, we required available MRIs at baseline, 24, 48, as well as the 72‐month follow‐up (all with complete imaging data), which resulted in 300 eligible individuals. Of those, 6 were excluded due to issues with MRI quality, resulting in our study sample of 294 participants. The participants all had at least 1–2 risk factors for knee OA, such as obesity, previous knee trauma and/or surgery, family history of total knee joint replacement, presence of Heberden’s nodes, or repetitive knee bending (≥1 risk factor if age 45–49 years, and obesity or ≥2 risk factors if age 50–55 years). Participants were allowed to have knee pain or other knee symptoms at baseline but were not required to have them. At baseline, 28 participants (10%) had reported an affirmative response to the question, “Doctor said you had osteoarthritis/degenerative arthritis in knee.”
The OAI has been approved by the institutional review boards for the University of California, San Francisco and the 4 clinical centers (University of Pittsburgh, Ohio State University, University of Maryland, Baltimore, and Memorial Hospital of Rhode Island) (approval number 10‐00532). All participants gave informed consent to participate in the study. Patients or the public were not involved in the design or conduct of this study.
Outcome variable
We studied knee pain for the right and left knee as reported on the Knee Injury and Osteoarthritis Outcomes Score (KOOS) questionnaire (4). The pain domain in the KOOS questionnaire assesses the frequency and severity of knee pain during rest and different activities such as bending and straightening the knee. The sum score of 100 represents no knee pain, and 0 represents the most severe knee pain. We also studied tenderness upon palpation of the medial and lateral tibiofemoral (TF) joint line as well as pain upon patellar grind of the patellofemoral (PF) joint.
MRI protocol, MRI readings, and definitions of MRI exposure variables
MRI scans were obtained for the left and right knee for each OAI visit (baseline, 24, 48, and 72 months) using Trio 3.0T MRI scanners (Siemens) and quadrature transmit–receive extremity radiofrequency coils. All images were read paired with knowledge of time sequence by 1 radiologist (JK) according to the MRI OA Knee Score (MOAKS) scoring system apart from meniscal integrity, for which a more detailed tear categorization was performed (5). Meniscal body extrusion was measured on a continuous scale in millimeters by another observer, an orthopedic surgeon (FZ). The readers were blinded to clinical data, and 30 randomly selected participants’ knees were reassessed with intraobserver reliability, as reported previously (6, 7). The MOAKS features of area of cartilage damage (%), full thickness cartilage damage (%), BMLs/BMCs (% volume in subregion), osteophytes, effusion‐synovitis, Hoffa‐synovitis, and popliteal cysts were scored for the different subregions in the articular TF and PF compartments (5). These grades were subsequently summed over subregions to form a feature‐specific indicator independent of site. Thus, for our analyses, area of cartilage area loss and full thickness loss were each based on a sum of grade 0–3 in 14 subregions (analysis scales 0–42) BMLs/BMCs (analysis scale 0–45) were sums of grades 0–3 in 15 subregions, osteophytes (analysis scale 0–36) was a sum of grades 0–3 in 12 subregions. Effusion‐synovitis and Hoffa‐synovitis were combined into 1 variable and dichotomized. Unfortunately, the distribution of the former (Hoffa‐ and effusion‐synovitis) did not enable fitting a between–within model with this exposure as an ordinal variable. Popliteal cysts were also dichotomized into present (grade ≥1) or absent (grade 0). Our semiquantitative meniscal scoring (more detailed than MOAKS) included both intrameniscal signal (grade 0–3), type of meniscal tear (longitudinal, horizontal, oblique/parrot beak, complex, radial, root tear) and its extent (grade 0–3), respectively, as well as destruction, maceration, or prior resection (grade 0–3) in each of the 3 subregions (anterior horn, body, posterior horn) of each meniscus. We then constructed a 6‐item (range 0–5) ordered categorical variable for each meniscus (meniscal integrity score; see Supplementary Appendix A, available at http://onlinelibrary.wiley.com/doi/10.1002/acr.24394/abstract). The meniscal integrity scores for each meniscus were summed (yielding the analysis scale 0–10 on knee level). The aim of this meniscal integrity exposure variable was to roughly rank severity of change (higher grade being worse) with emphasis on early changes in a relatively healthy cohort (K/L grade 0 knees) to avoid loss of information, for instance, when dichotomizing the exposure variable (damage/no damage). Meniscal body extrusion was analyzed as a continuous measure in millimeters.
Statistical analyses
We initially studied the average difference in KOOS scores for individuals having smaller versus larger differences in MRI features between their knees. We subsequently used a so‐called linear between–within model to estimate the causal effect of the structural abnormalities in the knee on the concurrent presence of knee pain at the same time point (under the assumptions described below). In the model, 2 knees from the same individual at the same time points were analyzed paired, while data from the 4 different follow‐up visits for each participant were treated as repeated measurements of this matched knee design (8). Thus, the analysis model was mixed linear regression with nested random intercepts for participant and follow‐up time point and unstructured covariance matrix. The fixed effects included the knee‐specific exposure of interest, the average exposure from 2 knees from the participant at a specific time point, knee side, and follow‐up time point (9). Furthermore, additional confounders were adjusted for according to the specifications below. This means that we studied differences in the MRI feature and differences in knee pain within the same individual, that is, the estimates obtained represent the associations between each MRI feature and knee pain in the same knee in the same person. Also, we assumed that the knees were nested within follow‐up occasions, and follow‐ups were nested within persons, ensuring an efficient adjustment for confounding person‐level factors such as body mass index (BMI), genetics, pain sensitization, and mental factors.
For each of the MRI features described, we estimated 3 such between–within models. Model 1: The crude association between each structural factor and knee pain in the same knee at the same OAI visit without adjusting for presence of other structural factors. Model 2: The total causal effects of the specific MRI features on knee pain in the same knee at the same OAI visit when adjusted for confounders as specified in a directed acyclic graph (DAG) representing a meniscal pathway to OA (Figure 1) (10, 11, 12). This hypothetical pathway assumes meniscal pathology to be an early event leading to biomechanical failure of the knee joint. The assumptions are based on previous knowledge and derived logic (10, 13, 14, 15, 16, 17, 18). In this model, we did not adjust for mediators; that is, the causal effects estimated could be interpreted as total causal effects that could not be confounded or mediated through other MRI features if our DAG is correct (Figure 1). To adjust for cartilage damage, we used the sum score for full thickness loss, as it had a stronger association with pain than cartilage area loss in model 1. Model 3: The direct causal effects of the specific MRI features on knee pain in the same knee at the same OAI visit that could not be confounded nor mediated by each other; that is, each feature was adjusted for all other features. Again, the cartilage damage full thickness loss sum score was used to adjust for cartilage damage.
Figure 1.
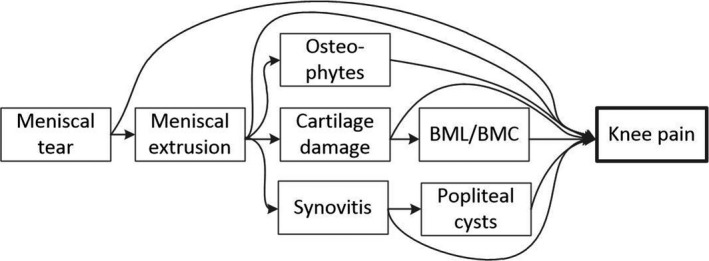
Directed acyclic graph (DAG) depicting the assumptions of causal pathways between magnetic resonance imaging features and knee pain. The DAG implies the following adjustments for obtaining total causal effects: meniscal tear (no adjustment required); meniscal extrusion (adjustment for meniscal tear); cartilage damage (adjustment for meniscal tear and meniscal extrusion); bone marrow lesion (BML) and bone marrow cyst (BMC) (adjustment for meniscal tear, meniscal extrusion, and cartilage damage); osteophytes (adjustment for meniscal tear and meniscal extrusion); synovitis (adjustment for meniscal tear and meniscal extrusion); and popliteal cysts (adjustment for meniscal tear, meniscal extrusion, and synovitis).
In all analyses, we assumed that the effect of structural features on pain was immediate, because previous pain is unlikely to cause incident MRI features. We also assumed that previous MRI features do not confound the effect on current knee pain as it is fully mediated by current MRI features. We had these assumptions for all time points, which were incorporated in the same model; thus, we could utilize the longitudinal data in our study but still examine the immediate effect of an MRI feature on knee pain. Any confounding due to central sensitization and/or mixing up of within and between knee effects is adjusted for using the between–within approach (8, 19). In a sensitivity analysis, instead of using sum of scores, we dichotomized each MRI exposure as present (grade 1 or higher) or absent (grade 0); meniscal extrusion was treated as present if ≥3 mm. In this analysis, we created separate variables for BMLs and BMCs from the MOAKS grading system to avoid excessive loss of information.
Also, in a sensitivity analysis, we repeated the analyses using medial and lateral TF joint line tenderness and PF pain as outcome (still in the same knee) using compartment‐specific MRI features as exposure variables (medial and lateral TF compartment, PF compartment). We have presented all estimates with 95% confidence intervals, as estimated through mixed effects models, and assessed whether the estimates were above the minimum clinically important difference (MCID; for the KOOS only). All analyses were performed using Stata MP, version 15.
RESULTS
The longitudinal MRI data from the 294 participants had 0–0.9% missing values for the different constructs that we evaluated. The mean age was 50 years, and 50% were women (Table 1). Of the individuals included, 30 (10%) developed K/L grade 1 in least 1 knee, while 20 (7%) developed K/L grade ≥2 in at least 1 knee during the follow‐up time. In plotted data of observed within‐person differences in knee pain for differently exposed knees, the knees with more meniscal extrusion, full thickness cartilage damage, and osteophytes tended to be more painful than knees with less meniscal extrusion, less full thickness cartilage damage, and fewer osteophytes, whereas little association was observed between within‐person differences in knee pain and differences in meniscal integrity score and BMLs including potential cysts (see Supplementary Figure 1, available on the Arthritis Care & Research website at http://onlinelibrary.wiley.com/doi/10.1002/acr.24394/abstract). KOOS knee pain was highly variable over time (see Supplementary Figure 2, available on the Arthritis Care & Research website at http://onlinelibrary.wiley.com/doi/10.1002/acr.24394/abstract). For the binary exposures, the mean ± SD KOOS knee pain score for persons with 1 knee with synovitis and the other knee without synovitis at baseline (n = 74) was 89.7 ± 12.8 and 89.3 ± 12.5, respectively. The mean ± SD KOOS knee pain score for participants with knees with versus without popliteal cysts at baseline (n = 76) was 92.8 ± 9.6 and 90.8 ± 10.4, respectively.
Table 1.
Baseline characteristics of included patients and knee joints*
| Characteristic | Value |
Right knees (n = 294) |
Left knees (n = 294) |
|---|---|---|---|
| Age, mean ± SD years | 50.5 ± 2.9 | – | – |
| Women, no. (%) | 146 (49.7) | – | – |
| BMI, mean ± SD kg/m2 | 27.1 ± 4.5 | – | – |
| Knee injury, no. (%) | – | 96 (33) | 83 (29) |
| Sum score of meniscal integrity | – | 0 (0–2) | 1 (0–2) |
| Meniscal extrusion, mm | – | 2.6 (1.9–2.9) | 2.2 (1.8–2.9) |
| Sum score of cartilage area loss | – | 4 (2–8) | 4 (1–7) |
| Sum score of cartilage full thickness loss | – | 0 (0–1) | 0 (0–1) |
| Sum score of BMLs (including cysts) | – | 1 (0–2) | 1 (0–2) |
| Sum score of osteophytes | – | 0 (0–2) | 0 (0–2) |
| Effusion‐ or Hoffa‐synovitis present, no. (%) | – | 174 (59) | 166 (56) |
| Popliteal cyst present, no. (%) | – | 83 (28) | 71 (24) |
| KOOS pain score, mean ± SD | – | 88 ± 15 | 90 ± 14 |
Values are the median (interquartile range [1st and 3rd quartile]) unless indicated otherwise. Four right and left knees had missing data on knee injury status. BMC = bone marrow cyst; BMI = body mass index; BMLs = bone marrow lesions; KOOS = Knee Injury and Osteoarthritis Outcome Score.
The effect of specific MRI features on knee pain
Using a linear mixed model with KOOS knee pain as outcome, increased meniscal extrusion, cartilage damage, and osteophytes were associated with worse knee pain both in crude analyses and in total and direct causal effect analyses (Table 2 and Supplementary Table 1, available on the Arthritis Care & Research website at http://onlinelibrary.wiley.com/doi/10.1002/acr.24394/abstract).
Table 2.
The difference (B) in Knee Injury and Osteoarthritis Outcome Score (KOOS) pain score between 2 knees per 1 score difference in magnetic resonance imaging (MRI) feature with 95% confidence intervals (95% CIs)*
| MRI feature (observed score) |
Crude, B (95% CI) |
Total causal effects, B (95% CI)† |
Direct causal effects, B (95% CI)‡ |
|---|---|---|---|
| Sum score of meniscal integrity (range 0–10) | –0.39 (–0.69, –0.09) | Same as crude | –0.28 (–0.58, 0.02) |
| Meniscal extrusion (range 0.4–7.5 mm) | –1.56 (–2.39, –0.73) | –1.49 (–2.32, –0.66) | –1.52 (–2.35, –0.69) |
| Sum score of cartilage area loss (range 0–39) | –0.45 (–0.67, –0.22) | –0.41 (–0.64, –0.19) | –0.23 (–0.48, 0.02) |
| Sum score of cartilage full thickness loss (range 0–16) | –1.37 (–1.88, –0.85) | –1.34 (–1.85, –0.82) | –1.04 (–1.58, –0.50) |
| Sum score of BMLs (including cysts) (range 0–20) | –0.38 (–0.73, –0.03) | –0.24 (–0.59, 0.11) | –0.19 (–0.55, 0.16) |
| Sum score of osteophytes (range 0–29) | –0.52 (–0.79, –0.25) | –0.50 (–0.78, –0.23) | –0.32 (–0.61, –0.03) |
| Effusion‐ or Hoffa‐synovitis (present/absent) | –0.07 (–1.46, 1.31) | 0.05 (–1.33, 1.43) | 0.23 (–1.14, 1.60) |
| Popliteal cysts (present/absent) | 0.89 (–0.55, 2.33) | 0.97 (–0.46, 2.41) | 0.86 (–0.56, 2.29) |
BMLs = bone marrow lesions.
Adjusted according to directed acyclic graph (see Figure 1).
Adjusted for all features (cartilage full thickness [not area] loss was used to adjust for cartilage damage status). The estimates should be interpreted as the difference in knee pain between knees in the same person for the knee that has a 1 unit increase in the MRI feature in question relative to the other knee when averaged over all Osteoarthritis Initiative visits for that patient.
None of the effect estimates of the MRI features were above the MCID of 10 KOOS points for established knee OA. However, the maximum within‐person difference in meniscal extrusion observed, 4.5 mm, implies –6.9 KOOS points more knee pain (Table 2, direct effect analysis). This is above the MCID of 6 KOOS points for knee injury (20, 21, 22). Similarly, a knee with 5–10 grades more cartilage full thickness loss would be 5–10 KOOS points more painful, respectively (Table 2, direct effect analyses). To further check the robustness of these findings, we used dichotomized exposures; that is, each of the MRI features was classified as present or absent. In these analyses, in addition to meniscal extrusion, cartilage full thickness loss and osteophytes, meniscal signal, and BMLs (here, excluding BMCs) were associated with knee pain. However, the estimates of the association between the MRI features and knee pain excluded differences of potential clinical relevance (Table 3).
Table 3.
Results from regression modeling with dichotomized exposures*
|
Crude, B (95% CI) |
Total causal effects, B (95% CI)† |
Direct causal effects, B (95% CI)‡ |
|
|---|---|---|---|
| Meniscal signal or tear | –2.18 (–3.61, –0.76) | Same as crude | –1.87 (–3.28, –0.45) |
| Meniscal extrusion ≥3 mm | –2.06 (–3.54, –0.58) | –1.86 (–3.35, –0.38) | –2.07 (–3.53, –0.61) |
| Cartilage area loss | –2.13 (–4.10, –0.17) | –2.08 (–4.04, –0.12) | –1.11 (–3.09, 0.87) |
| Cartilage full thickness loss | –2.92 (–4.46, –1.39) | –2.84 (–4.37, –1.32) | –2.10 (–3.65, –0.55) |
| BMLs (excluding cysts) | –1.05 (–1.64, –0.47) | –0.83 (–1.42, –0.24) | –0.91 (–1.55, –0.27) |
| BMCs | –0.65 (–1.37, 0.07) | –0.37 (–1.09, 0.35) | 0.23 (–0.55, 1.02) |
| Osteophytes | –2.25 (–3.68, –0.81) | –2.23 (–3.65, –0.80) | –1.82 (–3.26, –0.38) |
95% CI = 95% confidence interval; BMCs = bone marrow cysts; BMLs = bone marrow lesions; KOOS = Knee Injury and Osteoarthritis Outcome Score.
Adjusted according to directed acyclic graph (see Figure 1).
Adjusted for all features (cartilage full thickness [not area] loss was used to adjust for cartilage damage status). All features were classified as present or absent. For estimates of the presence or absence of effusion‐ or Hoffa‐synovitis and popliteal cysts, see Table 2. The estimates should be interpreted as the difference in knee pain between knees in the same patient that are exposed versus unexposed regarding the magnetic resonance imaging feature in question when averaged over all Osteoarthritis Initiative visits for that patient.
Our sensitivity analyses using compartment‐specific MRI features and medial, lateral joint line tenderness as well as patellar tenderness as outcomes were mostly inconclusive on the association between compartment‐specific meniscal extrusion, cartilage damage or osteophytes, and medial or lateral joint line tenderness and patellar tenderness (Table 4).
Table 4.
Effects of specific local magnetic resonance imaging (MRI) features on knee pain in corresponding knee location*
| Compartment‐specific MRI features | Medial tibial joint line tenderness, direct causal effects† | Lateral tibial joint line tenderness, direct causal effects† | Patellofemoral tenderness, direct causal effects† |
|---|---|---|---|
| Sum score of meniscal integrity | 1.00 (0.83, 1.21) | 1.09 (0.86, 1.38) | – |
| Meniscal extrusion | 1.19 (0.83, 1.70) | 1.10 (0.80, 1.50) | – |
| Sum score of cartilage area loss | 0.93 (0.74, 1.19) | 1.09 (0.88, 1.35) | 1.11 (0.94, 1.32) |
| Sum score of cartilage full thickness loss | 2.61 (0.92, 7.45) | 1.32 (0.73, 2.39) | 1.51 (1.03, 2.20) |
| Sum score of BMLs (including cysts) | 0.88 (0.63, 1.23) | 0.84 (0.60, 1.18) | 1.03 (0.71, 1.49) |
| Sum score of osteophytes | 0.93 (0.61, 1.44) | 1.11 (0.72, 1.70) | 1.02 (0.82, 1.28) |
Values are the odds ratio (95% confidence interval). All estimates are per 1 score. The presence or absence of effusion‐ or Hoffa‐synovitis and popliteal cysts are not included, as these exposures could not be studied as compartment specific. The estimates should be interpreted as the difference in knee pain between knees in the same patient that are exposed versus unexposed regarding the MRI feature in question when averaged over all Osteoarthritis Initiative visits for that patient. BMLs = bone marrow lesions.
Mutually adjusted for compartment‐specific features.
DISCUSSION
Using a cohort free of radiographic knee OA at baseline, we have evaluated the relevance of present MRI features on knee pain using a within‐person design. We found that meniscal extrusion, full thickness cartilage defects, and osteophytes were associated with increased knee pain, while the size of the effect was low when considered in an MCID framework. These features displayed effects on knee pain according to KOOS score that may be considered clinically relevant for knee injury but not for established knee OA.
The current findings shed new and important light on early disease processes in OA, i.e., before radiographic changes are manifest. Of particular novelty is our analytic approach, which omits person‐level confounding and assesses the extent to which any observed association between MRI features and knee pain could be considered clinically relevant both from the perspective of knee injury and from the perspective of established OA. Thus, our findings may provide important guidance for further research of targets for early disease prevention. In that regard, the cutoff for what can be considered a clinically relevant difference in knee pain can be questioned. We are not aware of studies that explore the MCID for a patient population representative of the current study. Because we studied patients exclusively with K/L grade 0 at baseline who may have had, but may also not have had a prior knee injury (29% of participants had previous knee injury at baseline), we applied both an MCID of 6 as reported for knee injury and an MCID of 10 as reported for established knee OA. However, the MCID may in fact vary with person characteristics (22), making the interpretation of whether there were clinically important differences in knee pain in the current study somewhat unclear. It is important to realize that the smallest change possible in an individual KOOS score for the pain domain is 3 points (i.e., a 1‐step change in response on 1 item of the total 9 questions generates a change of 2.8 points). Thus, it is questionable whether the association between meniscal extrusion, cartilage damage, and osteophytes that we observed is of further interest in a clinical and/or a research perspective. However, our findings suggest that pain experience in knees that potentially are beginning to develop OA may involve both subchondral bone innervation (cartilage defects) as well as more peripheral capsular/synovial and meniscal innervation (meniscal extrusion), supporting the notion of often increased pain after physical activity in early stages of OA.
We are aware of no longitudinal study that has explored the role of MRI features in knee pain specifically in knees without radiographic OA at baseline. Sayre et al investigated the association in a cohort of 122 persons (1 knee only), but 39% of the sample had K/L grade 2 or worse, and all participants had knee pain (23). Previous studies of individuals with established knee OA have found varying associations with knee pain. A systematic review of cartilage defects, BMLs, osteophytes, meniscal lesion, effusion/synovitis, ligamentous abnormalities, subchondral cysts, and bone attrition and pain in patients with knee OA reported that only BMLs and effusion/synovitis were associated with knee pain across 22 studies performed before 2011 (24). Later studies have revealed associations between osteophytes and knee pain as well as between cartilage damage and knee pain (25, 26). MacFarlane et al further reported that meniscal root tears were associated with increased knee pain on the Western Ontario and McMaster Universities Osteoarthritis Index pain scale in 227 knees with radiographic OA included in a trial (27), but this could not be confirmed by Bhattacharyya et al (28). However, none of these studies utilized a within‐person design and were thus prone to unmeasured person‐level confounding. When studying the within‐person differences in knee pain in individuals who are differently exposed with regards to the MRI feature in question, we could thus exclude confounding due to all person‐level factors such as BMI and lifestyle. Still, we could not omit knee‐specific confounding, which might explain, for example, that BMLs and/or BMCs were not associated with clinically relevant knee pain in analyses with continuous or dichotomous exposure (Tables 2 and 3), which contrasts with previous studies (24).
Although it is questionable whether our findings are clinically important, there is still potential to use MRI as a sensitive imaging modality in clinical trials, as it is possible to test whether interventions targeting the relevant MRI features relieve pain and slow or stop the early structural OA development. In daily clinical practice, however, the role of MRI in knee OA diagnostics is still not recommended. Although doing an MRI may provide potential clues for the specific cause of knee pain, there are currently no treatment options available that slow or stop the disease process by directly targeting these structural OA features. Further, the risk of incidental findings is high (29), which may trigger unwarranted treatments such as arthroscopic partial meniscectomy. Therefore, in clinical practice, MRI preferably should be used to exclude other important differential diagnoses when needed and not to diagnose OA.
A number of important limitations should be mentioned. First, the representativeness of the OAI cohort can be questioned. As an example, obesity, a major risk factor for OA, has a higher prevalence in the US than in comparable European countries (30). Also, the sample selection from the OAI (only middle‐aged participants with complete MRI examinations) further limits the generalizability of the findings. Although we cannot exclude the potential for selection bias, we expect it to be outweighed by the benefits of the within‐person design (i.e., no person‐level confounding). Second, we calculated sum scores for the MRI features, although it is questionable whether they can be interpreted at all on a linear scale. Importantly, we refrain from classifying particular sum scores as clinically relevant or not, but we only interpret the difference in knee pain (measured with the KOOS) with which these sum scores are associated. Further, we have checked, using model diagnostics, that the linear model is a good fit to the data, although the structural sum scores in themselves are not normally distributed. This is partly due to the fact that the model operates on within‐person differences in the scores. Third, although our analytical approach omits person‐level confounding, we cannot exclude that confounders that are nonshared between knees, such as exposure to knee injury or knee malalignment in 1 knee only, have impacted our findings. However, we applied mainly continuous rather than binary exposures in our main analyses, which may reduce the consequences of nonshared confounding such as misclassification of discordant knees and collider bias due to selection of persons with discordant knees only (31). Fourth, our statistical model was based on the underlying assumption of causality between structure and pain, and there is a possibility of reverse causation, although we find that potential pathway probably less common than the other way around. Finally, further analyses of site‐specific exposures with site‐specific pain would have been preferable but were unfortunately hampered due to limited data available on site‐specific knee pain.
In conclusion, we found that meniscal extrusion, full thickness cartilage defects, and osteophytes are associated with increased knee pain when adjusted for all person‐level confounders. However, the average effect on pain was small, and the clinical relevance of our findings is challenging to judge. The cutoff for the MCID of KOOS pain for early‐stage knee OA or for K/L grade 0 is unclear and should be further investigated, as should more localized compartment‐specific pain.
AUTHOR CONTRIBUTIONS
All authors were involved in drafting the article or revising it critically for important intellectual content, and all authors approved the final version to be submitted for publication. Dr. Magnusson had full access to all of the data in the study and takes responsibility for the integrity of the data and the accuracy of the data analysis.
Study conception and design
Magnusson, Turkiewicz, Kumm, Zhang, Englund.
Acquisition of data
Magnusson, Turkiewicz, Englund.
Analysis and interpretation of data
Magnusson, Turkiewicz, Englund.
Supporting information
Supplementary Material
Supplementary Material
Supplementary Material
This article was prepared using an Osteoarthritis Initiative (OAI) public‐use data set, and its contents do not necessarily reflect the opinions or views of the OAI Study Investigators, the NIH, or the private funding partners of the OAI. The OAI is a public–private partnership between the NIH (contracts N01‐AR‐2‐2258, N01‐AR‐2‐2259, N01‐AR‐2‐2260, N01‐AR‐2‐2261, and N01‐AR‐2‐2262) and private funding partners (Merck Research Laboratories, Novartis Pharmaceuticals, GlaxoSmithKline, and Pfizer, Inc.) and is conducted by the OAI Study Investigators. Private sector funding for the OAI is managed by the Foundation for the NIH. The authors of this article are not part of the OAI investigative team.
The content herein does not necessarily reflect the opinions or views of the OAI investigators, the NIH, or the private funding partners.
Supported by the Swedish Research Council, the Österlund Foundation, the National Health Service (ALF governmental funding for clinical research), the Greta and Johan Kock Foundation, and the Swedish Rheumatism Association.
No potential conflicts of interest relevant to this article were reported.
References
- 1. Luyten FP, Bierma‐Zeinstra S, Dell’Accio F, Kraus VB, Nakata K, Sekiya I, et al. Toward classification criteria for early osteoarthritis of the knee. Semin Arthritis Rheum 2018;47:457–63. [DOI] [PubMed] [Google Scholar]
- 2. Magnusson K, Kumm J, Turkiewicz A, Englund M. A naturally aging knee, or development of early knee osteoarthritis? Osteoarthritis Cartilage 2018;26:1447–52. [DOI] [PubMed] [Google Scholar]
- 3. Neogi T, Felson D, Niu J, Nevitt M, Lewis CE, Aliabadi P, et al. Association between radiographic features of knee osteoarthritis and pain: results from two cohort studies. BMJ 2009;339:b2844. [DOI] [PMC free article] [PubMed] [Google Scholar]
- 4. Roos EM, Roos HP, Lohmander LS, Ekdahl C, Beynnon BD. Knee Injury and Osteoarthritis Outcome Score (KOOS): development of a self‐administered outcome measure. J Orthop Sports Phys Ther 1998;28:88–96. [DOI] [PubMed] [Google Scholar]
- 5. Hunter DJ, Guermazi A, Lo GH, Grainger AJ, Conaghan PG, Boudreau RM, et al. Evolution of semi‐quantitative whole joint assessment of knee OA: MOAKS (MRI Osteoarthritis Knee Score). Osteoarthritis Cartilage 2011;19:990–1002. [DOI] [PMC free article] [PubMed] [Google Scholar]
- 6. Kumm J, Turkiewicz A, Zhang F, Englund M. Structural abnormalities detected by knee magnetic resonance imaging are common in middle‐aged subjects with and without risk factors for osteoarthritis. Acta Orthop 2018;89:535–40. [DOI] [PMC free article] [PubMed] [Google Scholar]
- 7. Zhang F, Kumm J, Svensson F, Turkiewicz A, Frobell R, Englund M. Risk factors for meniscal body extrusion on MRI in subjects free of radiographic knee osteoarthritis: longitudinal data from the Osteoarthritis Initiative. Osteoarthritis Cartilage 2016;24:801–6. [DOI] [PubMed] [Google Scholar]
- 8. Begg MD, Parides MK. Separation of individual‐level and cluster‐level covariate effects in regression analysis of correlated data. Stat Med 2003;22:2591–602. [DOI] [PubMed] [Google Scholar]
- 9. Allison PD. Fixed effects regression models. Sage Publications; 2009. Chapter 2. [Google Scholar]
- 10. Englund M, Guermazi A, Roemer FW, Yang M, Zhang Y, Nevitt MC, et al. Meniscal pathology on MRI increases the risk for both incident and enlarging subchondral bone marrow lesions of the knee: the MOST Study. Ann Rheum Dis 2010;69:1796–802. [DOI] [PMC free article] [PubMed] [Google Scholar]
- 11. Englund M, Roos EM, Lohmander LS. Impact of type of meniscal tear on radiographic and symptomatic knee osteoarthritis: a sixteen‐year followup of meniscectomy with matched controls. Arthritis Rheum 2003;48:2178–87. [DOI] [PubMed] [Google Scholar]
- 12. Guermazi A, Niu J, Hayashi D, Roemer FW, Englund M, Neogi T, et al. Prevalence of abnormalities in knees detected by MRI in adults without knee osteoarthritis: population based observational study (Framingham Osteoarthritis Study). BMJ 2012;345:e5339. [DOI] [PMC free article] [PubMed] [Google Scholar]
- 13. Englund M, Guermazi A, Roemer FW, Aliabadi P, Yang M, Lewis CE, et al. Meniscal tear in knees without surgery and the development of radiographic osteoarthritis among middle‐aged and elderly persons: the Multicenter Osteoarthritis Study. Arthritis Rheum 2009;60:831–9. [DOI] [PMC free article] [PubMed] [Google Scholar]
- 14. Hill CL, Hunter DJ, Niu J, Clancy M, Guermazi A, Genant H, et al. Synovitis detected on magnetic resonance imaging and its relation to pain and cartilage loss in knee osteoarthritis. Ann Rheum Dis 2007;66:1599–603. [DOI] [PMC free article] [PubMed] [Google Scholar]
- 15. Chatzopoulos D, Moralidis E, Markou P, Makris V, Arsos G. Baker’s cysts in knees with chronic osteoarthritic pain: a clinical, ultrasonographic, radiographic and scintigraphic evaluation. Rheumatol Int 2008;29:141–6. [DOI] [PubMed] [Google Scholar]
- 16. Hayashi D, Roemer FW, Dhina Z, Kwoh CK, Hannon MJ, Moore C, et al. Longitudinal assessment of cyst‐like lesions of the knee and their relation to radiographic osteoarthritis and MRI‐detected effusion and synovitis in patients with knee pain. Arthritis Res Ther 2010;12:R172. [DOI] [PMC free article] [PubMed] [Google Scholar]
- 17. Guermazi A, Hayashi D, Roemer FW, Niu J, Yang M, Lynch JA, et al. Cyst‐like lesions of the knee joint and their relation to incident knee pain and development of radiographic osteoarthritis: the MOST study. Osteoarthritis Cartilage 2010;18:1386–92. [DOI] [PMC free article] [PubMed] [Google Scholar]
- 18. Kumm J, Roemer FW, Guermazi A, Turkiewicz A, Englund M. Natural history of intrameniscal signal intensity on knee MR images: six years of data from the Osteoarthritis Initiative. Radiology 2016;278:164–71. [DOI] [PMC free article] [PubMed] [Google Scholar]
- 19. Sjolander A, Frisell T, Kuja‐Halkola R, Oberg S, Zetterqvist J. Carryover effects in sibling comparison designs. Epidemiology 2016;27:852–8. [DOI] [PubMed] [Google Scholar]
- 20. Achtnich A, Petersen W, Willinger L, Sauter A, Rasper M, Wortler K, et al. Medial meniscus extrusion increases with age and BMI and is depending on different loading conditions. Knee Surg Sports Traumatol Arthrosc 2018;26:2282–8. [DOI] [PubMed] [Google Scholar]
- 21. Roos EM, Lohmander LS. The Knee injury and Osteoarthritis Outcome Score (KOOS): from joint injury to osteoarthritis. Health Qual Life Outcomes 2003;1:64. [DOI] [PMC free article] [PubMed] [Google Scholar]
- 22. Paradowski PT, Englund M, Lohmander LS, Roos EM. The effect of patient characteristics on variability in pain and function over two years in early knee osteoarthritis. Health Qual Life Outcomes 2005;3:59. [DOI] [PMC free article] [PubMed] [Google Scholar]
- 23. Sayre EC, Guermazi A, Esdaile JM, Kopec JA, Singer J, Thorne A, et al. Associations between MRI features versus knee pain severity and progression: data from the Vancouver Longitudinal Study of Early Knee Osteoarthritis. PLoS One 2017;12:e0176833. [DOI] [PMC free article] [PubMed] [Google Scholar]
- 24. Yusuf E, Kortekaas MC, Watt I, Huizinga TW, Kloppenburg M. Do knee abnormalities visualised on MRI explain knee pain in knee osteoarthritis? A systematic review. Ann Rheum Dis 2011;70:60–7. [DOI] [PubMed] [Google Scholar]
- 25. Kaukinen P, Podlipska J, Guermazi A, Niinimaki J, Lehenkari P, Roemer FW, et al. Associations between MRI‐defined structural pathology and generalized and localized knee pain: the Oulu Knee Osteoarthritis study. Osteoarthritis Cartilage 2016;24:1565–76. [DOI] [PubMed] [Google Scholar]
- 26. Baum T, Joseph GB, Arulanandan A, Nardo L, Virayavanich W, Carballido‐Gamio J, et al. Association of magnetic resonance imaging–based knee cartilage T2 measurements and focal knee lesions with knee pain: data from the Osteoarthritis Initiative. Arthritis Care Res (Hoboken) 2012;64:248–55. [DOI] [PMC free article] [PubMed] [Google Scholar]
- 27. MacFarlane LA, Yang H, Collins JE, Guermazi A, Jones MH, Teeple E, et al. Associations among meniscal damage, meniscal symptoms and knee pain severity. Osteoarthritis Cartilage 2017;25:850–7. [DOI] [PMC free article] [PubMed] [Google Scholar]
- 28. Bhattacharyya T, Gale D, Dewire P, Totterman S, Gale ME, McLaughlin S, et al. The clinical importance of meniscal tears demonstrated by magnetic resonance imaging in osteoarthritis of the knee. J Bone Joint Surg Am 2003;85:4–9. [DOI] [PubMed] [Google Scholar]
- 29. Englund M, Guermazi A, Gale D, Hunter DJ, Aliabadi P, Clancy M, et al. Incidental meniscal findings on knee MRI in middle‐aged and elderly persons. N Engl J Med 2008;359:1108–15. [DOI] [PMC free article] [PubMed] [Google Scholar]
- 30. Laurier D, Guiguet M, Chau NP, Wells JA, Valleron AJ. Prevalence of obesity: a comparative survey in France, the United Kingdom and the United States. Int J Obes Relat Metab Disord 1992;16:565–72. [PubMed] [Google Scholar]
- 31. Frisell T, Oberg S, Kuja‐Halkola R, Sjolander A. Sibling comparison designs: bias from non‐shared confounders and measurement error. Epidemiology 2012;23:713–20. [DOI] [PubMed] [Google Scholar]
Associated Data
This section collects any data citations, data availability statements, or supplementary materials included in this article.
Supplementary Materials
Supplementary Material
Supplementary Material
Supplementary Material