

Abstract
Background
Influenza is a highly contagious disease that causes severe illness each year. Data in the United Arab Emirates are scarce.
Objectives
To study the seasonality, morbidity, mortality rate, and comorbidities associated with confirmed influenza infection in a tertiary hospital in Al‐Ain city, UAE.
Methods
Retrospective study, from 2012 to 2017, of the electronic medical records in Tawam hospital, of children up to 15 years of age with laboratory‐confirmed influenza infection.
Results
There were 1392 children, with the highest number in 2017 (n = 461, 33%). The incidence peaked between October and March. The infection was more common between 1 and 11 years of age (n = 948, 68%). The overall prevalence of influenza A (n = 1144, 82%) was higher than influenza B (n = 276, 19.8%). One‐third of the patients required admission. The commonest underlying comorbidity was asthma (n = 170, 12%). The two commonest complications were pneumonia (n = 165, 12%) and acute otitis media (n = 82, 6%).
Conclusion
Our findings serve as a benchmark for comparison with reports from other countries and need to be considered when reviewing the national vaccination program.
Keywords: children, epidemiological study, hospitalization, influenza, respiratory tract infections, United Arab Emirates

Abbreviations
- ARDS
acute respiratory distress syndrome
- ARI
acute respiratory infections
- RT‐PCR
reverse transcriptase polymerase chain reaction (RT‐PCR)
- UAE
United Arab Emirates
1. INTRODUCTION
Acute respiratory infections (ARIs) are major contributors to morbidity and mortality worldwide. Influenza, a vaccine‐preventable disease, is a significant cause of ARI, affecting annually 5% to 10% of the population globally and causing morbidity and mortality, especially in high‐risk groups such as children. 1 It causes approximately one million influenza‐associated hospitalizations among children younger than 5 years of age and 500 000 deaths among all age groups. 2 , 3
Different strains of influenza exist and include type A, B, and C. Type A and B can cause outbreaks and epidemics in humans; accordingly, circulating strains of both types are incorporated in seasonal influenza vaccines. 4 , 5 Human influenza infection is most commonly caused by type A virus, which is the only type known to cause pandemics. 6 , 7 Transmission of the influenza virus occur through the respiratory droplets, and it tends to increase during the winter season in countries with temperate climates, often severely impacting healthcare services. 1
Symptoms of influenza infection include fever, sore throat, nasal discharge, headache, myalgia, cough, vomiting, and diarrhea. 8 Complications are not uncommon and remain a public health concern. They include pneumonia, acute respiratory failure, acute respiratory distress syndrome (ARDS), otitis media, febrile seizure, encephalitis/encephalopathy, myositis, rhabdomyolysis, myocarditis, renal failure, multi‐organ failure, and can lead to death. 9 , 10 , 11 , 12
The wide spectrum of the clinical presentation 13 with ill‐defined signs and symptoms often leads to empirical management without respiratory sampling. Such practice makes it difficult to estimate the true burden of influenza. 14 Quantifying the latter is required to reveal the pattern of illness severity and guide public health policies. It is also needed to justify the seasonal influenza vaccination, 9 which remains the key preventive intervention for influenza‐related hospitalizations and deaths, and assess its impact. 15
Seasonal influenza vaccine was started in the United Arab Emirates in 2006 for high‐risk healthcare professionals and people with chronic illnesses. Since 2012, elderly (>65 years) were added to the high‐risk groups, and in 2015, all community members were encouraged (but not mandated) to receive the vaccine including infants >6 months. The trivalent seasonal vaccine contains influenza A(H1N1), A(H3N2), and influenza B strain (Colorado), while the tetravalent vaccine has, in addition, the Phuket strain (an additional B strain). In our center, a trivalent vaccine was given to all children >6 months of age, while children with certain comorbidities received the tetravalent vaccine. Those comorbidities include: Chronic lung dieses, asthma, congenital heart disease, and patients on immunosuppressant medications.
The existing literature on influenza infection among the pediatric population in the United Arab Emirates is scarce. 16 Thus, we conducted this study to estimate the demographic, clinical features, laboratory findings, and the outcomes of children with confirmed influenza virus infection who presented to a tertiary hospital in Al Ain City in the United Arab Emirates over a 6‐year period, and the relationship to their seasonal influenza vaccination status.
2. MATERIAL AND METHODS
2.1. Setting
This retrospective observational cohort study was conducted over a 6‐year period (2012‐2017) in Tawam hospital, a large 461‐bed tertiary regional teaching hospital in Al Ain city and one of the busiest pediatric services in the UAE. The catchment area includes over 767 000 persons (latest 2016 census), of whom 165 330 (21.5%) are under 15 years of age.
2.2. Case definition
Children under 15 years of age who presented to the hospital during the study period and found to be infected with influenza A and B viruses were identified from the electronic medical records, based on the International Classification of Diseases, Ninth Revision (ICD‐9) codes until 2015, and ICD‐10 codes (J09‐J18) thereafter. Their viral diagnosis was also always confirmed by matching the laboratory data.
2.3. Data collected
We collected, from the electronic medical records, the demographic and clinical data of all children fulfilling the case definition. These included age, gender, clinical presentation, admission diagnosis, radiological findings, underlying medical conditions, interventions, complications. The children's vaccination status was obtained from the medical record and by parental report. The participants were classified into four age groups: less than 1 month (newborn), 2 to 12 months (infant), 1 to 10 years (child), and 10 to 15 years (adolescent).
2.4. Laboratory
During the study period, all children presenting to the hospital with febrile respiratory infections underwent aspiration of nasopharyngeal secretions as required by the infection control department. We collected nasopharyngeal aspirates using swabs with a synthetic tip and a plastic shaft that were immediately placed in a universal transport medium (UTM) as per the manufacturer's instructions. Specimens were rapidly transported to the laboratory on ice or cold packs in an appropriate triple bag packaging, where they were stored refrigerated at 4°C to 6°C. An infected patient was defined as having a positive result for the rapid immunofluorescent antigen detection test for influenza A and B viruses (Sofia Influenza A + B FIA immunofluorescence, Quidel Corporation, San Diego, California). The sensitivity and specificity of the test are, respectively, 97% and 95% for influenza A, and for influenza B 90% and 97%. Since 2017, the results were also confirmed by reverse transcriptase polymerase chain reaction (RT‐PCR) analysis (Seegene, Seoul, South Korea). The PCR sensitivity is 100 copies/reaction and its specificity is 100%. Tawam hospital laboratory is accredited by the College of American Pathologists.
2.5. Definitions
Inpatient hospitalization was defined as a hospital admission resulting in an overnight stay.
Emergency department visit was defined as an unscheduled ambulatory visit to the emergency department without overnight stay.
Acute otitis media (AOM) was defined as a visually abnormal tympanic membrane suggesting an effusion in the middle ear cavity concomitant with one or more of the following symptoms: fever (≥38°C), earache, irritability, diarrhea, vomiting, acute otorrhea not caused by external otitis media.
Pneumonia was defined by the presence of focality of signs on chest examination (crepitations, decreased air entry, bronchial breathing) with the presence of infiltrates on chest X‐ray.
Pediatric ARDS was defined as per the consensus recommendations from the Pediatric Acute Lung Injury Consensus Conference. 17
Deaths only include those that had occurred in hospital.
A child was defined as immunized if, after the age of 6 months, he/she had received one or more doses of a licensed seasonal influenza vaccine within 1 year of their presentation.
2.6. Statistical analyses
Statistical analysis was performed using the Stata statistical package version 15 (StataCorp, Texas). Categorical variables were expressed as numbers with percentages and were compared using the Chi‐square or Fisher's exact test where appropriate. For all the studied variables, their relationship with the virus type as well as with the children's vaccination status was analyzed in a univariate model using the odds ratio (OR), with 95% confidence intervals (CI) and also the adjusted ORs with 95% CI using a multivariate regression logistic model to adjust for virus type, gender, age, year of admission, coinfections, vaccination status, and presence of comorbidity. To analyze trends in the prevalence of complications and outcomes with increasing number of coinfecting pathogens, or increasing age, we also calculated the odds of these outcomes their P value with the Chi‐squared test for trend. A significant trend existed when the odds of each outcome varied significantly with the number of coinfecting pathogens, or with age. For all calculations, a P value <.05 was considered to be statistically significant.
3. RESULTS
3.1. Demographics
Between January 2012 and December 2017, a total of 1392 hospital encounters occurred with children infected with the influenza virus, of which 925 (66.5%) were managed in the emergency department (ED) then discharged home, while 467 (33.5%) required admission (Table 1 and Figure 1). Males comprised 800 (57.3%) of the cases. The age group with the highest prevalence was between 1 and 10 years. Fever was the most common presenting symptom, occurring in 698 children (50.2%). Influenza A was significantly more prevalent than type B in the younger age groups, but there was no difference between the sexes. There was no significant difference in prior vaccination status between the two types of infection. Admission to hospital was significantly more often required for children infected with influenza A than B (Table 1).
TABLE 1.
Demographic data of 1392 children with proven Influenza infection. Results expressed as numbers and percentage
| All patients 1392 (100) | Influenza A 1144 (82) | Influenza B 248 (18) | OR (95% CI) a | P value | |
|---|---|---|---|---|---|
| Sex | 1.08 (0.81, 1.44) | .58 | |||
| Males | 798 (57) | 652 (57) | 146 (59) | ||
| Females | 594 (43) | 492 (43) | 102 (41) | ||
| Age | 1.83 (1.40, 2.38) | <.001 | |||
| <1 month | 38 (3) | 38 (3) | 0 (0) | ||
| 2‐12 months | 343 (25) | 301 (26) | 42 (17) | ||
| 1‐10 years | 948 (68) | 758 (66) | 190 (77) | ||
| 11‐15 years | 83 (4) | 47 (4) | 16 (6) | ||
| Prior seasonal Influenza vaccination | 142 (10) | 121 (11) | 21 (8) | 0.78 (0.45, 1.28) | .32 |
| Number of healthcare visits before admission | 4.4 (1.4, 22.3) | .006 | |||
| 0 | 62 (4) | 59 (5) | 3 (1.2) | ||
| 1 | 1033 (74) | 832 (73) | 201 (81) | ||
| ≥2 | 297 (21) | 253 (22) | 44 (18) | ||
| Admitted to hospital | 467 (34) | 421 (37) | 46 (18) | 0.39 (0.27, 0.55) | <.001 |
Abbreviations: CI, confidence intervals; OR, odds ratio.
Chi‐squared or Fisher exact test.
FIGURE 1.

Yearly distribution of children with influenza infection, and their immunization status, managed solely in emergency room (ER) or admitted to hospital
3.2. Isolates
Across the 6‐year study period, the most common isolate was influenza A (Table 1 and Figure 2), and this pattern was maintained in the seasonality analysis (Figure 3). There was no association between the prevalence of infection with influenza A and the vaccination status (Table 2). Coinfections with at least another viral respiratory pathogen occurred in 11% of the children, 10% of whom were coinfected with two pathogens (Table 3). Coinfections were significantly more prevalent in children infected with influenza A than B.
FIGURE 2.

Annual pattern of influenza isolates in 1392 children between 2012 and 2017, and percentage of infected children admitted to hospital
FIGURE 3.

Seasonality of influenza isolates in 1392 children between 2012 and 2017
TABLE 2.
Seasonal influenza vaccination status of 1392 children with proven influenza infection: demographics, complications, and outcomes
| Vaccinated 142 (10%) | Unvaccinated 1250 (90%) | OR (95% CI) a | P value | Adjusted OR (95% ci) b | P value | |
|---|---|---|---|---|---|---|
| Sex | 86 (60) | 712 (57) | 1.16 (0.82, 1.45) | .41 | NA | NA |
| Age | 2.22 (1.65, 3.0) | <.001 | NA | NA | ||
| < 1 month | 0 (0) | 38 (3) | ||||
| 2‐12 months | 10 (7) | 333 (27) | ||||
| 1‐10 years | 121 (85) | 827 (66) | ||||
| 11‐15 years | 10 (7) | 53 (4) | ||||
| Infection with | 0.78 (0.48, 1.27) | .32 | NA | NA | ||
| Influenza A | 121 (85) | 1023 (82) | ||||
| Influenza B | 21 (15) | 227 (18) | ||||
| Acute respiratory distress syndrome | 5 (3.5) | 43 (3) | 1.02 (0.31, 2.64) | .96 | 0.51 (0.18, 1.38) | .18 |
| Bacterial pneumonia | 22 (15) | 143 (11) | 1.41 (0.83, 2.33) | .15 | 0.82 (0.48, 1.40) | .47 |
| Acute otitis media | 3 (2) | 79 (6) | 0.32 (0.06, 0.99) | .04 | 0.41 (0.12, 1.33) | .13 |
| Croup | 0 (0) | 9 (0.7) | 0 (0, 3.75) | .31 | NC | NC |
| Carditis | 0 (0) | 4 (0.3) | 0 (0, 8.49) | .49 | NC | NC |
| Toxic shock syndrome | 0 (0) | 2 (0.1) | 0 (0, 16.98) | .63 | NC | NC |
| Myositis | 0 (0) | 7 (0.5) | 0 (0, 4.83) | .37 | NC | NC |
| Acute kidney insufficiency | 1 (0.7) | 19 (1.5) | 0.46 (0.01, 2.93) | .43 | 0.21 (0.03, 1.69) | .14 |
| Multiorgan failure | 1 (0.7) | 18 (1.4) | 0.48 (0.01, 3.12) | .47 | 0.24 (0.03, 1.92) | .18 |
| Encephalitis | 1 (0.7) | 4 (0.3) | 2.21 (0.04, 22.5) | .46 | 2.41 (0.24, 24.36) | .45 |
| Febrile convulsions | 0 (0) | 20 (1.6) | 0 (0, 1.67) | .13 | NC | NC |
| Admitted to hospital | 55 (39) | 412 (33) | 1.28 (0.88, 1.86) | .16 | 0.97 (0.63, 1.50) | .92 |
| Required intensive care | 16 (11) | 100 (8) | 1.46 (0.77, 2.58) | .18 | 0.83 (0.44, 1.56) | .56 |
| Length of stay in hospital | 1.27 (0.87, 1.85) | .18 | 0.88 (0.65, 1.18) | .41 | ||
| <1 week | 36 (25) | 261 (21) | ||||
| >1 week | 19 (13) | 153 (12) | ||||
| Death | 2 (1.4) | 20 (1.6) | 0.87 (0.09, 3.67) | .86 | 0.46 (0.10, 2.12) | .32 |
Note: Results expressed as numbers and percentage.
Abbreviations: CI, confidence intervals; NA, not applicable; NC, could not be calculated; OR, odds ratio.
Chi‐squared or Fisher exact test.
Multivariate logistic regression adjusting for virus type, gender, age, year of admission, coinfections, vaccination status, and presence of comorbidity.
TABLE 3.
Coinfections with respiratory pathogens in 1392 children with proven influenza infection
| All patients 1392 (100%) | Influenza A 1144 (82%) | Influenza B 248 (18%) | OR (95% CI) a | P value | Adjusted OR (95% CI) b | P value | |
|---|---|---|---|---|---|---|---|
| Coinfection | 0.38 (0.19, 0.70) | .001 | 0.61 (0.32, 1.16) | .13 | |||
| None | 1245 (89) | 1009 (88) | 236 (95) | ||||
| One pathogen | 133 (10) | 121 (10) | 12 (5) | ||||
| RSV | 85 (6) | 82 (7) | 3 (1) | ||||
| Adenovirus | 21 (2) | 15 (1) | 6 (2) | ||||
| Parainfluenza | 27 (2) | 24 (2) | 3 (1) | ||||
| Two pathogens | 14 (1) | 14 (1) | 0 (0) | ||||
| RSV and adenovirus | 8 (0.5) | 8 (10.7) | 0 (0) | ||||
| RSV and parainfluenza | 2 (0.1) | 2 (0.2) | 0 (0) | ||||
| Adenovirus and parainfluenza | 4 (0.3) | 4 (0.3) | 0 (0) |
Note: Results expressed as numbers and percentage.
Abbreviations: CI, confidence intervals; OR, odds ratio.
Chi‐squared or Fisher exact test.
Multivariate logistic regression adjusting for virus type, gender, age, year of admission, coinfections, vaccination status, and presence of comorbidity.
3.3. Seasonality and time trends
The yearly distribution (Figures 1 and 2) showed a progressive increase in the incidence of influenza infections from 2012 to 2017. The seasonality (Figure 3) showed an increased prevalence from October to March.
3.4. Vaccination status
Only 142 children (10%) had received prior seasonal influenza vaccine (Table 1). The progressively increasing prevalence of influenza infection over the study period seemed to mirror the modest but progressive rise from 4% to 14% in the proportion of vaccinated children (Figure 1).
3.5. Comorbidities
The majority of children with influenza had no underlying comorbidities (n = 898, 64%). The remaining had underlying medical conditions (Table 4), of which asthma was the commonest (12%). Prematurity, underlying respiratory, neurologic, or genetic comorbidities were more prevalent in children infected with influenza A than B, but that difference was not significant in the multivariate regression model (Table 4).
TABLE 4.
Comorbidities in 1392 children with proven influenza infection. Results expressed as numbers and percentage
| All patients 1392 (100%) | Influenza A 1144 (82%) | Influenza B 248 (18%) | OR (95% CI) a | P value | |
|---|---|---|---|---|---|
| Prematurity | 65 (5) | 62 (5) | 3 (1) | 0.21 (0.04, 0.66) | .004 |
| Respiratory | 208 (15) | 182 (13) | 26 (2) | 0.62 (0.38, 0.96) | .0001 |
| Asthma | 170 (12) | 145 (13) | 25 (10) | ||
| Cystic fibrosis | 3 (0.2) | 3 (0.2) | 0 (0) | ||
| Chronic lung disease | 9 (0.6) | 8 (0.7) | 1 (0.4) | ||
| Primary ciliary dyskinesia | 1 (0.1) | 1 (0.1) | 0 (0) | ||
| Tracheostomy | 25 (1.8) | 25 (2.2) | 0 (0) | ||
| Cardiac | 31 (2) | 28 (2.4) | 3 (1) | 0.48 (0.09, 1.6) | .2 |
| Neurologic | 51 (4) | 50 (4) | 1 (0.4) | 0.08 (0.002, 0.5) | .002 |
| Genetic or metabolic | 107 (8) | 99 (9) | 8 (3) | 0.35 (0.14, 0.73) | .003 |
| Immunocompromised | 35 (2.5) | 29 (2.5) | 6 (2.4) | 0.95 (0.32, 2.37) | .9 |
Abbreviations: CI, confidence intervals; OR, odds ratio.
Chi‐squared or Fisher exact test.
3.6. Management
Oxygen therapy and mechanical ventilation were more often required in influenza A than influenza B infections (Table 5). Of all the cases, Oseltamivir was administered to 731 children (52%) in the first 48 hours of presentation, and antibiotics to 513 (37%), of whom 247 had either pneumonia or otitis media and the others much less frequent conditions such as tonsillitis, sinusitis, or multiorgan failure. Oseltamivir in combination with antibiotics was administered more often with influenza A than B infection, but without a significant difference in the logistic regression model. Admission to the pediatric intensive care unit (PICU) was necessary for 116 children (8%), with 120 (7.8%) requiring mechanical ventilation or high‐frequency ventilation.
TABLE 5.
Treatment modalities for 1392 children with proven influenza infection
| All patients 1392 (100%) | Influenza A 1144 (82%) | Influenza B 248 (18%) | OR (95% CI) a | P value | Adjusted OR (95% CI) b | P value | |
|---|---|---|---|---|---|---|---|
| Required intensive care | 116 (8) | 111 (10) | 5 (2) | 0.19 (0.06, 0.46) | <.001 | 0.30 (0.12, 0.79) | .06 |
| Oxygen therapy | 192 (14) | 187 (16) | 5 (2) | 0.10 (0.03, 0.25) | <.001 | 0.15 (0.06, 0.39) | <.001 |
| High‐frequency ventilation | 11 (0.8) | 11 (0.9) | 0 (0) | 0 (0, 1.6) | .12 | 1 (NA) | NA |
| Mechanical ventilation | 109 (7) | 108 (9) | 1 (0.4) | 0.03 (0.001, 0.2) | <.001 | 0.06 (0.009, 0.46) | .007 |
| Oseltamivir administration | 1010 (73) | 845 (73) | 165 (66) | 0.70 (0.52, 0.95) | .02 | 0.76 (0.61, 0.95) | .016 |
| Within 48 hours | 731 (52) | 603 (52) | 128 (51) | ||||
| Later administration | 279 (20) | 242 (21) | 37 (15) | ||||
| Antibiotherapy | 513 (37) | 439 (38) | 74 (30) | 0.68 (0.50, 0.93) | .01 | 0.84 (0.61, 1.15) | .27 |
Note: Results expressed as numbers and percentage.
Abbreviations: CI, confidence intervals; NA, not applicable; OR, odds ratio.
Chi‐squared or Fisher exact test.
Multivariate logistic regression adjusting for virus type, gender, age, year of admission, coinfections, vaccination status and presence of comorbidity.
3.7. Complications
Bacterial pneumonia was diagnosed in 165 children (12%) and another 82 (6%) had AOM. Although ARDS, acute renal insufficiency, and multiorgan failure were more common with influenza A than B, this did not reach statistical significance in the multivariate regression model (P < .05) (Table 6). The prevalence of ARDS, carditis, acute renal insufficiency, and multiorgan failure showed a significant trend with the increasing number of coinfecting pathogens (Table 7 and Figure 4). However, the rate of complications did not differ significantly between age groups and showed no trend (Table 8 and Figure 5).
TABLE 6.
Complications in 1392 children with proven Influenza infection
| All patients 1392 (100%) | Influenza A 1144 (82%) | Influenza B 248 (18%) | OR (95% CI) a | P value | Adjusted OR (95% CI) b | P value | |
|---|---|---|---|---|---|---|---|
| Acute respiratory distress syndrome | 48 (3) | 47 (4) | 1 (0.4) | 0.09 (0.002, 0.56) | .003 | 0.15 (0.02, 1.5) | .06 |
| Bacterial pneumonia | 165 (12) | 143 (12) | 22 (9) | 0.7 (0.4, 1.1) | .11 | 0.91 (0.55, 1.51) | .73 |
| Acute otitis media | 82 (6) | 62 (5) | 20 (8) | 1.5 (0.85, 2.63) | .10 | 1.47 (0.86, 2.52) | .15 |
| Croup | 9 (0.6) | 8 (0.7) | 1 (0.4) | 0.57 (0.01, 4.32) | .59 | 0.50 (0.06, 4.11) | .52 |
| Carditis | 4 (0.3) | 3 (0.3) | 1 (0.4) | 1.54 (0.03, 19.2) | .70 | 3.90 (0.36, 41.5) | .26 |
| Toxic shock syndrome | 2 (0.1) | 1 (0.09) | 1 (0.4) | 4.62 (0.06, 363.5) | .23 | 10.99 (0.58, 206.45) | .11 |
| Myositis | 7 (0.5) | 5 (0.4) | 2 (0.8) | 1.85 (0.17, 11.4) | .45 | 1.68 (0.31, 9.1) | .54 |
| Acute kidney insufficiency | 20 (1.4) | 20 (1.8) | 0 (0) | 0 (0, 0.87) | .03 | NC | NC |
| Multiorgan failure | 19 (1.4) | 19 (1.7) | 0 (0) | 0 (0, 0.92) | .04 | NC | NC |
| Encephalitis | 5 (0.3) | 5 (100) | 0 (0) | 0 (0, 3.54) | .29 | NC | NC |
| Febrile convulsions | 20 (1.4) | 17 (1.5) | 3 (1.2) | 0.81 (0.15, 2.83) | .74 | 0.93 (0.26, 3.26) | .91 |
Note: Results expressed as numbers and percentage.
Abbreviations: CI, confidence intervals; NC, could not be calculated; OR, odds ratio.
Chi‐squared or Fisher exact test.
Multivariate logistic regression adjusting for virus type, gender, age, year of admission, coinfections, vaccination status and presence of comorbidity.
TABLE 7.
Coinfections and disease severity in 1392 children with proven influenza infection
| Number of coinfecting pathogens | ||||
|---|---|---|---|---|
| 0 n = 1245 | 1 n = 133 | 2 n = 14 | P value a | |
| Acute respiratory distress syndrome | 33 (2.6) [0.02] | 14 (10.5) [0.11] | 1 (7.1) [0.07] | <.001 |
| Toxic shock syndrome | 1 (0.08) [0.001] | 1 (0.7) [0.007] | 0 (0) [0] | .12 |
| Encephalitis | 3 (0.2) [0.002] | 2 (1.5) [0.015] | 0 (0) [0] | .06 |
| Carditis | 1 (0.08) [0.001] | 3 (2.2) [0.02] | 0 (0) [0] | .003 |
| Renal insufficiency | 13 (1.0) [0.01] | 7 (5.2) [0.05] | 0 (0) [0] | .002 |
| Multiorgan failure | 12 (0.9) [0.01] | 7 (5.2) [0.05] | 0 (0) [0] | .001 |
| Intensive care admission | 73 (5.8) [0.06] | 37 (27.8) [0.38] | 6 (42.8) [0.75] | <.001 |
| Oxygen therapy | 119 (9.5) [0.10] | 64 (48.1) [0.92] | 9 (64.3) [1.8] | <.001 |
| High‐frequency ventilation | 5 (0.4) [0.004] | 6 (4.5) [0.04] | 0 (0) [0] | <.001 |
| Mechanical ventilation | 67 (5.4) [0.05] | 36 (27.1) [0.37] | 6 (42.8) [0.75] | <.001 |
| Death from any cause | 13 (1.0) [0.01] | 8 (6.0) [0.06] | 1 (7.1) [0.07] | <.001 |
| Death from Influenza infection | 9 (0.7) [0.007] | 3 (2.2) [0.02] | 1 (7.1) [0.07] | .05 |
Note: Results expressed as numbers (percentage) and odds of outcome.
Chi‐squared test for trend: a significant trend exists when the odds of each outcome increase with increasing number of coinfecting pathogens.
FIGURE 4.
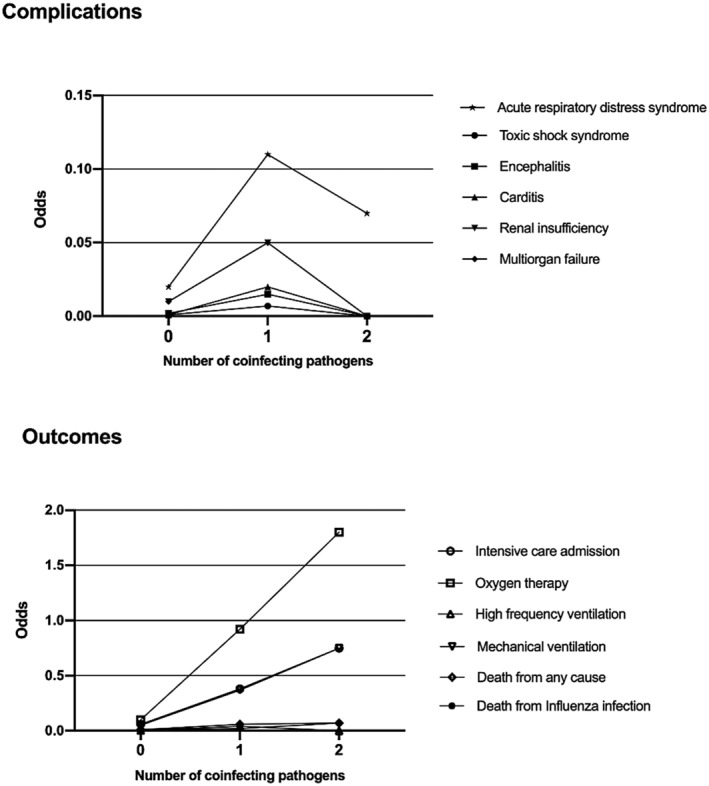
Complications and outcomes by number of coinfecting pathogens
TABLE 8.
Complications and outcomes by age in 1392 children with proven Influenza infection
| Age group | |||||
|---|---|---|---|---|---|
| Neonates n = 38 | Infants n = 343 | Children n = 948 | Adolescents n = 63 | P value a | |
| Admission to hospital | 32 (84.2) [5.3] | 152 (44.3) [0.8] | 266 (28.0) [0.39] | 17 (26.9) [0.37] | <.001 |
| Acute respiratory distress syndrome | 4 (10.5) [0.11] | 15 (4.4) [0.04] | 25 (2.6) [0.03] | 4 (6.3) [0.06] | .08 |
| Toxic shock syndrome | 0 (0) [0] | 1 (0.3) [0.003] | 1 (0.11) [0.001] | 0 (0) [0] | .77 |
| Encephalitis | 0 (0) [0] | 3 (0.9) [0.009] | 2 (0.2) [0.002] | 0 (0) [0] | .18 |
| Carditis | 0 (0) [0] | 2 (0.6) [0.006] | 2 (0.2) [0.002] | 0 (0) [0] | .39 |
| Renal insufficiency | 2 (5.2) [0.05] | 6 (1.7) [0.018] | 12 (1.3) [0.012] | 0 (0) [0] | .057 |
| Multiorgan failure | 0 (0) [0] | 9 (2.6) [0.026] | 10 (1.0) [0.01] | 0 (0) [0] | .09 |
| Intensive care admission | 12 (31.6) [0.46] | 36 (10.5) [0.11] | 62 (6.5) [0.07] | 6 (9.5) [0.10] | <.001 |
| Oxygen therapy | 28 (73.7) [2.8] | 63 (18.4) [0.22] | 94 (9.9) [0.11] | 7 (11.11) [0.12] | <.001 |
| High‐frequency ventilation | 2 (5.2) [0.05] | 6 (1.7) [0.017] | 3 (0.3) [0.003] | 0 (0) [0] | <.001 |
| Mechanical ventilation | 17 (44.7) [0.80] | 35 (10.2) [0.11] | 51 (5.4) [0.05] | 6 (9.5) [0.04] | <.001 |
| Death from any cause | 2 (5.2) [0.05] | 7 (2.0) [0.02] | 13 (1.4) [0.014] | 0 (0) [0] | .04 |
| Death from Influenza infection | 1 (2.6) [0.03] | 3 (0.9) [0.008] | 9 (0.9) [0.009] | 0 (0) [0] | .42 |
Note: Results expressed as numbers (percentage) and [odds of outcome].
Chi‐squared test for trend: a significant trend exists when the odds of each outcome increase with increasing age).
FIGURE 5.

Complications and outcomes by age
3.8. Outcomes
There was no difference in hospital admissions between the vaccination status (Table 2). Neither the need for oxygen therapy, admission to intensive care unit, mechanical or high‐frequency ventilation, nor death rate from influenza infection or death from any cause showed a significant trend with increasing number of coinfecting pathogens (Table 7, Figure 4). The prevalence of admission to hospital, oxygen therapy, admission to intensive care unit, need for mechanical or high‐frequency ventilation, or death from any cause showed a significant trend with increasing age (Table 8, Figure 5).
In‐hospital death of any cause occurred in 22 children (1.6%), all infected with influenza A (P = .02), but there was no difference between vaccinated children (1.4%) and the others (1.6%) (Tables 2 and 9). Death directly attributed to influenza infection occurred in 13 children (0.9%).
TABLE 9.
Complications and outcomes by vaccination status and age in 1392 children with proven Influenza infection
| Age group | |||||
|---|---|---|---|---|---|
| Neonates n = 38 (0 vaccinated, 0%) | Infants n = 343 (10 vaccinated, 3%) | Children n = 948 (121 vaccinated, 13%) | Adolescents n = 63 10 vaccinated, 16%) | P value a | |
| Admission to hospital | NA | 1.26 (0.28, 5.60) | 1.55 (1.0, 2.36) | 3.41 (0.65, 17.33) | .009 |
| Acute respiratory distress syndrome | 0 (0, NA) | 6.15 (0.57, 35.15) | 0.58 (0.06, 2.43) | 1.85 (0.03, 25.9) | .74 |
| Toxic shock syndrome | NA | NA | NA | NA | .67 |
| Encephalitis | NA | 0 (0, 46.43) | 6.8 (0.08, 540.9) | NA | .23 |
| Carditis | NA | 0 (0, 69.5) | 0 (0, 13.19) | NA | .55 |
| Renal insufficiency | NA | 7.2 (0.13, 74.9) | 0 (0, 2.17) | NA | .54 |
| Multiorgan failure | NA | 0 (0, 14.7) | 0.75 (0.017, 5.55) | NA | .64 |
| Intensive care admission | NA | 2.19 (0.21, 11.6) | 1.34 (0.59, 2.76) | 7.14 (0.76, 61.7) | .04 |
| Oxygen therapy | NA | 1.11 (0.11, 5.78) | 1.72 (0.93, 3.05) | 5.25 (0.61, 37.6) | .01 |
| High‐frequency ventilation | NA | 7.28 (0.13, 74.9) | 0 (0, 8.8) | NA | .59 |
| Mechanical ventilation | NA | 0.97 (0.02, 7.43) | 0.90 (0.31, 2.19) | 7.14 (0.76, 61.7) | .44 |
| Death from any cause | NA | 6.0 (0.12, 58.4) | 0.56 (0.013, 3.9) | NA | .94 |
| Death from Influenza infection | NA | 0 (0, 46.4) | 0 (0, 2.90) | NA | .23 |
Note: Results expressed OR of outcome (95% CI).
Abbreviations: NA, could not be calculated; OR, odds ratio.
Chi‐squared test.
Of the cases that required admission, 63% stayed in the hospital for less than a week and 37% stayed for more than a week, and there was no difference between vaccinated children and the others (Table 2).
4. DISCUSSION
In this 6‐year study of 1392 children with laboratory‐confirmed influenza, the infection was more common between 1 and 11 years of age, similar to studies from England and United States. 12 , 14 The most common symptoms were fever, cough and runny nose, consistent with previous studies. 1 One‐third required hospital admission. The peak season was from October to March, similar to other studies in USA. 4 The overall prevalence of influenza A was higher than influenza B. The commonest underlying comorbidity was asthma, and the two commonest complications were pneumonia and AOM. Influenza can still cause severe disease in young children, even in those without underlying medical risk factors.
The OR of influenza infection by sex was not statistically significant, contrary to other studies where the greater humoral and cell‐mediated immune responses of females to viral antigens were postulated to be beneficial against infectious diseases. 18 Bronchial asthma was the most commonly associated underlying risk factor accounting for 12% of all admissions, confirming previous studies emphasizing the burden of influenza on asthmatic children. 10 We also found a large number of patients (8%) with underlying inborn errors of metabolism, which can be attributed to the fact that our center is the regional referral center for metabolic diseases in the country.
A previously unreported aspect is the need for intensive care in children hospitalized with influenza. In our study, 8% of admitted children required PICU admission, most frequently due to respiratory failure and the need for mechanical ventilation. The majority of these children were having underlying medical conditions such as chronic lung disease, congenital heart disease, or immunosuppressive disorders. Although this result is comparable to reports from other countries, such as Malaysia and Spain, where the ICU admission rates were 9.1% and 10% respectively, 19 , 20 it was considerably lower than other countries, such as the United States where it was as high as 20% to 26%. 21 This might be attributed to the comorbid conditions that increase the risk of ICU admission. The high mortality rate in the reports from the United States is very likely attributed to the H1N1 pandemic. 14
In our study, the rates of serious complications in children were similar to other studies. 14 Bacterial pneumonia was the most common complication accounting for 12% of cases, followed by AOM in 8% of the patients. The prevalence of other complications, such as acute kidney injury, febrile convulsion, croup, myositis, carditis, encephalitis, toxic shock syndrome, and multiorgan failure, was consistent with previous reports from the region. 21 The majority of admitted patients stayed in hospital less than 7 days, similarly to other regional studies. 22 The death rate (3%) in this cohort was also consistent with previous reports.
We found that only 10% of the studied children with proven influenza infection were vaccinated. This is perhaps due to the fact that, during the study period, influenza vaccine in the United Arab Emirates was only recommended, but not mandated, for children with comorbidities such as bronchial asthma, cystic fibrosis, or inborn errors of metabolism. The vaccine used during that period was the trivalent vaccine that included the following strains H1N1, H3N2, and Colorado (influenza B strain).
There are some limitations to this study. As it was a single tertiary center retrospective descriptive study limited to children presenting to the ED or hospitalized, the results should be interpreted with caution, and the findings may not be generalized to other settings. In addition, we did not have accurate data on individual seasonal influenza vaccination history for many children, as some were only available from verbal reports from the parents, neither did we know if the influenza vaccination was provided in the current season or much earlier. Furthermore, molecular epidemiology to delineate the subtype and genetics analysis of the isolated viruses could not be performed. Finally, detailed healthcare cost analysis was not performed to give quantitative costs of the disease burden.
A strength of the study is that, with viral testing being mandated for all hospitalized children with respiratory symptoms during the study period, it includes only laboratory‐proven influenza infection. Confounding was reduced by excluding other causes of ARIs, and the ascertainment of cases was most likely complete with little or no under‐reporting.
Although the reasons for the observed significant increase in influenza infections during later years are most likely multifactorial, the need to vaccinate all children with the seasonal influenza vaccine is clear.
5. CONCLUSION
Despite the widespread availability of influenza vaccines and antivirals, the global burden of influenza‐related disease remains high. As no similar studies had been previously performed in the region, our findings serve as a benchmark for regional comparison. Influenza infection remains a major problem for all children, and not exclusively for those with underlying risk factors. We therefore recommend incorporating the influenza vaccine into our national vaccination program. Health education programs should also strongly encourage all parents to immunize their children against influenza.
FUNDING
This research did not receive any specific grant from funding agencies in the public or commercial sectors.
CONFLICT OF INTEREST
All the authors have no conflict of interest to declare.
AUTHOR CONTRIBUTION
Conceptualization: Alya AlAli, Najla AlKuwaiti.
Data Curation: Alya AlAli, Hassib Narchi.
Formal Analysis: Hassib Narchi.
Investigation: Alya AlAli, Najla AlKuwaiti, Eiman AlKaabi, Salwa AlKaabi, Aysha AlKaabi, Hassib Narchi.
Methodology: Hassib Narchi.
Project Administration: Alya AlAli, Najla AlKuwaiti, Eiman AlKaabi, Salwa AlKaabi, Aysha AlKaabi, Hassib Narchi.
Resources: Alya AlAli, Najla AlKuwaiti.
Supervision: Alya AlAli, Najla AlKuwaiti, Hassib Narchi.
Validation: Hassib Narchi.
Visualization: Alya AlAli, Najla AlKuwaiti.
Writing—Original Draft Preparation: Alya AlAli, Najla AlKuwaiti, Eiman AlKaabi, Salwa AlKaabi, Aysha AlKaabi, Hassib Narchi.
Writing—Review and Editing: Alya AlAli, Najla AlKuwaiti, Salwa AlKaabi, Hassib Narchi.
All authors have read and approved the final version of the manuscript.
Alya AlAli had full access to all of the data in this study and takes complete responsibility for the integrity of the data and the accuracy of the data analysis.
TRANSPARENCY STATEMENT
Alya AlAli affirms that this manuscript is an honest, accurate, and transparent account of the study being reported; that no important aspects of the study have been omitted; and that any discrepancies from the study as planned (and, if relevant, registered) have been explained.
ETHICS STATEMENT
Ethical approval was obtained from the institution Human Research Ethics Committee. Informed consent was waived as it was a retrospective electronic medical chart review; the collected data were anonymized with all patients' identifiers removed.
ACKNOWLEDGEMENTS
We are grateful to the participating children, their families, and all the staff involved in their care. Without them, this study would not have been possible.
Al Ali A, Al Kuwaiti N, Al Kaabi E, Al Kaabi S, Al Kaabi A, Narchi H. Clinical spectrum, risk factors, and outcomes of children with laboratory‐confirmed influenza infection managed in a single tertiary hospital: A 6‐year retrospective cohort study. Health Sci Rep. 2021;4:e432. doi: 10.1002/hsr2.432
DATA AVAILABILITY STATEMENT
The authors confirm that the data supporting the findings of this study are available within the article and/or its supplementary materials. All the data would be made available by the author upon a reasonable request.
REFERENCES
- 1. Nicholson KG, Wood JM, Zambon M. Influenza. Lancet. 2003;362(9397):1733‐1745. [DOI] [PMC free article] [PubMed] [Google Scholar]
- 2. Nair H, Brooks WA, Katz M, et al. Global burden of respiratory infections due to seasonal influenza in young children: a systematic review and meta‐analysis. Lancet. 2011;378(9807):1917‐1930. [DOI] [PubMed] [Google Scholar]
- 3. Lozano R, Naghavi M, Foreman K, et al. Global and regional mortality from 235 causes of death for 20 age groups in 1990 and 2010: a systematic analysis for the global burden of disease study 2010. Lancet. 2012;380(9859):2095‐2128. [DOI] [PMC free article] [PubMed] [Google Scholar]
- 4. Centers for Disease C . Prevention. Influenza activity–United States, 2012–13 season and composition of the 2013–14 influenza vaccine. MMWR Morb Mortal Wkly Rep. 2013;62(23):473‐479. [PMC free article] [PubMed] [Google Scholar]
- 5. Blyth CC, Macartney KK, Hewagama S, et al. Influenza epidemiology, vaccine coverage and vaccine effectiveness in children admitted to sentinel Australian hospitals in 2014: the influenza complications alert network (FluCAN). Euro Surveill. 2016;21(30):30301. [DOI] [PubMed] [Google Scholar]
- 6. Kazakova A, Kakkola L, Ziegler T, et al. Pandemic influenza a(H1N1pdm09) vaccine induced high levels of influenza‐specific IgG and IgM antibodies as analyzed by enzyme immunoassay and dual‐mode multiplex microarray immunoassay methods. Vaccine. 2020;38(8):1933‐1942. [DOI] [PubMed] [Google Scholar]
- 7. Kalarikkal SM, Jaishankar GB. Influenza Vaccine. In: StatPearls [Internet]. Treasure Island (FL): Stat Pearls Publishing; 2021. [PubMed]
- 8. Han A, Poon JL, Powers JH 3rd, Leidy NK, Yu R, Memoli MJ. Using the influenza patient‐reported outcome (FLU‐PRO) diary to evaluate symptoms of influenza viral infection in a healthy human challenge model. BMC Infect Dis. 2018;18(1):353. [DOI] [PMC free article] [PubMed] [Google Scholar]
- 9. Thompson WW, Shay DK, Weintraub E, et al. Influenza‐associated hospitalizations in the United States. JAMA. 2004;292(11):1333‐1340. [DOI] [PubMed] [Google Scholar]
- 10. Newland JG, Laurich VM, Rosenquist AW, et al. Neurologic complications in children hospitalized with influenza: characteristics, incidence, and risk factors. J Pediatr. 2007;150(3):306‐310. [DOI] [PubMed] [Google Scholar]
- 11. Sugaya N, Shinjoh M, Mitamura K, Takahashi T. Very low pandemic influenza a (H1N1) 2009 mortality associated with early neuraminidase inhibitor treatment in Japan: analysis of 1000 hospitalized children. J Infect. 2011;63(4):288‐294. [DOI] [PubMed] [Google Scholar]
- 12. Cromer D, van Hoek AJ, Jit M, Edmunds WJ, Fleming D, Miller E. The burden of influenza in England by age and clinical risk group: a statistical analysis to inform vaccine policy. J Infect. 2014;68(4):363‐371. [DOI] [PubMed] [Google Scholar]
- 13. Khor CS, Sam IC, Hooi PS, Quek KF, Chan YF. Epidemiology and seasonality of respiratory viral infections in hospitalized children in Kuala Lumpur, Malaysia: a retrospective study of 27 years. BMC Pediatr. 2012;12:32. [DOI] [PMC free article] [PubMed] [Google Scholar]
- 14. Descalzo MA, Clara W, Guzman G, et al. Estimating the burden of influenza‐associated hospitalizations and deaths in Central America. Influenza Other Respir Viruses. 2016;10(4):340‐345. [DOI] [PMC free article] [PubMed] [Google Scholar]
- 15. Cicchetti A, Ruggeri M, Gitto L, Mennini FS. Extending influenza vaccination to individuals aged 50‐64: a budget impact analysis. Int J Technol Assess Health Care. 2010;26(3):288‐293. [DOI] [PubMed] [Google Scholar]
- 16. Jeon JH, Han M, Chang HE, et al. Incidence and seasonality of respiratory viruses causing acute respiratory infections in the northern United Arab Emirates. J Med Virol. 2019;91(8):1378‐1384. [DOI] [PMC free article] [PubMed] [Google Scholar]
- 17. Pediatric Acute Lung Injury Consensus Conference G . Pediatric acute respiratory distress syndrome: consensus recommendations from the pediatric acute lung injury consensus conference. Pediatr Crit Care Med. 2015;16(5):428‐439. [DOI] [PMC free article] [PubMed] [Google Scholar]
- 18. Torcia MG, Nencioni L, Clemente AM, et al. Sex differences in the response to viral infections: TLR8 and TLR9 ligand stimulation induce higher IL10 production in males. PLoS One. 2012;7(6):e39853. [DOI] [PMC free article] [PubMed] [Google Scholar]
- 19. Sam IC, Abdul‐Murad A, Karunakaran R, et al. Clinical features of Malaysian children hospitalized with community‐acquired seasonal influenza. Int J Infect Dis. 2010;14(Suppl 3):e36‐e40. doi: 10.1016/j.ijid.2009.10.005 [DOI] [PubMed] [Google Scholar]
- 20. Rodriguez R. Child hospital admissions associated with influenza virus infection in 6 Spanish cities (2014‐2016). An Pediatr. 2018;90(2):86‐93. doi: 10.1016/j.anpedi.2018.06.012 [DOI] [PubMed] [Google Scholar]
- 21. Owayed AF, Husain EH, Al‐Khabaz A, Al‐Qattan HY, Al‐Shammari N. Epidemiology and clinical presentation of pandemic influenza a (H1N1) among hospitalized children in Kuwait. Med Princ Pract. 2012;21(3):254‐258. [DOI] [PubMed] [Google Scholar]
- 22. Al‐Awaidy S, Hamid S, Al Obaidani I, et al. The burden of influenza‐associated hospitalizations in Oman, January 2008‐June 2013. PLoS One. 2015;10(12):e0144186. [DOI] [PMC free article] [PubMed] [Google Scholar]
Associated Data
This section collects any data citations, data availability statements, or supplementary materials included in this article.
Data Availability Statement
The authors confirm that the data supporting the findings of this study are available within the article and/or its supplementary materials. All the data would be made available by the author upon a reasonable request.