Abstract
Carbon dots have garnered attention for their strong multi-color luminescence properties and unprecedented biocompatibility. Despite significant progress in the recent past, a fundamental understanding of their photoluminescence and structure-properties relationships, especially at the bulk vs. single-particle level, has not been well established. Here we present a comparative study of bulk- and single-particle properties as a function of precursor composition and reaction temperature. The synthesis and characterization of multicolored inherently functionalized carbon dots were achieved from a variety of carbon sources, and at synthesis temperatures of 150 °C and 200 °C. Solvothermal synthesis at 200 °C led to quantum yields as high as 86%, smaller particle sizes, and a narrowed fluorescence emission, while synthesis at 150 °C resulted in a greater UV–visible absorbance, increase in nanoparticle stability, red-shifted fluorescence, and a greater resistance to bulk photobleaching. These results suggest the potential for synthesis temperature to be utilized as a simple tool for modulating carbon dot photophysical properties. Single-particle imaging resolved that particle brightness was determined by both the instantaneous intensity and the on-time duty cycle. Increasing the synthesis temperature caused an enhancement in blinking frequency, which led to an increase in on-time duty cycle in three out of four precursors.
1. Introduction
Carbon dots (CDots) and carbon nanoparticles (CNPs) have generated interest due to their fluorescent properties and improved biocompatibility compared to other fluorescent nanoparticles such as semiconductor quantum dots [1–3]. The fluorescent properties of these particles are believed to be caused by two properties: the sp2 characteristic of the CDot/CNP core, and the surface state’s extrinsic fluorescence [4]. Together, these two properties contribute to a bandgap, transitions within which lead to fluorescence [4]. CDot fluorescence has also been attributed to defects on the surface of these particles [5].
These nanoparticles have been used in a variety of applications in cellular and in-vivo biological imaging, biosensing, and drug and gene delivery [6–11]. Bioimaging applications have included in-vivo imaging of gliomas [6] and sentinel lymph node mapping in mice [7], as well carbon dots injected for other contrast applications [8–11]. Carbon dots have also been used in ex-vivo imaging for bone microcrack detection [12], as well as multicolor imaging [13], live-cell imaging [14], and intracellular tracking [15]. Sensing applications of carbon dots have included examples such as pH sensing [16] and the detection of metals and hormones [17–19]. Carbon dots have also been utilized in delivering cancer drugs [20], as well as in the non-viral delivery of DNA for therapeutic applications [21,22].
A variety of surface functionalization techniques have been explored in order to enhance carbon dot brightness and tune emission wavelengths for bioimaging applications. These include methods such as surface passivation with polymers and other molecules [23,24], and the incorporation of divalent cations and organic solvents during synthesis [25]. Other reports have demonstrated a relationship between the carbon source functional groups and nanoparticle surface functional groups [17,26,27]. Additionally, there has been much interest in producing carbon nanoparticles with high quantum yields [28–30], as well as utilizing these nanoparticles in single-particle imaging applications [31–33].
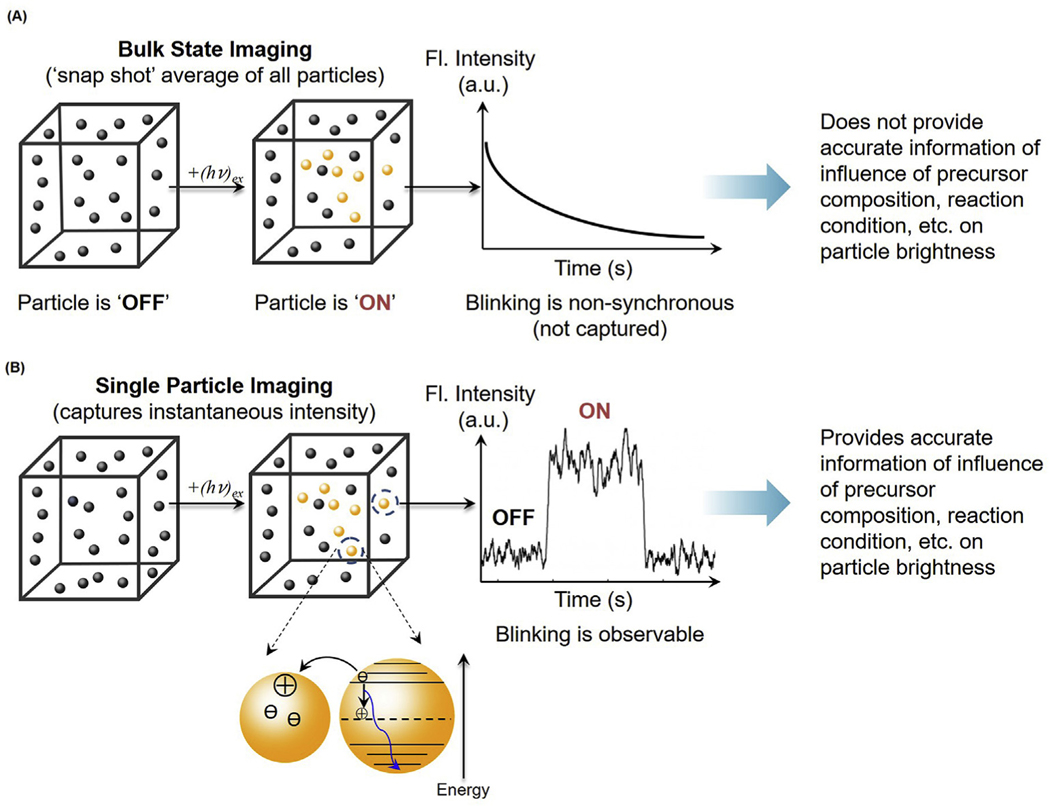
While other particle types such as semiconductor quantum dots have been studied extensively at the single-particle scale [34–39], there is a need for a fundamental understanding of the effects of carbon nanoparticle composition and synthesis parameters on the photophysical properties of these nanoparticles, especially at the single-particle level. The goal of this work is to explore the effects of carbon source and synthesis temperature on the bulk and single-particle level photophysical properties (Fig. 1). To the best of our knowledge, there have been no previous reports that have explored this relationship. To this end, nanoparticles were synthesized using 4 different precursors and 2 synthesis temperatures. The precursors were chosen such that we evaluated both mono- and disaccharides, as well as α and β isomers, in addition to phosphate and carboxylate anionic functionalities. The synthesis temperatures were chosen such that one temperature was higher than, and the other was lower than, the boiling point of dimethylsulfoxide (DMSO).
Fig. 1.
Bulk state vs. single particle imaging. (A) Bulk state imaging provides a snap shot average of all particles in the sample. The particle blinking in the bulk sample is non-synchronous, leading to a lack of information about the influence of temperature and composition on particle brightness. (B) Single particle imaging captures information about the instantaneous intensity of individual particles, allowing for evaluation of particle brightness based on individual particle “on” and “off” characteristics.
2. Experimental section
2.1. Synthesis
CDots were synthesized using the solvothermal method. Although the solvothermal method is commonly used for carbon dot synthesis [40–42], our synthetic procedure differs in the selection of carbon sources and solvent ratio. α-D-Glucose 1-phosphate dipotassium salt hydrate, β-D-Glucosamine pentaacetate, D-glucuronic acid, and sucrose were separately utilized as the carbon sources. For each synthesis,100 mg of the carbon source was mixed with 200 μL of DMSO and 800 μL of water, and subsequently transferred to an autoclave holder. This ratio of DMSO to water was selected to aid in dissolution of the carbon sources while also allowing for the excess solvent to be evaporated during post-solvothermal processing. The holder was then placed in an oven at 200 °C or 150 °C for 8 h. The mixture was then removed, and the liquid was evaporated using a rotary evaporator. In some cases, the particles were placed under further vacuum after rotary evaporation to allow for the complete removal of the solvents. The CDots were then resuspended in 5 mL of water, and probe sonicated for 30 min, with an amplitude of 1, on time of 2 s, and off time of 1 s. CDots were then filtered with a 0.22 μm filter and stored at 4 °C.
For all experiments except the microscopy, samples were lyophilized, after which they were resuspended in water at a concentration of 1 mg/100 μL.
2.2. Transmission electron microscopy (TEM) imaging
TEM grids were prepared by dropcasting 2.5 μL of the undiluted liquid CDot solution on copper grids, and excess moisture was wicked away after 2 min. An acceleration voltage of 20 keV was used.
Nanoparticle size analysis was conducted in ImageJ. Images were smoothed, and contrast was adjusted as necessary for separation of nanoparticles from the background. The images were then made binary and analyzed using the “analyze particles” tool.
2.3. UV–visible (UV–Vis) and fluorescence spectroscopy
For UV-Vis measurements, 2 μL of the nanoparticle solution was diluted with 998 μL of water. The UV–Vis spectra were collected over the 230 nm–800 nm range. Fluorescence measurements were taken using an excitation wavelength of 365 nm and a gain of 70, with a measured emission range of 385 nm–850 nm. Sample volumes of 100 μL were used, and samples were not diluted for fluorescence measurements.
2.4. Quantum yield calculations
The quantum yield was calculated using the equation below, where represents quantum yield, I corresponds to the integrated fluorescence intensity, A corresponds to the absorbance at 365 nm, and η corresponds to the refractive index of the solvent. Quinine Sulfate in H2SO4 was used as the reference for quantum yield calculations. Absorbance and integrated fluorescence intensity values are given in Tables S2 and S3.
| (1) |
For α-D-gluc and β-D-gluc CDots at 200 °C, UV–vis spectra were recollected at a higher concentration (980 μL water: 20 μL CDots) due to their low absorbances, and quantum yield calculations were conducted using quinine sulfate at the same higher concentration as the reference.
2.5. Fourier transform infrared spectroscopy (FT-IR)
An aqueous suspension of the nanoparticles was dried onto IR-reflective glass slides. For each measurement 100 μm × 100 μm images were collected at 1 cm−1 spectral resolution with 64 scans per pixel and a 25 μm × 25 μm pixel size. Individual spectra were corrected for atmospheric contributions.
2.6. X-ray photoelectron spectroscopy (XPS)
XPS samples were prepared by drop-casting 50 μL of CDots on approximately 0.5 cm by 0.5 cm glass slides, allowing them to dry in a vacuum oven overnight, and then repeating the process until 2 layers had been drop-casted. XPS spectra were collected with Al Kα (1486.6 eV) radiation and were analyzed using CasaXPS software.
2.7. Zeta potential measurements
50 μL of CDots were diluted with 950 μL water for zeta potential measurements. Measurements were repeated 3 times for each nanoparticle type, with 10 or more runs conducted for each measurement.
2.8. Single-particle photobleaching experiments
Samples were prepared by drying 0.2 μL of CDot solutions on clean glass coverslips. Individual particles were detected as bright diffraction-limited spots. The sample was diluted in water so that 200 particles were detected within an 80 μm × 80 μm field of view. A home-built, objective-based total internal reflection fluorescence microscopy (TIRFM) system was used for single-particle imaging. An inverted microscope was equipped with a 100× oil immersion objective (100X, N.A. 1.49, oil immersion). A 488-nm continuous wavelength laser was used as the light source and the power was set at 1.5 mW at the back aperture of the objective. The incident light was directed through the objective via an exciter and a dual-band dichroic filter. The luminescence photons from individual CDots were collected by the same objective, passing an emitter and captured by an Electron Multiplying Charge Coupled Device (EMCCD) camera. A total of 8 min trajectory was acquired for each field of view. At least four replicates were measured for each sample. A home-written script was used to extract the number of particles for each frame. The bleaching curve was generated by plotting the normalized number of particles versus time. The curve was then fitted with a two-component exponential function. The photobleaching lifetime was extracted from the fitted values.
2.9. Bulk photobleaching
A droplet of 0.2 μL of CDot samples was applied to a clean coverslip. The coverslip was then kept in a clean biosafety cabinet for 10 min to allow the droplet to dry. Concentrations of each CDot sample were adjusted so that a layer formed on the surface. To measure the photostability of CDots, the coverslip was placed on a home-built TIRF microscope and the boundary of the dried smear of CDots was localized [43].
An inverted microscope equipped with a 100× oil immersion objective was used. The laser beam was then expanded, collimated to about 35 mm, and directed into the microscope by a lens (focal length = 400 mm). The incident light was directed through the objective via an exciter and a dual-band dichroic filter. The mean excitation power before the objective is 1.5 mW/cm2.
For each field of view, 2400 time-stamped images were taken with the exposure time of 200 ms per frame, which accounts for a total of 8 min of trajectory. The CDot signal (inside the boundary) and background (outside the boundary) were extracted by averaging a total of 100 × 100 pixels in the corresponding area. The net signal of CDots was calculated by subtracting the background from the gross CDot signal for each frame. The emission decaying curve was generated by normalizing the maximum net CDot signal to 1.0. A script was used to fit the normalized emission decaying curve with a two-component exponential function. The photobleaching lifetime was extracted from the fitted values.
2.10. Data analysis for single-particle photobleaching
A MATLAB (Version R2016a) code was generated from the built-in “Curve Fitting Tool” to fit the single-particle photobleaching trajectories. A two-component exponential function
| (2) |
gave the best fit, which generated two time constants, τ1 and τ2, as well as their respective weights and the goodness of fit (R2). Because the variance of the data is larger at the longer timescale than at the shorter timescale, the “Weighted Least Square” fit option was used and each data point was weighted by its variance.
2.11. Single-particle photoblinking analysis
Single-particle trajectories were segmented to define the “on” and “off” states based on the changepoint analysis [44,45]. The intensity threshold was defined as the mean of the segment with the lowest intensity plus three times the standard deviation of that segment (Mean + 3 σ). A segment of the trajectory whose intensity was above this threshold is defined as an “ON” state and its duration as ton. An “OFF” state refers to any segment whose intensity was below the threshold and its duration as toff. An array of ton and toff was collected from each trajectory and pooled for the same type of particle. The power-law distribution of ton and toff were generated by plotting the histogram of pooled data.
3. Results and discussion
3.1. Synthesis, particle size, and photophysical properties
CDots were obtained through the solvothermal synthesis method at 200 °C and 150 °C using α-D-glucose 1-phosphate dipotassium salt hydrate, β-D-glucosamine pentaacetate, D-glucuronic acid, and sucrose as the carbon sources, and a solution of DMSO and water as the liquid phase. After particle formation and evaporation of the liquid phase, the particles were resuspended in water. Further details are provided in the Materials & Methods section. These nanoparticles will henceforth be referred to as α-D-gluc, β-D-gluc, D-glucuronic acid or D-gluc, and Sucrose nanoparticles, respectively. TEM images (Fig. 2A) revealed a slight decrease in nanoparticle size (Table 1) as the synthesis temperature increased. α-D-gluc CDots had a size (average ± standard deviation) of 5 nm ± 3 nm at 200 °C and a size of 11 nm ± 2 nm at 150 °C, β-D-gluc CDots had sizes of 8 nm ± 4 nm and 10 nm ± 4 nm respectively, D-gluc CDots had sizes of 4 nm ± 1 nm and 22 nm ± 19 nm respectively, and Sucrose CDots had sizes of 8 nm ± 3 nm and 16 nm ± 11 nm respectively. Thus, synthesis at 200 °C typically resulted in nanoparticles small enough to be considered carbon dots, while the syntheses at 150 °C yielded some CDots in the below 10 nm range, and some particles that were slightly larger. The dependence of nanoparticle size on the synthesis temperature may have been caused by the boiling points of the solvents in the liquid phase. Water and DMSO do not form an azetrope, and DMSO has a boiling temperature of 189 °C. Thus, a synthesis temperature of 150 °C allows for only water to reach its boiling point, while a synthesis temperature of 200 °C allows both water and DMSO to reach their boiling points. Particles were formed in both cases due to water reaching its boiling point, but the boiling of both water and DMSO led to hindered growth, causing smaller nanoparticles to form at 200 °C.
Fig. 2.
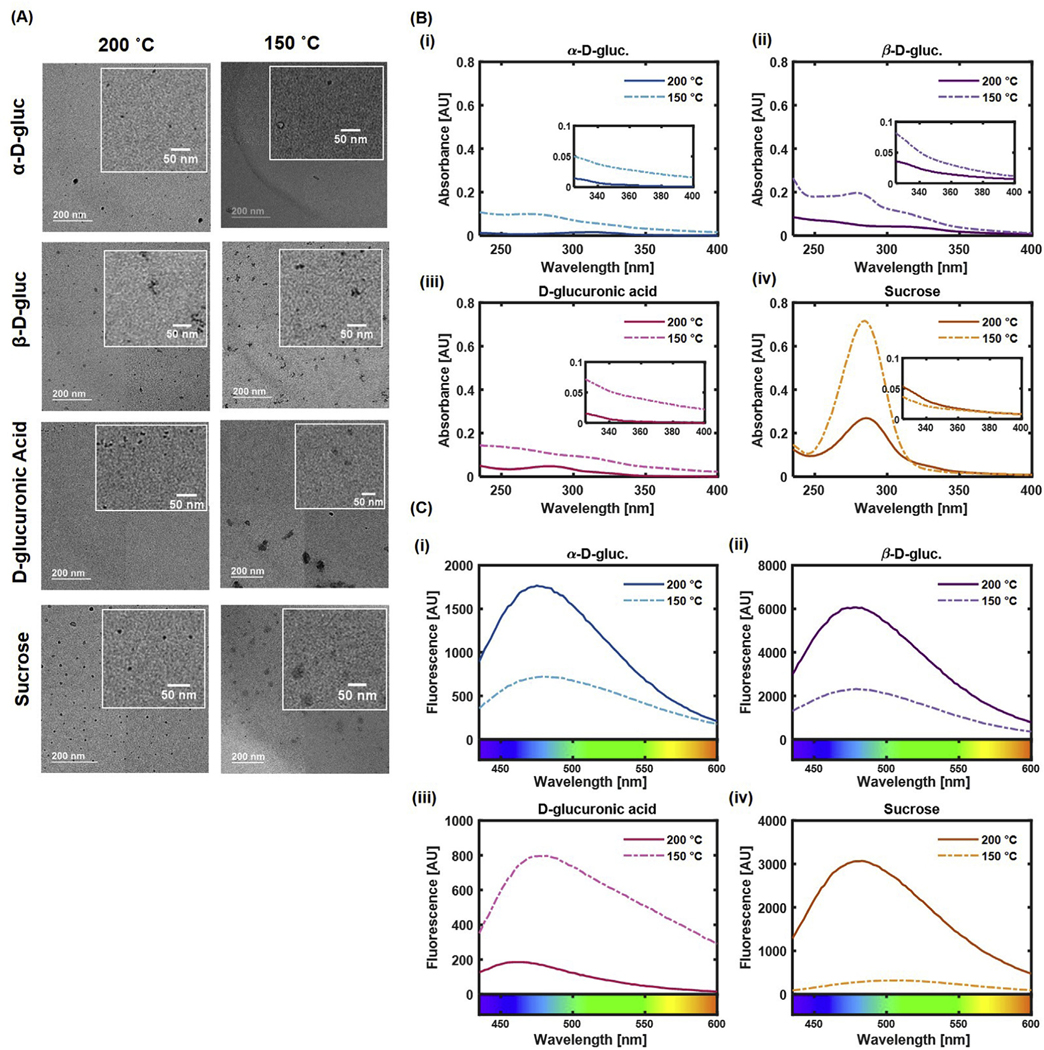
(A) TEM micrographs of CDots for each composition and synthesis temperature. Particles synthesized at 150 °C appear visually larger than those synthesized at 200 °C. Scale bar represents 200 nm. (B) UV–Vis spectra for CDots of each carbon source (i) α-D-gluc, (ii) β-D-gluc, (iii) D-glucuronic acid, and (iv) sucrose, at each synthesis temperature. A lower synthesis temperature led to higher absorbance. (C) Fluorescence spectra for CDots of each carbon source (i) α-D-gluc, (ii) β-D-gluc, (iii) D-glucuronic acid, and (iv) sucrose, at each synthesis temperature. An excitation wavelength of 365 nm was used. α-D-gluc, β-D-gluc, and Sucrose CDots had an increase in fluorescence intensity with an increase in synthesis temperature.
Table 1.
Nanoparticle size (average ± standard deviation) as determined by analysis of TEM images.
| Carbon Source | Synthesis Temperature | |
|---|---|---|
|
|
||
| 200 °C | 150 °C | |
|
| ||
| α-D-gluc | 5 nm ± 3 nm | 11 nm ± 2 nm |
| β-D-gluc | 8 nm ± 4 nm | 10nm ± 4nm |
| D-gluc | 4 nm ± 1 nm | 22 nm ± 19nm |
| Sucrose | 8 nm ± 3 nm | 16nm ± 11 nm |
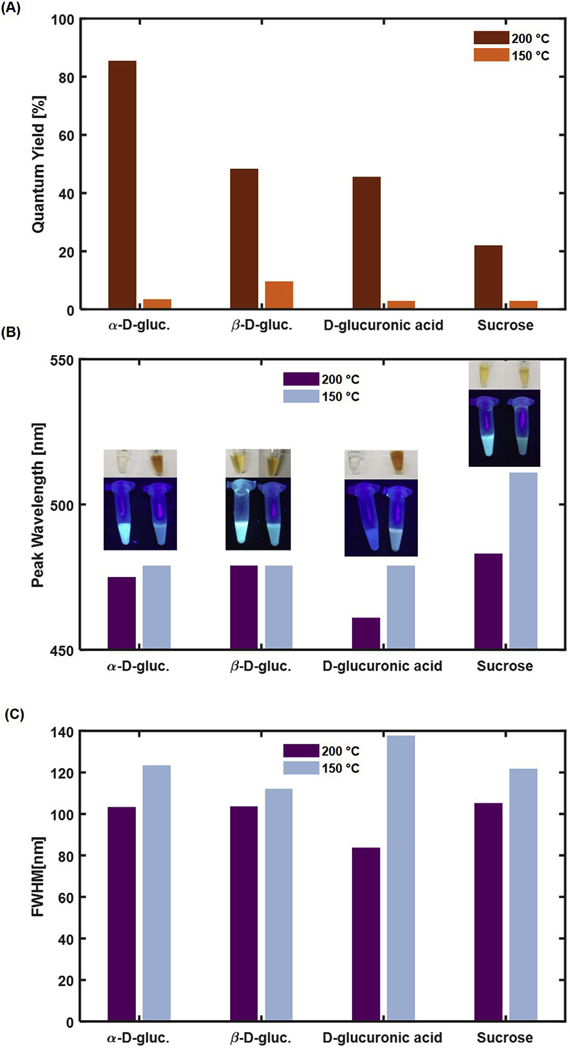
UV–Vis spectra collected for the CDots showed that those synthesized at 150 °C had higher absorbance than those synthesized at 200 °C for most carbon sources (Fig. 2B). This may have been caused by the larger size of the particles synthesized at 150 °C, which in turn led to a larger surface area over which absorbance could occur. When excited at 365 nm, α-D-gluc, β-D-gluc, and Sucrose CDots synthesized at 200 °C had a higher fluorescence intensity than their counterparts synthesized at 150 °C (Fig. 2C). This trend did not hold true for D-gluc CDots. However, quantum yield calculations showed a uniform trend across all carbon sources, with all carbon sources having a higher quantum yield when synthesized at 200 °C than when synthesized at 150 °C (Fig. 3A). α-D-gluc nanoparticles synthesized at 200 °C exhibited the highest quantum yield at 86%, one of the highest reported values for carbon dots [31–33]. β-D-gluc CDots synthesized at 200 °C had the next highest quantum yield at 48%, followed by D-glucuronic acid CDots at 45%, and Sucrose CDots at 22%. Quantum yield values for the CDots synthesized at 150 °C were much lower, ranging from 3% to 10%. Although the fluorescence intensity of D-gluc CDots synthesized at 150 °C is much higher than that of D-gluc CDots synthesized at 200 °C, the quantum yield of the higher temperature synthesis was found to be significantly higher than the low temperature product. This observation was presumably caused by the very high absorbance of the 150 °C D-gluc CDots compared to that of the 200 °C D-gluc CDots resulting in a discrepancy of the quantum yield measurements. Quantum yield depends on both the integrated fluorescence intensity (I) and the absorbance (A) as defined in Equation (1).
Fig. 3.
(A) Quantum yield for CDots at each synthesis temperature. Quantum yield was determined using quinine sulfate as a reference dye. A higher synthesis temperature was found to lead to higher quantum yields for all carbon sources evaluated. (B) Location of fluorescence peak for CDots at an excitation wavelength of 365 nm. α-D-gluc, D-gluc, and Sucrose CDots exhibit a red-shifted fluorescence for the lower synthesis temperature. (C) Full width at half maximum values calculated for fluorescence spectra collected at an excitation wavelength of 365 nm. A higher temperature leads to narrower fluorescence emission peaks.
The increase in quantum yield is a step change with respect to the boiling temperature of the solvent mixture. We anticipate that our future studies will focus on the effects of smaller temperature changes on CDot properties, but it is likely that the “optimized” temperature for each synthesis may depend not only on the solvent but also on the individual carbon source. We believe that the present work is adequate in providing a basis for studying CDot photophysical properties with respect to varying precursor composition. All quantum yields reported in this manuscript are from individual batches of nanoparticles, as is common in the literature [28,29].
The relationship between carbon dot quantum yield and temperature may have also been caused by differences in nanoparticle size. Greater nanoparticle size led to increased absorption due to higher surface area. However, this would also lead to a larger distance for absorbed light to travel from the core of the nanoparticle to its surface for emission, causing a reduced efficiency in emission of light. Quantum yield is defined as the ratio of photons emitted to the photos absorbed. The ability of larger particles to absorb light was enhanced, and their ability to emit light was reduced. Thus, the higher temperature synthesis conditions which led to the formation of smaller particles also led to them having a higher yield compared to particles of the same composition with a larger size.
Further analysis of the fluorescence spectra determined that a lower synthesis temperature led to a slightly red-shifted fluorescence for α-D-gluc, D-glucuronic acid, and Sucrose CDots (Fig. 3B). Synthesis temperature did not appear to have a large impact on β-D-gluc CDot peak emission wavelength. The full width at half maximum (FWHM) value for all CDots was found to decrease with a higher synthesis temperature, indicating narrower fluorescence emission peaks for CDots synthesized at 200 °C compared to those synthesized at 150 °C (Fig. 3C). This result suggests that synthesis at 150 °C may lead to the formation of multiple nanoparticle populations due to greater nanoparticle growth, forming a broad emission peak, while the synthesis at 200 °C leads to the formation of fewer or a single nanoparticle population with a narrower blue-shifted fluorescence emission due to the hindered nanoparticle growth caused by the presence of boiling DMSO during the synthesis.
3.2. Chemical characterization
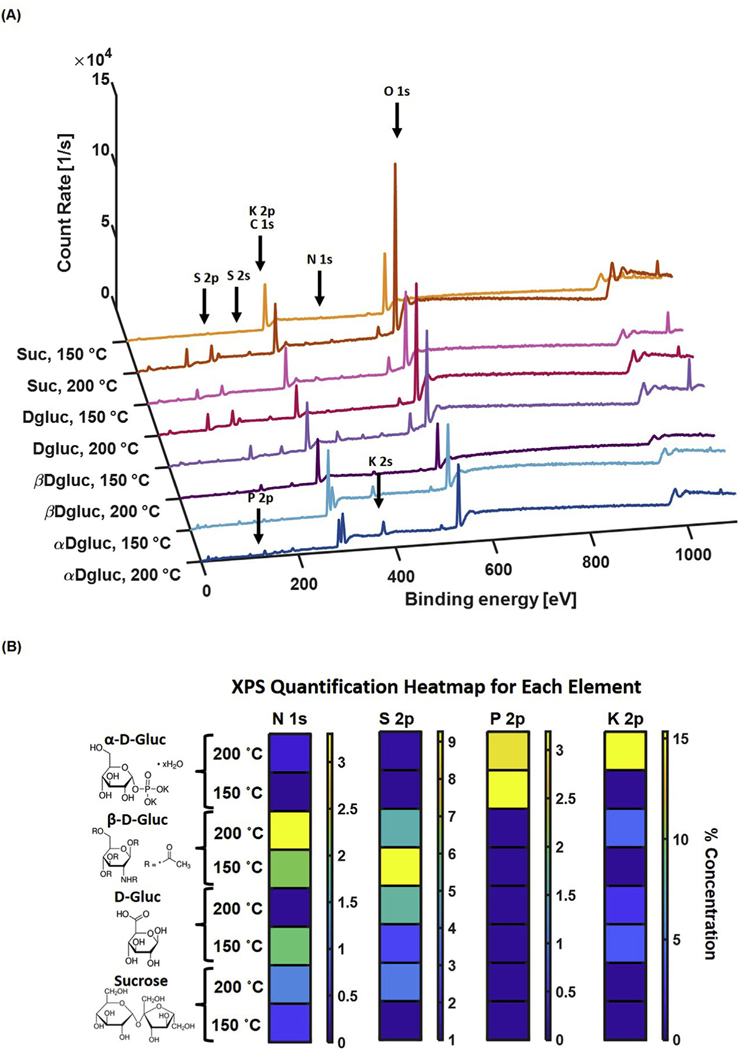
XPS confirmed the presence of carbon source functional groups on the surface of CDots (Fig. 4, Table S1). α-D-gluc CDots at both synthesis temperatures had an approximately 3% P 2p composition, while α-D-gluc CDots synthesized at 200 °C had an approximately 15% K 2p composition. β-D-gluc CDots for both synthesis temperatures had a 2–3% N 1s composition. All CDots had some S 2p in their composition even after evaporation of the DMSO-water phase and resuspension of nanoparticles in water alone, indicating the incorporation of sulfur from DMSO into the nanoparticles during the synthesis process. The DMSO content was comparable for particles of both the high and low synthesis temperature, which indicates that the removal of residual DMSO after nanoparticle formation was not affected by the synthesis temperature. Thus, the observations made about particle photophysical characteristics were not caused by the presence of DMSO in the final nanoparticle solution, but rather by the role of DMSO during the synthesis process. Inductively coupled plasma (ICP) analysis was conducted to determine whether the small amount of K that was present in the XPS spectra for β-D-gluc 200 °C, D-gluc 200 °C, and D-gluc 150 °C was indeed present within the samples. We found a respective K content of only 1.54%, 1.13%, and 1.93% in the above samples. This indicates that the identification of K in these XPS signals was likely due to background signal rather than the presence of K in the particles.
Fig. 4.
(A) XPS Spectra for CDots at each composition and synthesis temperature. (B) Heatmap representation of percent concentration of each element. N 1s was present in high concentrations in β-D-gluc CDots, while K 2p and P 2p were present in high concentrations in α-D-gluc CDots. S 2p was present in many of the nanoparticle compositions, indicating possible incorporation of sulfur from DMSO in CDots.
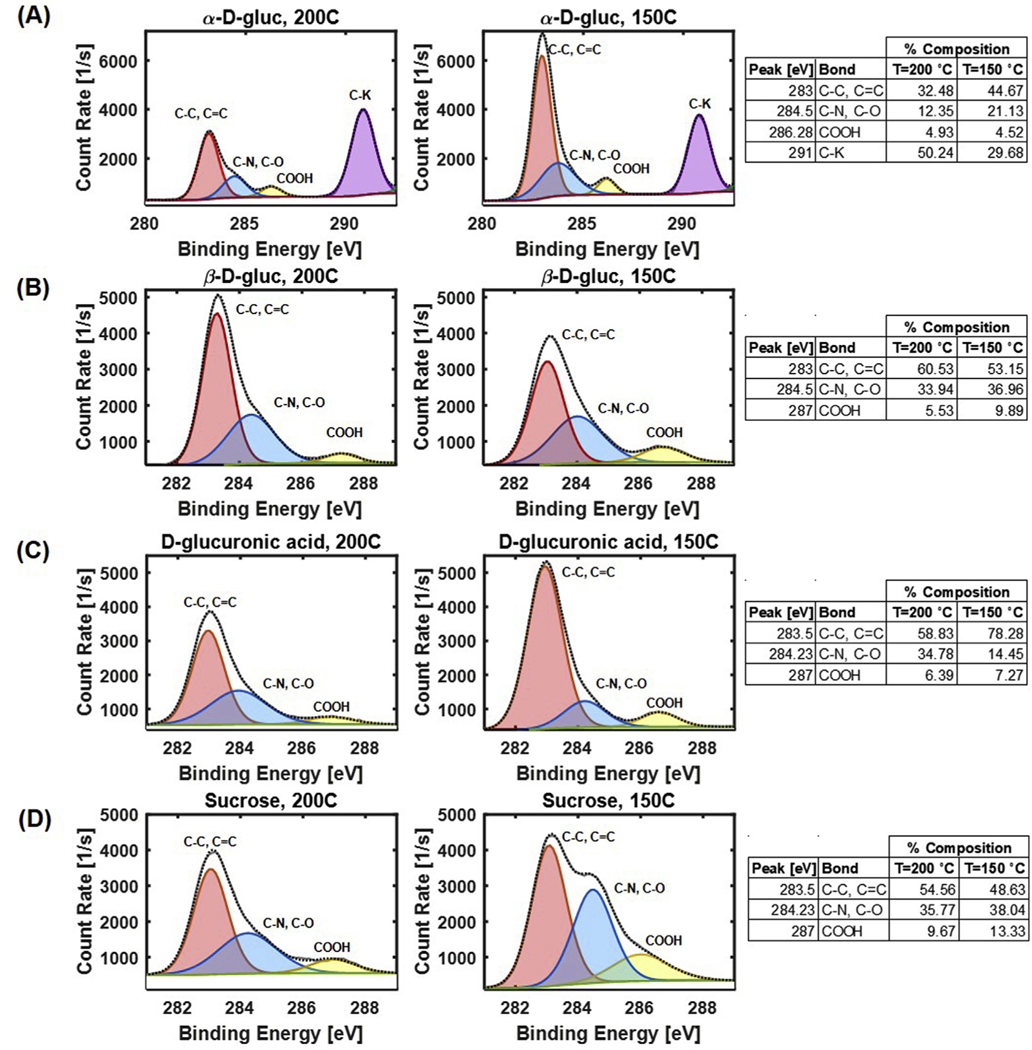
Deconvolution of the C1s peak (Fig. 5) confirmed the presence of C–C/C=C, C–O, COOH, and C–K peaks in the α-D-gluc CDots. While C–C/C=O and C–O occur naturally in the carbon source, the presence of COOH peaks and C–K peaks indicate the formation of these bonds as a result of the synthesis process. Deconvolution also confirmed the presence of C–C/C=C, C–O/C–N, and COOH peaks for β-D-gluc CDots, D-gluc CDots, and sucrose CDots. The percent composition of each bond type did not appear to follow a trend based on synthesis temperature or carbon source.
Fig. 5.
Deconvolved XPS C1s peak for CDots of each composition and synthesis temperature. (A) α-D-gluc CDots have peaks for C–C, C=C, C–O, COOH, and C–K. (B) β-D-gluc CDots have peaks for C–C, C=C, C–O, C–N, and COOH. (C–D) D-gluc, and sucrose C1s deconvolution resulted in peaks for C–C, C=C, C–O, and COOH.
FT-IR studies (Fig. S1) were performed to determine the successful incorporation of functional groups from the carbon sources onto the CDot surfaces. Irrespective of the temperature used for synthesis, CDots were shown to possess hydrophilic groups such as O–H, N–H and C=O on their surface ensuring their dispersion in aqueous media [10,12,20,46]. In addition, CDots also gave signature peaks which corresponded to the precursor source ( in Figure S1 A).
Zeta potential measurements led to the observation of a higher zeta potential magnitude for CDots synthesized at 150 °C than those synthesized at 200 °C (Fig. S2), indicating higher nanoparticle stability for lower synthesis temperatures. Additionally, α-D-gluc CDots had the greatest stability (as indicated by zeta potential magnitude) for a synthesis temperature of 150 °C, followed by Sucrose, β-D-gluc, and D-glucuronic acid CDots. For the synthesis temperature of 200 °C, α-D-gluc CDots had the greatest stability, while β-D-gluc and Sucrose CDots have zeta potentials with a similar magnitude to each other. These observations indicate that the hindering of nanoparticle growth during the synthesis process may have also hindered the growth of the nanoparticle surface charge layer.
3.3. Interpreting particle brightness by single-particle imaging analysis
Bulk measurements of each type of CDots showed that they display a wide range of particle brightness. To better understand their photophysics, we proceeded to analyze single-particle imaging data. By employing a changepoint data analysis algorithm [44,45], we parsed individual trajectories of each type of particle into “on” and “off” segments. The “on” segment was defined by intensity thresholding with the mean value of the darkest segment plus three times the standard deviation of that segment.
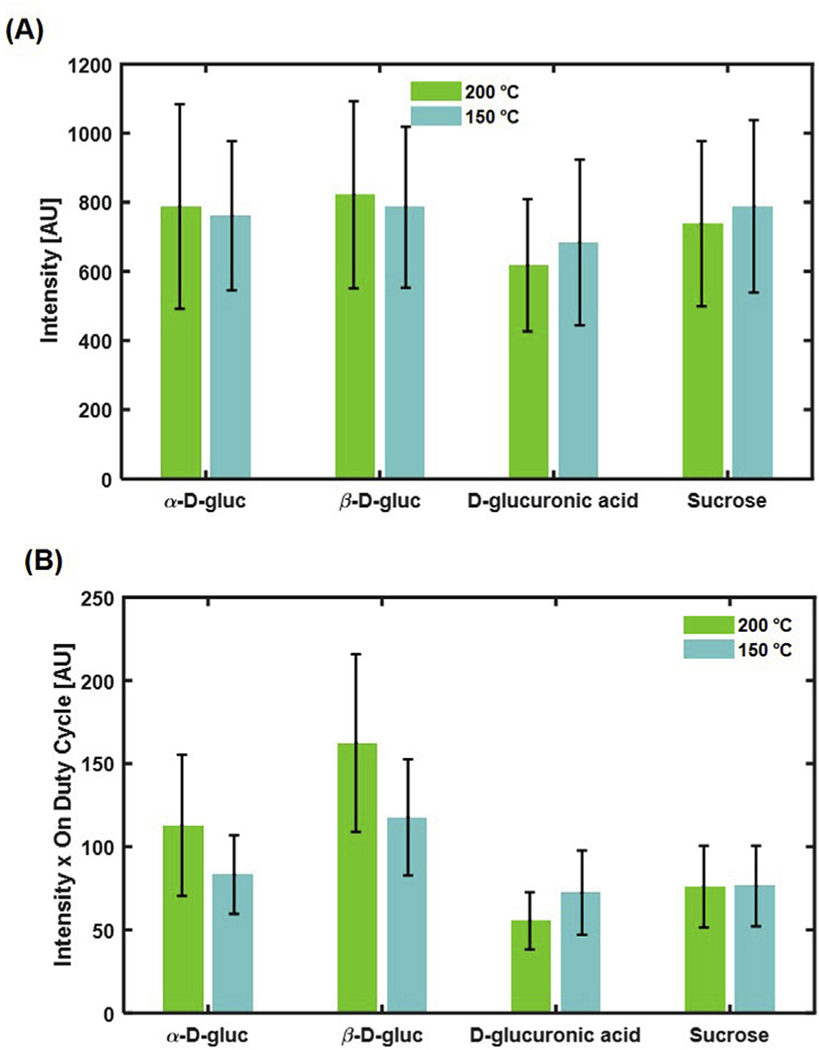
We first determined if different precursor materials and temperatures affect particle brightness. There are two parameters that can be used to quantify particle brightness: 1) the instantaneous brightness, which is the mean value of intensity in all the “on” segments, and 2) the on-time duty cycle, which determines the probability of a particle staying in the emissive state during the data acquisition time. We first calculated the instantaneous particle intensity (Fig. 6A). Although different particles showed different instantaneous intensities, their variation is much less than those measured in bulk. This result indicates that, before photobleaching, each type of particle has a comparable capacity in emitting photons, an observation that seems to contradict the bulk fluorescence measurement.
Fig. 6.
Single particle analysis of particle brightness. (A) Average particle intensity. All particle types have comparable intensities. (B) The product of average intensity and ton duty cycle. This appears more comparable to the bulk results than just examining intensity alone.
We then further determined the on-time duty cycle of each type of particle. Different particles displayed a variety of on-time duty cycles, with the largest duty cycle (20%, β-D-gluc at 200 °C) almost doubling the smallest one (9%, D-glucuronic acid, 200 °C). We reason that fluorescence intensity measured by bulk measurement is determined by both the instantaneous intensity and the on-time duty cycle. Indeed, if both factors are considered, the product of instantaneous intensity and on-time duty cycle (Fig. 6B) much better resembles the bulk fluorescence measurement.
Consideration of both the instantaneous intensity and on-time duty cycle helped us better understand the photophysics of different types of particles. For instance, β-D-gluc 200 °C displayed the largest instantaneous intensity, as well as the largest on-time duty cycle, therefore standing out as the brightest type of particle, consistent with the bulk measurement. On the other hand, although sucrose 150 °C, β-D-gluc 150 °C, and α-D-gluc 200 °C CDots show a similar instantaneous intensity, the on-time duty cycle of sucrose 150 °C CDots is only 9%, much less than that of β-D-gluc 150 °C (15%) or α-D-gluc 200 °C (14%). Consequently, sucrose 150 °C CDots are dimmer than β-D-gluc 150 °C or α-D-gluc 200 °C CDots. Thus, single-particle imaging allows for delineation of photophysical mechanisms underlying carbon dot emission. In general, the intensity at different synthesis temperatures within the same precursor remains comparable, whereas the intensity difference is more significant between different precursor materials.
3.4. Comparing the photobleaching kinetics between bulk and single-particle measurements
Bulk photobleaching experiments determined that the photobleaching curves (Figure S3 A) could be best fit with a second order exponential (Equation (2)), implying that there may be more than one nanoparticle population present for each composition and temperature. This led to obtaining two time constants for each nanoparticle (Figure S3 B).
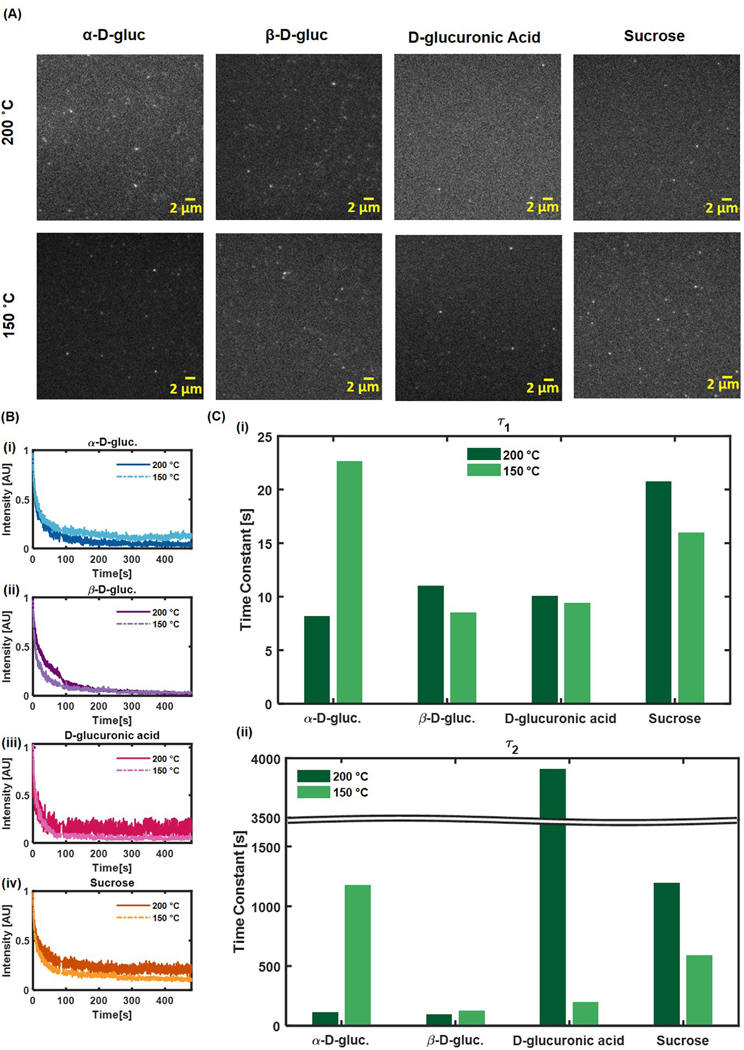
For all nanoparticle compositions, the second time constant was greater in the low temperature synthesis than in the higher temperature synthesis. This trend held true for the first time constant for α-D-gluc, β-D-gluc, and D-glucuronic acid CDots as well, indicating an overall decrease in resistance to photobleaching with an increase in synthesis temperature.
In single-particle photobleaching experiments (Fig. 7A), the photobleaching curves (Fig. 7B) were again best fit with second order exponential functions. All fit results were tabulated in Table S5. However, the single particle time constants (Fig. 7C) displayed a trend that was different than that of the bulk photobleaching experiments. α-D-gluc and Sucrose CDots had a higher first time constant for nanoparticles synthesized at 200 °C than those synthesized at 150 °C, while the first time constant for β-D-gluc was lower for nanoparticles synthesized at 200 °C than those synthesized at 150 °C. The first time constant did not change very much from one synthesis temperature to another for D-glucuronic acid CDots. The second time constant was found to decrease with a decrease in synthesis temperature for α-D-gluc and β-D-gluc CDots but increased with a decrease in temperature for D-glucuronic acid and sucrose CDots. We note that the bulk blinking lifetime is subjected to the “intensity-dependent” artifact. Indeed, densely packed particles can modify the local emission properties via e.g. secondary absorption of the emitted light. Thus, we focus on quantification of the photophysical properties of CDots at the single-particle level.
Fig. 7.
Single-particle photobleaching. (A) Single-particle images. (B) Time to photobleaching curves for single particles (n = 4 for each type). (C) Time constants determined from a second order exponential fit of the time to photobleaching curves.
3.5. Quantification of CDot photoblinking
The double exponential components in the bleaching lifetime motivates us to pay closer attention to particle photophysics. A detailed examination of single-particle trajectories revealed two types of photophysical behaviors: 1) a single-step photobleaching and 2) a multiple-step photoblinking. Although the emission mechanism underlying these two distinct photophysics remains to be elucidated, these two types of optical behaviors may correspond to two types of nanoparticles with distinct photobleaching characteristics. In particular, the single-step bleaching should contribute primarily to the fast decay constant, whereas the multiple-step photoblinking may account for the prolonged decay constant.
To better understand the photoblinking of single CDots, we proceeded to analyze their distribution of time on (ton) and time off (toff). It has been shown that carbon nanoparticles, like other types of nanosized emitters such as quantum dots, display a power-law distribution of ton and toff. Indeed, by using a changepoint algorithm to identify bright and dark state, we assigned each segment of the single-particle trajectories to either an “on” or “off” state. Consistent with previous studies [47], both ton and toff of nanoparticles showed a linear line in the log-log plot of probability vs. durations of ton and toff (Fig. 8A and B). We observed that the slopes of ton and toff do not vary significantly over temperature or precursor material (Fig. 8 C–D, Fig. S4, Tables S6–S7). At first sight, this result seems to be contradictory to the observation that the on-time duty cycle between each type of particles significantly varies (e.g. from 9% to 20%) because a similar ton slope implies that the probability distribution of each on-time duration remains the same. In fact, we can estimate the mean duration of on-time by a weighted average from each ton power-law plot. The resulted mean values between each particle were indeed very consistent within a small range of 0.42–0.65 s, with the maximum value occurring for D-glucuronic acid 150 °C CDots, whose on-time duty cycle is at the lower end of 10%.
Fig. 8.
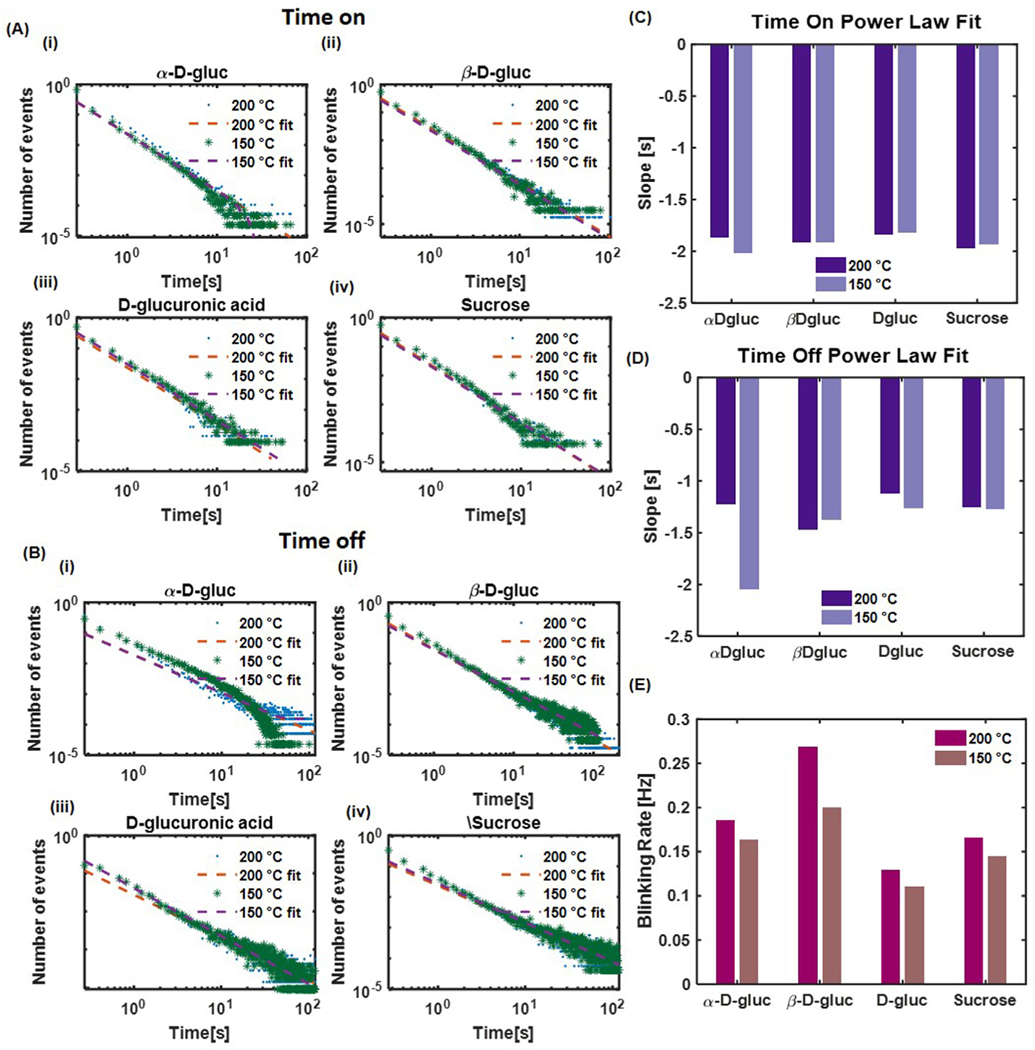
ton and toff photoblinking data based on many single-particle trajectories. Data was fit with a power law distribution. (A) Time on distributions for each carbon source and synthesis temperature. (B) Time off distributions for each carbon source and synthesis temperature. (C) Slopes of time on power law fits. (D) Slopes of time off power law fits. (E) Blinking rate (transition rate) for each particle type and synthesis temperature.
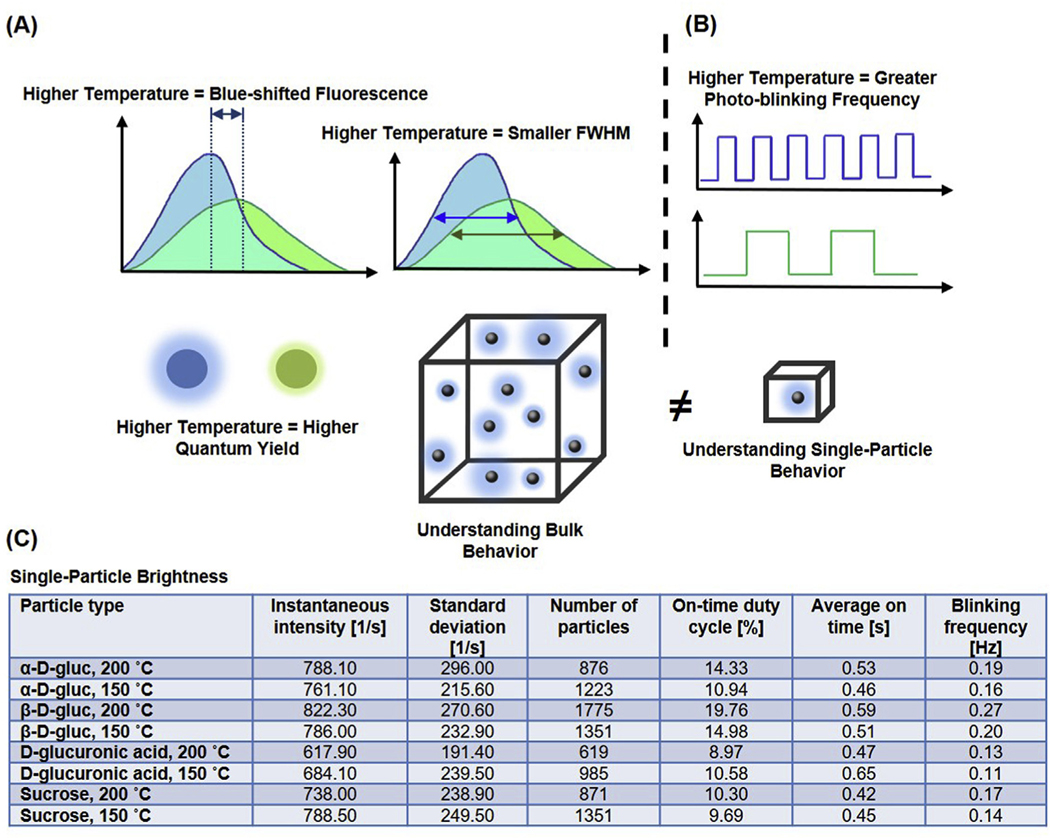
This discrepancy can be explained by considering that the on-time duty cycle not only depends on the probability distribution of on-time duration but also depends on the blinking frequency. Indeed, when we calculated the average blinking frequency for each type of particle, which is defined as the number of blinking events per unit time, we observed a significantly different range across all samples, ranging from 0.11 Hz (D-glucuronic acid 150 °C CDots) to 0.26 Hz (β-D-gluc 200 °C) (Fig. 8E). The transition rate of each type of particle quantitatively determines the capacity of a particle to recover from an off state to an on state. Thus, for particles with similar instantaneous intensity (e.g. α-D-gluc 200 °C, β-D-gluc 150 °C, and sucrose 150 °C), the increase of particle brightness, which primarily arises from an increase of on-time duty cycle, arises from an increase of blinking frequency rather than a change in the distribution of on-time duration. Within all four precursor materials, an increase of the synthesis temperature leads to a slight increase of the blinking frequency. A summary of all results is provided in Fig. 9.
Fig. 9.
Summary of Results. (A) At the bulk level, a higher synthesis temperature was found to lead to a blue-shifted fluorescence, a smaller fluorescence full-width at half maximum (FWHM), and a higher quantum yield. (B) At the single-particle level, a higher temperature was found to lead to a greater photo-blinking frequency, which led to brighter signals from particles. (C) Evaluation at the single-particle level elucidates the effects of precursor and synthesis temperature on particle brightness.
We note that the on- and off-time power-law distribution curves down at the timescale of 10–100 s. The downward curving of the power-law distribution may indicate competing physical processes that interrupt power-law blinking at this timescale. Indeed, this phenomenon has also been reported in early studies of quantum dots [48] and nanowires [49]. A slightly better fit can be achieved with a “truncated power law”. Because such modification does not change the conceptual description of photoblinking behaviors in this work, we chose to use the ordinary power-law distribution.
4. Conclusion
α-D-gluc, β-D-gluc, D-glucuronic acid, and Sucrose CDots with inherent surface-abundant functional groups were obtained through a single-step synthesis method. A higher synthesis temperature led to a higher quantum yield, smaller particle size, blue-shifted and narrower fluorescence emission, and lower magnitude zeta potential. A lower synthesis temperature led to a greater UV–visible absorbance, an increase in nanoparticle stability as determined by zeta potential measurements, red-shifted fluorescence, and a greater resistance to bulk photobleaching. Overall, carbon source and synthesis temperature in relation to the solvent boiling temperatures played a large role in modulating the photophysical properties of CDots. These findings suggest that a higher synthesis temperature may be more desirable for applications such as sensing or intracellular imaging, in which a blue-shifted fluorescence would be acceptable as long as a high quantum yield can be obtained. On the other hand, low synthesis temperatures may be more desirable for carbon dots that will be used for in-vivo bioimaging applications, where a red-shifted fluorescence may be more desirable. This lower synthesis temperature may also be applicable for situations in which chromatographic separation of carbon dots of a single carbon source into multiple colors is desired, as the broader range of fluorescence emission will allow for separation of varied colors. At the single-particle level, an increase in synthesis temperature led to an increase in photoblinking frequency, which in turn contributed to increased particle brightness. This finding further suggests the utility of high synthesis temperatures for in-vitro and single-particle imaging applications. Thus, the end application is of utmost importance in selection of CDot synthesis temperature.
Supplementary Material
Acknowledgements
We gratefully acknowledge Richard Haasch (UIUC Materials Research Laboratory) for his assistance with collecting XPS spectra, and Santosh K. Misra for his valuable scientific input. This project was funded through grants from National Institute of Health, Department of Defense, and University of Illinois (KZ). P. Fathi was funded by the National Physical Science Consortium and the National Institute of Standards & Technology through an NPSC graduate fellowship, and by the Nadine Barrie Smith Memorial Fellowship from the Beckman Institute. J. Khamo was supported by the Westcott fellowship in the Department of Biochemistry at UIUC. Research reported in this publication was supported by the National Institute of Biomedical Imaging And Bioengineering of the National Institutes of Health under Award Number T32EB019944. The content is solely the responsibility of the authors and does not necessarily represent the official views of the National Institutes of Health. This work was carried out in part in the Frederick Seitz Materials Research Laboratory Central Research Facilities, University of Illinois. Any mention of commercial products within this work is for information only; it does not imply recommendation or endorsement by NIST.
Footnotes
Appendix A. Supplementary data
Supplementary data to this article can be found online at https://doi.org/10.1016/j.carbon.2018.12.105.
References
- [1].Jaleel JA, Pramod K, Artful and multifaceted applications of carbon dot in biomedicine, J. Contr. Release 269 (2018) 302–321, 10.1016/j.jconrel.2017.11.027. [DOI] [PubMed] [Google Scholar]
- [2].Zhang Z, Yan K, Yang Q, Liu Y, Yan Z, Chen J, One-pot synthesis of fluorescent nitrogen-doped carbon dots with good biocompatibility for cell labeling, Luminescence 32 (2017) 1488–1493, 10.1002/bio.3349. [DOI] [PubMed] [Google Scholar]
- [3].Ostadhossein F, Pan D, Functional carbon nanodots for multiscale imaging and therapy, Wiley Interdiscip. Rev. Nanomed. Nanobiotechnol 9 (2017) 1–16, 10.1002/wnan.1436. [DOI] [PubMed] [Google Scholar]
- [4].Zhu S, Song Y, Zhao X, Shao J, Zhang J, Yang B, The photoluminescence mechanism in carbon dots (graphene quantum dots, carbon nanodots, and polymer dots): current state and future perspective, Nano Res. 8 (2015) 355–381, 10.1007/s12274-014-0644-3. [DOI] [Google Scholar]
- [5].Wang X, Cao L, Yang ST, Lu F, Meziani MJ, Tian L, Sun KW, Bloodgood MA, Sun YP, Bandgap-like strong fluorescence in functionalized carbon nanoparticles, Angew. Chem. Int. Ed 49 (2010) 5310–5314, 10.1002/anie.201000982. [DOI] [PMC free article] [PubMed] [Google Scholar]
- [6].Ruan S, Qian J, Shen S, Zhu J, Jiang X, He Q, Gao H, A simple one-step method to prepare fluorescent carbon dots and their potential application in non-invasive glioma imaging, Nanoscale 6 (2014) 10040–10047, 10.1039/c4nr02657h. [DOI] [PubMed] [Google Scholar]
- [7].Wu L, Luderer M, Yang X, Swain C, Zhang H, Nelson K, Stacy AJ, Shen B, Lanza GM, Pan D, Surface passivation of carbon nanoparticles with branched macromolecules influences near infrared bioimaging, Theranostics 3 (2013) 677–686, 10.7150/thno.6535. [DOI] [PMC free article] [PubMed] [Google Scholar]
- [8].Kuo TR, Sung SY, Hsu CW, Chang CJ, Chiu TC, Hu CC, One-pot green hydrothermal synthesis of fluorescent nitrogen-doped carbon nanodots for in vivo bioimaging, Anal. Bioanal. Chem 408 (2016) 77–82, 10.1007/s00216-015-9138-8. [DOI] [PubMed] [Google Scholar]
- [9].Yang Y, Shengtao, Cao Li, Luo Pengju G., Lu Fushen, Wang xin, Wang Haifeng, Meziani Mohammed J., Liu Yuanfang, Qi Gang, Sun, Carbon dots for optical imaging in vivo, J. Am. Chem. Soc 131 (2009) 11308–11309. [DOI] [PMC free article] [PubMed] [Google Scholar]
- [10].Srivastava I, Misra SK, Tripathi I, Schwartz-duval A, In Situ Time-dependent and Progressive Oxidation of Reduced State Functionalities at the Nanoscale of Carbon Nanoparticles for Polarity-Driven Multiscale Near-Infrared Imaging, 1800009, 2018, pp. 1–11, 10.1002/adbi.201800009. [DOI] [Google Scholar]
- [11].Huang P, Lin J, Wang X, Wang Z, Zhang C, He M, Wang K, Chen F, Li Z, Shen G, Cui D, Chen X, Light-triggered theranostics based on photosensitizer-conjugated carbon dots for simultaneous enhanced-fluorescence imaging and photodynamic therapy, Adv. Mater 24 (2012) 5104–5110, 10.1002/adma.201200650. [DOI] [PMC free article] [PubMed] [Google Scholar]
- [12].Ostadhossein F, Benig L, Tripathi I, Misra SK, Pan D, Fluorescence detection of bone microcracks using monophosphonated carbon dots, ACS Appl. Mater. Interfaces 10 (2018) 19408–19415, 10.1021/acsami.8b03727. [DOI] [PubMed] [Google Scholar]
- [13].Jiang K, Sun S, Zhang L, Lu Y, Wu A, Cai C, Lin H, Red, green, and blue luminescence by carbon dots: full-color emission tuning and multicolor cellular imaging, Angew. Chem. Int. Ed 54 (2015) 5360–5363, 10.1002/anie.201501193. [DOI] [PubMed] [Google Scholar]
- [14].Zhi B, Cui Y, Wang S, Frank BP, Williams DN, Brown RP, Melby ES, Hamers RJ, Rosenzweig Z, Fairbrother DH, Orr G, Haynes CL, Malic acid carbon Dots : from super-, ACS Nano 12 (2018) 5741–5752, 10.1021/acsnano.8b01619. [DOI] [PubMed] [Google Scholar]
- [15].Misra SK, Srivastava I, Tripathi I, Daza E, Ostadhossein F, Pan D, Macromolecularly caged carbon nanoparticles for intracellular trafficking via switchable photoluminescence, J. Am. Chem. Soc 139 (2017) 1746–1749, 10.1021/jacs.6b11595. [DOI] [PubMed] [Google Scholar]
- [16].Kong B, Zhu A, Ding C, Zhao X, Li B, Tian Y, Carbon dot-based inorganicorganic nanosystem for two-photon imaging and biosensing of pH variation in living cells and tissues, Adv. Mater 24 (2012) 5844–5848, 10.1002/adma.201202599. [DOI] [PubMed] [Google Scholar]
- [17].Zhang Y, Chan KF, Wang B, Chiu PWY, Zhang L, Spore-derived colortunable multi-doped carbon nanodots as sensitive nanosensors and intracellular imaging agents, Sensor. Actuator. B Chem 271 (2018) 128–136, 10.1016/j.snb.2018.05.112. [DOI] [Google Scholar]
- [18].Luo M, Hua Y, Liang Y, Han J, Liu D, Zhao W, Wang P, Synthesis of novel β-cyclodextrin functionalized S, N codoped carbon dots for selective detection of testosterone, Biosens. Bioelectron 98 (2017) 195–201, 10.1016/j.bios.2017.06.056. [DOI] [PubMed] [Google Scholar]
- [19].Han M, Wang L, Li S, Bai L, Zhou Y, Sun Y, Huang H, Li H, Liu Y, Kang Z, High-bright fluorescent carbon dot as versatile sensing platform, Talanta 174 (2017) 265–273, 10.1016/j.talanta.2017.05.067. [DOI] [PubMed] [Google Scholar]
- [20].Kampert T, Misra SK, Srivastava I, Tripathi I, Pan D, Phenotypically screened carbon nanoparticles for enhanced combinatorial therapy in triple negative breast cancer, Cell. Mol. Bioeng 10 (2017) 371–386, 10.1007/s12195-017-0490-y. [DOI] [PMC free article] [PubMed] [Google Scholar]
- [21].Cao X, Wang J, Deng W, Chen J, Wang Y, Zhou J, Du P, Xu W, Wang Q, Wang Q, Yu Q, Spector M, Yu J, Xu X, Photoluminescent cationic carbon dots as efficient non-viral delivery of plasmid SOX9 and chondrogenesis of fibroblasts, Sci. Rep 8 (2018) 1–11, 10.1038/s41598-018-25330-x. [DOI] [PMC free article] [PubMed] [Google Scholar]
- [22].Zhao H, Duan J, Xiao Y, Tang G, Wu C, Zhang Y, Liu Z, Xue W, Microenvironment-driven cascaded responsive hybrid carbon dots as a multifunctional theranostic nanoplatform for imaging-traceable gene precise delivery, Chem. Mater 30 (2018) 3438–3453, 10.1021/acs.chemmater.8b01011. [DOI] [Google Scholar]
- [23].Liu C, Zhang P, Tian F, Li W, Li F, Liu W, One-step synthesis of surface passivated carbon nanodots by microwave assisted pyrolysis for enhanced multicolor photoluminescence and bioimaging, J. Mater. Chem 21 (2011) 13163–13167, 10.1039/c1jm12744f. [DOI] [Google Scholar]
- [24].Sun YP, Zhou B, Lin Y, Wang W, Fernando KAS, Pathak P, Meziani MJ, Harruff BA, Wang X, Wang H, Luo PG, Yang H, Kose ME, Chen B, Veca LM, Xie SY, Quantum-sized carbon dots for bright and colorful photoluminescence, J. Am. Chem. Soc 128 (2006) 7756–7757, 10.1021/ja062677d. [DOI] [PubMed] [Google Scholar]
- [25].Chandra S, Pathan SH, Mitra S, Modha BH, Goswami A, Pramanik P, Tuning of photoluminescence on different surface functionalized carbon quantum dots, RSC Adv. 2 (2012) 3602–3606, 10.1039/c2ra00030j. [DOI] [Google Scholar]
- [26].Shen C, Yao W, Lu Y, One-step synthesis of intrinsically functionalized fluorescent carbon nanoparticles by hydrothermal carbonization from different carbon sources, J. Nanoparticle Res 15 (2013), 10.1007/s11051-013-2019-1. [DOI] [Google Scholar]
- [27].Shen P, Xia Y, Synthesis-modification integration: one-step fabrication of boronic acid functionalized carbon dots for fluorescent blood sugar sensing, Anal. Chem 86 (2014) 5323–5329, 10.1021/ac5001338. [DOI] [PubMed] [Google Scholar]
- [28].Hu L, Sun Y, Li S, Wang X, Hu K, Wang L, Liang XJ, Wu Y, Multifunctional carbon dots with high quantum yield for imaging and gene delivery, Carbon N. Y 67 (2014) 508–513, 10.1016/j.carbon.2013.10.023. [DOI] [Google Scholar]
- [29].Yang M, Meng X, Li B, Ge S, Lu Y, N, S co-doped carbon dots with high quantum yield: tunable fluorescence in liquid/solid and extensible applications, J. Nanoparticle Res 19 (2017), 10.1007/s11051-017-3914-7. [DOI] [Google Scholar]
- [30].Liu H, Li Z, Sun Y, Geng X, Hu Y, Meng H, Ge J, Qu L, Synthesis of luminescent carbon dots with ultrahigh quantum yield and inherent folate receptor-positive cancer cell targetability, Sci. Rep 8 (2018) 1–8, 10.1038/s41598-018-19373-3. [DOI] [PMC free article] [PubMed] [Google Scholar]
- [31].Das SK, Liu Y, Yeom S, Kim DY, Richards CI, Single-particle fluorescence intensity fluctuations of carbon nanodots, Nano Lett. 14 (2014) 620–625, 10.1021/nl403820m. [DOI] [PubMed] [Google Scholar]
- [32].Yang Q, Wei L, Zheng X, Xiao L, Single particle dynamic imaging and Fe3+ sensing with bright carbon dots derived from bovine serum albumin proteins, Sci. Rep 5 (2015) 1–12, 10.1038/srep17727. [DOI] [PMC free article] [PubMed] [Google Scholar]
- [33].Verma NC, Khan S, Nandi CK, Single-molecule analysis of fluorescent carbon dots towards localization-based super-resolution microscopy, Methods Appl. Fluoresc 4 (2016), 044006, 10.1088/2050-6120/4/4/044006. [DOI] [PubMed] [Google Scholar]
- [34].Grecco HE, Lidke KA, Heintzmann R, Lidke DS, Spagnuolo C, Martinez OE, Jares-Erijman EA, Jovin TM, Ensemble and single particle photophysical properties (two-photon excitation, anisotropy, FRET, lifetime, spectral conversion) of commercial quantum dots in solution and in live cells, Microsc. Res. Tech 65 (2004) 169–179, 10.1002/jemt.20129. [DOI] [PubMed] [Google Scholar]
- [35].Chan WCW, Maxwell DJ, Gao X, Bailey RE, Han M, Nie S, Luminescent quantum dots for multiplexed biological detection and imaging, Curr. Opin. Biotechnol 13 (2002) 40–46, 10.1016/S0958-1669(02)00282-3. [DOI] [PubMed] [Google Scholar]
- [36].Gao X, Chan WCW, Nie S, Quantum-dot nanocrystals for ultrasensitive biological labeling and multicolor optical encoding, J. Biomed. Optic 7 (2002) 532, 10.1117/1.1506706. [DOI] [PubMed] [Google Scholar]
- [37].Chan WCW, Nie S, Chan WCW, Nie S, Quantum Dot Bioconjugates for Ultrasensitive Nonisotopic Detection Published by : American Association for the Advancement of Science Stable URL, vol. 281, 1998, pp. 2016–2018. http://www.jstor.org/stable/2895734. Linked references are available on JSTOR for this article : Quantum Dot, Science (80-). [DOI] [PubMed] [Google Scholar]
- [38].Howarth M, Takao K, Hayashi Y, Ting AY, Stephen J, Howarth M, Takaot K, Hayashit Y, Ting AY, Targeting quantum dots to surface proteins in living cells with biotin ligase, Proc. Natl. Acad. Sci. Unit. States Am 102 (2005) 7583–7588. [DOI] [PMC free article] [PubMed] [Google Scholar]
- [39].Courty S, Luccardini C, Bellaiche Y, Cappello G, Dahan M, Tracking individual kinesin motors in living cells using single quantum-dot imaging, Nano Lett. 6 (2006) 1491–1495, 10.1021/nl060921t. [DOI] [PubMed] [Google Scholar]
- [40].Yang Z, Li Z, Xu M, Zhang L, Zhang J, Su Y, Gao F, Wei H, Controllable synthesis of fluorescent carbon dots and their detection application as nanoprobes, Micro & Nano Lett. 5 (2013) 247–259. [Google Scholar]
- [41].Zhang YQ, Ma DK, Zhuang Y, Zhang X, Chen W, Hong LL, Yan QX, Yu K, Huang SM, One-pot synthesis of N-doped carbon dots with tunable luminescence properties, J. Mater. Chem 22 (2012) 16714–16718, 10.1039/c2jm32973e. [DOI] [Google Scholar]
- [42].Li H, Kang Z, Liu Y, Lee ST, Carbon nanodots: synthesis, properties and applications, J. Mater. Chem 22 (2012) 24230–24253, 10.1039/c2jm34690g. [DOI] [Google Scholar]
- [43].Misra SKK, Srivastava I, Khamo JS, Krishnamurthy VV, Sar D, Schwartz-Duval A, Soares J, Zhang K, Pan D, Carbon dots with induced surface oxidation permits imaging at single-particle level for intracellular studies, Nanoscale (2018), 10.1039/C8NR04065F. [DOI] [PubMed] [Google Scholar]
- [44].Watkins LP, Yang H, Detection of intensity change points in time-resolved single-molecule measurements, J. Phys. Chem. B 109 (2005) 617–628, 10.1021/jp0467548. [DOI] [PubMed] [Google Scholar]
- [45].Montiel D, Cang H, Yang H, Quantitative characterization of changes in dynamical behavior for single-particle tracking studies †, J. Phys. Chem. B 110 (2006) 19763–19770, 10.1021/jp062024j. [DOI] [PubMed] [Google Scholar]
- [46].Srivastava I, Misra SK, Ostadhossein F, Daza E, Singh J, Pan D, Surface chemistry of carbon nanoparticles functionally select their uptake in various stages of cancer cells, Nano Res 10 (2017) 3269–3284, 10.1007/s12274-017-1518-2. [DOI] [Google Scholar]
- [47].Khan S, Li W, Karedla N, Thiart J, Gregor I, Chizhik AM, Enderlein J, Nandi CK, Chizhik AI, Charge-driven fluorescence blinking in carbon nanodots, J. Phys. Chem. Lett 8 (2017) 5751–5757, 10.1021/acs.jpclett.7b02521. [DOI] [PubMed] [Google Scholar]
- [48].Shimizu KT, Neuhauser RG, Leatherdale CA, Empedocles SA, Woo WK, Bawendi MG, Blinking statistics in single semiconductor nanocrystal quantum dots, Phys. Rev. B Condens. Matter Phys 63 (2001) 1–5, 10.1103/PhysRevB.63.205316. [DOI] [Google Scholar]
- [49].Frantsuzov P, Kuno M, JankO BA, Marcus RA, Universal emission intermittency in quantum dots, nanorods and nanowires, Nat. Phys 4 (2008) 519–522. [Google Scholar]
Associated Data
This section collects any data citations, data availability statements, or supplementary materials included in this article.


