

Abstract
Selective attention to visual stimuli can spread cross‐modally to task‐irrelevant auditory stimuli through either the stimulus‐driven binding mechanism or the representation‐driven priming mechanism. The stimulus‐driven attentional spreading occurs whenever a task‐irrelevant sound is delivered simultaneously with a spatially attended visual stimulus, whereas the representation‐driven attentional spreading occurs only when the object representation of the sound is congruent with that of the to‐be‐attended visual object. The current study recorded event‐related potentials in a space‐selective visual object‐recognition task to examine the exact roles of space‐based visual selective attention in both the stimulus‐driven and representation‐driven cross‐modal attentional spreading, which remain controversial in the literature. Our results yielded that the representation‐driven auditory Nd component (200–400 ms after sound onset) did not differ according to whether the peripheral visual representations of audiovisual target objects were spatially attended or not, but was decreased when the auditory representations of target objects were presented alone. In contrast, the stimulus‐driven auditory Nd component (200–300 ms) was decreased but still prominent when the peripheral visual constituents of audiovisual nontarget objects were spatially unattended. These findings demonstrate not only that the representation‐driven attentional spreading is independent of space‐based visual selective attention and benefits in an all‐or‐nothing manner from object‐based visual selection for actually presented visual representations of target objects, but also that although the stimulus‐driven attentional spreading is modulated by space‐based visual selective attention, attending to visual modality per se is more likely to be the endogenous determinant of the stimulus‐driven attentional spreading.
Keywords: cross‐modal spread of attention, modality‐based, object‐based, representation‐driven, space‐based, stimulus‐driven, visual selective attention
The present study found that the representation‐driven attentional spreading was independent of space‐based visual selective attention. The stimulus‐driven attentional spreading was modulated by space‐based visual selective attention but still prominent when the visual constituents of audiovisual nontarget objects were spatially unattended. These findings suggest not only that the representation‐driven attentional spreading benefits in an all‐or‐nothing manner from object‐based visual selection for actually presented visual representations of target objects, but also that although the stimulus‐driven attentional spreading is modulated by space‐based visual selective attention, attending to visual modality per se is more likely to be the endogenous determinant of the stimulus‐driven attentional spreading.
1. INTRODUCTION
Given the fact that we live in a multisensory world and that efficient multisensory integration is fundamental to almost all high‐level cognitive functions, exploring the psychophysiological mechanisms of multisensory integration has been a focus of interest in cognitive neuroscience in the past two decades. In particular, the multifaceted interactions between attention and multisensory integration have been widely investigated (for reviews, see De Meo, Murray, Clarke, & Matusz, 2015; Macaluso et al., 2016; Talsma, Senkowski, Soto‐Faraco, & Woldorff, 2010; Tang, Wu, & Shen, 2016). One of the most compelling neural examples illustrating the close linkage between attention and multisensory integration is that visual attention effect can spread cross‐modally to the task‐irrelevant auditory modality, through either the stimulus‐driven (Busse, Roberts, Crist, Weissman, & Woldorff, 2005; Donohue, Roberts, Grent‐'T‐Jong, & Woldorff, 2011; Fiebelkorn, Foxe, Schwartz, & Molholm, 2010; Talsma, Doty, & Woldorff, 2007; Zimmer, Itthipanyanan, Grent‐'t‐Jong, & Woldorff, 2010; Zimmer, Roberts, Harshbarger, & Woldorff, 2010) or representation‐driven (Fiebelkorn, Foxe, & Molholm, 2010; Molholm, Martinez, Shpaner, & Foxe, 2007; Zhao, Feng, Liao, Huang, & Feng, 2021) mechanism, resulting in the originally unattended auditory features of an audiovisual object being also pulled into the attentional spotlight and bestowed with enhanced processing. The stimulus‐driven spread of attention occurs whenever a task‐irrelevant sound is presented simultaneously with a spatially attended visual stimulus, thus was interpreted as a bottom‐up audiovisual binding process based on the co‐occurrence of visual and auditory stimuli (Fiebelkorn, Foxe, & Molholm, 2010; Fiebelkorn, Foxe, Schwartz, & Molholm, 2010). In contrast, the representation‐driven spread of attention occurs only when the object representation of a task‐irrelevant sound (e.g., a bark of dog) is semantically congruent with that of the to‐be‐attended visual object (e.g., an image of dog), hence was considered to be a top‐down audiovisual priming process based on the activation of highly learned associations between features in different modalities (Fiebelkorn, Foxe, & Molholm, 2010; Molholm et al., 2007).
The stimulus‐driven and representation‐driven attentional spreading could be isolated independently with event‐related potentials (ERPs) recorded in a single experiment (e.g., Fiebelkorn, Foxe, & Molholm, 2010; Zhao et al., 2021) wherein participants attend selectively to pictures of the target object (e.g., one category among dog, car, or drum) while ignoring all characteristic sounds (e.g., barks of dogs, beeps of cars, or beats of drums) that could be delivered synchronously with pictures, alone, or be absent. According to the basic paradigm, the stimulus‐driven attentional spreading can be isolated by comparing the extracted auditory ERPs to audiovisual stimuli when both their auditory and visual representations correspond to nontarget objects (e.g., dogs with barks under target‐car blocks), versus ERPs to auditory‐only stimuli when their representations correspond to nontarget objects (e.g., barks alone under target‐car blocks; for more details, see Fiebelkorn, Foxe, & Molholm, 2010; Fiebelkorn, Foxe, Schwartz, & Molholm, 2010). Because the visual constituents of audiovisual nontarget stimuli are spatially attended but unattended in terms of object representation, this comparison is orthogonal to the representation‐driven attentional spreading, and any difference revealed in the comparison should be explained only by whether the task‐irrelevant sounds have occurred simultaneously with spatially attended visual stimuli. Meanwhile, the representation‐driven attentional spreading can be isolated by contrasting the extracted auditory ERPs to audiovisual stimuli when their visual representations correspond to the target object (dogs with barks under target‐dog blocks), versus the extracted auditory ERPs to the same audiovisual stimuli when their visual representations correspond to nontarget objects (dogs with barks under target‐car blocks; for more details, see Molholm et al., 2007; Fiebelkorn, Foxe, & Molholm, 2010). Since the two types of audiovisual stimuli here differ only in whether their visual constituents were attended or not in terms of object representation, any difference revealed in this contrast can be attributed solely to object‐selective visual attention effect spreading to the task‐irrelevant sounds. Not surprisingly, the stimulus‐ and representation‐driven spreading effects were both characterized by prolonged negative ERP differences analogous to the attention‐related auditory Nd component (e.g., Fiebelkorn, Foxe, & Molholm, 2010; Fiebelkorn, Foxe, Schwartz, & Molholm, 2010; Molholm et al., 2007; Talsma et al., 2007; Zhao et al., 2021). The Nd is a sustained ERP difference component manifested as a greater negative amplitude over the fronto‐central scalp elicited by attended relative to unattended auditory stimuli, beginning around 150–200 ms poststimulus (Hansen & Hillyard, 1980), which is generally thought to reflect an enhancement of auditory processing due to selective attention (Giard, Fort, Mouchetant‐Rostaing, & Pernier, 2000; Näätänen, 1982; Singhal & Fowler, 2004).
It was hypothesized that the representation‐driven spread of attention could operate independently of space‐based visual selective attention (Fiebelkorn, Foxe, & Molholm, 2010), because many investigations have indicated that feature‐ or object‐based visual selection per se could occur at spatially unattended locations (Andersen, Fuchs, & Müller, 2011; Bartsch et al., 2015; Bartsch, Donohue, Strumpf, Schoenfeld, & Hopf, 2018; Bondarenko et al., 2012; Chelazzi, Duncan, Miller, & Desimone, 1998; Chelazzi, Miller, Duncan, & Desimone, 1993; Sàenz, Buraĉas, & Boynton, 2003; Serences & Boynton, 2007; Treue & Martínez‐Trujillo, 1999; Zhang & Luck, 2009). However, it is noteworthy that in these studies the visual target (attended) and nontarget (unattended) features were typically presented simultaneously in order to maximize the competition between the target and nontarget features, which is distinct from the cross‐modal attentional spreading paradigm wherein the visual target and nontarget objects were presented sequentially. Indeed, when visual target and nontarget features (objects) were presented sequentially, feature‐based attentional selection has been shown to be diminished or even absent at spatially unattended locations (Anllo‐Vento & Hillyard, 1996; Hillyard & Münte, 1984; Karayanidis & Michie, 1996). Furthermore, even in those studies where visual target and nontarget features were presented simultaneously, when the feature‐based visual attention effect at spatially unattended locations could be compared directly with that at attended locations, the former (although significant) has been generally found to be significantly weaker or at least tend to be weaker than the latter (Andersen et al., 2011; Han, Liu, Yund, & Woods, 2000; Ibos & Freedman, 2016; Leonard, Balestreri, & Luck, 2015; Serences & Boynton, 2007; Tompary, Al‐Aidroos, & Turk‐Browne, 2018; White, Rolfs, & Carrasco, 2015). Based on the two pieces of evidence, it is expected that under the cross‐modal attentional spreading paradigm, feature‐ or object‐based visual selection would be modulated by space‐based visual selective attention. Therefore, the mere existence of feature‐based visual attention effect at unattended locations is not sufficient to draw a strong conclusion about whether the representation‐driven attentional spreading from visual to auditory modality would be independent of space‐based visual selective attention, which still needs to be determined.
In contrast to representation‐driven spread of attention, the stimulus‐driven spread of attention has been consistently shown to be contingent on the focus of space‐selective visual attention (Busse et al., 2005; Donohue et al., 2011; Talsma et al., 2007; Zimmer, Itthipanyanan, et al., 2010; Zimmer, Roberts, et al., 2010). Nevertheless, since the stimulus‐driven attentional spreading was isolated in previous studies by comparing the brain response to task‐irrelevant sounds when paired with spatially attended visual stimuli, versus either that to sounds when paired with spatially unattended visual stimuli (Busse et al., 2005; Donohue et al., 2011; Zimmer, Itthipanyanan, et al., 2010; Zimmer, Roberts, et al., 2010) or that to sounds when delivered alone (Fiebelkorn, Foxe, & Molholm, 2010; Fiebelkorn, Foxe, Schwartz, & Molholm, 2010; Talsma et al., 2007; Zhao et al., 2021), the exact contributions of attentional allocation to visual modality per se (manifested in task as focusing only on visual stimuli while ignoring all sounds), and selectively attending to a particular spatial location on the basis of visual‐modal attention, to the stimulus‐driven attentional spreading were more or less confounded. Specifically, as the neural response to task‐irrelevant sounds when paired with spatially unattended visual stimuli has not yet been contrasted directly versus that to sounds when delivered alone, it is currently unknown whether the stimulus‐driven attentional spreading would be elicited to some degree even when the task‐irrelevant sounds are paired with the spatially unattended but modally attended visual stimuli. A confirmative answer to this question would suggest that despite outside the focus of spatial spotlight, attentional allocation to visual modality per se might also play a role in eliciting the stimulus‐driven spread of attention.
Using ERP recordings in conjunction with the aforementioned methods of isolating the representation‐driven and stimulus‐driven attentional spreading, the present study investigated the electrophysiological time courses of the contributions of space‐based visual selective attention to the two types of cross‐modal attentional spreading. The experimental design combined the object‐selective visual “1‐back” paradigm used by Fiebelkorn, Foxe, and Molholm (2010) with the classic space‐selective visual attention paradigm (Anllo‐Vento & Hillyard, 1996), wherein subjects were instructed to attend selectively to the line drawings of target object category (dogs or cars) appearing at the to‐be‐attended visual field (left or right side), while ignoring all drawings appearing at the other side and all centrally presented natural sounds (dogs' barks or cars' beeps). These task‐irrelevant sounds could occur synchronously (and congruently) with either spatially attended or unattended unilateral drawings, occur alone, or be absent. On one hand, if the representation‐driven spread of attention can operate independently of space‐based visual selective attention, the auditory Nd component (200–400 ms after sound onset) revealed in the isolation of representation‐driven process should be invariant according to whether the peripheral visual representations of audiovisual target objects are spatially attended or not. On the other hand, if the stimulus‐driven spread of attention does not originate entirely from space‐based visual selective attention, the auditory Nd wave revealed in the isolation of stimulus‐driven process should occur to some degree even when the task‐irrelevant sounds are paired with the spatially unattended (but modally attended) visual nontarget objects.
2. METHODS
2.1. Participants
The target sample size of the present study was 30 (c.f., Zhao et al., 2021), thus a total of 30 healthy subjects were recruited after giving written informed consent as approved by the Human Research Protections Program of Soochow University. Experimental procedures were in agreement with the Declaration of Helsinki. All subjects reported normal or corrected‐to‐normal vision as well as normal audition, and were naive as to the hypothesis of the experiment. Data from one participant were excluded due to quitting during the experiment, leaving data of 29 subjects (17 female and 12 males; age range of 19–27 years, mean age of 20.9 years; all right‐handed) for further analysis.
2.2. Apparatus, stimuli, and design
The experiment was performed in a dark and sound‐attenuated room. Stimulus presentation was scripted using “Presentation” software (version 18.0, NeuroBehavioral Systems, Inc.). Visual stimuli were presented on a 27‐in. LCD monitor (ASUS PG279Q, resolution 1,920 × 1,080, refresh rate 120 Hz) on which the background color was set to gray (RGB: 128, 128, 128). Auditory stimuli were delivered by a pair of loudspeakers (HiVi X3) positioned at the left and right sides of the monitor symmetrically, so that a single sound presented by the two speakers simultaneously would be perceived as coming from the center of the monitor (Bertelson & Aschersleben, 1998). Subjects sat in front of the monitor with a viewing distance of approximately 80 cm, and were required to maintain their eyes fixated on a red cross (RGB: 255, 0, 0; 0.67° × 0.67° in size), which was displayed at the center of the screen throughout each experimental block. Meanwhile, a pair of dark gray rectangular frames (RGB: 50, 50, 50; each 8.40° × 6.72°) were displayed at the left and right sides of the fixation cross also throughout each block (Figure 1a), serving as attentional anchors to assist the subjects in keeping a strong covert attentional focus at the designated spatial location (left or right; c.f., Zimmer, Itthipanyanan, et al., 2010). The horizontal and vertical distances between the center of each rectangle and the center of fixation cross were 12.09° and 0°, respectively.
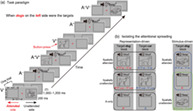
FIGURE 1.

(a) Task paradigm shown for trials in a block when line drawings of dogs on the left side were the targets. Each trial consisted of a 200‐ms stimulus presentation and an inter‐trial interval (ITI) of 1,000–1,200 ms. Visual stimulus could be one of the nine unique drawings (three dogs, three cars, and three drums), which was presented randomly to the left or right visual field. Auditory stimulus could be one of the nine unique natural sounds (three barks of dogs, three beeps of cars, and three beats of drums), which always came from the center location. The unilateral drawings (V) and central sounds (A) could be either presented alone or presented synchronously (AV) to form semantically congruent pairs (e.g., barks with dogs), resulting in three main stimulus types. The task for subjects was to make a button‐press in response to the second of two consecutively presented drawings of the target object category (dogs or cars) appearing at the to‐be‐attended spatial location (left or right side), while ignoring all drawings at the unattended side and all sounds if delivered. (b) Schematic diagram of the experimental comparisons used for isolating the cross‐modal attentional spreading that originated from the representation‐driven process (left) and the stimulus‐driven process (right). The superscripts “+” and “−” denote visual or auditory representations of the target and nontarget objects, respectively, which applies to all relevant figures and paragraphs in the main text
When presented, the visual stimulus could be one of the nine unique line drawings (three dogs, three cars, and three drums; each 8.40° × 6.72°) with equal probability, which was presented for 200 ms at the center of either the left or right rectangular frame equiprobably (Figure 1a). The lines on each drawing were black (RGB: 0, 0, 0), and the background color of each drawing was the same as that of the screen (i.e., RGB: 128, 128, 128; see Figure 1a) in order to minimize the salience of the visual stimulus. The auditory stimulus, which always came from the center location when delivered, could be one of the nine unique natural sounds (three barks of dogs, three beeps of cars, and three beats of drums; all stereo) equiprobably, which was also 200 ms in duration (with 20 ms rise and fall ramps) and was approximately 75 dB in loudness at subjects' ears. These line drawings and natural sounds were selected and adapted from the study of Zhao et al. (2021) wherein the cross‐modal spread of attention was also investigated. The unilateral drawings and central sounds were either presented alone (labeled as V [visual] and A [auditory] conditions, respectively) or presented synchronously to form semantically congruent pairs (e.g., drawings of dogs paired with barks of dogs; labeled as AV [audiovisual] condition), resulting in three main stimulus types. Note that semantically incongruent AV pairs were not designed here because: (a) previous studies have consistently confirmed that the stimulus‐driven attentional spreading occurs in both congruent and incongruent AV conditions without magnitude difference, whereas the representation‐driven attentional spreading occurs only in the congruent AV condition (Fiebelkorn, Foxe, & Molholm, 2010; Zhao et al., 2021); (b) the focus of the current study was to investigate the influence of visual‐spatial attention under the premise that both the stimulus‐ and representation‐driven spreading should be prominent when visual‐spatially attended. On each trial, one of the three stimulus types was presented for 200 ms, followed by an inter‐trial interval varying from 1,000 to 1,200 ms randomly (see Figure 1a). Specifically, the V condition occurred on 40.625% of the trials (20.3125% left, 20.3125% right), the AV condition occurred on another 40.625% of the trials (20.3125% left, 20.3125% right in terms of the drawing's location), and the A condition occurred on the remaining 18.75% of the trials. The three stimulus types were presented in a pseudo‐randomized order.
The present experimental design combined the object‐selective visual “1‐back” paradigm used by Fiebelkorn, Foxe, and Molholm (2010) with the classic space‐selective visual attention paradigm (Anllo‐Vento & Hillyard, 1996). Subjects were instructed to make a button‐press (“J” on the keyboard) with their right index finger in response to the second of two consecutively presented drawings of the target object category (e.g., dogs, regardless of the within‐category identity) appearing at the to‐be‐attended spatial location (e.g., left side), while ignoring all drawings on the unattended side and all sounds if delivered (see the example shown in Figure 1a). The instructions emphasized both accuracy and speed of response. The probability of these response‐required target trials was maintained at 6.25% (3.125% V, 3.125% AV; 3.125% preceded by V, 3.125% preceded by AV). The to‐be‐attended spatial location (left or right) and the target object category (dog or car) were both defined before the beginning of a given block. The drawings of drums in the experiment always belonged to the nontarget object, serving only as neutral‐fillers to prevent an excess of object‐repetition trials (c.f., Molholm et al., 2007). The order of target‐left‐dog, target‐left‐car, target‐right‐dog, and target‐right‐car blocks was pseudo‐randomized. Therefore, the present design manipulated three critical within‐subject factors consisting of: (1) stimulus type (V, A, AV); (2) space‐based visual attention (attended, unattended); and (3) object‐based visual attention (target object, nontarget object). The whole experiment was comprised of 24 blocks (6 target‐left‐dog blocks, 6 target‐left‐car blocks, 6 target‐right‐dog blocks, and 6 target‐right‐car blocks) of 160 trials each. Subjects were required to have a break between blocks in order to relieve fatigue.
2.3. Electrophysiological recording and preprocessing
The continuous electroencephalogram (EEG) signals were recorded with a NeuroScan SynAmps system (NeuroScan, Inc.), using 57 tin electrodes mounted in an elastic cap (Electro‐Cap International, Inc.). These electrode sites were positioned according to a modified 10–10 system montage (for details, see Zhao et al., 2021). Two additional electrodes, AFz and M1 (left mastoid), were used as the ground and reference electrodes during data acquisition, respectively. Horizontal eye movements were detected by a pair of bipolar electrodes positioned at the left and right outer canthi (horizontal electrooculogram, HEOG). Vertical eye movements and blinks were detected by another pair of bipolar electrodes placed above and below the left eye (VEOG). The impedances of all electrodes were kept below 5 kΩ. The online EEG and EOG signals were filtered by a band‐pass filter of 0.05–100 Hz and digitized at a sampling rate of 1,000 Hz. EEG recording was carried out using “Scan” software (version 4.5, NeuroScan, Inc.).
In offline preprocessing, the continuous EEG signals were firstly down‐sampled to 500 Hz, and then low‐pass filtered (half‐amplitude cutoff = 33.75 Hz, transition band width = 7.5 Hz) using a zero‐phase shifted (two‐pass forward and reverse), Hamming‐windowed sinc FIR filter to attenuate high‐frequency noise triggered by muscle activities or external electrical sources. The filtered EEG data were re‐referenced to the average of the left and right mastoid (M1 and M2) electrodes. The re‐referenced EEG signals were then segmented into 600‐ms epochs time‐locked to the stimulus onset with a 100‐ms prestimulus baseline and were baseline‐corrected. Automatic artifact rejection was performed based on a threshold of ±75 μV for both EEG and EOG electrodes, in order to discard epochs contaminated by horizontal eye movements, eye blinks, and muscle activities. It was confirmed that the artifact rejection procedure here was effective at eliminating epochs during which participants had moved their eyes toward the visual stimulus location (see Figure S1). Moreover, to avoid contamination from motor responses associated with either target detection or false alarms, all response‐required target trials (i.e., the second of two consecutive trials that included drawings of the target object) and all false‐alarm trials were excluded from computing ERP waveforms (but were included in behavioral analysis; c.f., Donohue et al., 2011; Fiebelkorn, Foxe, & Molholm, 2010; Fiebelkorn, Foxe, Schwartz, & Molholm, 2010; Molholm et al., 2007).
The remaining EEG epochs, sorted according to stimulus type (V, A, AV), visual‐spatial attention (attended, unattended) and target condition (target object, nontarget object), were averaged to obtain corresponding ERP waveforms. Note that in order to increase the signal‐to‐noise ratio: (a) ERPs to the two object categories (dog and car) that could be either targets or nontargets in different blocks were collapsed (c.f., Fiebelkorn, Foxe, & Molholm, 2010; Molholm et al., 2007); (b) ERPs elicited in V and AV conditions were separately collapsed across visual stimulus location (left, right) and hemisphere of electrode (left, right) to obtain ERPs recorded from the ipsilateral electrodes and from the contralateral electrodes with respect to the visual stimulus location (c.f., Mishra, Martínez, Schroeder, & Hillyard, 2012; McDonald, Störmer, Martínez, Feng, & Hillyard, 2013; Feng, Störmer, Martínez, McDonald, & Hillyard, 2014), with the former being projected to the left hemisphere and the latter to the right hemisphere (e.g., see Figure 2b). Thus, there were on average 209.2 ± 5.1 (M ± SE) valid epochs in V_attended_target condition, 207.6 ± 5.0 in V_attended_nontarget condition, 210.6 ± 4.3 in V_unattended_target condition, 209.9 ± 4.8 in V_unattended_nontarget condition, 210.2 ± 4.6 in AV_attended_target condition, 204.3 ± 5.9 in AV_attended_nontarget condition, 213.1 ± 5.2 in AV_unattended_target condition, 208.7 ± 5.3 in AV_unattended_nontarget condition, 213.9 ± 5.2 in A_target condition, and 212.0 ± 5.8 in A_nontarget condition. Of note, the A_target and A_nontarget conditions could not be further divided into spatially attended and unattended conditions because the centrally presented auditory stimuli alone would not appear at either spatially attended or unattended visual field (i.e., left or right side). EEG preprocessing and subsequent ERP analysis were performed using the EEGLAB toolbox (Delorme & Makeig, 2004) in combination with custom‐built MATLAB scripts (The MathWorks, Inc.).
FIGURE 2.

(a) ERP waveforms elicited by peripheral visual stimuli as functions of visual‐spatial attention (attended, unattended) and target condition (target object [V+], nontarget object [V−]), which were averaged over the contralateral (relative to the side of visual stimuli) part of the posterior ROI (i.e., P6, P8, PO4, and PO8). The shaded areas on waveforms depict the time windows within which the P1 (90–120 ms), N1 (160–190 ms), and SN (240–290 ms) components were quantified, respectively. (b) Scalp topographies, with contralateral voltages being projected to the right hemisphere and ipsilateral to the left, are shown for the spatially attended minus unattended mean difference amplitudes within the P1 and N1 intervals (first and second columns), and for the target minus nontarget mean difference amplitudes within the SN interval (third column). The white dots on scalp topographies depict the whole posterior ROI (P5, P7, PO3, PO7; P6, P8, PO4, and PO8) over which each component was measured. Space‐based visual attention effects (P1 and N1 modulations) were independent of object‐based visual attention, but object‐based visual attention effect (SN amplitude) was strongly modulated by visual‐spatial attention
2.4. Data analysis
Firstly, the representation‐driven spread of attention effect was isolated as follows according to previous studies (Molholm et al., 2007; Fiebelkorn, Foxe, & Molholm, 2010): (1) For AV condition, the extracted auditory ERPs to audiovisual stimuli when their visual constituents were drawings of the visual target objects (i.e., A+V+ − V+) were compared across blocks with the extracted auditory ERPs to the same audiovisual stimuli when their visual constituents were drawings of the visual nontarget objects (i.e., A−V− − V−). For example, the extracted auditory ERPs to barks of dogs paired with drawings of dogs under target‐dog blocks were compared across blocks with the extracted auditory ERPs to the same stimuli under target‐car blocks (see Figure 1b, left, first and second rows). These comparisons were conducted separately for spatially attended and unattended conditions. Note that subtracting ERPs to V‐only condition from ERPs to AV condition allows for the extraction of auditory ERPs along with any potential cross‐modal attentional spreading effect (Busse et al., 2005; Donohue et al., 2011; Fiebelkorn, Foxe, & Molholm, 2010; Fiebelkorn, Foxe, Schwartz, & Molholm, 2010; Molholm et al., 2007; Zimmer, Itthipanyanan, et al., 2010). (2) For A‐only condition (Figure 1b, left, 3rd row), ERPs to auditory stimuli when their representations were corresponding to the visual target objects (i.e., A+; e.g., barks of dogs under target‐dog blocks) were compared across blocks with ERPs to the same auditory stimuli when their representations were corresponding to the visual nontarget objects (i.e., A−; e.g., barks of dogs under target‐car blocks). Second, to isolate the stimulus‐driven spread of attention effect, the extracted auditory ERPs to audiovisual stimuli when their visual constituents were drawings of the visual nontarget objects (i.e., A−V− − V−) were compared within blocks with ERPs to auditory‐only stimuli when their representations were corresponding to the visual nontarget objects (i.e., A−; c.f., Fiebelkorn, Foxe, & Molholm, 2010; Fiebelkorn, Foxe, Schwartz, & Molholm, 2010). For instance (Figure 1b, right), the extracted auditory ERPs to beeps of cars paired with drawings of cars under target‐dog blocks were compared within blocks with auditory‐only ERPs to beeps of cars. These comparisons were also conducted separately for spatially attended and unattended conditions. Of note, the ERPs to auditory‐only stimuli used for isolating the stimulus‐driven process in spatially attended and unattended conditions were identical, because the centrally delivered nontarget auditory‐only stimulus (A−) did not received any forms of visual attention (i.e., neither modality‐based, object‐based, nor space‐based), which was an ideal baseline.
The representation‐driven and stimulus‐driven spread of attention effects were both quantified by the mean amplitudes of the auditory‐selective negative difference (Nd) components, which were measured using consecutive 50‐ms time windows during 200–400 ms after sound onset over an anterior region of interest (ROI) consisting of nine adjacent fronto‐central electrodes (F1, Fz, F2, FC1, FCz, FC2, C1, Cz, and C2). These time window and electrodes were chosen a priori based on the recent study of Zhao et al. (2021) wherein both types of attentional spreading were investigated using the same auditory and visual stimuli. The utilization of consecutive 50‐ms windows rather than a single window encompassing a longer time range allowed for measuring the evolution of differences in both types of attentional spreading between spatially attended and unattended conditions (c.f., Donohue et al., 2011). Moreover, because object‐based visual attention were manipulated, the selection negativity (SN) was expected to occur when comparing the target with nontarget V‐only conditions (i.e., V+ vs. V−). Thus, the present study measured the mean voltage of SN component within a time interval of 240–290 ms after line‐drawing onset over a posterior ROI comprised of eight bilaterally parieto‐occipital sites (P7, P5, PO7, PO3; P6, P8, PO4, and PO8), which were also determined according to the study of Zhao et al. (2021). In addition, since space‐based visual attention were also manipulated, the classic P1 and N1 modulations were expected when comparing the spatially attended and unattended V‐only conditions. Therefore, the mean amplitudes of P1 and N1 components were quantified within 90–120 ms and 160–190 ms, respectively, over the same posterior ROI as SN component. The measuring windows for P1 and N1 components were chosen based on previous studies (P1: Donohue et al., 2011; Mishra et al., 2012; N1: Anllo‐Vento & Hillyard, 1996; Feng et al., 2014), and the ROI for P1 and N1 were identical to that for SN because the three visual ERPs, when examined in a single experiment, were typically measured by the same electrodes (e.g., Anllo‐Vento & Hillyard, 1996; Talsma et al., 2007), and the neural generators of all the three visual ERPs over bilateral occipital scalp have been localized to extrastriate visual cortex (Anllo‐Vento, Luck, & Hillyard, 1998; Di Russo, Martínez, & Hillyard, 2003; Di Russo, Martínez, Sereno, Pitzalis, & Hillyard, 2002).
For statistical analysis, first, to examine whether subjects maintained their space‐based and object‐based visual selective attention as instructed, and whether object‐based visual selection would be limited by space‐based visual attention, separate three‐way repeated‐measure ANOVAs with factors of visual‐spatial attention (attended, unattended), target condition (V+, V−) and hemisphere (ipsilateral, contralateral) were conducted on the mean amplitudes of P1, N1, and SN components for V‐only conditions. Second, to investigate whether the representation‐driven spread of attention in response to the auditory constituents of audiovisual target objects would be modulated by space‐based visual selective attention, a two‐way repeated‐measure ANOVA with factors of target condition [(A+V+ − V+), (A−V− − V−)] and visual‐spatial attention (attended, unattended) was conducted on the mean amplitudes within each Nd interval (i.e., consecutive 50‐ms intervals during 200–400 ms). Thirdly, a separate one‐way repeated‐measure ANOVA with a factor of target condition (A+, A−) was performed on the mean amplitudes within each Nd interval for A‐only conditions, in order to examine whether the representation‐driven spread of attention would occur even in the absence of target objects' visual representations, as reported previously (Fiebelkorn, Foxe, & Molholm, 2010; Molholm et al., 2007). To control the inflation of Type I error rate when dividing the whole 200–400 ms Nd interval into four consecutive 50‐ms intervals, p‐values for all planned ANOVAs on the Nd component were adjusted across the four consecutive intervals using the false discovery rate (FDR) correction (Benjamini & Hochberg, 1995), and the FDR‐corrected p‐value was denoted as “p FDR .” Last, to test whether the stimulus‐driven spread of attention would be modulated by space‐based visual attention, a repeated‐measure ANOVA with a single factor of stimulus type [(A−V− att − V− att), (A−V− unatt − V− unatt), A−] was conducted on the mean amplitudes within each Nd interval for ERP waveforms elicited by nontarget objects. The p‐values for these one‐way ANOVAs were first corrected using the Greenhouse–Geisser method (when the sphericity assumption was violated) and then adjusted also across the four consecutive intervals using the FDR correction. Pairwise comparisons were performed only after finding a significant main effect of stimulus type (i.e., p FDR <.05), using the protected least significant difference (LSD) method (c.f., Fiebelkorn, Foxe, & Molholm, 2010; Fiebelkorn, Foxe, Schwartz, & Molholm, 2010).
3. RESULTS
3.1. Behavioral results
The mean reaction times (RTs) and hit rates to the response‐required target trials (i.e., the second of two consecutive trials that included drawings of the target object appearing at spatially attended visual field) were compared between audiovisual targets and visual‐only targets by separate one‐way ANOVAs. The RTs were significantly longer in response to audiovisual than visual‐only targets [A+V+: 480.3 ± 17.0 ms (M ± SE); V+: 465.2 ± 15.5 ms; F (1,28) = 21.92, p <.0001, η 2 p = .44], and the hit rates were also significantly lower for audiovisual than visual‐only targets [A+V+: 92.6 ± 1.1%; V+: 93.7 ± 0.8%; F (1,28) = 4.59, p = .041, η 2 p = .14]. These behavioral results, in agreement with many prior findings (Fiebelkorn, Foxe, Schwartz, & Molholm, 2010; Molholm et al., 2007; Talsma et al., 2007), indicate that subjects attempted to filter out sensory information from the task‐irrelevant auditory modality, hence resulting in a behavioral cost in processing the audiovisual targets (for a similar interpretation, see Talsma et al., 2007). Moreover, the mean false alarm rate to auditory‐alone representations of target objects (i.e., A+) was negligible, only 0.06 ± 0.03%, suggesting that subjects were able to ignore the task‐irrelevant sounds as instructed (c.f., Fiebelkorn, Foxe, & Molholm, 2010).
3.2. ERP results
3.2.1. Object‐based visual selection is modulated by space‐based attention
To examine whether subjects maintained their space‐based and object‐based visual selective attention as instructed, and whether object‐based visual selection would be limited by space‐based visual attention, separate three‐way repeated‐measure ANOVAs with factors of visual‐spatial attention (attended, unattended), target condition (V+, V−) and hemisphere (ipsilateral, contralateral) were conducted on the mean amplitudes of P1, N1, and SN components for V‐only conditions (Figure 2).
The P1 (90–120 ms) and N1 (160–190 ms) components showed similar pattern of results. There were significant main effects of hemisphere [P1: F (1,28) = 10.11, p = .004, η 2 p = .27; N1: F (1,28) = 74.91, p <.0001, η 2 p = .73], with greater P1 and N1 amplitudes over the occipital scalp contralateral than ipsilateral to the side of visual stimuli. The main effects of visual‐spatial attention were significant (P1: F (1,28) = 9.41, p = .005, η 2 p = .25; N1: F (1,28) = 17.56, p = .0003, η 2 p = .39), while the main effects of target condition were not significant (P1: F (1,28) = 1.79, p = .192, η 2 p = .06; N1: F (1,28) = 0.001, p = .974, η 2 p <.0001). Importantly, there were highly significant spatial attention × hemisphere interactions (P1: F (1,28) = 11.89, p = .002, η 2 p = 0.30; N1: F (1,28) = 30.13, p <.0001, η 2 p = 0.52), which resulted from both the P1 and N1 amplitudes being significantly larger in response to spatially attended than unattended visual stimuli (i.e., the P1 and N1 attention effects) only over contralateral hemisphere (P1: F (1,28) = 17.97, p = .0002, η 2 p = .39, spatially attended = 0.55 ± 0.17 μV [M ± SE], unattended = 0.16 ± 0.15 μV, attended − unattended = 0.39 ± 0.09 μV; N1: F (1,28) = 29.57, p <.0001, η 2 p = .51, spatially attended = −2.49 ± 0.32 μV, unattended = −1.57 ± 0.25 μV, attended − unattended = −0.92 ± 0.17 μV; Figure 2b, first and second columns), but not over ipsilateral hemisphere (P1: F (1,28) = 1.41, p = .245, η 2 p = .05, spatially attended = −0.12 ± 0.10 μV, unattended = −0.22 ± 0.09 μV, attended − unattended = 0.11 ± 0.09 μV; N1: F (1,28) = 4.01, p = .055, η 2 p = .13, spatially attended = 0.07 ± 0.21 μV, unattended = 0.35 ± 0.15 μV, attended − unattended = −0.28 ± 0.14 μV). No other interactions reached significance (all Fs <1). These classic P1 and N1 spatial attention effects (Hillyard & Münte, 1984) revealed in the present study demonstrate that subjects maintained their space‐based visual selective attention as required.
In contrast, the three‐way ANOVA on mean amplitudes during SN interval (240–290 ms) showed a highly significant main effect of target condition (F (1,28) = 16.45, p = .0004, η 2 p = .37), with larger negative amplitude in response to visual target than nontarget objects (V+ − V−: −0.45 ± 0.11 μV; Figure 2a), indicating the presence of the SN difference component (Molholm et al., 2007) and hence the successful manipulation of object‐based visual selective attention. The main effects of visual‐spatial attention (F (1,28) = 2.15, p = .154, η 2 p = .07) and hemisphere (F (1,28) = 0.48, p = .495, η 2 p = .02) were not significant. However, there was a highly significant three‐way interaction of target condition, spatial attention and hemisphere (F (1,28) = 11.95, p = .002, η 2 p = .30), suggesting that the SN amplitude (V+ − V−) was influenced by visual‐spatial attention in different ways over contralateral and ipsilateral hemispheres. Indeed, while the target condition × spatial attention two‐way ANOVA conducted on amplitudes over ipsilateral hemisphere did not reveal any significant main effects (target condition: F (1,28) = 2.39, p = .133, η 2 p = .08; spatial attention: F (1,28) = 0.40, p = .534, η 2 p = .01] or interaction [F (1,28) = 0.27, p = .605, η 2 p = .01), the same ANOVA conducted on amplitudes over contralateral hemisphere showed a significant target condition × spatial attention interaction (F (1,28) = 9.40, p = .005, η 2 p = .25), reflected by the contralateral SN amplitude (V+ − V−) being greater at spatially attended than unattended visual field (spatially attended: −1.11 ± 0.22 μV; unattended: −0.37 ± 0.12 μV; Figure 2b, 3rd column). In addition, the contralateral SN amplitudes were significant at both spatially attended (V+ vs. V−: F (1,28) = 24.49, p < 0.0001, η 2 p = 0.47) and unattended (F (1,28) = 10.05, p = 0.004, η 2 p = 0.26) visual fields. Therefore, these findings demonstrate that when visual target and nontarget objects were presented sequentially, although object‐based visual selection can occur also at spatially unattended locations, its magnitude is strongly modulated by space‐based visual selective attention, as indicated in classic investigations (Anllo‐Vento & Hillyard, 1996; Hillyard & Münte, 1984; Karayanidis & Michie, 1996).
3.3. The representation‐driven spread of attention is independent of space‐selective visual attention but modulated by co‐occurrence of target objects’ visual representations
Since the object‐based visual selection was limited by space‐selective visual attention, it seems reasonable to expect that the representation‐driven spread of attention in response to the auditory constituents of audiovisual target objects would be also modulated by space‐selective visual attention. Thus, a target condition ([A+V+ − V+], [A−V− − V−]) × visual‐spatial attention (attended, unattended) two‐way ANOVA was conducted on the mean amplitudes within each Nd interval (i.e., consecutive 50‐ms intervals during 200–400 ms) over the fronto‐central ROI (Figure 3a,b). The main effect of target condition was highly significant throughout all time intervals during 200–400 ms (200–250 ms: F (1,28) = 8.32, p FDR = .007, η 2 p = .23; 250–300 ms: F (1,28) = 23.82, p FDR <.0001, η 2 p = .46; 300–350 ms: F (1,28) = 62.44, p FDR <.0001, η 2 p = .69; 350–400 ms: F (1,28) = 27.25, p FDR <.0001, η 2 p = .49; where “p FDR ” was the FDR‐corrected p‐value across the four consecutive intervals), with larger negative amplitude in response to the auditory representations of audiovisual target than nontarget objects ([A+V+ − V+] – [A−V− − V−], 200–250 ms: −0.60 ± 0.21 μV (M ± SE); 250–300 ms: −1.03 ± 0.21 μV; 300–350 ms: −1.38 ± 0.17 μV; 350–400 ms: −0.97 ± 0.19 μV), indicating the occurrence of prominent representation‐driven Nd difference component (Fiebelkorn, Foxe, & Molholm, 2010; Molholm et al., 2007; Zhao et al., 2021). The main effect of visual–spatial attention was significant only during 200–300 ms (200–250 ms: F (1,28) = 12.82, p FDR = .004, η 2 p = .31; 250–300 ms: F (1,28) = 7.41, p FDR = .022, η 2 p = .21; 300–350 ms: F (1,28) = 0.47, p FDR = .498, η 2 p = .02; 350–400 ms: F (1,28) = 2.35, p FDR = .181, η 2 p = .08). Most importantly, the target condition × spatial attention interaction, however, was nonsignificant during all consecutive windows within 200–400 ms (200–250 ms: F (1,28) = 1.06, p FDR = .548, η 2 p = .04; 250–300 ms: F (1,28) = 0.70, p FDR = .548, η 2 p = .02; 300–350 ms: F (1,28) = 1.34, p FDR = .548, η 2 p = .05; 350–400 ms: F (1,28) = 0.05, p FDR = .826, η 2 p = .002). The consistent pattern of results indicate that in contrast to object‐based visual selection, the representation‐driven attentional spreading from visual to auditory representations of audiovisual target objects is nonetheless independent of space‐based visual selective attention.
FIGURE 3.

The extracted auditory ERP waveforms to audiovisual stimuli when their visual constituents were the target (red traces: A+V+ − V+) and nontarget (blue traces: A−V− − V−) objects, plotted separately for (a) visual‐spatially attended and (b) unattended conditions. (c) ERP waveforms elicited by auditory‐only stimuli when their representations were corresponding to target (red trace: A+) and nontarget (blue trace: A−) objects. These ERP waveforms were averaged over the fronto‐central ROI (F1, Fz, F2, FC1, FCz, FC2, C1, Cz, and C2). The shaded areas on waveforms depict the four time windows (200–250 ms, 250–300 ms, 300–350 ms, and 350–400 ms) within which the Nd component was quantified. Scalp topographies (depicting voltages contralateral to the side of visual constituents on the right hemisphere and ipsilateral on the left for AV stimuli), are shown as the target minus nontarget mean difference amplitudes within each Nd interval for each condition. The white dots on topographies depict the fronto‐central ROI over which the Nd component was measured. For AV stimuli (a,b), the representation‐driven Nd component, indexed by significantly larger negative amplitude for target than nontarget objects, was prominent and sustained independent of space‐selective visual attention; for A‐only stimuli (c), the Nd amplitude was decreased and less sustained. *: p <.05 for the target versus nontarget contrast
To provide further evidence for the null effect of space‐based visual selective attention on the representation‐driven attentional spreading, an additional Bayesian two‐way ANOVA was also conducted on the mean amplitudes within each Nd interval because a Bayes factor (BF 10) below 0.333 has been considered as substantial evidence for a null hypothesis (Dienes, 2014; Wagenmakers et al., 2018). Indeed, the Bayes factor for the target condition × spatial attention interaction was found to be smaller than 0.333 during all consecutive Nd windows (200–250 ms: BF 10 = 0.314; 250–300 ms: BF 10 = 0.309; 300–350 ms: BF 10 = 0.320; 350–400 ms: BF 10 = 0.289). Thus, the Bayesian analysis provides convergent support for the finding that the representation‐driven cross‐modal spread of attention is independent of space‐based visual selective attention.
A separate one‐way ANOVA with a factor of target condition (A+, A−) was performed on the mean amplitudes within each Nd interval for A‐only conditions (Figure 3c), in order to examine whether the representation‐driven spread of attention would occur even in the absence of target objects' visual representations, as reported previously (Fiebelkorn, Foxe, & Molholm, 2010; Molholm et al., 2007). Indeed, ERP waveforms to auditory‐only stimuli were significantly more negative when they were representations of target objects (A+) than when they were representations of nontarget objects (A−), but only within 250–350 ms (200–250 ms: F (1,28) = 1.18, p FDR = .286, η 2 p = .04, A+ − A− = −0.21 ± 0.19 μV; 250–300 ms: F (1,28) = 9.22, p FDR = .020, η 2 p = .25, A+ − A− = −0.57 ± 0.19 μV; 300–350 ms: F (1,28) = 6.60, p FDR = .032, η 2 p = .19, A+ − A− = −0.51 ± 0.20 μV; 350–400 ms: F (1,28) = 2.82, p FDR = .139, η 2 p = .09, A+ − A− = −0.38 ± 0.23 μV), suggesting that the representation‐driven attentional spreading effect seems less sustained for auditory‐only than audiovisual representations of target objects. Further inspection of Figure 3 implies that even within 250–350 ms, the representation‐driven Nd amplitude appeared to be smaller for auditory‐only than audiovisual stimuli (see Figure 3c vs. 3a,b). Post hoc comparisons conducted on the Nd amplitudes (i.e., target minus nontarget difference) within 250–300 ms and 300–350 ms revealed that the representation‐driven Nd amplitude for auditory‐only stimuli tended to be smaller (with marginal significance) than that for audiovisual stimuli with visual‐spatial attention during 300–350 ms (250–300 ms: F (1,28) = 0.90, p FDR = .351, η 2 p = .03; 300–350 ms: F (1,28) = 3.83, p FDR = .080, η 2 p = .12), and was significantly smaller than that for audiovisual stimuli without visual‐spatial attention during 300–350 ms (250–300 ms: F (1,28) = 4.98, p FDR = .067, η 2 p = .15; 300–350 ms: F (1,28) = 12.63, p FDR = .005, η 2 p = .31). These findings demonstrate that although the representation‐driven spread of attention can be elicited without the co‐occurring visual representations of target objects, its magnitude will be amplified if the visual representations of target objects do co‐occur with the task‐irrelevant auditory representations of target objects.
3.4. The stimulus‐driven spread of attention is modulated by, but not entirely dependent on, space‐selective visual attention
To test whether the stimulus‐driven spread of attention would be modulated by space‐based visual attention, a repeated‐measure ANOVA with a single factor of stimulus type [(A−V− att − V− att), (A−V− unatt − V− unatt), A−] was conducted on the mean amplitudes within each Nd interval (i.e., consecutive 50‐ms intervals during 200–400 ms) over the fronto‐central ROI for ERP waveforms elicited by nontarget objects (Figure 4). The results showed that the main effect of stimulus type was highly significant during 200–250 ms (F (2,56) = 9.69, p FDR = .0004, η 2 p = .26) and 250–300 ms (F (2,56) = 32.76, p FDR <.0001, η 2 p = .54) but not during 300–350 ms (F (2,56) = 0.14, p FDR = .874, η 2 p = .01) nor 350–400 ms (F (2,56) = 0.79, p FDR = .615, η 2 p = 0.03). Pairwise comparisons for the stimulus type main effect within 200–250 ms revealed that the stimulus‐driven Nd component, indexed by significantly greater negative amplitudes on the extracted auditory than auditory‐only nontarget ERP waveforms (Fiebelkorn, Foxe, & Molholm, 2010; Fiebelkorn, Foxe, Schwartz, & Molholm, 2010; Zhao et al., 2021), were evident only when the visual constituents of audiovisual nontarget objects were spatially attended (p = .0006, d = 0.72, [A−V− att − V− att] − A− = −0.92 ± 0.24 μV [M ± SE]; Figure 4, 1st row), but not when the visual constituents of audiovisual nontarget objects were spatially unattended (p = 0.860, d = 0.03, [A−V− unatt − V− unatt] − A− = −0.04 ± 0.24 μV), with the former being substantially larger than the latter as well (p = .0008, d = 0.70). The pairwise comparisons within 250–300 ms, in contrast, showed that although the stimulus‐driven Nd amplitude continued to be greater when the visual constituents of audiovisual nontarget objects were spatially attended than unattended (p = .002, d = 0.62), it was highly significant not only when the visual constituents of audiovisual nontarget objects were spatially attended (p <.0001, d = 1.41, [A−V− att − V− att] − A− = −1.81 ± 0.24 μV), but also when the visual constituents of audiovisual nontarget objects were spatially unattended (p <.0001, d = 0.89, [A−V− unatt − V− unatt] − A− = −1.14 ± 0.24 μV; Figure 4, 2nd row). These results demonstrate, for the first time, that although the stimulus‐driven attentional spreading is reliably modulated, as shown in previous studies, by space‐based visual selective attention (Busse et al., 2005; Donohue et al., 2011; Zimmer, Itthipanyanan, et al., 2010), it can be also elicited to a certain extent even when the peripherally presented visual constituents of audiovisual nontarget objects are outside the focus of spatial spotlight of attention.
FIGURE 4.
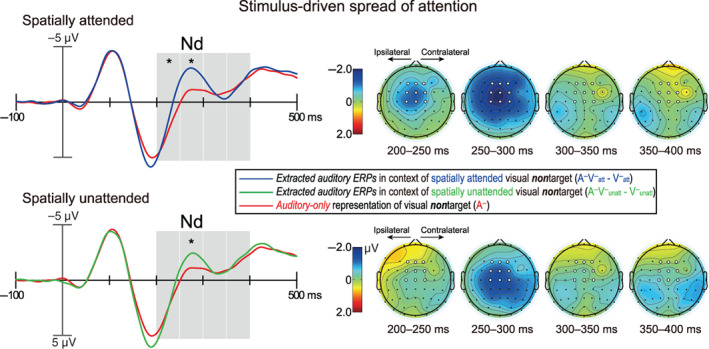
Left: The extracted‐auditory ERP waveforms to visual‐spatially attended (blue trace) and unattended (green trace) audiovisual stimuli when their visual constituents were the nontarget objects, and ERP waveforms evoked by auditory‐only stimuli (red traces) when their representations were corresponding to the nontarget objects. These ERP waveforms were averaged over the same fronto‐central ROI as Figure 3, and shaded areas on waveforms depict the same successive Nd intervals as Figure 3. Right: Scalp topographies are shown for the extracted‐auditory minus auditory‐only difference amplitudes during each Nd interval separately for visual‐spatially attended [(A−V− att − V− att) − A−] and unattended [(A−V− unatt − V− unatt) − A−] conditions, with voltages contralateral to the side of visual constituents being projected to the right hemisphere and ipsilateral to the left. Although the stimulus‐driven Nd component, indexed by significantly greater negative amplitude on the extracted auditory than auditory‐only nontarget ERP waveforms, was larger when the visual constituents of audiovisual nontarget objects were spatially attended than unattended, it was still evident to some extent when the visual constituents of audiovisual nontarget objects were spatially unattended. *: p <.05 for the extracted auditory versus auditory‐only contrast
Lastly, it should be noted that since the three stimulus types (AV, V, A) were presented in a pseudo‐randomized order under the present paradigm, it is possible that the auditory‐only stimuli, when presented, may transiently capture attention away from the to‐be‐attended visual modality and then render the auditory stimuli slightly attended. Consequently, these undesirable attentional capture and switch across modalities might impact the above‐reported results regarding both the representation‐driven and stimulus‐driven attentional spreading. However, further ratiocination and ERP analysis indicate that these undesirable effects would not challenge the main findings of the present study, which were detailed in Supporting Information, Section B: evaluating the influences of attentional capture by auditory stimuli.
4. DISCUSSION
The first goal of the current ERP study was to examine the contribution of space‐based visual selective attention to the representation‐driven cross‐modal spread of attention. The representation‐driven attentional spreading was hypothesized to operate independently of space‐based visual selective attention (Fiebelkorn, Foxe, & Molholm, 2010), and the grounds for the proposal were that feature‐ or object‐based visual selection could occur even at spatially unattended locations (Chelazzi et al., 1993; Chelazzi et al., 1998; Sàenz et al., 2003; Serences & Boynton, 2007; Treue & Martínez‐Trujillo, 1999; Zhang & Luck, 2009). However, the present results showed that although object‐based visual selection, characterized as SN component (240–290 ms) in the target minus nontarget visual ERP difference waveforms, could occur to some extent at spatially unattended visual field, its magnitude was largely attenuated instead of showing a spatially invariant pattern. These findings are consistent with classic investigations showing that when visual target and nontarget features are presented sequentially, feature‐based visual selection is strongly modulated by space‐based visual selective attention (Anllo‐Vento & Hillyard, 1996; Hillyard & Münte, 1984; Karayanidis & Michie, 1996). Accordingly, it seems plausible to predict that the representation‐driven spread of attention from visual to auditory representations of audiovisual target objects would be also modulated by space‐selective visual attention. Interestingly enough, the prediction was nonetheless refuted by the present data yielding that the representation‐driven attentional spreading, indexed by the fronto‐central Nd component (200–400 ms) in the target minus nontarget extracted auditory ERP difference waveforms, did not differ significantly according to whether the unilaterally presented visual constituents of audiovisual target objects were spatially attended or unattended. Therefore, the present data actually supports the original hypothesis that the representation‐driven spread of attention can occur independently of space‐based visual selective attention (Fiebelkorn, Foxe, & Molholm, 2010), although the spatially invariant pattern of representation‐driven attentional spreading does not result from object‐based visual selection itself being “spatially global.”
More importantly, the experimental dissociation between the space‐dependent visual object selection and the space‐independent attentional spreading to auditory representations of audiovisual target objects strongly suggests that they are relatively independent and parallel processes. Specifically, although the present task required top‐down activation of target objects' visual representations only at the designated spatial location (which would result in visual object selection being modulated by spatial attention), the concomitant and involuntary co‐activation of target objects' task‐irrelevant auditory representations due to highly learned audiovisual semantic associations seemed to operate in a diffuse, space‐nonspecific manner. In other words, no matter what spatial location the object‐based visual selective attention was actually directed to, the auditory representations of target objects would be activated as a by‐product in all space range, hence leading the representation‐driven attentional spreading effect to be spatially global. This interpretation of relatively independent processes fits well with the consistently reported (including the present) finding that the representation‐driven attentional spreading to auditory stimuli could be elicited even when there was no co‐occurring visual stimuli for object‐based visual attention to select (i.e., when sounds of target objects were delivered alone; Fiebelkorn, Foxe, & Molholm, 2010; Molholm et al., 2007; Zhao et al., 2021). Furthermore, convergent evidence for the parallel nature of object‐based visual selection and representation‐driven attentional spreading comes also from both previous studies (Molholm et al., 2007; Zhao et al., 2021) and the present study revealing that the neural bases of both processes (i.e., the SN and Nd) had similar, if not identical, onset timing (both within 200–300 ms). Indeed, if the representation‐driven attentional spreading were hierarchically contingent on object‐based visual selection, ERP correlates of the latter should have occurred much earlier than the former, instead of within similar time range.
Although the aforementioned findings demonstrate that the representation‐driven spread of attention is relatively independent of object‐based visual selection for actually presented visual representations of target objects, it does not mean that the occurrence of the latter has no influence on the former at all: if that were the case, the magnitude of representation‐driven attentional spreading should have been comparable when auditory representations of target objects were presented alone (i.e., A+) relative to that when both auditory and visual representations of target objects were presented simultaneously (i.e., A+V+). However, the current study refutes this prediction by showing that compared with audiovisual target objects (regardless of whether their visual constituents were spatially attended or not), the representation‐driven Nd amplitude in response to auditory‐only representations of target objects was less sustained and substantially smaller (see Figure 3a,b vs. Figure 3c). This finding indicates that the object‐based visual selection, which would occur only when visual representations of target objects were presented, can further amplify the magnitude of representation‐driven attentional spreading. On the other hand, recall that the magnitude of representation‐driven attentional spreading did not differ significantly according to whether the unilaterally presented visual constituents of audiovisual target objects received stronger object‐based attention (at the spatially attended location) or weaker object‐based attention (at the spatially unattended location). Thus, it seems that the object‐based visual selection might facilitate the representation‐driven attentional spreading effect in an all‐or‐nothing manner: the representation‐driven attentional spreading would be amplified as long as the object‐based visual selection occurs (when visual representations of target objects are available), but the strength of the latter would not further modulate the magnitude of the former. Taken together, the current findings suggest a subtle relationship that the representation‐driven spread of attention is not only relatively independent of, but also benefits in an all‐or‐nothing manner from, the object‐based visual selection for actually presented visual representations of target objects, which extends previous understandings regarding the mechanism of the representation‐driven attentional spreading (Fiebelkorn, Foxe, & Molholm, 2010; Molholm et al., 2007; Zhao et al., 2021).
The underlying reasons for the beneficial effect of object‐based visual selection for actually presented visual representations of target objects on the representation‐driven attentional spreading deserve further investigations. Nonetheless, the present study speculate that when both the auditory and visual representations of target objects were presented simultaneously, the processing gain for their visual representations might increase the matching degree between the actually presented auditory representations and the already co‐activated templates of auditory representations through the audiovisual temporal simultaneity, whereby further boosting the representation‐driven attentional spreading relative to when auditory representations of target objects were presented alone. This inference is consistent with prior studies revealing that concurrent visual cues can facilitate phonological recognition (Macleod & Summerfield, 1987; Zekveld et al., 2011; Zekveld, Kramer, Kessens, Vlaming, & Houtgast, 2008). If that is the case, this inference would suggest that the role of audiovisual temporal simultaneity in the representation‐driven spread of attention may be underestimated in previous studies (Molholm et al., 2007; Fiebelkorn, Foxe, & Molholm, 2010; Zhao et al., 2021). Further studies with a systematic manipulation of the audiovisual temporal synchrony are required to test the present speculation.
The second goal of the present ERP study was to investigate whether space‐based visual selective attention is the endogenous (i.e., top‐down) determinant of the stimulus‐driven cross‐modal spread of attention. Although it has been considered that the stimulus‐driven attentional spreading occurs only when the visual constituent of an audiovisual stimulus is presented within the focus of visual‐spatial attention (Busse et al., 2005; Donohue et al., 2011; Fiebelkorn, Foxe, & Molholm, 2010; Fiebelkorn, Foxe, Schwartz, & Molholm, 2010; Talsma et al., 2007; Zimmer, Itthipanyanan, et al., 2010; Zimmer, Roberts, et al., 2010), as reviewed in Introduction section, previous methods of isolating the stimulus‐driven attentional spreading effect ignored the potential role of attentional allocation to visual modality per se (manifested in task as focusing only on visual stimuli while ignoring all sounds). The present data first yielded that the stimulus‐driven spread of attention, characterized as the fronto‐central Nd (200–300 ms) in the extracted‐auditory minus auditory‐only nontarget ERP difference waveforms, was stronger when the peripheral visual constituents of audiovisual nontarget objects were presented at spatially attended than unattended locations, as expected (Busse et al., 2005; Donohue et al., 2011; Zimmer, Itthipanyanan, et al., 2010). Importantly, it was found that the stimulus‐driven spread of attention was also statistically evident during 250–300 ms even when the visual constituents of audiovisual nontarget objects were presented at spatially unattended locations. Given that the spatially unattended peripheral visual constituents were still attended in terms of modality, the current findings suggest that space‐based visual selective attention is actually a modulating factor of the stimulus‐driven spread of attention. Instead, attentional allocation to visual modality, based on which visual‐spatial selection further operates, is more likely to be the endogenous determinant of the stimulus‐driven spread of attention, hence updating our understanding of the mechanism responsible for the stimulus‐driven attentional spreading.
It might be argued that the present occurrence of stimulus‐driven attentional spreading from the spatially unattended visual field resulted solely from the visual constituents of audiovisual nontarget objects presented at unattended locations transiently capturing spatial attention resources. However, this interpretation seems unlikely for several reasons. First, the salience of visual stimulus was minimized in the current study by setting the background color of each line‐drawing to the same as that of the screen (see Figure 1a). Second, the classic P1 and N1 spatial attention effects (Hillyard & Münte, 1984) shown in the present ERP analysis of V‐only conditions demonstrate that our subjects maintained a strong focus on the to‐be‐attended spatial location. In particular, there was little to no P1 wave in response to the present spatially unattended visual stimuli (see Figure 2a, right). Had visual stimuli presented at spatially unattended locations captured spatial attention, a clear P1 wave should have been evident in the present study (e.g., see Störmer, McDonald, & Hillyard, 2019). Third and most importantly, previous studies have shown that when visual attention is strongly focused on a particular location in advance, abrupt visual transients presented at other locations cease to attract spatial attention (Belopolsky & Theeuwes, 2010; Theeuwes, 1991; Yantis & Jonides, 1990). For example, Theeuwes (1991) found that when attention was focused on the left or right target location 4.2° from the center fixation, the visual transient abruptly presented at another side of the fixation, which was approximately 9° from the target location, could not capture spatial attention. Given that the center‐to‐center distance between spatially attended and unattended locations was up to 24.18° in the current study (see Figure 1a), it appears again that the visual constituents of audiovisual nontarget objects presented at the current unattended locations are ineffective in capturing spatial attention.
One might also argue that the reason for the current occurrence of stimulus‐driven attentional spreading from the spatially unattended visual field was that there were some residual spatial attention resources at unattended locations when subjects covertly attended to the designated spatial location. However, a recent study using steady‐state visual evoked potential (SSVEP) technique to characterize the distribution of visual–spatial attention (Shioiri, Honjyo, Kashiwase, Matsumiya, & Kuriki, 2016) found that when subjects selectively and covertly attended to one of eight visual disks (each 7° in diameter) arranged circularly around, and 13.5° away from, the central fixation, the normalized SSVEP amplitudes stopped to show further decrease in response to the flickering disks 19.09° away from the attended one, suggesting the radius of visual‐spatial attention's distribution, whose shape was suggested to be annular (Biggs & Gibson, 2018), was less than 19.09° in that case. In the current study, the size and eccentricity of the visual stimulus (8.40° × 6.72° and 12.09°, respectively) were comparable to those used in Shioiri et al. (2016), thus the influence of space‐based selective attention seems less likely to cover the current unattended location that was up to 24.18° away from the spatially attended location, thereby highlighting the role of modality‐based visual attention in triggering the stimulus‐driven spread of attention.
5. CONCLUSION
In summary, the present study revealed, on the one hand, that the representation‐driven attentional spreading, occurring as a by‐product of top‐down activation of target objects' visual representations, was unaffected by space‐based visual selective attention but modulated by the co‐occurrence of target objects' visual representations, suggesting that the representation‐driven attentional spreading is not only relatively independent of, but also benefits in an all‐or‐nothing manner from, the object‐based visual selection for actually presented visual representations of target objects. On the other hand, the stimulus‐driven attentional spreading was modulated by space‐based visual selective attention but still prominent when the visual constituents of audiovisual nontarget objects were spatially unattended, implying that attentional allocation to visual modality per se is more likely to be the endogenous determinant of the stimulus‐driven attentional spreading than further space‐selective visual attention. These new findings not only update the existing dual‐mechanism model for cross‐modal attentional spreading (Fiebelkorn, Foxe, & Molholm, 2010) in particular, by providing novel insights into the origins of the two types of cross‐modal attentional spreading, but also extend our understandings regarding the subtle and complicated influences of various forms of top‐down attentional deployment on multisensory processing in general (Talsma, 2015).
CONFLICT OF INTEREST
The authors declare no potential conflict of interest.
AUTHOR CONTRIBUTIONS
Song Zhao, Yang Li, and Wenfeng Feng designed the research; Song Zhao, Yang Li, and Chongzhi Wang performed the research; Song Zhao, Yang Li, and Wenfeng Feng analyzed the data; Song Zhao, Chengzhi Feng, and Wenfeng Feng wrote the article.
Supporting information
Appendix S1. Supporting Information
Zhao, S. , Li, Y. , Wang, C. , Feng, C. , & Feng, W. (2021). Updating the dual‐mechanism model for cross‐sensory attentional spreading: The influence of space‐based visual selective attention. Human Brain Mapping, 42(18), 6038–6052. 10.1002/hbm.25668
Funding information National Natural Science Foundation of China, Grant/Award Numbers: 31771200, 32171048
DATA AVAILABILITY STATEMENT
The data and code used in this study are available from the corresponding author upon reasonable request.
REFERENCES
- Andersen, S. K. , Fuchs, S. , & Müller, M. M. (2011). Effects of feature‐selective and spatial attention at different stages of visual processing. Journal of Cognitive Neuroscience, 23(1), 238–246. 10.1162/jocn.2009.21328 [DOI] [PubMed] [Google Scholar]
- Anllo‐Vento, L. , & Hillyard, S. A. (1996). Selective attention to the color and direction of moving stimuli: Electrophysiological correlates of hierarchical feature selection. Perception & Psychophysics, 58(2), 191–206. 10.3758/bf03211875 [DOI] [PubMed] [Google Scholar]
- Anllo‐Vento, L. , Luck, S. J. , & Hillyard, S. A. (1998). Spatio‐temporal dynamics of attention to color: Evidence from human electrophysiology. Human Brain Mapping, 6(4), 216–238. [DOI] [PMC free article] [PubMed] [Google Scholar]
- Bartsch, M. V. , Boehler, C. N. , Stoppel, C. M. , Merkel, C. , Heinze, H.‐J. , Schoenfeld, M. A. , & Hopf, J.‐M. (2015). Determinants of global color‐based selection in human visual cortex. Cerebral Cortex, 25(9), 2828–2841. 10.1093/cercor/bhu078 [DOI] [PubMed] [Google Scholar]
- Bartsch, M. V. , Donohue, S. E. , Strumpf, H. , Schoenfeld, M. A. , & Hopf, J.‐M. (2018). Enhanced spatial focusing increases feature‐based selection in unattended locations. Scientific Reports, 8, 16132. 10.1038/s41598-018-34424-5 [DOI] [PMC free article] [PubMed] [Google Scholar]
- Belopolsky, A. V. , & Theeuwes, J. (2010). No capture outside the attentional window. Vision Research, 50(23), 2543–2550. 10.1016/j.visres.2010.08.023 [DOI] [PubMed] [Google Scholar]
- Benjamini, Y. , & Hochberg, Y. (1995). Controlling the false discovery rate: A practical and powerful approach to multiple testing. Journal of the Royal Statistical Society: Series B (Methodological), 57(1), 289–300. 10.1111/j.2517-6161.1995.tb02031.x [DOI] [Google Scholar]
- Bertelson, P. , & Aschersleben, G. (1998). Automatic visual bias of perceived auditory location. Psychonomic Bulletin & Review, 5(3), 482–489. 10.3758/BF03208826 [DOI] [Google Scholar]
- Biggs, A. T. , & Gibson, B. S. (2018). Opening the window: Size of the attentional window dominates perceptual load and familiarity in visual selection. Journal of Experimental Psychology: Human Perception & Performance, 44(11), 1780–1798. 10.1037/xhp0000565 [DOI] [PubMed] [Google Scholar]
- Bondarenko, R. , Boehler, C. N. , Stoppel, C. M. , Heinze, H.‐J. , Schoenfeld, M. A. , & Hopf, J.‐M. (2012). Separable mechanisms underlying global feature‐based attention. Journal of Neuroscience, 32(44), 15284–15295. 10.1523/JNEUROSCI.1132-12.2012 [DOI] [PMC free article] [PubMed] [Google Scholar]
- Busse, L. , Roberts, K. C. , Crist, R. E. , Weissman, D. H. , & Woldorff, M. G. (2005). The spread of attention across modalities and space in a multisensory object. Proceedings of the National Academy of Sciences, 102(51), 18751–18756. 10.1073/pnas.0507704102 [DOI] [PMC free article] [PubMed] [Google Scholar]
- Chelazzi, L. , Duncan, J. , Miller, E. K. , & Desimone, R. (1998). Responses of neurons in inferior temporal cortex during memory‐guided visual search. Journal of Neurophysiology, 80(6), 2918–2940. 10.1152/jn.1998.80.6.2918 [DOI] [PubMed] [Google Scholar]
- Chelazzi, L. , Miller, E. K. , Duncan, J. , & Desimone, R. (1993). A neural basis for visual search in inferior temporal cortex. Nature, 363(6427), 345–347. 10.1038/363345a0 [DOI] [PubMed] [Google Scholar]
- De Meo, R. , Murray, M. M. , Clarke, S. , & Matusz, P. J. (2015). Top‐down control and early multisensory processes: Chicken vs. egg. Frontiers in Integrative Neuroscience, 9, 17. 10.3389/fnint.2015.00017 [DOI] [PMC free article] [PubMed] [Google Scholar]
- Delorme, A. , & Makeig, S. (2004). EEGLAB: An open source toolbox for analysis of single‐trial EEG dynamics including independent component analysis. Journal of Neuroscience Methods, 134(1), 9–21. 10.1016/j.jneumeth.2003.10.009 [DOI] [PubMed] [Google Scholar]
- Di Russo, F. , Martínez, A. , & Hillyard, S. A. (2003). Source analysis of event‐related cortical activity during visuo‐spatial attention. Cerebral Cortex, 13(5), 486–499. 10.1093/cercor/13.5.486 [DOI] [PubMed] [Google Scholar]
- Di Russo, F. , Martínez, A. , Sereno, M. I. , Pitzalis, S. , & Hillyard, S. A. (2002). The cortical sources of the early components of the visual evoked potential. Human Brain Mapping, 15(2), 95–111. 10.1002/hbm.10010 [DOI] [PMC free article] [PubMed] [Google Scholar]
- Dienes, Z. (2014). Using Bayes to get the most out of non‐significant results. Frontiers in Psychology, 5, 781. 10.3389/fpsyg.2014.00781 [DOI] [PMC free article] [PubMed] [Google Scholar]
- Donohue, S. E. , Roberts, K. C. , Grent‐'T‐Jong, T. , & Woldorff, M. G. (2011). The cross‐modal spread of attention reveals differential constraints for the temporal and spatial linking of visual and auditory stimulus events. Journal of Neuroscience, 31(22), 7982–7990. 10.1523/JNEUROSCI.5298-10.2011 [DOI] [PMC free article] [PubMed] [Google Scholar]
- Feng, W. , Störmer, V. S. , Martínez, A. , McDonald, J. J. , & Hillyard, S. A. (2014). Sounds activate visual cortex and improve visual discrimination. Journal of Neuroscience, 34(29), 9817–9824. 10.1523/JNEUROSCI.4869-13.2014 [DOI] [PMC free article] [PubMed] [Google Scholar]
- Fiebelkorn, I. C. , Foxe, J. J. , & Molholm, S. (2010). Dual mechanisms for the cross‐sensory spread of attention: How much do learned associations matter? Cerebral Cortex, 20(1), 109–120. 10.1093/cercor/bhp083 [DOI] [PMC free article] [PubMed] [Google Scholar]
- Fiebelkorn, I. C. , Foxe, J. J. , Schwartz, T. H. , & Molholm, S. (2010). Staying within the lines: The formation of visuospatial boundaries influences multisensory feature integration. European Journal of Neuroscience, 31(10), 1737–1743. 10.1111/j.1460-9568.2010.07196.x [DOI] [PubMed] [Google Scholar]
- Giard, M. H. , Fort, A. , Mouchetant‐Rostaing, Y. , & Pernier, J. (2000). Neurophysiological mechanisms of auditory selective attention in humans. Frontiers in Bioscience, 5(1), 84–94. 10.2741/giard [DOI] [PubMed] [Google Scholar]
- Han, S. , Liu, W. , Yund, E. W. , & Woods, D. L. (2000). Interactions between spatial attention and global/local feature selection: An ERP study. Neuroreport, 11(12), 2753–2758. 10.1097/00001756-200008210-00029 [DOI] [PubMed] [Google Scholar]
- Hansen, J. C. , & Hillyard, S. A. (1980). Endogenous brain potentials associated with selective auditory attention. Electroencephalography and Clinical Neurophysiology, 49(3), 277–290. 10.1016/0013-4694(80)90222-9 [DOI] [PubMed] [Google Scholar]
- Hillyard, S. A. , & Münte, T. F. (1984). Selective attention to color and location: An analysis with event‐related brain potentials. Perception & Psychophysics, 36(2), 185–198. 10.3758/bf03202679 [DOI] [PubMed] [Google Scholar]
- Ibos, G. , & Freedman, D. J. (2016). Interaction between spatial and feature attention in posterior parietal cortex. Neuron, 91(4), 931–943. 10.1016/j.neuron.2016.07.025 [DOI] [PMC free article] [PubMed] [Google Scholar]
- Karayanidis, F. , & Michie, P. T. (1996). Frontal processing negativity in a visual selective attention task. Electroencephalography and Clinical Neurophysiology, 99(1), 38–56. 10.1016/0921-884x(96)95116-4 [DOI] [PubMed] [Google Scholar]
- Leonard, C. J. , Balestreri, A. , & Luck, S. J. (2015). Interactions between space‐based and feature‐based attention. Journal of Experimental Psychology: Human Perception & Performance, 41(1), 11–16. 10.1037/xhp0000011 [DOI] [PMC free article] [PubMed] [Google Scholar]
- Macaluso, E. , Noppeney, U. , Talsma, D. , Vercillo, T. , Hartcher‐O'Brien, J. , & Adam, R. (2016). The curious incident of attention in multisensory integration: Bottom‐up vs. top‐down. Multisensory Research, 29(6), 557–583. 10.1163/22134808-00002528 [DOI] [Google Scholar]
- Macleod, A. , & Summerfield, Q. (1987). Quantifying the contribution of vision to speech perception in noise. British Journal of Audiology, 21(2), 131–141. 10.3109/03005368709077786 [DOI] [PubMed] [Google Scholar]
- McDonald, J. J. , Störmer, V. S. , Martínez, A. , Feng, W. , & Hillyard, S. A. (2013). Salient sounds activate visual cortex automatically. Journal of Neuroscience, 33(21), 9194–9201. 10.1523/JNEUROSCI.5902-12.2013 [DOI] [PMC free article] [PubMed] [Google Scholar]
- Mishra, J. , Martínez, A. , Schroeder, C. E. , & Hillyard, S. A. (2012). Spatial attention boosts short‐latency neural responses in human visual cortex. NeuroImage, 59(2), 1968–1978. 10.1016/j.neuroimage.2011.09.028 [DOI] [PMC free article] [PubMed] [Google Scholar]
- Molholm, S. , Martinez, A. , Shpaner, M. , & Foxe, J. J. (2007). Object‐based attention is multisensory: Co‐activation of an object's representations in ignored sensory modalities. European Journal of Neuroscience, 26(2), 499–509. 10.1111/j.1460-9568.2007.05668.x [DOI] [PubMed] [Google Scholar]
- Näätänen, R. (1982). Processing negativity: An evoked‐potential reflection of selective attention. Psychological Bulletin, 92(3), 605–640. 10.1037/0033-2909.92.3.605 [DOI] [PubMed] [Google Scholar]
- Sàenz, M. , Buraĉas, G. T. , & Boynton, G. M. (2003). Global feature‐based attention for motion and color. Vision Research, 43(6), 629–637. 10.1016/s0042-6989(02)00595-3 [DOI] [PubMed] [Google Scholar]
- Serences, J. T. , & Boynton, G. M. (2007). Feature‐based attentional modulations in the absence of direct visual stimulation. Neuron, 55(2), 301–312. 10.1016/j.neuron.2007.06.015 [DOI] [PubMed] [Google Scholar]
- Shioiri, S. , Honjyo, H. , Kashiwase, Y. , Matsumiya, K. , & Kuriki, I. (2016). Visual attention spreads broadly but selects information locally. Scientific Reports, 6, 35513. 10.1038/srep35513 [DOI] [PMC free article] [PubMed] [Google Scholar]
- Singhal, A. , & Fowler, B. (2004). The differential effects of Sternberg short‐ and long‐term memory scanning on the late Nd and P300 in a dual‐task paradigm. Cognitive Brain Research, 21(1), 124–132. 10.1016/j.cogbrainres.2004.06.003 [DOI] [PubMed] [Google Scholar]
- Störmer, V. S. , McDonald, J. J. , & Hillyard, S. A. (2019). Involuntary orienting of attention to sight or sound relies on similar neural biasing mechanisms in early visual processing. Neuropsychologia, 132, 107122. 10.1016/j.neuropsychologia.2019.107122 [DOI] [PubMed] [Google Scholar]
- Talsma, D. (2015). Predictive coding and multisensory integration: An attentional account of the multisensory mind. Frontiers in Integrative Neuroscience, 9, 19. 10.3389/fnint.2015.00019 [DOI] [PMC free article] [PubMed] [Google Scholar]
- Talsma, D. , Doty, T. J. , & Woldorff, M. G. (2007). Selective attention and audiovisual integration: Is attending to both modalities a prerequisite for early integration? Cerebral Cortex, 17(3), 679–690. 10.1093/cercor/bhk016 [DOI] [PubMed] [Google Scholar]
- Talsma, D. , Senkowski, D. , Soto‐Faraco, S. , & Woldorff, M. G. (2010). The multifaceted interplay between attention and multisensory integration. Trends in Cognitive Sciences, 14(9), 400–410. 10.1016/j.tics.2010.06.008 [DOI] [PMC free article] [PubMed] [Google Scholar]
- Tang, X. , Wu, J. , & Shen, Y. (2016). The interactions of multisensory integration with endogenous and exogenous attention. Neuroscience & Biobehavioral Reviews, 61, 208–224. 10.1016/j.neubiorev.2015.11.002 [DOI] [PMC free article] [PubMed] [Google Scholar]
- Theeuwes, J. (1991). Exogenous and endogenous control of attention: The effect of visual onsets and offsets. Perception & Psychophysics, 49(1), 83–90. 10.3758/bf03211619 [DOI] [PubMed] [Google Scholar]
- Tompary, A. , Al‐Aidroos, N. , & Turk‐Browne, N. B. (2018). Attending to what and where: Background connectivity integrates categorical and spatial attention. Journal of Cognitive Neuroscience, 30(9), 1281–1297. 10.1162/jocn_a_01284 [DOI] [PMC free article] [PubMed] [Google Scholar]
- Treue, S. , & Martínez‐Trujillo, J. C. (1999). Feature‐based attention influences motion processing gain in macaque visual cortex. Nature, 399(6736), 575–579. 10.1038/21176 [DOI] [PubMed] [Google Scholar]
- Wagenmakers, E. J. , Marsman, M. , Jamil, T. , Ly, A. , Verhagen, J. , Love, J. , … Morey, R. D. (2018). Bayesian inference for psychology. Part I: Theoretical advantages and practical ramifications. Psychonomic Bulletin & Review, 25(1), 35–57. 10.3758/s13423-017-1343-3 [DOI] [PMC free article] [PubMed] [Google Scholar]
- White, A. L. , Rolfs, M. , & Carrasco, M. (2015). Stimulus competition mediates the joint effects of spatial and feature‐based attention. Journal of Vision, 15(14), 1–21. 10.1167/15.14.7 [DOI] [PMC free article] [PubMed] [Google Scholar]
- Yantis, S. , & Jonides, J. (1990). Abrupt visual onsets and selective attention: Voluntary versus automatic allocation. Journal of Experimental Psychology: Human Perception & Performance, 16(1), 121–134. 10.1037//0096-1523.16.1.121 [DOI] [PubMed] [Google Scholar]
- Zekveld, A. A. , Kramer, S. E. , Kessens, J. M. , Vlaming, M. S. , & Houtgast, T. (2008). The benefit obtained from visually displayed text from an automatic speech recognizer during listening to speech presented in noise. Ear & Hearing, 29(6), 838–852. 10.1097/AUD.0b013e31818005bd [DOI] [PubMed] [Google Scholar]
- Zekveld, A. A. , Rudner, M. , Johnsrude, I. S. , Festen, J. M. , van Beek, J. H. , & Rönnberg, J. (2011). The influence of semantically related and unrelated text cues on the intelligibility of sentences in noise. Ear & Hearing, 32(6), e16–e25. 10.1097/AUD.0b013e318228036a [DOI] [PubMed] [Google Scholar]
- Zhang, W. , & Luck, S. J. (2009). Feature‐based attention modulates feedforward visual processing. Nature Neuroscience, 12(1), 24–25. 10.1038/nn.2223 [DOI] [PubMed] [Google Scholar]
- Zhao, S. , Feng, C. , Liao, Y. , Huang, X. , & Feng, W. (2021). Attentional blink suppresses both stimulus‐driven and representation‐driven cross‐modal spread of attention. Psychophysiology, 58(4), e13761. 10.1111/psyp.13761 [DOI] [PubMed] [Google Scholar]
- Zimmer, U. , Itthipanyanan, S. , Grent‐'t‐Jong, T. , & Woldorff, M. G. (2010). The electrophysiological time course of the interaction of stimulus conflict and the multisensory spread of attention. European Journal of Neuroscience, 31(10), 1744–1754. 10.1111/j.1460-9568.2010.07229.x [DOI] [PMC free article] [PubMed] [Google Scholar]
- Zimmer, U. , Roberts, K. C. , Harshbarger, T. B. , & Woldorff, M. G. (2010). Multisensory conflict modulates the spread of visual attention across a multisensory object. NeuroImage, 52(2), 606–616. 10.1016/j.neuroimage.2010.04.245 [DOI] [PMC free article] [PubMed] [Google Scholar]
Associated Data
This section collects any data citations, data availability statements, or supplementary materials included in this article.
Supplementary Materials
Appendix S1. Supporting Information
Data Availability Statement
The data and code used in this study are available from the corresponding author upon reasonable request.