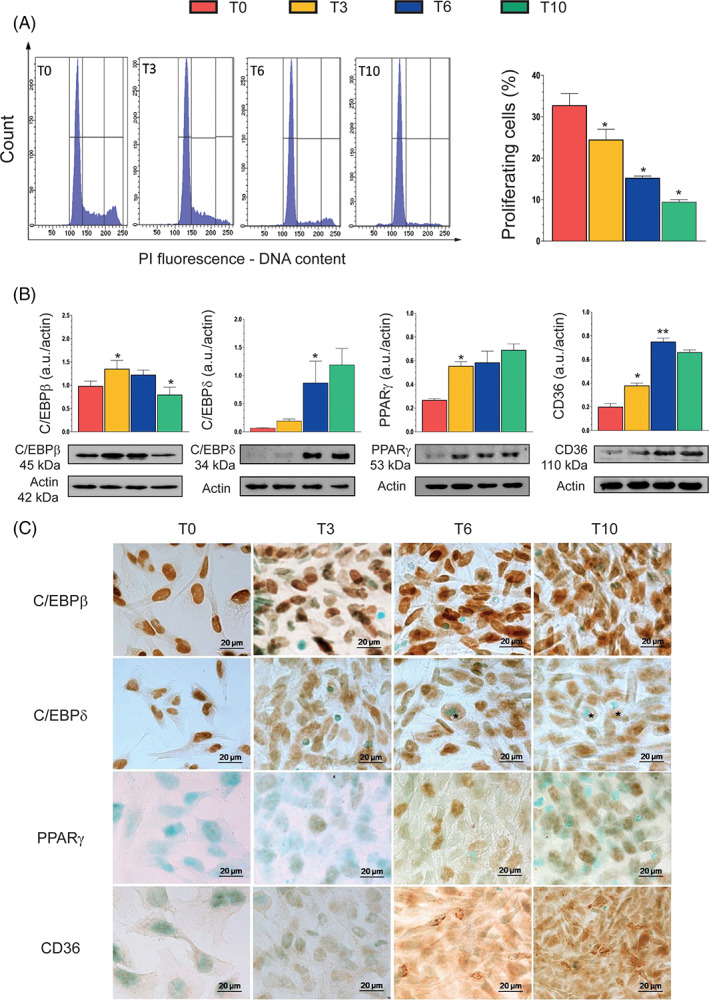
FIGURE 2.

Proliferation state and expression of adipogenic markers during differentiation. (A) DNA content of cells at different stages of differentiation was evaluated by flow cytometry. Histogram profiles highlight the progressive loss of proliferating cells during the process of differentiation. Markers are posed in sequence to delineate (and quantitate) G0/G1, S, and G2/M phases. Events from S+G2/M phases (proliferating cells) were calculated and plotted in the statistic histogram. (B) Western immunoblotting analysis of the key adipocyte differentiation markers CAAT/enhancer‐binding protein β (C/EBPβ), C/EBPδ, peroxisome proliferator‐activated receptor γ (PPARγ), and CD36, at the indicated differentiation times. Actin was used as a loading control. (C) Immunohistochemical analysis of C/EBPβ, C/EBPδ, PPARγ, and CD36 at the indicated differentiation times. Immunolocalization was visualized using diaminobenzidine (brown) and nuclei were counterstained with methyl green. * indicates adipocyte with evident lipid accumulation. Magnification 100×; bar: 20 μm. Results represent the means ± SD calculated from at least three independent determinations. *p < 0.05, **p < 0.01, as compared to the previous time point (one‐way analysis of variance followed by Dunnett's test)
