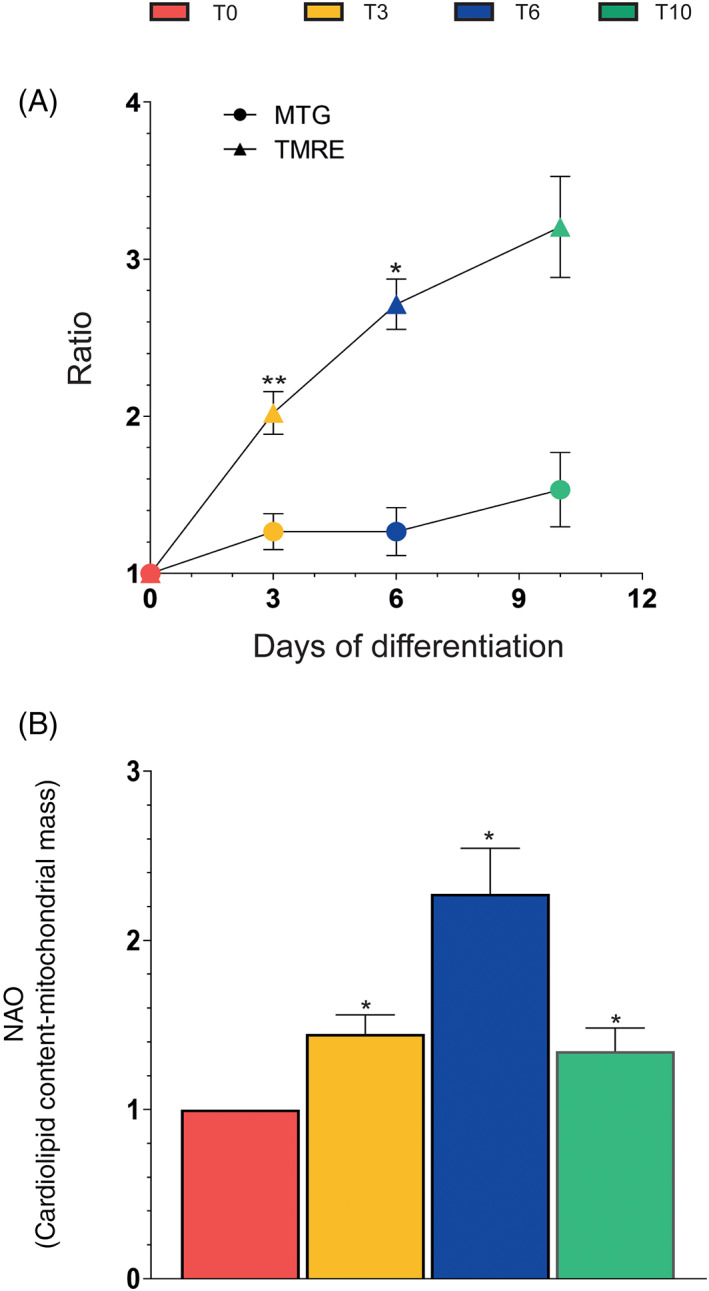
FIGURE 3.

Flow cytometric analyses of mitochondrial mass and membrane potential during differentiation. (A) MitoTracker Green (MTG)‐ and tetramethylrhodamine (TMRE)‐fluorescence intensity (FI) assays and (B) NAO‐FI analysis at the indicated differentiation times. Results are the ratio T3‐T10/T0 and represent the means ± SD calculated from at least three independent determinations. *p < 0.05, **p < 0.01, as compared to the previous time point (one‐way analysis of variance followed by Dunnett's test)
