

Abstract
Introduction
There is increasing interest in plasma amyloid beta (Aβ) as an endophenotype of Alzheimer's disease (AD). Identifying the genetic determinants of plasma Aβ levels may elucidate important biological processes that determine plasma Aβ measures.
Methods
We included 12,369 non‐demented participants from eight population‐based studies. Imputed genetic data and measured plasma Aβ1‐40, Aβ1‐42 levels and Aβ1‐42/Aβ1‐40 ratio were used to perform genome‐wide association studies, and gene‐based and pathway analyses. Significant variants and genes were followed up for their association with brain positron emission tomography Aβ deposition and AD risk.
Results
Single‐variant analysis identified associations with apolipoprotein E (APOE) for Aβ1‐42 and Aβ1‐42/Aβ1‐40 ratio, and BACE1 for Aβ1‐40. Gene‐based analysis of Aβ1‐40 additionally identified associations for APP, PSEN2, CCK, and ZNF397. There was suggestive evidence for interaction between a BACE1 variant and APOE ε4 on brain Aβ deposition.
Discussion
Identification of variants near/in known major Aβ‐processing genes strengthens the relevance of plasma‐Aβ levels as an endophenotype of AD.
Keywords: Alzheimer's disease, APOE, APP, BACE1, endophenotype, genetic epidemiology, genome‑wide association study, plasma amyloid beta levels, plasma biomarkers, preclinical biomarkers, PSEN2
1. INTRODUCTION
Amyloid beta (Aβ) deposition is one of the hallmarks of Alzheimer's disease (AD). Aβ peptides are the products of the catalytic processing of the Aβ precursor protein (APP) by the β‐secretase, BACE1, and the γ‐secretase complex. 1 Aβ peptides are able to self‐assemble in soluble Aβ oligomers but also in insoluble fibrils that can aggregate as plaques in the brain parenchyma or in the wall of blood vessels where they constitute defining hallmarks of AD 2 and cerebral amyloid angiopathy (CAA), which is seen in many patients. 3 Aβ peptides are mainly produced not only in the brain where APP and BACE1 are both highly expressed, 1 but also in circulating blood platelets, 4 in the pancreas, 5 and the kidneys. 6
There is strong evidence pointing toward a central role of Aβ peptides in the pathophysiology of AD. 7 In the past decades, studies have shown that a large variety of rare mutations in genes involved in Aβ production, including APP, PSEN1, and PSEN2, lead to autosomal dominant early‐onset forms of AD and to lobar hemorrhage from cerebral amyloid angiopathy. 8 Moreover, apolipoprotein E (APOE) ε4, the major genetic risk factor for AD in the general population, 9 has been implicated in Aβ aggregation, deposition, and clearance, both in the brain and in blood vessels. 7 , 10 Although for a long time the Aβ pathway did not emerge in our genome‐wide association studies (GWAS) of AD, 11 our most recent GWAS study highlighted the Aβ processing pathway and APP catabolic process pathway in late‐onset Alzheimer's disease (LOAD). 12 We and others have also explored the genetics of Aβ through GWAS on quantitative measures of Aβ peptides, in the cerebrospinal fluid (CSF) or brain, through Pittsburgh Compound B (PiB) positron emission tomography (PET) scan or autopsy. 13 , 14 , 15 , 16 , 17 Combining the effect of AD genetic loci in a genetic risk score shows that the combined AD genes are statistically significantly related to CSF Aβ42. 17
Although Aβ can be assessed in CSF and brain (PiB PET), these tests are of limited use for clinical and epidemiological studies in the population, either because of lower compliance (CSF) or higher costs (PiB PET). The recent success of blood‐based biomarkers (phosphorylated tau [p‐tau] and neurofilament light [NfL]) fueled our interest in Aβ metabolism in blood. Unlike p‐tau and NfL, Aβ peptides in the blood circulation are not brain specific. Aβ peptides produced in the brain can be degraded locally or transported into the CSF and the blood stream. 18 However, Aβ peptides in the circulation can also be derived from blood platelets, kidney, or pancreas. Although the brain‐derived Aβ peptides in the circulation cannot be distinguished from Aβ derived from blood platelets, the kidneys, or the pancreas, a recent study using immunoprecipitation coupled with mass spectrometry to measure plasma Aβ1‐40/Aβ1‐42 and APP/Aβ1‐42 ratios was able to accurately predict individual brain Aβ‐positive or ‐negative status. 19 Also, studies assessing Aβ1‐40 and Aβ1‐42 using immunoassays show that these can predict Aβ status in the brain as assessed by PiB PET 20 and that changes in the blood and plasma occur simultaneously. 21
Earlier, we have also shown that plasma Aβ concentrations are prospectively associated with the risk of developing AD in the future. 22 , 23 , 24 , 25 Despite the fact that we have used less sensitive techniques to measure plasma Aβ levels, we found modest but significant correlation with amyloid burden in the CSF and in the brain. 26 , 27 Whereas Aβ levels may or may not prove to be an effective blood biomarker panel for predicting AD risk in patients with cognitive impairments, the association with future AD suggests Aβ could be an endophenotype, that is, a quantitative biological trait that is an intermediate between one or more disease genes (e.g., APOE, APP, PSEN, or other AD genes) and the disease of interest, AD. Endophenotypes can be associated to different diseases, for example, the endophenotype blood pressure is associated to brain, heart, kidney, and dementia and is relevant for early prevention. For instance, endophenotypes played a key role in developing prevention for cardiovascular disease, targeting intermediate endophenotypes such as cholesterol, glucose, and blood pressure. Building upon our findings that plasma Aβ concentrations are associated with developing AD in the future, 22 , 23 , 24 , 25 a question that remains to be answered is whether plasma Aβ levels are driven by the genes implicated in AD.
To answer this question, we conducted a GWAS, hypothesizing that if we find that AD genes primarily determine plasma Aβ levels, it is likely that plasma Aβ is an endophenotype for AD. Alternatively, if we find that plasma Aβ is primarily associated to genes implicated in blood platelet function, or kidney or pancreas pathology, the findings argue against the hypothesis that Aβ in blood is an endophenotype for AD. We previously conducted a GWAS meta‐analysis of plasma Aβ levels in 3528 non‐demented participants, but failed to find genome‐wide significant associations, 28 indicating a lack of power related to the measurement or the sample size. At present, the more sensitive measures are not yet available in large samples with genome‐wide genetic data. We therefore aimed to increase the studied sample size of our previous work. The present study is a GWAS meta‐analysis of plasma Aβ levels in more than 12,000 individuals aiming to elucidate processes that determine plasma Aβ.
2. METHODS
2.1. Study populations
We included data from 12,369 European‐descent participants from eight studies, the Framingham Heart Study (FHS; n = 6735), the Rotterdam study (RS, n = 1958), the Three City Study (3C; n = 1954), the Atherosclerosis Risk in Communities Study (ARIC; n = 830), the Washington Heights‐Inwood Community Aging Project (WHICAP; n = 193), the Epidemiological Prevention Study of Zoetermeer (EPOZ; n = 397), the Alzheimer's Disease Neuroimaging Initiative (ADNI; n = 173), and the Erasmus Rucphen Family Study (ERF; n = 129). In each study, we excluded participants with prevalent dementia at the time of blood sampling used for plasma Aβ assessment (see Materials and Methods 1 in supporting information for a detailed description of each study).
2.2. Plasma Aβ assessment
Each study used different protocols for blood sampling, plasma extraction, and storage and plasma Aβ assessment that have been detailed in previous publications. 22 , 23 , 25 , 29 , 30 , 31 In the FHS, RS, and 3C studies, plasma Aβ levels were measured at different times because of cost considerations. Various assays were used to quantify plasma Aβ1‐40 and Aβ1‐42 levels (see Materials and Methods 2 in supporting information for a detailed description of the protocols used in each study and Table S1 in supporting information for baseline characteristics of the study populations).
2.3. Genotyping
Each study used different genotyping platforms as previously published. 11 After applying pre‐imputation variant and sample filters, genotypes were imputed using the 1000 Genomes phase 1 version 3 (all ethnicities) imputation panel and various imputation pipelines (see Methods 3 in supporting information). APOE genotyping was performed as part of protocols specific to each study (see Methods 4 in supporting information).
RESEARCH IN CONTEXT
Systematic review: The authors reviewed the literature using traditional (e.g., PubMed) sources and meeting abstracts and presentations. Genome‐wide association studies have not yet identified variants associated with plasma amyloid beta (Aβ)1‐40, Aβ1‐42 levels and Aβ1‐42/Aβ1‐40 ratio, probably due to limited sample sizes.
Interpretation: Our findings identified two genome‐wide significant loci in apolipoprotein E (APOE) and BACE1 regions associated with plasma Aβ levels in 12,369 non‑demented subjects. A gene‐based approach confirmed the association with APOE and BACE1 genes and identified additional signals in APP, PSEN2, CCK, and ZNF397 genes. We also showed a suggestive interaction between the most significant BACE1 variant and APOE ε4 with Aβ deposition in the brain using positron emission tomography imaging.
Future directions: We propose to further explore the biology underlying both circulating and brain amyloid levels using larger, multiomic samples, new plasma beta‐amyloid assays, and induced pluripotent stem cells–based methods.
2.4. Statistical analyses
2.4.1. Plasma Aβ levels
Plasma Aβ levels were expressed as pg mL‐1. In each study and for each Aβ dosage, we excluded values that were over or below four standard deviations around the mean. To study the variations of plasma Aβ levels in a consistent way across studies, we performed a ranked‐based inverse normal transformation of plasma Aβ levels in each study. If they were significantly associated with plasma Aβ levels, this transformation was performed after adjusting for batch effect and other technical artifacts.
2.4.2. Genome‑wide association studies
Each study performed GWAS of plasma Aβ1‐40 and Aβ1‐42 levels and Aβ1‐42/Aβ1‐40 ratio using 1000 Genomes imputed data. According to the imputation pipelines used, genetic information was available either as allele dosages or genotype probabilities. In each study, we excluded results from variants that had low imputation quality (r2 or info score < 0.3), variants with low frequency (minor allele frequency < 0.005 or minor allele count < 7), and variants that were available in a small number of participants (n < 30). Association of genetic variations with plasma Aβ levels were assessed in linear regression models adjusted for sex and age at blood collection. If significantly associated with plasma Aβ levels, principal components were added in the models to account for population structure.
2.4.3. Genome‑wide meta‐analysis
Before meta‐analysis, we applied a series of filters and quality check that were previously published (see Figures S1 and S2 in supporting information). 32 We performed an inverse variance weighted genome‑wide meta‐analysis, accounting for genomic inflation factors using the METAL software. 33 Finally, we retained variants that had been meta‐analyzed at least in the three largest available populations (FHS, RS, and 3C). Statistical significance was defined as a P‐value below 5×10⁻⁸. Signals with P‐values between 1×10⁻⁵ and 5×10⁻⁸ were considered suggestive. Additional graphs and analyses were done using R v3.6.1. To confirm the APOE signal we obtained in our genome‑wide meta‐analysis, we reran our analysis using genotyped APOE ε4 and APOE ε2 status, adjusting for age and sex.
2.4.4. Gene‐based and pathway analyses
We tested aggregated effects of single nucleotide polymorphisms (SNPs) located within genes using the multi‐marker analysis of genomic annotation (MAGMA) v1.07 tool. 34 For each dosage, a total of 18,089 genes were tested, resulting in a significance threshold of 2.76×10⁻⁶. Pathway analyses were also performed with MAGMA v1.07. 34 The following gene sets were used: GO (biological process, cellular component and molecular function, KEGG, Biocarta, and Reactome). Pathway P‐values were corrected for multiple testing using the false discovery rate (FDR) method.
2.4.5. Expression quantitative trait loci (eQTL) analysis
We looked at effect on gene expression of (1) genome‐wide significant variants and (2) variants with a P‐value below 10–5 and belonging to the same loci as the genome‐wide significant variants. We used the GTEx v8 dataset (https://gtexportal.org) and considered the following tissues: whole blood, kidney, pancreas, lymphoblastoid cell line, and brain (amygdala, anterior cingulate cortex, caudate basal ganglia, cerebellar hemisphere, cerebellum, cortex, frontal cortex, hippocampus, hypothalamus, nucleus accumbens [basal ganglia], putamen basal [basal ganglia], cervical spinal cord, substantia nigra).
2.4.6. Association analyses with Aβ brain deposition
We related allelic variation at the SNP of interest with a standard measure of amyloid burden in the brain on PET imaging 35 in 193 middle‐aged, dementia‐free FHS participants 36 (see Materials and Methods 5 in supporting information for a detailed description of the protocols used). As a pre‐specified hypothesis, we examined this association separately for persons with at least one APOE ε4 allele and those without. We report the odds ratio of having a positive amyloid scan associated with having a single copy of the allele of interest, using additive genetic models adjusted for age and sex.
2.4.7. Association with AD
For significant variants and genes, we checked for association with AD. Summary statistics from the most recent genetic meta‐analyses of AD were used. 12 , 37
3. RESULTS
3.1. Genome‐wide significant variants associated with plasma Aβ levels
After meta‐analysis, we identified 21 variants reaching genome‐wide significance across two loci (Figures S3 to S8 in supporting information).
The first locus was located on chromosome 19, in the APOE gene, with significant associations with plasma Aβ1‐42 levels and plasma Aβ1‐42/Aβ1‐40 ratio (Figures 1 and 2). For both associations, the most significant variant was rs429358 with P‐values of 9.01×10⁻¹³ and 6.46×10⁻²⁰ for Aβ1‐42 levels and Aβ1‐42/Aβ1‐40 ratio, respectively (Table 1). The minor allele of this variant, which denotes APOE ε4, was associated with lower plasma Aβ1‐42 levels (effect size = –0.167 standard deviations (SD); 95% confidence interval (CI) = [–0.212; –0.121]) and lower plasma Aβ1‐42/Aβ1‐40 ratio (effect size = –0.212 SD; 95% CI = [–0.257; –0.121]; Table 1 and Figure S9 in supporting information). We confirmed these associations using the directly genotyped APOE ε4 status (Figure S10 in supporting information).
FIGURE 1.
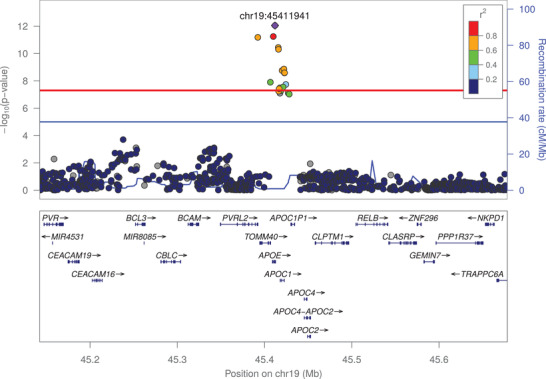
Association of frequent genetic variants with plasma amyloid beta (Aβ)1‐42 in the apolipoprotein E locus
FIGURE 2.
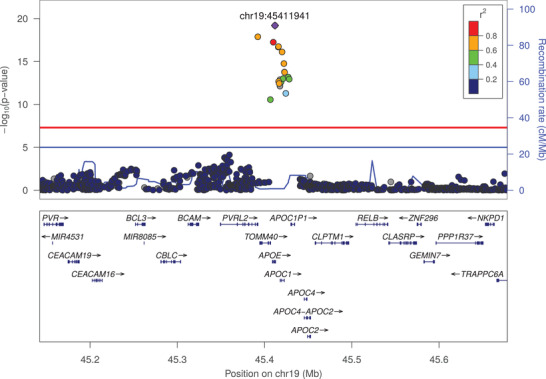
Association of frequent genetic variants with plasma amyloid beta (Aβ)1‐42/Aβ1‐40 ratio in the apolipoprotein E locus
TABLE 1.
Association of top variants from genome‐wide significant loci with plasma Aβ levels and amyloid‐related traits
| EAF | Effect | Standard Error | P‐value | I 2 | |
|---|---|---|---|---|---|
| rs650585 (chr11:117110740, T/C, intron; RNF214/BACE1) | |||||
| Plasma | |||||
| Aβ1‐40 | 41.3% | –0.073 | 0.013 | 2.56 × 10⁻⁸ | 3.1% |
| Aβ1‐42 | 41.3% | –0.035 | 0.013 | 9.57 × 10⁻³ | 27.8% |
| Aβ1‐42/Aβ1‐40 ratio | 41.4% | 0.033 | 0.013 | 1.39 × 10⁻² | 0.0% |
| AD riska | 40.8% | 0.033 | 0.015 | 2.30 × 10⁻² | 8.3% |
| rs429358 (chr19:45411941, C/T, missense; APOE) | |||||
| Plasma | |||||
| Aβ1‐40 | 13.4% | 0.023 | 0.023 | 3.11 × 10⁻¹ | 23.7% |
| Aβ1‐42 | 13.4% | –0.167 | 0.023 | 9.01 × 10⁻¹³ | 32.3% |
| Aβ1‐42/Aβ1‐40 ratio | 13.4% | –0.212 | 0.023 | 6.46 × 10⁻²⁰ | 52.6% |
| AD riska | 21.6% | 1.20 | 0.019 | .00 × 10+00 | 72.1% |
Abbreviations: Aβ, amyloid beta; AD: Alzheimer's disease; EAF: effect allele frequency; SNP, single nucleotide polymorphism.
Notes: For plasma measures, “Effect” represents the mean variation of the standardized variable (i.e., transformed so that mean = 0 and standard deviation = 1). In each block, the rsID of the top SNP is followed by its GRCh37 position, effect/non‐effect alleles, functional category and closest genes. aresults obtained from Kunkle et al. 12
The second genome‑wide significant locus was an intronic variant in the RNF214 gene. The function on RNF214 is largely unknown. The gene is located on chromosome 11, near the BACE1 gene. BACE1 encodes β‐secretase and is involved in the initial, Aβ‐producing step of APP processing (Figure 3). For the most significant variant, rs650585, the minor allele was associated with lower plasma Aβ1‐40 levels (effect size = –0.073 SD; 95% CI = [–0.099; –0.047]; P‐value = 2.56×10⁻⁸; Table 1 and Figure S9). This variant is in linkage disequilibrium (LD; R2 = 0.75, 1000 Genomes phase 3) with a BACE1 synonymous variant, rs638405, which was also associated with plasma Aβ1‐40 levels (effect size = –0.071 SD, P‑value = 1.21×10⁻⁷). For plasma Aβ1‐40 levels, eQTL analysis showed an effect of variants belonging to loci significantly associated with plasma Aβ levels mainly on the expression of CEP164 and BACE1 in blood, and on the expression of CEP164 in several brain regions (Table S2 in supporting information). No effect on RNF214 expression was found. For plasma Aβ1‐42 levels and Aβ1‐42/Aβ1‐40 ratio, we only observed an effect on the expression of NECTIN2.
FIGURE 3.
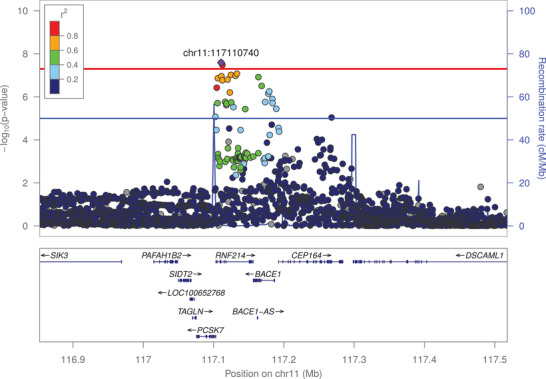
Association of frequent genetic variants with plasma amyloid beta (Aβ)1‐40 in the BACE1 locus
3.2. Gene and pathway‐based analyses of plasma Aβ levels
Next, we performed gene‐based tests (Table 2, Figures S6‐S8). We again observed the APOE, RNF214, and BACE1 genes (P = 3.87×10⁻¹³, P = 2.33×10⁻⁷, and P = 3.2×10⁻⁹, respectively), for which we had identified genome‐wide significant single variant associations. In addition to these genes, four genes showed gene‐wide significant signals (P < 2.76×10⁻⁶). We found that the APP and PSEN2 genes were associated with plasma Aβ1‐40 levels (P = 1.67×10⁻⁷ and P = 2.63×10⁻⁶, respectively). Interestingly, at the SNP level, there were two peaks reaching suggestive evidence for association with Aβ1‐40 levels in APP gene (Figure S11 in supporting information), probably explaining its strong association at the gene level. The two other genes were CCK, associated with plasma Aβ1‐40 levels (P = 2.63×10⁻⁶), and ZNF397, associated with plasma Aβ1‐42/1‐40 ratio (P = 2.27×10⁻⁶). The formal pathway analyses did not yield any significant results (Tables S3‐S5 in supporting information).
TABLE 2.
Associations of variants aggregated according to genes with plasma Aβ levels
| Gene symbol | Chromosome | Start position | Stop position | N. SNPs | P‐value |
|---|---|---|---|---|---|
| Plasma Aβ1‐40 | |||||
| PSEN2 | 1 | 227,057,885 | 227,083,806 | 84 | 2.63 × 10⁻⁶ |
| CCK | 3 | 42,299,317 | 42,307,699 | 20 | 2.63 × 10⁻⁶ |
| RNF214 | 11 | 117,103,341 | 117,157,161 | 143 | 2.33 × 10⁻⁷ |
| BACE1 | 11 | 117,156,402 | 117,186,975 | 70 | 3.20 × 10⁻⁹ |
| APP | 21 | 27,252,861 | 27,543,446 | 787 | 1.67 × 10⁻⁷ |
| Plasma Aβ1‐42 | |||||
| APOE | 19 | 45,409,011 | 45,412,650 | 2 | 3.14 × 10⁻¹⁰ |
| APOC1 | 19 | 45,417,504 | 45,422,606 | 3 | 2.52 × 10⁻⁹ |
| Plasma Aβ1‐42/Aβ1‐40 ratio | |||||
| ZNF397 | 18 | 32,820,994 | 32,847,097 | 48 | 2.27 × 10⁻⁶ |
| APOE | 19 | 45,409,011 | 45,412,650 | 2 | 3.87 × 10⁻¹³ |
| APOC1 | 19 | 45,417,504 | 45,422,606 | 3 | 6.79 × 10⁻¹³ |
Start and stop positions are given according to GRCh37. Gene‐wide significance level is computed for 18,089 genes, i.e., 2.76 × 10⁻⁶.
Abbreviations: Aβ, amyloid beta; SNP, single nucleotide polymorphism.
3.3. Association of the BACE1 locus with PET Aβ deposition
We tested the association of the top hit rs650585 from the BACE1 locus (see above) with Aβ deposition in the brain from subsets of the FHS population. We found an association of rs650585 with an increase of deposition of Aβ in FHS‐Gen3 only among APOE ε4–positive individuals (P = 0.02; Table S6 in supporting information).
3.4. Variants associated with plasma amyloid associate with the risk of AD
The APOE ɛ4 allele is known to be associated with a higher risk of AD. 38 We did not find significant evidence for association between the protect variant for AD, APOE ε2, and circulating Aβ peptides levels (Figure S10). A significant association of APP gene with AD (P= 8.42 × 10⁻⁷) was reported. 37 Interestingly, one of the two peaks in APP suggestively associated with Aβ1‐40 levels (Figure S11) was also associated with AD, whereas the second peak was not (Figure S12 in supporting information). 37 Nominal significant associations of RNF214 (P = 4.8 × 10⁻⁵) and BACE1 (P= 1.1 × 10⁻³) with AD were reported while PSEN2 was close to nominal association (P = 5.1 × 10⁻²). 37
4. DISCUSSION
To uncover the genes that determine plasma Aβ levels, we performed a GWAS of plasma Aβ in 12,369 non‑demented subjects. Although we did not use recently developed high sensitivity assays, we found that plasma Aβ levels are determined by variants in and near the major AD genes: APOE, BACE1, PSEN2, and APP. The proteins these genes encode for are known to be involved in Aβ processing. A novel finding is that the variants near the BACE1 gene were found to be associated with Aβ in the brain as measured by PET imaging and these variants were also found to be associated with the risk of AD. We also identified additional signals for new genes implicated in Aβ levels in blood, CCK and ZNF397.
The BACE1 region encompasses several genes (PCSK7, RNF214, BACE1, CEP164) and a BACE1 anti‐sense long non‐coding RNA (BACE1‐AS). Although the top variant in the GWAS is located in an intron of RNF214, the gene‐based and eQTL analyses suggest BACE1 is likely the causal gene in the region. The fact that β‐secretase activity of BACE1 is necessary for Aβ peptide production makes it highly likely that BACE1 or a local regulation of BACE1 explains most likely the association of the region to plasma Aβ levels. We also found gene‐wide significant associations with plasma Aβ1‐40 levels in APP and PSEN2, two major actors of Aβ metabolism. The APP gene is a key driver of its own metabolism in blood and PSEN2 is a key player of the γ‐secretases, which process the APP C99 fragment into Aβ peptides. 1 The top variants at the PSEN2 and BACE1 loci were also nominally significantly associated with Aβ1‐42 levels in the same direction as Aβ1‐40 levels, which is in agreement with the finding that PSEN2 and BACE1 activities indifferently produce Aβ40 and Aβ42 peptides. Conversely, the APOE ε4 allele had the strongest association with Aβ1‐42 levels but was not even nominally associated with Aβ1‐40. This suggests that the APOE ɛ4 isoform is not involved early in the process of Aβ peptide production but rather in more downstream events, such as Aβ aggregation or clearance. These results might also illustrate the greater propensity of Aβ1‐42 peptides to aggregate compared to Aβ1‐40, and the influence of APOE isoforms in the regulation of this aggregation process. 10 Interestingly, associations of APOE ε2 with plasma Aβ levels were not significant and effect sizes were very small. Contrary to APOE ε4, the effect of APOE ε2 on amyloid markers has been much less well studied and research has been focused on specific brain regions. 39 Alternatively, other, Aβ‑independent, mechanisms such as vascular pathology may explain the lower risk of AD observed in APOE ε2 carriers. 40
As to the novel genes identified, CCK and ZNF397, to date these have not been associated with Aβ peptides in the circulation such as blood platelets, kidney, or pancreas pathology. The CCK gene is located in a region that was reported in a GWAS of neurofibrillary tangles but not Aβ. 16 CCK or cholecystokinin is a neuropeptide that is widely distributed in the brain and highly expressed in brain regions like the hippocampus. Sulfated cholecystokinin‐8 may modulate neuronal activity in the brain 41 but its function in the brain is far from clear. The protein is located in axons, dendrites, and the neuronal cell body and is involved in gastrin signaling and insulin secretion but also in neuron migration. CCK regulates pancreatic enzyme secretion and gastrointestinal motility, and acts as a satiety signal. CCK is released simultaneously from intestinal cells and neurons in response to a meal and thus may be implicated in the metabolic effects seen in and outside the brain including weight loss. The diseases associated with CCK include cholecystitis and biliary dyskinesia, the latter being of interest in light of the finding that bile acids have been found to be associated to the risk of AD and brain pathology. 42 The other novel locus, the ZNF397 gene, encodes a protein with a N‐terminal SCAN domain, and the longer isoform contains nine C2H2‐type zinc finger repeats in the C‐terminal domain. The protein localizes to centromeres during interphase and early prophase, and different isoforms can repress or activate transcription in transfection studies. Interestingly, the SNP rs509477, suggestively associated with CSF Aβ1‐42 in a small association study, 43 is located in an enhancer of ZNF397 (Genecards: GH18J034976), acting in the hippocampus middle, anterior caudate, and cingulate gyrus brain regions. 44 Although this SNP was not associated with any Aβ levels or ratio in our study, our findings do support the hypothesis that ZNF397 plays a role in Aβ metabolism.
Our analysis shows associations of plasma Aβ levels mainly with genes that have been previously identified as involved in AD (APOE, APP, PSEN2), and other genes that are nominally associated to AD and are expressed in the brain. According to the hypothesis outlined in the introduction, it is likely that plasma Aβ is an endophenotype for AD. Although we cannot prove the origin, our findings suggest also that Aβ peptides measured in the blood circulation for a large part originate from the brain rather than from the pancreas or the kidney. This hypothesis is in line with recent observations showing correlation of Aβ levels in blood with its levels in CSF as well as with its deposition in brain as assessed by PET imaging. 19 , 45
Plasma Aβ has been long considered a poor predictive biomarker of AD risk, partially due to lack of precision and reproducibility in the assays that were available. A previous meta‐analysis reported that plasma Aβ levels were not useful to make a clinical diagnosis of AD. 46 However, as assays improved, several of the large cohorts participating in the present study have reported that low plasma Aβ42 and Aβ42/40 ratio levels were modestly associated with risk of development of AD after several years of follow‐up, 22 , 23 , 24 , 25 suggesting that they are valid endophenotypes of at least one biological process underlying AD risk. The results of the present study are consistent with the hypothesis that Aβ in blood reflects some aspects of brain AD pathophysiology and this view is strengthened by our present observation that APOE ε4 is both associated with low plasma Aβ42 and Aβ42/40 ratio and high AD risk. Some of studies have also reported that this association remained significant after adjusting for APOE ε4. 25 Hence, plasma Aβ levels could prove useful as a biomarker of amyloid metabolism pathways in the brain and could be an accessible marker of target engagement for preventive interventions focused on this pathway. In this light there are intriguing reports that hemodialysis or peritoneal dialysis are able to lower Aβ not only in the blood, but also in the brain. 47 , 48 Further, the association we observed between variants near BACE1 and plasma Aβ40 is also of interest in the light of the recent (disappointing) trials testing BACE inhibitors. Measuring Aβ40 in blood might help us understand the overall failure of these trials or identify responsive subgroups if we examined genetic variation among trial participants and the lack of association of these variants with AD risk could be further investigated. 49
Our study has several strengths. First, it is, to date, the largest study of circulating amyloid peptides. This enabled us to identify biological factors underlying peripheral Aβ metabolism and the overlap of the genetic signals with those underlying brain pathology and AD risk, suggesting blood levels of Aβ may have clinical utility. Second, this study was conducted in non‐demented participants and therefore is relevant for the study of early amyloid pathophysiological processes. Third, we carefully normalized the plasma Aβ data before running GWAS, thus taking into account some of the heterogeneity that has been described when using plasma Aβ levels.
Our study also has limitations. The state of current knowledge makes it difficult to ascertain if there is a causal role of plasma Aβ on the brain's accrual of amyloid and further experimental research in this area is needed. Second, the assays used in this study non‐selectively measured Aβ concentrations and could not distinguish monomers from oligomers of Aβ, whether free or protein‐bound. Therefore, our interpretation of the present results might differ from other studies in which assays selectively measured monomers or oligomers of Aβ. 50 Future studies with the novel assays that allow measurements of each form of Aβ will facilitate interpretation with regard to the balance between Aβ production, aggregation, and clearance. Thus, although our approach explores brain neurobiology through the study of plasma levels, the imperfect instrument used to determine this plasma endophenotype and the higher inter‐assay variability requires further research of Aβ biomarkers in blood using state‐of‐the‐art technology.
In summary, our results indicate that genetic determinants of plasma Aβ40 and Aβ42 levels are close to genes known to be central actors in APP metabolism in AD. Increasing the statistical power of plasma Aβ analyses may potentially lead to the identification of currently unknown players in Aβ metabolism; novel hypotheses; and, hopefully, new preventive or therapeutic targets against AD. In the future, the role of these genetic variants also needs to be explored further in AD animal models.
CONFLICTS OF INTEREST
The authors have no conflicts of interest to disclose.
Supporting information
Supporting Information
Supporting Information
Supporting Information
Supporting Information
ACKNOWLEDGMENTS
Framingham Heart Study: This work was supported by the National Heart, Lung and Blood Institute's Framingham Heart Study (contracts N01‐HC‐25195 and HHSN268201500001I). This study was also supported by grants from the National Institute on Aging: AG054076, U01‐AG049505, and AG008122 (S. Seshadri). S. Seshadri, A. Beiser, and Q. Yang were also supported by additional grants from the National Institute on Aging (R01AG049607, AG033193, AG033040) and the National Institute of Neurological Disorders and Stroke (R01‐NS017950, R01‐NS087541). The SHARe (SNP Health Association Resource) project was funded by the National Heart, Lung, and Blood Institute. The Linux Cluster for Genetic Analysis (LinGA‐II) on which part of the FHS computations were performed, was funded by the Robert Dawson Evans Endowment of the Department of Medicine at Boston University School of Medicine and Boston Medical Center.
Rotterdam Study: The Rotterdam Study is funded by Erasmus Medical Center and Erasmus University, Rotterdam; Netherlands Organization for the Health Research and Development (ZonMw); the Research Institute for Diseases in the Elderly (RIDE); the Ministry of Education, Culture and Science; the Ministry for Health, Welfare and Sports; the European Commission (DG XII); and the Municipality of Rotterdam. The authors are grateful to the study participants, the staff from the Rotterdam Study, and the participating general practitioners and pharmacists. The generation and management of the Illumina exome chip v1.0 array data for the Rotterdam Study (RS‐I) was executed by the Human Genotyping Facility of the Genetic Laboratory of the Department of Internal Medicine (www.glimdna.org), Erasmus MC, Rotterdam, The Netherlands. The generation and management of GWAS genotype data for the Rotterdam Study (RS‐I, RS‐II, RS‐III) was executed by the Human Genotyping Facility of the Genetic Laboratory of the Department of Internal Medicine, Erasmus MC, Rotterdam, The Netherlands. The GWAS datasets are supported by the Netherlands Organization of Scientific Research NWO Investments (nr. 175.010.2005.011, 911‐03‐012); the Genetic Laboratory of the Department of Internal Medicine, Erasmus MC; the Research Institute for Diseases in the Elderly (014‐93‐015; RIDE2); the Netherlands Genomics Initiative (NGI)/Netherlands Organization for Scientific Research (NWO) Netherlands Consortium for Healthy Aging (NCHA), project nr. 050‐060‐810. Carolina Medina‐Gomez, Lennard Karsten, and Linda Broer, for QC and variant calling; Arp, Mila Jhamai, Marijn Verkerk, Lizbeth Herrera, and Marjolein Peters, and Carolina Medina‐Gomez, for their help in creating the GWAS database. The work for this manuscript was further supported by ADAPTED: Alzheimer's Disease Apolipoprotein Pathology for Treatment Elucidation and Development (number 115975); the CoSTREAM project (www.costream.eu) and funding from the European Union's Horizon 2020 research and innovation programme under grant agreement No 667375.
Three City Study: This work was supported by INSERM, the National Foundation for Alzheimer's Disease and Related Disorders, the Institut Pasteur de Lille and the Centre National de Génotypage. This work has been developed and supported by the LABEX (laboratory of excellence program investment for the future) DISTALZ grant (Development of Innovative Strategies for a Transdisciplinary approach to Alzheimer's disease) including funding from MEL (Metropoleeuropéenne de Lille), ERDF (European Regional Development Fund), Conseil Régional Nord Pas de Calais, and the JPND‐funded PERADES project. The Three City Study was performed as part of collaboration between the Institut National de la Santé et de la Recherche Médicale (Inserm), the Victor Segalen Bordeaux II University and Sanofi‐Synthélabo. The Fondation pour la Recherche Médicale funded the preparation and initiation of the study. The 3C Study was also funded by the Caisse Nationale Maladie des Travailleurs Salariés, Direction Générale de la Santé, MGEN, Institut de la Longévité, Agence Française de Sécurité Sanitaire des Produits de Santé, the Aquitaine and Bourgogne Regional Councils, Agence Nationale de la Recherche, ANR supported the COGINUT and COVADIS projects. Fondation de France and the joint French Ministry of Research/INSERM “Cohortes et collections de données biologiques” programme. Lille Génopôle received an unconditional grant from Eisai. The Three City biological bank was developed and maintained by the laboratory for genomic analysis LAG‐BRC ‐ Institut Pasteur de Lille. The work for this manuscript was further supported by the CoSTREAM project (www.costream.eu) and funding from the European Union's Horizon 2020 research and innovation programme under grant agreement No 667375.
Atherosclerosis Risk in Communities Study: The Atherosclerosis Risk in Communities Study is carried out as a collaborative study supported by National Heart, Lung, and Blood Institute contracts (HHSN268201100005C, HHSN268201100006C, HHSN268201100007C, HHSN268201100008C, HHSN268201100009C, HHSN268201100010C, HHSN268201100011C, and HHSN268201100012C), R01HL087641, R01HL59367, and R01HL086694; National Human Genome Research Institute contract U01HG004402; and National Institutes of Health contract HHSN268200625226C. Neurocognitive data was collected by U01 HL096812, HL096814, HL096899, HL096902, and HL096917 from the NIH (NHLBI, NINDS, NIA and NIDCD), with previous brain MRI examinations funded by R01HL70825 from the NHLBI. Infrastructure was partially supported by Grant Number UL1RR025005, a component of the National Institutes of Health and NIH Roadmap for Medical Research. The authors thank the staff and participants of the ARIC study for their important contributions.
Epidemiological Prevention Study of Zoetermeer: This research was made possible by financial support from the Netherlands Organization for Scientific Research and the Health Research Development Council.
Washington Heights‐Inwood Community Aging Project: Data collection and sharing for this project was supported by the Washington Heights‐Inwood Columbia Aging Project (WHICAP, PO1AG007232, R01AG037212, RF1AG054023) funded by the National Institute on Aging (NIA) and by the National Center for Advancing Translational Sciences, National Institutes of Health, through Grant Number UL1TR001873. This work was also supported by National Institutes of Health grants AG042483, AG034189, and AG045334. This manuscript has been reviewed by WHICAP investigators for scientific content and consistency of data interpretation with previous WHICAP Study publications. We acknowledge the WHICAP study participants and the WHICAP research and support staff for their contributions to this study. The Columbia University Institutional Review Board reviewed and approved this project. All individuals provided written informed consent.
Alzheimer's Disease Neuroimaging Initiative: Data collection and sharing for this project was funded by the Alzheimer's Disease Neuroimaging Initiative (ADNI; National Institutes of Health Grant U01 AG024904) and DOD ADNI (Department of Defense award number W81XWH‐12‐2‐0012). ADNI is funded by the National Institute on Aging, the National Institute of Biomedical Imaging and Bioengineering, and through generous contributions from the following: AbbVie; Alzheimer's Association; Alzheimer's Drug Discovery Foundation; Araclon Biotech; BioClinica, Inc.; Biogen; Bristol‐Myers Squibb Company; CereSpir, Inc.; Cogstate; Eisai Inc.; Elan Pharmaceuticals, Inc.; Eli Lilly and Company; EuroImmun; F. Hoffmann‐La Roche Ltd and its affiliated company Genentech, Inc.; Fujirebio; GE Healthcare; IXICO Ltd.; Janssen Alzheimer Immunotherapy Research & Development, LLC; Johnson & Johnson Pharmaceutical Research & Development LLC; Lumosity; Lundbeck; Merck & Co., Inc.; Meso Scale Diagnostics, LLC; NeuroRx Research; Neurotrack Technologies; Novartis Pharmaceuticals Corporation; Pfizer Inc.; Piramal Imaging; Servier; Takeda Pharmaceutical Company; and Transition Therapeutics. The Canadian Institutes of Health Research is providing funds to support ADNI clinical sites in Canada. Private sector contributions are facilitated by the Foundation for the National Institutes of Health (www.fnih.org). The grantee organization is the Northern California Institute for Research and Education, and the study is coordinated by the Alzheimer's Therapeutic Research Institute at the University of Southern California. ADNI data are disseminated by the Laboratory for Neuro Imaging at the University of Southern California.
Eramus Rucphen Family Study: The Erasmus Rucphen Family (ERF) has received funding from the Centre for Medical Systems Biology (CMSB) and Netherlands Consortium for Systems Biology (NCSB), both within the framework of the Netherlands Genomics Initiative (NGI)/Netherlands Organization for Scientific Research (NWO). ERF study is also a part of EUROSPAN (European Special Populations Research Network; FP6 STRP grant number 018947 [LSHG‐CT‐2006‐01947]); European Network of Genomic and Genetic Epidemiology (ENGAGE) from the European Community's Seventh Framework Programme (FP7/2007‐2013)/grant agreement HEALTH‐F4‐2007‐201413; “Quality of Life and Management of the Living Resources” of 5th Framework Programme (no. QLG2‐CT‐2002‐01254); FP7 project EUROHEADPAIN (nr 602633), the Internationale Stichting Alzheimer Onderzoek (ISAO); the Hersenstichting Nederland (HSN); and the JNPD under the project PERADES (grant number 733051021, Defining Genetic, Polygenic and Environmental Risk for Alzheimer's Disease using multiple powerful cohorts, focused Epigenetics and Stem cell metabolomics). This work in the ERF study was conducted under the grants: ADAPTED: Alzheimer's Disease Apolipoprotein Pathology for Treatment Elucidation and Development (number 115975); the CoSTREAM project (www.costream.eu); and has received funding from the European Union's Horizon 2020 research and innovation programme under grant agreement No 667375. We are grateful to all study participants and their relatives, general practitioners and neurologists for their contributions and to P. Veraart for her help in genealogy, J. Vergeer for the supervision of the laboratory work, and P. Snijders for his help in data collection.
The Genotype‐Tissue Expression (GTEx) Project was supported by the Common Fund of the Office of the Director of the National Institute of Health, and by NCI, NHGRI, NHLBI, NIDA, NIMH, and NINDS. The data used for the analyses described in this manuscript were obtained from the GTEx Portal on 10/08/20.
Damotte V, van der Lee SJ Chouraki V, et al. Plasma amyloid β levels are driven by genetic variants near APOE, BACE1, APP, PSEN2: A genome‐wide association study in over 12,000 non‐demented participants. Alzheimer's Dement. 2021;17:1663–1674. 10.1002/alz.12333
Vincent Damotte, Sven J. van der Lee, Jean‐Charles Lambert, Sudha Seshadri, Cornelia M. van Duijn, and Vincent Chouraki contributed equally to this work.
References
- 1. Haass C, Kaether C, Thinakaran G, Sisodia S. Trafficking and proteolytic processing of APP. Cold Spring Harb Perspect Med. 2012;2:a006270. [DOI] [PMC free article] [PubMed] [Google Scholar]
- 2. Hyman BT, Phelps CH, Beach TG, et al. National Institute on Aging‐Alzheimer's Association guidelines for the neuropathologic assessment of Alzheimer's disease. Alzheimer's & dementia : the journal of the Alzheimer's Association. 2012;8:1‐13. [DOI] [PMC free article] [PubMed] [Google Scholar]
- 3. Viswanathan A, Greenberg SM. Cerebral amyloid angiopathy in the elderly. Ann Neurol. 2011;70:871‐880. [DOI] [PMC free article] [PubMed] [Google Scholar]
- 4. Chen M, Inestrosa NC, Ross GS, Fernandez HL. Platelets are the primary source of amyloid beta‐peptide in human blood. Biochem Biophys Res Commun. 1995;213:96‐103. [DOI] [PubMed] [Google Scholar]
- 5. Kulas JA, Puig KL, Combs CK. Amyloid precursor protein in pancreatic islets. J Endocrinol. 2017;235:49‐67. [DOI] [PMC free article] [PubMed] [Google Scholar]
- 6. Selkoe DJ, Podlisny MB, Joachim CL, et al. Beta‐amyloid precursor protein of Alzheimer disease occurs as 110‐ to 135‐kilodalton membrane‐associated proteins in neural and nonneural tissues. PNAS. 1988;85:7341‐7345. [DOI] [PMC free article] [PubMed] [Google Scholar]
- 7. Long JM, Holtzman DM. Alzheimer Disease: an Update on Pathobiology and Treatment Strategies. Cell. 2019;179:312‐339. [DOI] [PMC free article] [PubMed] [Google Scholar]
- 8. Cacace R, Sleegers K, Van Broeckhoven C. Molecular genetics of early‐onset Alzheimer's disease revisited. Alzheimer's & dementia : the journal of the Alzheimer's Association. 2016;12:733‐748. [DOI] [PubMed] [Google Scholar]
- 9. Genin E, Hannequin D, Wallon D, et al. APOE and Alzheimer disease: a major gene with semi‐dominant inheritance. Mol Psychiatry. 2011;16:903‐907. [DOI] [PMC free article] [PubMed] [Google Scholar]
- 10. Kanekiyo T, Xu H, Bu G. ApoE and Abeta in Alzheimer's disease: accidental encounters or partners?. Neuron. 2014;81:740‐754. [DOI] [PMC free article] [PubMed] [Google Scholar]
- 11. Lambert JC, Ibrahim‐Verbaas CA, Harold D, et al. Meta‐analysis of 74,046 individuals identifies 11 new susceptibility loci for Alzheimer's disease. Nat Genet. 2013;45:1452‐1458. [DOI] [PMC free article] [PubMed] [Google Scholar]
- 12. Kunkle BW, Grenier‐Boley B, Sims R, et al. Genetic meta‐analysis of diagnosed Alzheimer's disease identifies new risk loci and implicates Abeta, tau, immunity and lipid processing. Nat Genet. 2019;51:414‐430. [DOI] [PMC free article] [PubMed] [Google Scholar]
- 13. Cruchaga C, Kauwe JS, Harari O, et al. GWAS of cerebrospinal fluid tau levels identifies risk variants for Alzheimer's disease. Neuron. 2013;78:256‐268. [DOI] [PMC free article] [PubMed] [Google Scholar]
- 14. Ramanan VK, Risacher SL, Nho K, et al. APOE and BCHE as modulators of cerebral amyloid deposition: a florbetapir PET genome‐wide association study. Mol Psychiatry. 2014;19:351‐357. [DOI] [PMC free article] [PubMed] [Google Scholar]
- 15. Shulman JM, Chen K, Keenan BT, et al. Genetic susceptibility for Alzheimer disease neuritic plaque pathology. JAMA Neurol. 2013;70:1150‐1157. [DOI] [PMC free article] [PubMed] [Google Scholar]
- 16. Beecham GW, Hamilton K, Naj AC, et al. Genome‐wide association meta‐analysis of neuropathologic features of Alzheimer's disease and related dementias. PLos Genet. 2014;10:e1004606. [DOI] [PMC free article] [PubMed] [Google Scholar]
- 17. Deming Y, Li Z, Kapoor M, et al. Genome‐wide association study identifies four novel loci associated with Alzheimer's endophenotypes and disease modifiers. Acta Neuropathol (Berl). 2017;133:839‐856. [DOI] [PMC free article] [PubMed] [Google Scholar]
- 18. Sagare AP, Bell RD, Zlokovic BV. Neurovascular defects and faulty amyloid‐beta vascular clearance in Alzheimer's disease. Journal of Alzheimer's disease : JAD. 2013;33(Suppl 1):S87‐100. [DOI] [PMC free article] [PubMed] [Google Scholar]
- 19. Nakamura A, Kaneko N, Villemagne VL, et al. High performance plasma amyloid‐beta biomarkers for Alzheimer's disease. Nature. 2018;554:249‐254. [DOI] [PubMed] [Google Scholar]
- 20. Palmqvist S, Janelidze S, Stomrud E, et al. Performance of Fully Automated Plasma Assays as Screening Tests for Alzheimer Disease‐Related beta‐Amyloid Status. JAMA Neurol. 2019. [DOI] [PMC free article] [PubMed] [Google Scholar]
- 21. Palmqvist S, Insel PS, Stomrud E, et al. Cerebrospinal fluid and plasma biomarker trajectories with increasing amyloid deposition in Alzheimer's disease. EMBO Mol Med. 2019:e11170. [DOI] [PMC free article] [PubMed] [Google Scholar]
- 22. van Oijen M, Hofman A, Soares HD, Koudstaal PJ, Breteler MM. Plasma Abeta(1‐40) and Abeta(1‐42) and the risk of dementia: a prospective case‐cohort study. Lancet Neurol. 2006;5:655‐660. [DOI] [PubMed] [Google Scholar]
- 23. Lambert JC, Schraen‐Maschke S, Richard F, et al. Association of plasma amyloid beta with risk of dementia: the prospective Three‐City Study. Neurology. 2009;73:847‐853. [DOI] [PubMed] [Google Scholar]
- 24. Shah NS, Vidal JS, Masaki K, et al. Midlife blood pressure, plasma beta‐amyloid, and the risk for Alzheimer disease: the Honolulu Asia Aging Study. Hypertension. 2012;59:780‐786. [DOI] [PMC free article] [PubMed] [Google Scholar]
- 25. Chouraki V, Beiser A, Younkin L, et al. Plasma amyloid‐beta and risk of Alzheimer's disease in the Framingham Heart Study. Alzheimer's & dementia : the journal of the Alzheimer's Association. 2015;11:249‐257 e1. [DOI] [PMC free article] [PubMed] [Google Scholar]
- 26. Toledo JB, Vanderstichele H, Figurski M, et al. Factors affecting Abeta plasma levels and their utility as biomarkers in ADNI. Acta Neuropathol (Berl). 2011;122:401‐413. [DOI] [PMC free article] [PubMed] [Google Scholar]
- 27. Roberts KF, Elbert DL, Kasten TP, et al. Amyloid‐beta efflux from the central nervous system into the plasma. Ann Neurol. 2014;76:837‐844. [DOI] [PMC free article] [PubMed] [Google Scholar]
- 28. Chouraki V, De Bruijn RF, Chapuis J, et al. A genome‐wide association meta‐analysis of plasma Abeta peptides concentrations in the elderly. Mol Psychiatry. 2014;19:1326‐1335. [DOI] [PMC free article] [PubMed] [Google Scholar]
- 29. Figurski MJ, Waligorska T, Toledo J, et al. Improved protocol for measurement of plasma beta‐amyloid in longitudinal evaluation of Alzheimer's Disease Neuroimaging Initiative study patients. Alzheimer's & dementia : the journal of the Alzheimer's Association. 2012;8:250‐260. [DOI] [PMC free article] [PubMed] [Google Scholar]
- 30. Ibrahim‐Verbaas CA, Zorkoltseva IV, et al. Linkage analysis for plasma amyloid beta levels in persons with hypertension implicates Abeta‐40 levels to presenilin 2. Hum Genet. 2012;131:1869‐1876. [DOI] [PubMed] [Google Scholar]
- 31. Reitz C, Cheng R, Schupf N, et al. Association between variants in IDE‐KIF11‐HHEX and plasma amyloid beta levels. Neurobiol Aging. 2012;33:199 e13‐7. [DOI] [PMC free article] [PubMed] [Google Scholar]
- 32. Winkler TW, Day FR, Croteau‐Chonka DC, et al. Quality control and conduct of genome‐wide association meta‐analyses. Nat Protoc. 2014;9:1192‐1212. [DOI] [PMC free article] [PubMed] [Google Scholar]
- 33. Willer CJ, Li Y, Abecasis GR. METAL: fast and efficient meta‐analysis of genomewide association scans. Bioinformatics. 2010;26:2190‐2191. [DOI] [PMC free article] [PubMed] [Google Scholar]
- 34. de Leeuw CA, Mooij JM, Heskes T, Posthuma D. MAGMA: generalized gene‐set analysis of GWAS data. PLoS Comput Biol. 2015;11:e1004219. [DOI] [PMC free article] [PubMed] [Google Scholar]
- 35. Becker JA, Hedden T, Carmasin J, et al. Amyloid‐beta associated cortical thinning in clinically normal elderly. Ann Neurol. 2011;69:1032‐1042. [DOI] [PMC free article] [PubMed] [Google Scholar]
- 36. Splansky GL, Corey D, Yang Q, et al. The third generation cohort of the National Heart, Lung, and Blood Institute's Framingham Heart Study: design, recruitment, and initial examination. Am J Epidemiol. 2007;165:1328‐1335. [DOI] [PubMed] [Google Scholar]
- 37. de Rojas I, Moreno‐Grau S, Tesi N, et al. Common variants in Alzheimer's disease: novel association of six genetic variants with AD and risk stratification by polygenic risk scores. medRxiv. 2019. [Google Scholar]
- 38. Yamazaki Y, Zhao N, Caulfield TR, Liu CC, Bu G. Apolipoprotein E and Alzheimer disease: pathobiology and targeting strategies. Nat Rev Neurol. 2019;15:501‐518. [DOI] [PMC free article] [PubMed] [Google Scholar]
- 39. Grothe MJ, Villeneuve S, Dyrba M, Bartres‐Faz D, Wirth M. Alzheimer's Disease Neuroimaging I. Multimodal characterization of older APOE2 carriers reveals selective reduction of amyloid load. Neurology. 2017;88:569‐576. [DOI] [PMC free article] [PubMed] [Google Scholar]
- 40. Zhao N, Liu CC, Qiao W, Bu G. Apolipoprotein E, receptors, and modulation of Alzheimer's disease. Biol Psychiatry. 2018;83:347‐357. [DOI] [PMC free article] [PubMed] [Google Scholar]
- 41. Miller KK, Hoffer A, Svoboda KR, Lupica CR. Cholecystokinin increases GABA release by inhibiting a resting K+ conductance in hippocampal interneurons. The Journal of neuroscience : the official journal of the Society for Neuroscience. 1997;17:4994‐5003. [DOI] [PMC free article] [PubMed] [Google Scholar]
- 42. Kwangsik N, Kueider‐Paisley A, Dehkordib SM, et al. Altered bile acid profile in mild cognitive impairment and Alzheimer's disease: relationship to neuroimaging and CSF biomarkers. Alzheimer's Dement. 2019;15:232‐244. [DOI] [PMC free article] [PubMed] [Google Scholar]
- 43. Li QS, Parrado AR, Samtani MN, Narayan VA. Alzheimer's Disease Neuroimaging I. Variations in the FRA10AC1 fragile Site and 15q21 are associated with cerebrospinal fluid Abeta1‐42 level. PLoS One. 2015;10:e0134000. [DOI] [PMC free article] [PubMed] [Google Scholar]
- 44. Hnisz D, Abraham BJ, Lee TI, et al. Super‐enhancers in the control of cell identity and disease. Cell. 2013;155:934‐947. [DOI] [PMC free article] [PubMed] [Google Scholar]
- 45. Hampel H, O'Bryant SE, Molinuevo JL, et al. Blood‐based biomarkers for Alzheimer disease: mapping the road to the clinic. Nat Rev Neurol. 2018;14:639‐652. [DOI] [PMC free article] [PubMed] [Google Scholar]
- 46. Olsson B, Lautner R, Andreasson U, et al. CSF and blood biomarkers for the diagnosis of Alzheimer's disease: a systematic review and meta‐analysis. The Lancet Neurology. 2016;15:673‐684. [DOI] [PubMed] [Google Scholar]
- 47. Sakai K, Senda T, Hata R, et al. Patients that have undergone hemodialysis exhibit lower amyloid deposition in the brain: evidence supporting a therapeutic strategy for Alzheimer's disease by removal of blood amyloid. J Alzheimer's Dis : JAD. 2016;51:997‐1002. [DOI] [PubMed] [Google Scholar]
- 48. Jin WS, Shen LL, Bu XL, et al. Peritoneal dialysis reduces amyloid‐beta plasma levels in humans and attenuates Alzheimer‐associated phenotypes in an APP/PS1 mouse model. Acta Neuropathol (Berl). 2017;134:207‐220. [DOI] [PubMed] [Google Scholar]
- 49. Mullard A. BACE inhibitor bust in Alzheimer trial. Nat Rev Drug Discovery. 2017;16:155. [DOI] [PubMed] [Google Scholar]
- 50. Fullwood NJ, Hayashi Y, Allsop D. Plasma amyloid‐beta concentrations in Alzheimer's disease: an alternative hypothesis. Lancet Neurol. 2006;5:1000‐1001. [DOI] [PubMed] [Google Scholar]
Associated Data
This section collects any data citations, data availability statements, or supplementary materials included in this article.
Supplementary Materials
Supporting Information
Supporting Information
Supporting Information
Supporting Information