Abstract
Chiral magnetic materials are proposed for applications in second‐order non‐linear optics, magneto‐chiral dichroism, among others. Recently, we have reported a set of tetra‐nuclear Fe(II) grid complex conformers with general formula C/S‐[Fe4L4]8+ (L: 2,6‐bis(6‐(pyrazol‐1‐yl)pyridin‐2‐yl)‐1,5‐dihydrobenzo[1,2‐d : 4,5‐d′]diimidazole). In the grid complexes, isomerism emerges from tautomerism and conformational isomerism of the ligand L, and the S‐type grid complex is chiral, which originates from different non‐centrosymmetric spatial organization of the trans type ligand around the Fe(II) center. However, the selective preparation of an enantiomerically pure grid complex in a controlled manner is difficult due to spontaneous self‐assembly. To achieve the pre‐synthesis programmable resolution of Fe(II) grid complexes, we designed and synthesized two novel intrinsically chiral ligands by appending chiral moieties to the parent ligand. The complexation of these chiral ligands with Fe(II) salt resulted in the formation of enantiomerically pure Fe(II) grid complexes, as unambiguously elucidated by CD and XRD studies. The enantiomeric complexes exhibited similar gradual and half‐complete thermal and photo‐induced SCO characteristics. The good agreement between the experimentally obtained and calculated CD spectra further supports the enantiomeric purity of the complexes and even the magnetic studies. The chiral resolution of Fe(II)‐ [2×2] grid complexes reported in this study, for the first time, might enable the fabrication of magneto‐chiral molecular devices.
Keywords: chirality, grid complexes, ion mobility, Mössbauer spectroscopy, spin-crossover
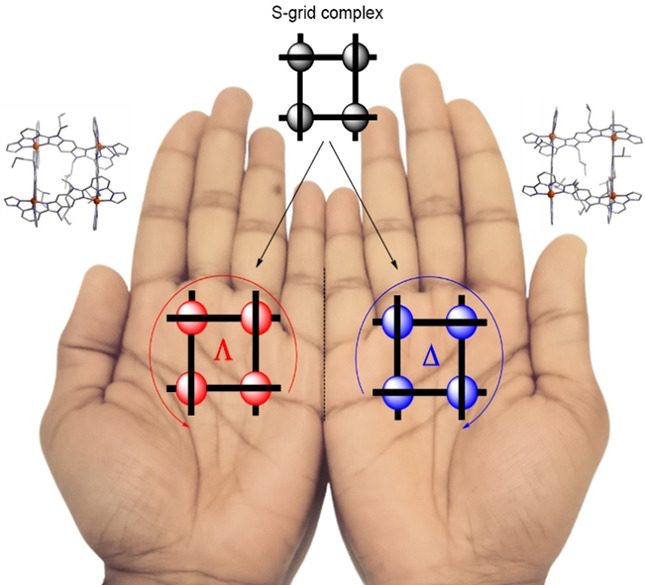
The trans ‐type ligand wrapping around the metal centers in an inter‐woven style makes the complex to be in chiral. This separation of Λ and Δ forms of spin‐crossover isomers was successfully achieved by appending the chiral moiety onto the parent ligand. The presence of spin‐crossover and chirality makes these multifunctional complexes intriguing for the study of magneto‐optical effects.
Introduction
Chirality is one of the most central concepts in molecular sciences. Chiral materials can be found in a wide range of fields such as biology, medicine, [1] magnetism,[ 2 , 3 ] spintronics,[ 4 , 5 ] and non‐linear optics.[ 6 , 7 ] Since the observation of the magneto‐chiral dichroism (MChD) effect in chiral paramagnetic materials, [8] the investigation of chiral magnets has become an active research topic, and multifunctional materials combining magnetism and chirality have been proposed for applications. In 1999, Ron Naaman and co‐workers observed that the interaction of electrons with chiral molecules is spin specific, leading to spin‐filtering termed as chiral induced spin selectivity (CISS) effect. [9] This spin‐filtering ability of chiral molecules has opened up the possibility of using chiral molecules in spintronic devices. [4]
Spin‐crossover (SCO) complexes are the well‐known class of switchable molecular materials capable of undergoing a reversible transition between low‐spin (LS) and high‐spin (HS) states as a function of temperature, pressure, light irradiation or exposure to an electric field.[ 10 , 11 , 12 , 13 ] The hysteretic nature of SCO associated with some of the SCO complexes makes them suitable to fabricate molecular electronic/spintronic architectures.[ 10 , 13 , 14 , 15 , 16 , 17 , 18 ] Introducing chirality into SCO complexes is a promising strategy to obtain novel magneto‐optical materials. [19] Such chiral materials could be optically triggered/addressed, making them suitable for the fabrication of molecular‐and photonic devices. [20] It has been shown that chiral SCO materials could facilitate non‐destructive readout of storage media, using an optical rotation measurement. [21] In this context, Ohkoshi et al. reported spin‐crossover‐induced second‐harmonic generation (SHG), light‐reversible SCO long‐range magnetic ordering, and photo‐reversible switching of the magnetic SHG effect based on a chiral 3D‐cyano‐bridged Fe−Nb bimetallic assembly. [19]
In the family of poly‐nuclear complexes, metallo‐grid complexes stand out in the field of magneto‐chemistry because of their tunable magnetic properties, which can be modulated by varying the ligands and metal centers. [22] Ever since the first report on SCO active grid complexes by Lehn and others, valiant attempts have been directed towards the realization of SCO active grid complexes. Efforts have been made to elucidate the structure‐SCO property relationship and the utility of grid complexes for device fabrication. [23] In 2016, our group has reported a parallel synthesis of Fe(II) grid complex tauto‐conformers based on a homoditopic ligand, which consists of two tridentate 2‐(1H‐imidazol‐2‐yl)‐6‐(pyrazol‐1‐yl)pyridine units interlinked via a central benzo[1,2‐d : 4,5‐d′]diimidazole bridge (Figure 1a). [24] In the same report, the two conformers (S‐form and C‐form), which were caused by tautomerism and conformational isomerism in the ligand (Figure 1b), were separated by fractional crystallization. They showed contrasting magnetic behavior; the S‐form showed gradual SCO, whereas the C‐form is completely trapped in the HS state. [24]
Figure 1.
A) The conformational isomerism and tautomerism in ligand L. B) LTrans and LCis conformers of L in solution. C) Divergent coordination chemistry of ligand L (black bar) on coordination with Fe2+ metal ions (grey balls). D) Λ and Δ‐isomers of the S‐grid complex.
Chirality can be observed in such grid complexes composed of ligands in an interwoven arrangement. In the S‐type grid complex, the four ligands wrap around the four metal centers in a helically interwoven fashion, resulting in the formation of chiral grid complexes, i.e, in the form of enantiomerically pure Δ and Λ forms (Figure 1d). Thus, the S‐type complexes are of interest for applications due to their intrinsically chiral nature. Moreover, the different spatial organization of the ligand around Fe(II) centers and consequent molecular packing in the crystal lattice could lead to enantiomer‐specific SCO characteristics. To harness magneto‐chiral applications, the chiral resolution of S‐grid complexes is necessary and is a challenging task. The majority of the chiral SCO complexes reported[ 21 , 25 ] till today have been obtained by spontaneous resolution, i. e., generation of Δ and Λ crystals simultaneously in the mixture instead of enantiomerically pure complexes. Moreover, it is also challenging to prepare enantiomerically pure complexes in large quantities.
So far, different strategies were developed to solve the problem of isomeric deconvolution, such as using chiral counter anions, [26] or by introducing chirality in the ligand. [27] To the best of our knowledge, the resolution and the studies of two enantiomers of Fe(II) SCO grid complexes have not been reported yet. Moreover, the chiral resolution must be achieved to investigate the relationship between SCO parameters and inbuilt chiral information. In this study, we report on the large scale separation of the two enantiomers of Fe(II) S‐grids achieved by modifying the parent ligand with chiral moieties.
Results and Discussion
Synthesis of ligands and complexes
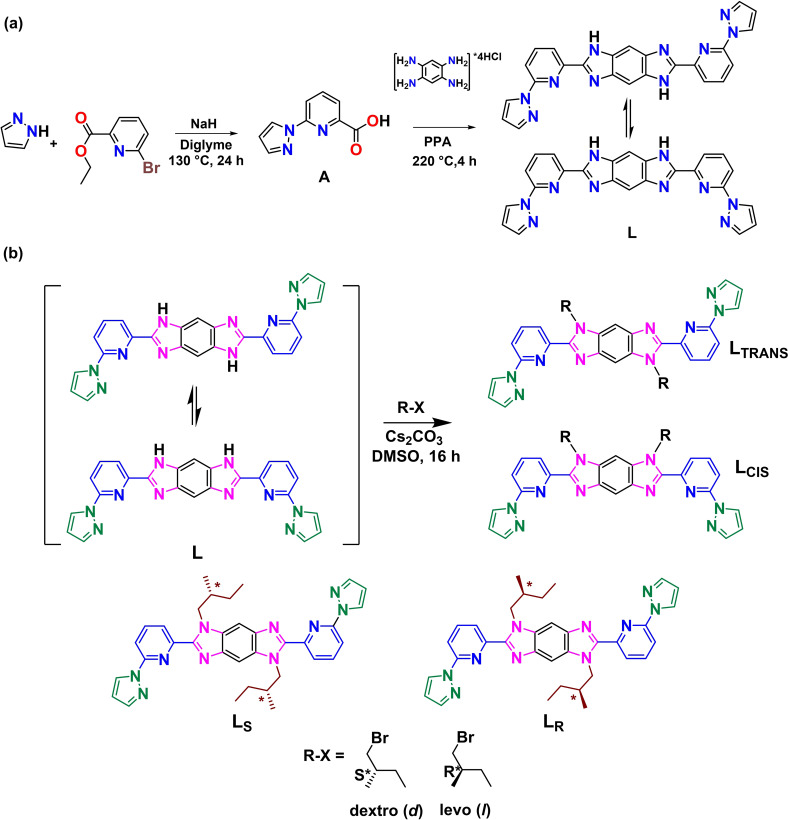
The parent ligand (L) was synthesized by the condensation reaction between the 6‐(1H‐pyrazol‐1‐yl)picolinic acid (A) and 1,2,4,5‐ benzene‐tetraamine in polyphosphoric acid (PPA) (Scheme 1a and Figure SI‐1). As reported, [24] the 1H NMR spectroscopic investigations showed the presence of LTrans and LCis tauto‐conformers in a 1 : 1 molar ratio. This tautomerization in the ligand leads to different coordination modes of the ligand and eventually to the formation of different conformers of metal complexes (Figure 1c). By introducing chemical substitution at the secondary amine group on the parent ligand L to form the tertiary amine, tautomerization can be blocked. [28] Due to the difference in structural conformations, the cis‐ and trans‐type of ligands show different polarities, and this facilitates the separation of the cis‐ and trans‐ ligands by traditional column chromatography.
Scheme 1.
Schematic representation of the synthesis of (a) ligand L, and (b) chiral ligands LS and LR .
The treatment of parent ligand L with chiral (R)‐ and (S)‐alkyl bromides in DMSO in the presence of Cs2CO3 as a base produced two sets of enantiomerically pure cis (R‐cis and S‐cis) and trans (R‐trans and S‐trans) isomers. Thus, tautomerism is prevented on the ligand L (Scheme 1b). 1H NMR measurements confirmed the cis‐ and trans‐ ligands, as they show different shifts for protons on benzene rings (see Figure SI‐3 and Figure SI‐4). Chiral HPLC was used to confirm the enantiopurity of the formed trans ligands and was found to be 94 % and 87 % pure with along with some formation of meso product (see Figure SI‐10).
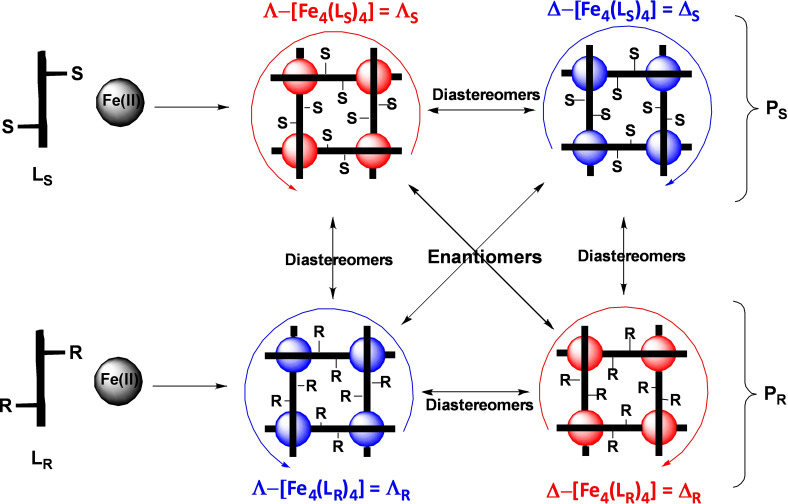
Since our interest is on the non‐centrosymmetric S‐type grid complex, we primarily focus here on trans type ligand. Based on the specific rotation of the chiral moiety affixed, we denoted the new trans ligands by LS and LR (Scheme 1). The reaction of the newly formed trans ligands (LS and LR ) with equimolar amounts of Fe(CF3SO3)2 in acetonitrile yielded two sets of diastereomeric products PS ((Λ)‐[Fe4(LS)4] and (Δ)‐[Fe4(LS)4]) and PR ((Λ)‐[Fe4(LR)4] and (Δ)‐[Fe4(LR)4]) (Figure 2). Several strategies, such as using chiral solvents and chiral counter anions (for crystallization), and recrystallization with different solvents, were adopted to produce pure diastereomers. Among these, repeated recrystallization of the reaction products from acetonitrile helped the separation of pure diastereomers. The ion mobility mass spectrometry (IMMS)was used to confirm the presence of diastereomers. Further, the purity of the complexes was also elucidated by performing XRD and CD spectroscopic studies.
Figure 2.
Scheme for the synthesis of isomeric grid complexes representing the pairs of diastereomers and enantiomers.
Electrospray ionization (ESI) and ion mobility mass spectrometric (IMMS) studies
Electrospray ionization‐mass spectrometry (ESI‐MS) was employed for the identification of the as‐synthesized, purified, and crystallized samples. Details of the MS method are given in the Supporting Information. Briefly, about 10 μg/mL concentrated solution of each sample in acetonitrile was electro‐sprayed. The doubly charged ion peak was found in positive ion mode at m/z 1728 with a few fragments (Figure SI‐5).
To understand the structural details and to find the presence of diastereomers in the samples, ion mobility mass spectrometry (IMMS) experiments were performed. Details of the IMMS methods are given in the Supporting Information. Extracted ion mobilograms for the peak m/z 1728 from PS and PR are shown in Figure 3a and 3b, respectively. The obtained ion mobilogram of each PS and PR for the peak at 1728 m/z showed two peaks, possibly indicating the presence of two diastereomers and their plausible assignments were given in Table 1. The peak with highest intensity P S appeared at 4.86 ms while the next peak was found at 5.26 ms. From the area under the peaks, the abundance of the two isomers was calculated as 73 % and 27 %, respectively (Table 1). Collision cross‐section (CCS) of the ions was calculated using polyalanine dication as a calibrant. The CCS of PS1 and PS2 were 555 Å2 and 583 Å2, respectively. The respective mass spectrum extracted from each of the peaks is shown in the inset C. While the arrival time difference between the two diastereomers was 0.4 ms for PS , it was 0.34 ms for PR (Figure 3). The experimental CCS values for diastereomers from the other crude product PR1 and PR2 were 559 Å2 (drift time (dt): 4.92 ms) and 583 Å2 (dt: 5.26 ms), respectively. So this study shows the possibility of the presence of two diastereomers and the major products of both crude samples show approximately the same CSS values, which is anticipated for enantiomers.
Figure 3.
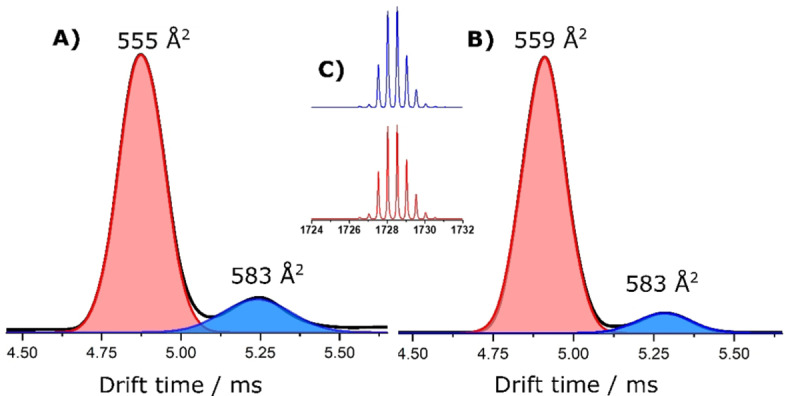
IMMS data of crude samples A) PS and B) PR showing the presence of two isomers (possibly two diastereomers) in both the samples. The mass spectrum extracted from the two peaks of PS is shown in inset C.
Table 1.
CCS and arrival times of different isomers formed.
|
Peak |
Arrival Time [ms] |
CCS [Å2] |
Area [%] |
|---|---|---|---|
|
PS1 (ΛS ) |
4.86 |
555 |
73 |
|
PS2 (ΔS ) |
5.26 |
583 |
27 |
|
PR1 (ΔR ) |
4.92 |
559 |
81 |
|
PR2 (ΛR ) |
5.26 |
583 |
19 |
Single crystal X‐ray diffraction analysis
To study their stereochemistry in detail, the crystal structures of the above‐synthesized complexes were obtained. The crystalline forms of grids PS and PR were obtained by slow vapor diffusion of THF into the solutions of the complexes in acetonitrile. The single‐crystal X‐ray investigations of the crystals carried out at 180 K revealed the expected [2×2] grid type molecular structures. Both isomers crystallized in a non‐centrosymmetric I4 space group, and they are isostructural and isomorphous to each other. Depending on the orientation of ligands around the Fe(II) centers, the configuration of crystals from the PS complex is ΛS and similarly ΔR from the PR complex, while both being enantiomers to each other (Figure 4). All the ligands and central atoms in the structure are crystallographically equivalent with fourfold symmetry. Each unit cell has one grid complex, with the asymmetric unit consists of the FeLS /FeLR moiety and one triflate anion. Although all the anions could not be located, elemental analysis confirmed the molecular formula of [Fe(II) LS ]4(Tf)8 (see Supporting Information). The four Fe(II) ions are located at the corners of the square with an adjacent Fe−Fe distance of 8.978(5) Å, whereas diagonal Fe ions are separated by 12.696(4) Å. Each Fe(II) ion was coordinated by six nitrogen atoms from nearly perpendicularly oriented ligands with a dihedral angle of 87.86°. At 180 K, the average Fe−N bond lengths of the ΛS and ΔR complexes are 1.941(2) Å and 1.951(2) Å, respectively, which corresponds to the LS state. [29] The spin state of Fe(II)‐bis(pyrazol‐1‐yl)pyridine complexes can be confirmed from angular components, for example, the Npyrazole−Fe−Npyrazole angles (ϕ), which is about 160° for LS and 145° for HS and the distortion indices Σ which is ca. 90° for LS and 160° for HS.[ 30 , 31 , 32 ] From the crystal structures, the calculated average values of Npyrazole−Fe−Nimidazole angles (ϕ) are 159.4(4)° and 160.7(6)° for ΛS and ΔR , respectively, confirming the LS for both structures. The bond lengths and the angular parameters are collected in Table SI‐3 and further details are given in the Supporting Information.
Figure 4.
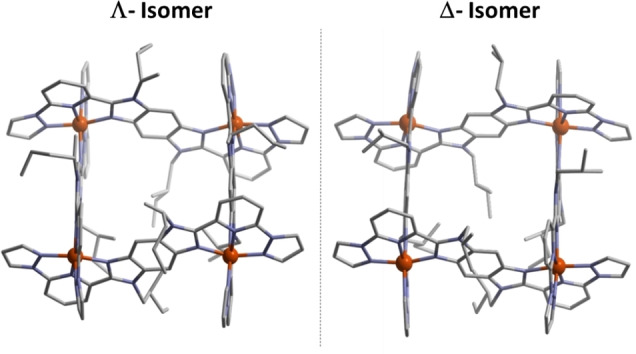
The single crystal X‐ray diffraction structures of enantiomeric Fe(II) grid complexes ΛS and ΔR (H atoms, counter anions, and solvent molecules were omitted for clarity).
Circular dichroism studies and its comparison with time‐dependent density functional theory (TDDFT) calculations
Circular dichroism (CD) is a well‐established technique for studying chiral molecules, that measures the difference in absorbance of the left‐ and right‐handed circularly polarized light by chiral compounds as a function of wavelength. The line shape of the spectrum obtained is characteristic for the absolute configuration of the synthesized complex. Thus, to further analyze the stereochemistry of the complexes, the CD spectra of the complexes were studied in the solution‐state.[ 33 , 34 ] The crude sample from each reaction, used for IMMS, was dissolved in acetonitrile and was subjected to CD measurements. The experiments showed weak signals, confirming a small diastereomeric excess in the crude samples (see Figure SI‐6), which is in agreement with the IMMS studies. However, this is in contrast to the XRD measurements, where the prepared samples were enantiopure. To understand this problem, we measured the CD for several single crystals selected manually out of the crystal mixture by dissolving them in acetonitrile. Some of the crystals showed pronounced peaks with Δϵ values of about +/−300 L mol−1 cm−1 at 383 nm, whereas some other crystals showed a major difference in terms of Δϵ signal, which is lesser than 300 L mol−1 cm−1 (see Figure SI‐6). From this observation, it was clear that, on crystallization, only a few crystals formed were pure diastereomers, whereas the majority were not. Therefore, to achieve pure diastereomers in each case, we performed several recrystallizations, and over every recrystallization cycle, we found an improvement of signals for the bulk sample (see Figure SI‐7). After four recrystallizations, we achieved Δϵ intensities of the complexes, which were the same as that of the corresponding single crystal, and this remained the same even on further recrystallizations. Thus, several steps of recrystallizations have provided a new strategy to produce pure diastereomers in each case.
In Figure 5 the CD and UV‐Vis spectra of the fully resolved enantiomers recorded in acetonitrile solution at 25 °C are shown. The two intense bands at 270 nm and 370 nm are due to ligand‐centered (LC) π→π* transitions. [35] The band at 550 nm corresponds to the metal‐to‐ligand‐charge‐transfer (MLCT) transition, which is observed in LS complexes. [35] All these bands showed strong CD activities for the pure ΛS and ΔR enantiomers. Moreover, the CD signals were found to be exact mirror images with opposite sign of the bands. The most prominent feature in the spectra is the bisignate Cotton effect due to exciton coupling around 370 nm, which has a negative band for the ΛS isomer and a positive band for the ΔR isomer.
Figure 5.
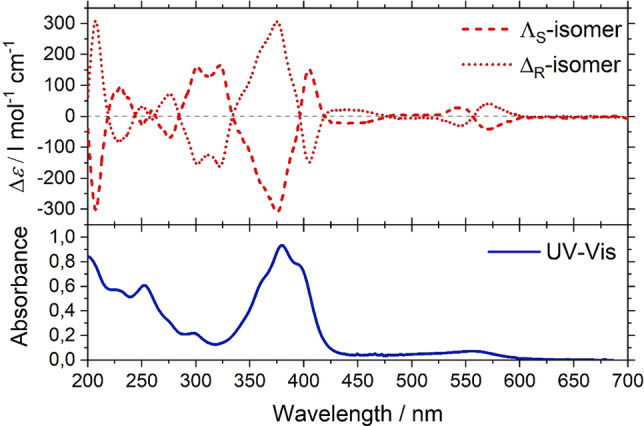
CD and UV‐Vis of ΛS and ΔR ‐Fe(II) grid complexes measured in acetonitrile as solvent.
Time‐dependent density functional theory (TDDFT) has become a standard tool in the evaluation of excited‐state properties.[ 36 , 37 , 38 , 39 ] For the simulation of CD spectra, in particular, TDDFT has been proven to be an accurate and reliable method capable of handling molecules with up to hundreds of atoms.[ 40 , 41 , 42 , 43 , 44 ] Calculations were performed on the low‐spin and high‐spin complexes and before calculating their respective TDDFT spectra, the geometries of the complexes were optimized using Turbomole.[ 45 , 46 , 47 ] The different spectra are shown in Figure 6.
Figure 6.
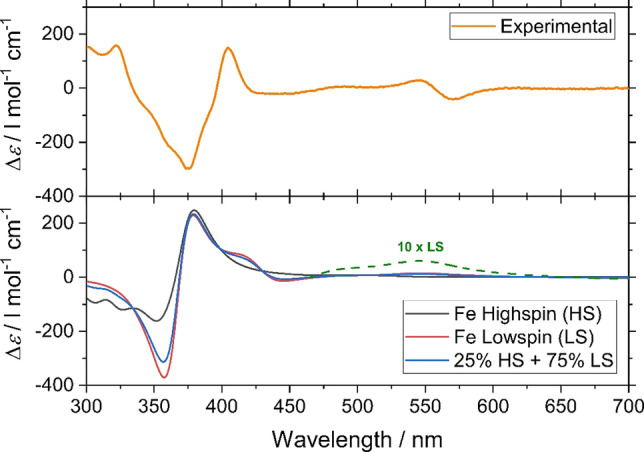
Comparison of experimental CD (top) and simulated CD spectra (bottom) of all ΛS ‐Fe(II) grid complex.
From the magnetic measurements, it was inferred that around 25 % and 75 % of the molecules are in the HS and LS states, respectively, at RT (see below). To mimic the RT situation in the calculations, we included a weighted average of the LS and HS spectra, which was compared to the experimental one. Overall, the calculated and the experimental spectra showed good agreement both qualitatively and quantitatively. The MLCT bands at around 550 nm, however, are significantly smaller in the calculated spectrum. This could be explained by the fact that hybrid functionals are known to underestimate charge‐transfer (CT) excitations. We additionally performed calculations using the CAM‐B3LYP functional, [48] which was designed to capture the effects of CT excitations better. The results of the CAM‐B3LYP calculations did not systematically improve upon the PBE0 calculations: the intensity of the MLCT bands was even smaller than the intensities obtained from the PBE0 functional. One feature which is visible in the simulated spectra is the presence of the MLCT bands in the spectrum of the LS complex, whereas they are absent in the spectrum of the HS complex, as shown in Figure 7.
Figure 7.
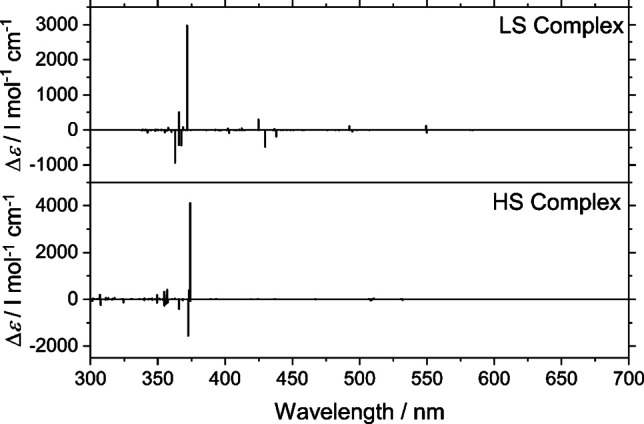
Simulated line spectra of Low‐spin (top) & High‐spin (bottom) ΛS ‐Fe(II) grid complex.
This is in full agreement with the experimental results, and also with the magnetic measurements. The presence of the MLCT bands, therefore, indicates the presence of the LS iron(ii) centers associated with the complex. The comparable nature of the computed CD spectra obtained from TDDFT calculations has validated the enantiomeric purity of the obtained complex.
Temperature and light‐induced spin‐state switching characteristics of the [2×2] grid complexes
The studies of thermal and photo‐induced SCO behavior were carried out by variable temperature magnetic investigation in the thermal range 5–385 K. The χ Μ Τ vs. T dependencies indicate the presence of gradual and high‐temperature SCO behavior in both heating and cooling modes (Figure 8). At room temperature (≈300 K), the χ Μ Τ value is close to ca. 2.84 (for ΛS ‐isomer) and 2.92 (for ΔR ‐isomer) cm3 K mol−1, which corresponds to ca. 25 % of the complexes is in the HS state. The values of χ Μ Τ product at the maximal temperature of measurement are ca. 5.88 (ΛS ‐isomer, at 385 K) and 6.14 (ΔR ‐isomer, at 385 K) cm3 K mol−1 and suggest approximately 50 % of Fe(II) metal centers in HS state. Below 180 K, χΤ value is close to 1.00 cm3 K mol−1, which shows most of the metal centers are in diamagnetic LS state, corroborating well with the spin‐state information obtained from the crystallographic studies. The measurements for both complexes were performed in the several heating and cooling modes. The tiny differences between the curves in corresponding measurement cycles are tentatively attributed to the partial loss of lattice solvents or adsorbed moisture.
Figure 8.
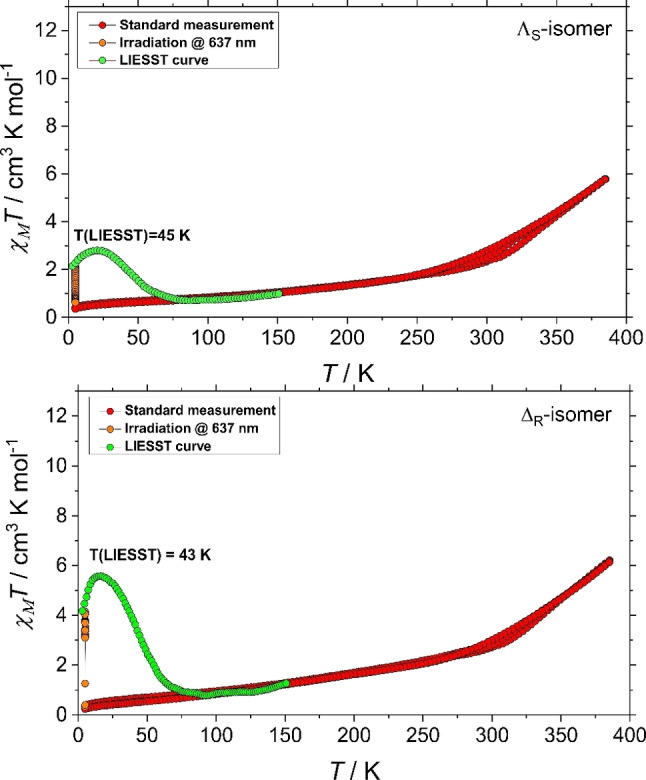
χ Μ T vs. T plots and photo‐magnetic characteristics of ΛS and ΔR ‐complexes.
In order to study and compare the light‐induced SCO behavior in the enantiomeric grid complexes, light‐induced excited spin‐state trapping (LIESST) measurements, both LS (at 5 K) enantiomeric samples were irradiated with red light (λ =637 nm, power=10 mW/cm2) in the dark for ca. 2 h. A significant increase of magnetization was observed under the irradiation, which is an indisputable proof for the formation of photo‐excited metastable HS state. The progress of the magnetization was followed with time, and when saturation was reached, the light was switched off and temperature‐dependent magnetization was recorded in the dark. Both isomers exhibit similar photo‐magnetic properties with partial LS→HS photo‐conversion (≈23 % for ΛS ‐isomer and ≈46 % for ΔR ‐isomer) and gradual thermal relaxation upon the slow heating. The various amounts of the photo‐excited metastable HS state for ΛS and ΔR might be attributed to the different penetration of light through the prepared samples for the irradiation experiments. [49] On the other hand, T(LIESST) temperatures are very similar to each other and correspond to high T 1/2 temperature of thermal SCO, which agrees with the “inverse energy gap law,” which states T(LIESST) is inversely proportional to T 1/2.[ 50 , 51 ]
Mössbauer spectroscopy
57Fe Mössbauer spectroscopy is also another valuable tool for accessing the spin and charge state of the Fe atoms. [52] So, in order to study the spin states at various temperatures, Mössbauer spectra were measured for the 57Fe enriched ΛS and ΔR enantiomeric complexes at 77 K and 300 K temperature. The parameters obtained are compiled in the Table 2.
Table 2.
The isomer shifts (δ) and quadrupole splittings (ΔE Q) of enantiomeric complexes at 77 K and 300 K.
|
T/K |
Complex |
δ [mm/s] |
ΔE Q [mm/s] |
Area [%] |
|---|---|---|---|---|
|
77 |
ΛS ‐isomer (LS) |
0.38(1) |
0.49(2) |
91(1) |
|
ΛS ‐isomer (HS) |
1.10(1) |
2.54(2) |
9(1) |
|
|
77 |
ΔR ‐isomer (LS) |
0.38(1) |
0.49(2) |
93(1) |
|
ΔR ‐isomer (HS) |
1.10(1) |
2.54(2) |
7(1) |
|
|
300 |
ΛS ‐isomer (LS) |
0.32(1) |
0.47(2) |
78(1) |
|
ΛS ‐isomer (HS) |
0.78(1) |
1.80(2) |
22(1) |
|
|
300 |
ΔR ‐isomer (LS) |
0.30(1) |
0.48(2) |
83(1) |
|
ΔR ‐isomer (HS) |
0.78(1) |
1.82(2) |
17(1) |
The spectra (Figure 9) feature two doublets at 77 K for both isomers (for ΛS and ΔR ) with isomer shifts (δ) of 0.38 and 1.10 mm/s. The quadrupole splittings (ΔE Q) obtained are, ΔE Q=0.49 mm/s which corresponds to LS−Fe(II) ions, and ΔE Q=2.54 corresponding to HS−Fe(II). [53] The area under the peaks confirms around ca. 8 % HS content at 77 K. This is in good agreement with the magnetic measurements, which showed non‐zero χΤ values. On the other hand, the spectra obtained at RT features well‐separated quadrupole doublets for both isomers, confirming the two spin states of the iron ions. The figure shows the green doublet with δ=0.32 mm/s, (and ΔE Q=0.47 mm/s for ΛS ) and δ=0.30 mm/s (and ΔE Q=0.48 mm/s for ΔR ) corresponding to the LS content in the samples. Whereas, the red doublet at δ=0.78 mm/s, (with ΔE Q=1.80 mm/s for ΛS ) and δ=0.78 mm/s (ΔE Q=1.82 mm/s for ΔR ) corresponds to HS−Fe(II) (Figure 9). The area under the peaks confirms around ca. 20 % HS content at RT.
Figure 9.
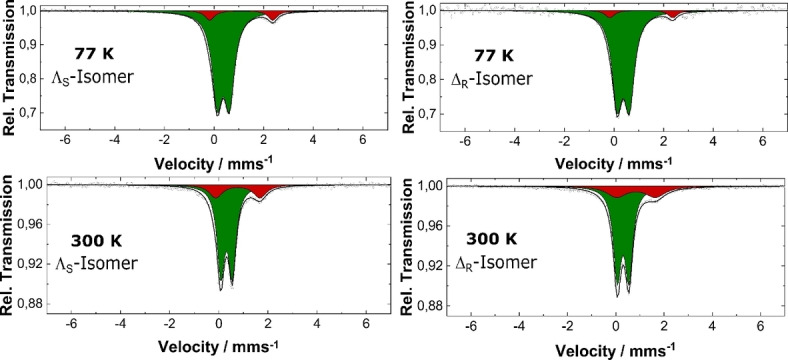
Mössbauer spectra for 57Fe enriched ΛS and ΔR complexes at 77 K and 300 K, green represents LS, and red represents HS.
Magnetic measurements of these resolved enantiomers ΛS and ΔR shows the presence of ∼25 % HS‐state, which is corroborating with Mössbauer measurements at 300 K. On the other hand, at 180 K, the crystal structure shows LS structure which is consistent with the magnetic data. The presence of LS state is also proved from CD data which shows MLCT band around 550 nm. These complexes resolved and discussed in this report stand out as new example for chiral SCO complexes where helical chirality is intrinsic in the coordination environment. Previously, Bark and coworkers reported on successful chiral resolution of Fe(II) grid complexes using a chiralized version of the ligand, where the chiral moiety blocks the formation of another diastereomer with steric hindrance.[ 27 , 54 ] However, in the present case, the resolution was not achieved in a single step, which could be due to the weak interaction of the chiral unit with the neighboring ligands, resulting in the formation of a product with small diastereomeric excess.
Remarkably, the critical step that helped us in the purification of diastereomers was crystallization steps. Chiral self‐sorting effects could have possibly helped during the self‐assembly process. Chiral self‐sorting is a phenomenon where racemic components are spontaneously sorted into homo‐ or hetero‐chiral molecular assemblies through chiral discrimination between the components.[ 55 , 56 , 57 ] The presence of some pure diastereomeric crystals from the first crystallization step could have helped by taking on the role of the seed crystal and undergo preferential crystallization. [58] This helped to improve the diastereoselectivity, as evidenced by CD measurements. In general, preferential crystallization requires the addition of an external seed crystal. However, in the case of here, the in situ generated crystal has helped as a seed crystal for successive stages of crystallization to produce a pure diastereomeric product.
Conclusion
In conclusion, we were able to separately synthesize the first set of enantiomers of SCO [2×2] grid complexes by tailoring the 2,6‐bis(6‐(pyrazol‐1‐yl)pyridin‐2‐yl)‐1,5‐dihydrobenzo[1,2‐d : 4,5‐d′]diimidazole ligand system with chiral centers. IMMS experiments confirmed the formation of diastereomers during the reaction. The stereochemistry of the complexes was confirmed by XRD and CD measurements. Magnetic measurements have shown the gradual temperature‐induced SCO behavior in these complexes, and Mössbauer measurements confirmed the spin states of the complexes. The complexes were LIESST active at low temperatures. Moreover, TDDFT calculations provided additional evidence to both structural and magnetic studies. Such multifunctional architectures, possessing chirality and SCO behavior, are of interest for future applications since they can offer magneto‐chiral effects. Thus, it also represents a promising model for the development of future memory molecular devices. [59] Furthermore, this study has opened the track for preparing other functional molecules by tuning ligand and metal center – such that one could design hetero‐metallic grid like architectures with other functional properties.
Experimental Section
General: Purchased chemicals and solvents were obtained from commercial suppliers and were used without any further purification. The chiral reagent – (S)‐(+)‐1‐bromo‐2‐methylbutane was obtained as 99 % purity from Sigma‐Aldrich. The other chiral reagent ‐ (R)‐(−)‐1‐bromo‐2‐methylbutane was obtained as ≥95 % purity from Angene Chemicals, China. All the reactions were performed under argon(Ar) atmosphere. 1H and 13C NMR, correlation measurements were performed using a Bruker Ultrashield plus‐500 spectrometer with solvent proton as an internal standard. FTIR spectra were measured using KBr pellets (Magna FTIR 750, Nicolet) in the region of 4000–400 cm−1. Mass spectrometric data were obtained with MicroTOF‐Q II Brucker for ESI‐TOF.
Detailed experimental procedures, instrumentation and analytical data are provided in the Supporting Information. Deposition Numbers 2064448 (for Λ S ) and 2064449 (for Δ R ) contain the supplementary crystallographic data for this paper. These data are provided free of charge by the joint Cambridge Crystallographic Data Centre and Fachinformationszentrum Karlsruhe Access Structures service www.ccdc.cam.ac.uk/structures.
Conflict of interest
The authors declare no conflict of interest.
Supporting information
As a service to our authors and readers, this journal provides supporting information supplied by the authors. Such materials are peer reviewed and may be re‐organized for online delivery, but are not copy‐edited or typeset. Technical support issues arising from supporting information (other than missing files) should be addressed to the authors.
Supporting Information
Acknowledgements
This work has been supported by the Deutsche Forschungsgemeinschaft (DFG) through CRC/TRR 88, “Cooperative Effects in Homo‐ and Hetero‐Metallic Complexes (3MET)”. We thank the Karlsruhe Nano Micro Facility (KNMF, www.kit.edu/knmf) for providing access to the instruments at their laboratories. I.Š. acknowledges the financial support from Slovak grant agencies (APVV‐19‐0087, APVV‐18‐0197, APVV‐18‐0016, VEGA 1/0125/18), from institutional sources of the Department of Inorganic Chemistry, Palacký University Olomouc, Czech Republic and from Ministry of Education, Youth and Sports of the Czech Republic under the project CEITEC 2020 (LQ1601) are acknowledged for the financial support. EMP thanks the Panamanian National Systems of Investigators (SNI, SENACYT) for support. We thank Dr. Christoph Zippel and Prof. Stefan Bräse from IOC, KIT for helping us with Chiral HPLC and Polarimeter for our studies. Open Access funding enabled and organized by Projekt DEAL.
N. Suryadevara, A. Pausch, E. Moreno-Pineda, A. Mizuno, J. Bürck, A. Baksi, T. Hochdörffer, I. Šalitroš, A. S. Ulrich, M. M. Kappes, V. Schünemann, W. Klopper, M. Ruben, Chem. Eur. J. 2021, 27, 15172.
References
- 1. Nguyen L. A., He H., Pham-Huy C., Int. J. Biomed. Sci. 2006, 2, 85–100. [PMC free article] [PubMed] [Google Scholar]
- 2. Mito M., Iriguchi K., Deguchi H., Kishine J. I., Kikuchi K., Ohsumi H., Yoshida Y., Inoue K., Phys. Rev. B 2009, 79, 012406. [Google Scholar]
- 3. Train C., Gheorghe R., Krstic V., Chamoreau L. M., Ovanesyan N. S., Rikken G. L. J. A., Gruselle M., Verdaguer M., Nat. Mater. 2008, 7, 729–734. [DOI] [PubMed] [Google Scholar]
- 4. Mathew S. P., Mondal P. C., Moshe H., Mastai Y., Naaman R., Appl. Phys. Lett. 2014, 105, 1–5. [Google Scholar]
- 5. Michaeli K., Varade V., Naaman R., Waldeck D. H., J. Phys. Condens. Matter 2017, 29, 103002. [DOI] [PubMed] [Google Scholar]
- 6. Iazzolino A., Ould Hamouda A., Naïm A., Stefánczyk O., Rosa P., Freysz E., Appl. Phys. Lett. 2017, 110, 1–6. [Google Scholar]
- 7. Neufeld O., Cohen O., Phys. Rev. Lett. 2018, 120, 133206. [DOI] [PubMed] [Google Scholar]
- 8. Rikken G. L. J. A., Raupach E., Nature 1997, 390, 493–494. [Google Scholar]
- 9. Ray K., Ananthavel S. P., Waldeck D. H., Naaman R., Science 1999, 283, 814–816. [DOI] [PubMed] [Google Scholar]
- 10. Kahn O., Martinez C. J., Science 1998, 279, 44–48. [Google Scholar]
- 11. Gütlich P., Gaspar A. B., Garcia Y., Beilstein J. Org. Chem. 2013, 9, 342–391. [DOI] [PMC free article] [PubMed] [Google Scholar]
- 12. Halcrow M. A., Chem. Lett. 2014, 43, 1178–1188. [Google Scholar]
- 13. Kumar K. S., Studniarek M., Heinrich B., Arabski J., Schmerber G., Bowen M., Boukari S., Beaurepaire E., Dreiser J., Ruben M., Adv. Mater. 2018, 30, 1–7. [DOI] [PubMed] [Google Scholar]
- 14. Chandrasekar R., Schramm F., Fuhr O., Ruben M., Eur. J. Inorg. Chem. 2008, 2649–2653. [Google Scholar]
- 15. Senthil Kumar K., Šalitroš I., Boubegtiten-Fezoua Z., Moldovan S., Hellwig P., Ruben M., Dalton Trans. 2018, 47, 35–40. [DOI] [PubMed] [Google Scholar]
- 16. Senthil Kumar K., Ruben M., Coord. Chem. Rev. 2017, 346, 176–205. [Google Scholar]
- 17. Kahn O., Kröber J., Jay C., Adv. Mater. 1992, 4, 718–728. [Google Scholar]
- 18. Senthil Kumar K., Šalitroš I., Suryadevara N., Moreno-Pineda E., Ruben M., Eur. J. Inorg. Chem. 2018, 5091–5097. [Google Scholar]
- 19. Ohkoshi S. I., Takano S., Imoto K., Yoshikiyo M., Namai A., Tokoro H., Nat. Photonics 2014, 8, 65–71. [Google Scholar]
- 20. Browne W. R., Pijper D., Pollard M. M., Feringa B. L., Chirality Nanoscale Nanoparticles, Surfaces, Mater. More, Wiley-VCH, Weinheim: 2009, pp. 349–390. [Google Scholar]
- 21. Sunatsuki Y., Ikuta Y., Matsumoto N., Ohta H., Kojima M., Iijima S., Hayami S., Maeda Y., Kaizaki S., Dahan F., Tuchagues J. P., Angew. Chem. Int. Ed. 2003, 42, 1614–1618; [DOI] [PubMed] [Google Scholar]; Angew. Chem. 2003, 115, 1652–1656. [Google Scholar]
- 22. Ruben M., Breuning E., Lehn J. M., Ksenofontov V., Renz F., Gütlich P., Vaughan G. B. M., Chem. Eur. J. 2003, 9, 4422–4429. [DOI] [PubMed] [Google Scholar]
- 23. Breuning E., Ruben M., Lehn J. M., Renz F., Garcia Y., Ksenofontov V., Gütlich P., Wegelius E., Rissanen K., Angew. Chem. Int. Ed. 2000, 39, 2504–2507; [PubMed] [Google Scholar]; Angew. Chem. 2000, 112, 2563–2566. [Google Scholar]
- 24. Schäfer B., Greisch J.-F., Faus I., Bodenstein T., Šalitroš I., Fuhr O., Fink K., Schünemann V., Kappes M. M., Ruben M., Angew. Chem. Int. Ed. 2016, 55, 10881–10885; [DOI] [PMC free article] [PubMed] [Google Scholar]; Angew. Chem. 2016, 128, 11040–11044. [Google Scholar]
- 25. Liu W., Bao X., Mao L.-L., Tucek J., Zboril R., Liu J.-L., Guo F.-S., Ni Z.-P., Tong M.-L., Chem. Commun. 2014, 50, 4059–4061. [DOI] [PubMed] [Google Scholar]
- 26. Hua X., von Zelewsky A., Inorg. Chem. 1995, 34, 5791–5797. [Google Scholar]
- 27. Bark T., Düggeli M., Stoeckli-Evans H., von Zelewsky A., Angew. Chem. Int. Ed. 2001, 40, 2848–2851; [PubMed] [Google Scholar]; Angew. Chem. 2001, 113, 2924–2927. [Google Scholar]
- 28. Schäfer B., Suryadevara N., Greisch J. F., Fuhr O., Kappes M., Ruben M., Eur. J. Org. Chem. 2021, 2301–2310. [Google Scholar]
- 29. König E., Prog. Inorg. Chem., Wiley; 2007, pp. 527–622. [Google Scholar]
- 30. Wang Q., Venneri S., Zarrabi N., Wang H., Desplanches C., Létard J. F., Seda T., Pilkington M., Dalton Trans. 2015, 44, 6711–6714. [DOI] [PubMed] [Google Scholar]
- 31. Šalitroš I., Fuhr O., Kruk R., Pavlik J., Pogány L., Schäfer B., Tatarko M., Boča R., Linert W., Ruben M., Eur. J. Inorg. Chem. 2013, 1049–1057. [Google Scholar]
- 32. Halcrow M. A., Chem. Soc. Rev. 2011, 40, 4119–4142. [DOI] [PubMed] [Google Scholar]
- 33. Gu Z.-G., Bürck J., Bihlmeier A., Liu J., Shekhah O., Weidler P. G., Azucena C., Wang Z., Heissler S., Gliemann H., Klopper W., Ulrich A. S., Wöll C., Chem. Eur. J. 2014, 20, 9879–9882. [DOI] [PubMed] [Google Scholar]
- 34. Podlech J., Fleck S. C., Metzler M., Bürck J., Ulrich A. S., Chem. Eur. J. 2014, 20, 11463–11470. [DOI] [PubMed] [Google Scholar]
- 35. Hauser A., J. Chem. Phys. 1991, 94, 2741–2748. [Google Scholar]
- 36. Runge E., Gross E. K. U., Phys. Rev. Lett. 1984, 52, 997–1000. [Google Scholar]
- 37. Casida M. E., Chong D. P., Recent Adv. Density Funct. Methods, Part 1 1995, 1, 155. [Google Scholar]
- 38. Gross E. K. U., Kohn W., Adv. Quantum Chem. 1990, 21, 255–291. [Google Scholar]
- 39. Gross E. K. U., Dobson J. F., Petersilka M., Density Funct. Theory II, Springer, Berlin: 2005, pp. 81–172. [Google Scholar]
- 40. Diedrich C., Grimme S., J. Phys. Chem. A 2003, 107, 2524–2539. [Google Scholar]
- 41. Autschbach J., Jorge F. E., Ziegler T., Inorg. Chem. 2003, 42, 2867–2877. [DOI] [PubMed] [Google Scholar]
- 42. Grimme S., Chem. Phys. Lett. 1996, 259, 128–137. [Google Scholar]
- 43. Bauernschmitt R., Ahlrichs R., Hennrich F. H., Kappes M. M., J. Am. Chem. Soc. 1998, 120, 5052–5059. [Google Scholar]
- 44. Bannwarth C., Grimme S., Comput. Theor. Chem. 2014, 1040–1041, 45–53. [Google Scholar]
- 45. Von Arnim M., Ahlrichs R., J. Chem. Phys. 1999, 111, 9183–9190. [Google Scholar]
- 46. Von Arnim M., Ahlrichs R., J. Comput. Chem. 1998, 19, 1746–1757. [Google Scholar]
- 47. Treutler O., Ahlrichs R., J. Chem. Phys. 1995, 102, 346–354. [Google Scholar]
- 48. Yanai T., Tew D. P., Handy N. C., Chem. Phys. Lett. 2004, 393, 51–57. [Google Scholar]
- 49. Chastanet G., Desplanches C., Baldé C., Rosa P., Marchivie M., Guionneau P., Chem. Squared 2018, 2, 2. [Google Scholar]
- 50. Šalitroš I., Pogány L., Ruben M., Boča R., Linert W., Dalton Trans. 2014, 43, 16584–16587. [DOI] [PubMed] [Google Scholar]
- 51. Hauser A., Coord. Chem. Rev. 1991, 111, 275–290. [Google Scholar]
- 52. Kojima N., Okazawa A., Top. Appl. Phys., Springer, Heidelberg, Berlin: 2021, pp. 267–317. [Google Scholar]
- 53. Wolny J. A., Schünemann V., Németh Z., Vankó G., Comptes Rendus Chim. 2018, 21, 1152–1169. [Google Scholar]
- 54. Bark T., Von Zelewsky A., Rappoport D., Neuburger M., Schaffner S., Lacour J., Jodry J., Chem. Eur. J. 2004, 10, 4839–4845. [DOI] [PubMed] [Google Scholar]
- 55. Gütz C., Hovorka R., Schnakenburg G., Lützen A., Chem. Eur. J. 2013, 19, 10890–10894. [DOI] [PubMed] [Google Scholar]
- 56. Chen L. J., Yang H. B., Shionoya M., Chem. Soc. Rev. 2017, 46, 2555–2576. [DOI] [PubMed] [Google Scholar]
- 57. Tateishi T., Kojima T., Hiraoka S., Commun. Chem. 2018, 1, 1–12. [Google Scholar]
- 58. Qin L. F., Pang C. Y., Han W. K., Zhang F. L., Tian L., Gu Z. G., Ren X., Li Z., CrystEngComm 2015, 17, 7956–7963. [Google Scholar]
- 59. Kumar K. S., Ruben M., Angew. Chem. Int. Ed. 2021, 60, 7502–7521; [DOI] [PMC free article] [PubMed] [Google Scholar]; Angew. Chem. 2021, 133, 7578–7598. [Google Scholar]
Associated Data
This section collects any data citations, data availability statements, or supplementary materials included in this article.
Supplementary Materials
As a service to our authors and readers, this journal provides supporting information supplied by the authors. Such materials are peer reviewed and may be re‐organized for online delivery, but are not copy‐edited or typeset. Technical support issues arising from supporting information (other than missing files) should be addressed to the authors.
Supporting Information


