

Abstract
In this article we focus on a systematic approach to assess common orbital lesions on magnetic resonance imaging (MRI). The identification of the probable compartment or structure of origin helps narrow the differential diagnosis of a lesion. Analyzing the morphology, appearance, and signal intensity on various sequences, the pattern, and degree of contrast enhancement are key to characterize lesions on MRI. Imaging features suggesting cellularity and vascularity can also be determined to help plan for biopsy or surgery of these lesions. MRI can also distinguish active from chronic disease in certain pathologies and aids in selecting appropriate medical management. MRI may thus serve as a diagnostic tool and help in guiding therapeutic strategies and posttreatment follow-up.
Keywords: Magnetic resonance imaging, MRI, orbit, pathology, tumor
In part two of this article, we will review the appearance of common orbital pathologies on magnetic resonance imaging (MRI). A key approach to the radiological diagnosis of lesions is to narrow the differentials by localizing the lesion to a region or orbital compartment and ascertain the structure of origin [Table 1]. Lesions may either be localized to a single compartment or be multispatial.[1]
Table 1.
Contents of the orbital compartments
| Intraconal Compartment | Extraconal Compartment |
|---|---|
| Optic nerve-sheath complex | Trochlear nerve (CN IV) |
| Ophthalmic artery | Lacrimal branch of ophthalmic nerve (CN V1) |
| Oculomotor nerve (CN III) | |
| Abducens nerve (CN VI) | Frontal branch of ophthalmic nerve (CN V1) |
| Nasociliary branch of ophthalmic nerve (CN V1) | Superior and inferior ophthalmic veins |
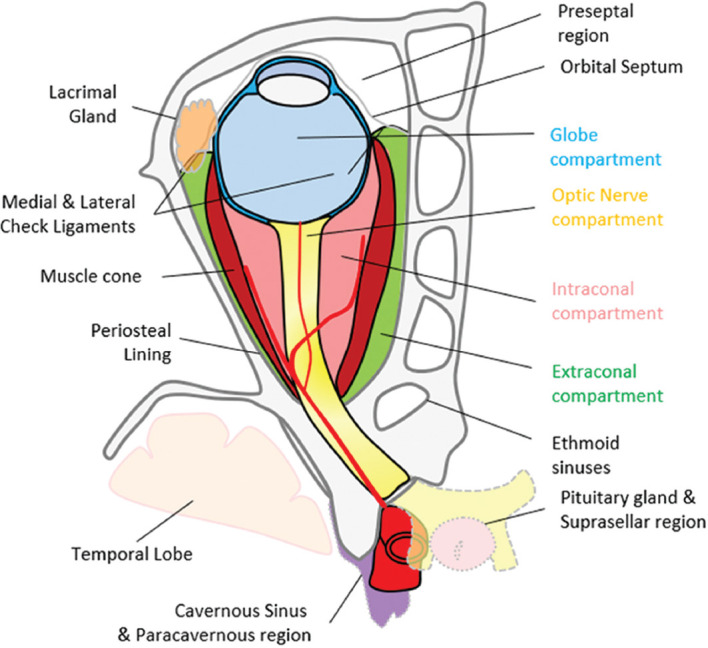
The orbit can be subdivided into the preseptal and postseptal compartments by the septum. The postseptal orbit is subdivided by the cone of extraocular muscles (EOMs), which separate the extraconal and intraconal compartments [Figs. 1 and 2]. Preseptal space lesions are optimally evaluated by clinical methods, and cross-sectional imaging is sought to identify the presence and extension of postseptal involvement. This article will focus on the relevant pathologies that may affect the eye and the postseptal orbit.
Figure 1.

Compartmental classification of the orbital spaces. This aids in narrowing differentials on the basis of structures contained within the respective compartments
Figure 2.
Pictorial representation of the orbital compartments and adjacent structures
Intraconal Pathology
We categorize the intraconal compartment from the radiological perspective into three segments: the globe, retrobulbar space-optic nerve (ON) sheath complex, and orbital apex-cavernous sinus. The cavernous sinus has been included in this space for convenience, as the lesions in the orbital apex are often in contiguity with the cavernous sinus.
Ocular (Globe) pathology
Only a few lesions are discussed here [Table 2]. Colobomas can range in size from small defects to large retrobulbar cystic masses. They show fluid signal intensity similar to orbital contents and best delineated on T2 sequences. Volumetric thin-slice heavily T2-weighted sequences such as FIESTA, SPACE, or CISS (proprietary sequence names) are ideal. Advanced myopia, posterior staphyloma, and duplication cyst can mimic this appearance radiologically. MRI is also useful to rule out colobomatous cysts and other systemic associations, which can be seen in up to 30% of these cases.[2]
Table 2.
Relevant ocular lesions in MRI
| Etiology | Entity |
|---|---|
| Congenital anomaly | Colobomas |
| Persistent fetal vasculature (PFV) | |
| Coat’s disease | |
| Inflammation | Endophthalmitis |
| Posterior scleritis | |
| Uveitis | |
| Tumor | Retinoblastoma |
| Uveal melanoma | |
| Choroidal metastases | |
| Choroidal hemangioma | |
| Degenerative | Choroidal detachment |
| Retinal detachment | |
| Vitreous hemorrhage |
Morning glory disc anomaly is a rare congenital ON anomaly that may sometimes be confused for a coloboma on imaging. It is characterized by a funnel-shaped abnormality of the optic disc, the elevation of the adjoining retinal surface, fat intensity infiltration of the ON sheath (ONS), and occasional enhancement of the distal intraorbital ON. Although usually a clinical diagnosis, computed tomography (CT) and MR imaging aid in detecting associated skull base defects, encephaloceles, and vascular malformations.[3]
Persistent fetal vasculature is characterized by microphthalmos with the characteristic appearance of the Cloquet canal, which is seen as a T2 hypointense cone-shaped structure. Subretinal collections may appear T1 hyperintense with variable T2 signal intensity (due to proteinaceous contents) and variable fluid–fluid levels.[4] Retrolental membranes are seen as T2 hypointense masses with postcontrast enhancement. The presence of membranes with the Cloquet canal gives rise to the Martini Glass sign on MRI. Susceptibility-weighted imaging (SWI) may show blooming related to the presence of blood products [Fig. 3]. CT is useful to demonstrate the lack of calcification, differentiating it from other lesions such as retinoblastoma.
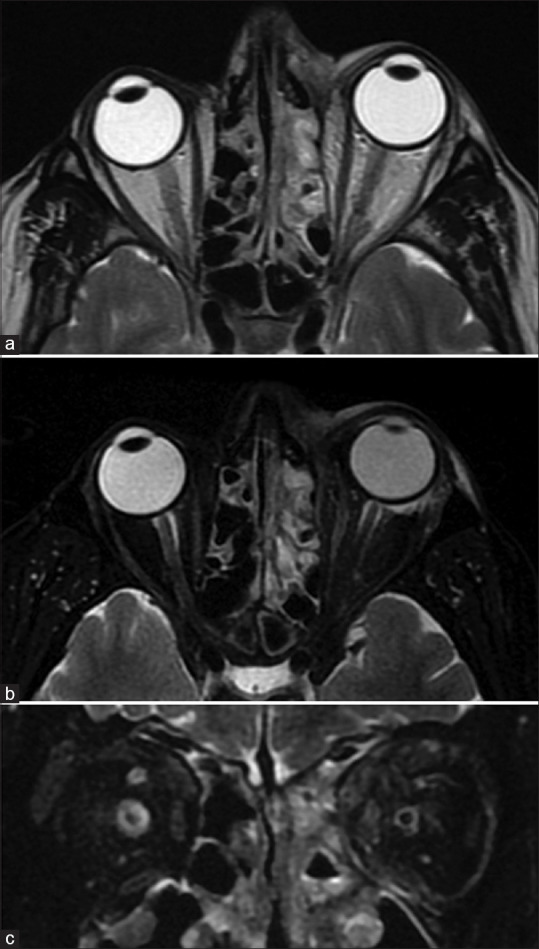
Figure 3.

Persistent fetal vasculature (PFV). T2-weighted images (a) show left-sided pthisis bulbi with ill-defined retrolental membranes (* in a). The Cloquet canal is seen as a linear T2 hypointensity (in a) within the vitreous cavity and more prominently with significant blooming (* in b) on susceptibility weighted images consistent with prior thrombosis
MRI is also useful in the evaluation of posterior scleritis. It is seen as eccentric scleral thickening and enhancement, which may demonstrate nodularity or mass-like appearance mimicking melanoma. Areas of focal thinning may indicate impending rupture. Periscleral cellulitis, seen as fat stranding on T2FS with postcontrast enhancement, may precede and progress into orbital cellulitis with or without associated suprachoroidal effusion, retinal/choroidal detachment, uveitis, or dacryoadenitis.
Detachments of the retina, choroid, and vitreous can be differentiated based on their morphology [Fig. 4].[5] In both, the detached membranes are best visualized on T2-weighted images as hypointense linear structures. Unlike retinal detachment, choroidal detachment is not limited anteriorly by the ora serrata. Retinal detachment tends to converge toward the optic disc (producing a characteristic V shape). Choroidal detachment usually shows membranes that are parallel to the lateral aspects of the globe and are limited by the exit foramina of the vortex veins posteriorly and at the ciliary body root anteriorly [Fig. 5].[6] The subjacent subretinal or subchoroidal fluid may have altered signal intensity depending on the degree of protein content (varying from fluid signal intensity to T1 hyperintense and variable T2 signal intensity) [Fig. 6]. The presence of T1 hyperintensity should also raise suspicion of hemorrhage, which can be differentiated by proteinaceous contents by the presence of blooming on SWI. MRI may also facilitate the detection of underlying neoplasms when fundus view is inadequate. Posterior vitreous detachments are a commonly incidental age-related phenomenon. They are characterized by a thin undulating membrane (the posterior vitreous capsule) that are usually parallel to the posterior aspect of the globe and not attached to the optic disc or the margins of the vortex vein exit foramina. Ultrasound is confirmatory with free movement of the membrane away from the optic disc on eye movements.[6]
Figure 4.

Graphical representation of morphological differences between retinal (a), choroidal (b), and posterior vitreous (c) detachments. (OS – Ora serrata, OD – Optic disc). Funnel-shaped RD vs. lentiform shape of CD, limited by the anchoring effect of the vortex veins. In posterior vitreous detachment, the posterior vitreous capsule is not attached to the OD or necessarily follows the limits of the vortex vein insertion points
Figure 5.

Ocular surface squamous neoplasia (OSSN) with secondary combined retinal and choroidal detachments. Sagittal and axial T2FS (a and b) shows a T2 hyperintense enhancing invasive mass overlying the ocular surface on the right side (arrowheads). The underlying choroidal detachment shows characteristic lentiform morphology with T2 hyperintense T1 isointense subchoroidal fluid (* in b and c). The detached choroidal membrane is vascular and shows strong enhancement on postcontrast T1FS (d). The retinal detachment appears funnel-shaped, whose membrane (arrows in b and c) is poorly defined on T2FS (b) and better appreciated on noncontrast T1 (c) without significant contrast enhancement (d)
Figure 6.

Hemorrhagic retinal detachment. Axial T2 (a) shows characteristic funnel shape of retinal detachment on the left side. The subretinal fluid appears T2 isointense and T1 hyperintense (b) with blooming (arrowhead in c) along the detached retinal membrane on SWI consistent with subacute hemorrhagic products. Loss of normal fluid signal intensity characteristics of the vitreous humor of the involved eye (cf. contralateral eye) is apparent as vitreous chamber FLAIR hyperintensity (arrow in d) consistent with accompanying vitreous degeneration
In endophthalmitis, uveal thickening may be apparent on T2-weighted images with prominent postcontrast enhancement. Associated chorioretinal or vitreous detachment may be present. Proteinaceous exudates within the vitreous may demonstrate hyperintense signal on fluid-attenuated inversion recovery (FLAIR) and T1 with frank purulent content showing diffusion restriction. MRI also aids in assessing post-treatment response with resolution of diffusion restriction indicating favorable outcome.[7] In addition to the scleral involvement, panophthalmitis shows variable, often extensive extrascleral involvement seen as hyperintensity on T2 fat-saturated (T2FS) images and postcontrast enhancement reflecting inflammatory changes of the orbital fat [Fig. 7].
Figure 7.

Panophthalmitis. Axial STIR (T2FS) (a) shows right-sided proptosis, significant preseptal, and postseptal edema with irregular thickening of the globe wall. DWI (b) shows hyperintensity consistent with cytotoxic edema-related diffusion restriction of the layers of the globe wall. SWI (c) shows blooming in the same regions consistent with chorioretinal hemorrhages (arrowheads). As compared to precontrast T1 (d), postcontrast T1FS (e and f) shows avid enhancement of the chorioretinal layers as well as of the pre- and postseptal soft tissues
MRI is invaluable in evaluating the extent of retinoblastoma (Rb). The tumor appears T2 hypointense and T1 hyperintense relative to the vitreous. It may show diffusion restriction with moderate postcontrast enhancement. Foci of calcification appear as hypointensities on all sequences with blooming on SWI.[8] Vitreous seeding, a marker of poor prognosis, can be identified as T1 hyperintense, T2 hypointense foci against the fluid signal of the vitreous cavity. The vitreous may also show signal intensity changes with increased T1 hyperintensity owing to changes in the albumin:globulin ratio.[8] MRI is sensitive for detecting advanced tumoral infiltration of ON but may be equivocal in early involvement. A thickened and enhancing postlaminar ON usually indicates tumor infiltration. The most reliable signs to rule out advanced postlaminar ON involvement are normal size, preserved T2 signal and ON enhancement ≤3 mm in size. More subtle findings such as enhancement at the globe-nerve junction can represent postlaminar tumor, pre- or intralaminar tumor with a posteriorly displaced lamina cribrosa, central retinal vessels, or inflammation.[9] Choroidal invasion appears primarily as an interruption or discontinuity of the normal chorioretinal outline on both T1 and T2 images with focal areas of increased enhancement or as thinning or loss of normal chorioretinal enhancement on postcontrast T1 images. More severe choroidal involvement may result in mass-like thickening. This must be distinguished from diffuse thickening and enhancement of the entire uvea (choroid, ciliary body, iris), which may be uveitis induced by tumor necrosis. Scleral and periscleral involvement is evidenced by protrusion of enhancing tumor into or through the hypointense outline of the sclera [Figs. 8-10].[10,11] Intracranial extension with cerebrospinal fluid seeding can be seen as leptomeningeal enhancement and deposits on postcontrast images.
Figure 8.

Retinoblastoma. CT (a) shows calcifications within the left globe. Axial T2 (b) nicely delineates a relatively T2 hypointense ocular mass with ciliochoroidal extension (*). The lesion shows mild heterogeneous postcontrast enhancement (c). DWI (d) and ADC map (e) show lesional hyperintensity with corresponding hypointensity, respectively, consistent with hypercellularity
Figure 10.

Patterns of extension/involvement of retinoblastoma – anterior chamber finding with neovascularization of iris seen as abnormal enhancement (arrow in a), optic nerve involvement with abnormal enhancement (arrow in b), and orbital extension with breach of sclera (arrow in c). Figures (d-f) show intracranial extension of retinoblastoma in a patient. Extensive involvement of the optic nerve and chiasm (arrows in d and e, respectively) is seen with resultant enlargement and formation of a suprasellar cisternal mass (arrow in f). Note moderate homogeneous enhancement of the affected structures
Figure 9.

Retinoblastoma growth patterns. Endophytic, exophytic, combined exo-endophytic pattern, diffusely infiltrating and Pthisis bulbi
While many of these findings necessitate enucleation, some patients may be eligible for globe salvage therapies with the utilization of intra-arterial chemotherapy. An MR angiography (MRA) should also be part of the protocol to demonstrate variant arterial anatomy such as ophthalmic artery origins from the middle meningeal artery or dual arterial supply.[9] A new area of interest, termed radiogenomics, correlates tumor imaging characteristics with genetic alterations.[12] With more cumulative data, this method of radiophenotyping holds promise in aiding in early staging and treatment decision making in the future. MRI can also be used to evaluate treatment response. Tumor enhancement can persist despite chemotherapy and may be related to either residual tumor or treatment-related effects. DWI may help in distinguishing residual tumor which shows cellularity related diffusion restriction.[7] Postenucleation, the ON may show enhancement. In majority of cases, clinicoradiological follow-up is adequate as this is usually benign and should not be mistaken for recurrent tumor.[13] The lack of ionizing radiation also makes MRI ideal for imaging pediatric population. CT should be avoided due to increased risk of secondary malignancy in children with heritable Rb.
Coats’ disease or exudative retinopathy is a unilateral telangiectatic neovascular disease of the retina of unknown etiology. It may clinically and radiologically mimic retinoblastoma (pseudoretinoblastoma). MRI can be useful in distinguishing these entities. In Coat’s disease, the affected globe is smaller (usually larger in Rb), has a Y-shaped retinal detachment (v-shaped in Rb), and has absent calcifications with solid components that show no to minimal enhancement. Enhancement when seen is mismatched with the solid components, i.e., is outside the solid components. Unlike nonenhancing vitreal tumoral seeds in Rb, enhancing subfoveal nodules are seen in Coats’ disease. Intraretinal macrocysts are a newly described specific finding of Coats’ disease as well.[14]
Uveal melanoma is the most common primary malignant intraocular tumor in adults. Melanin being paramagnetic appears T1 hyperintense and T2 hypointense giving the tumor its characteristic appearance [Fig. 11]. Amelanotic and mixed variants, hence, may not show T1 hyperintensity making their recognition more difficult.[15] The tumors do show enhancement which may be demonstrated by subtracting the post- and precontrast images.
Figure 11.

Choroidal melanoma. Well-defined lesion seen overlying the optic disc on the left side appearing T2 hypointense (a), characteristically T1 hyperintense (b) with strong homogenous postcontrast enhancement (c)
Choroidal hemangiomas occur in middle-aged and elderly patients. They appear as dome-shaped elevations of the choroid, usually posterior to the globe equator. Lesions associated with Sturge Weber syndrome may be more extensive. They appear T1 hyperintense relative to vitreous potentially mimicking uveal melanomas but are differentiated by hyperintense signal on T2 weighted images. They show similar, intense postcontrast enhancement.[16]
Uveal metastases most commonly occur from the breast and lung primaries. They occur as exophytic masses that are usually T1 hypointense and T2 hyperintense with postcontrast enhancement [Fig. 12]. The exception being hemorrhagic or mucinous adenocarcinomas, which appear T1 hyperintense mimicking melanomas.[5] In the complicated setting due to associated retinal detachment, both metastases and melanomas may be detected by diffusion restriction concordant with their increased cellularity.[17]
Figure 12.

Choroidal metastases from lung carcinoma. Posterior choroid mass appearing T2 hypointense (a) and T1 isointense (b) with moderate heterogenous contrast enhancement (c). Chest radiograph shows left upper zone mass (arrow in d) with lesion confirmed on CT-guided biopsy (arrow in e) and histopathology of the enucleated eyeball
Primary intraocular lymphomas are a rare subset of primary central nervous system (CNS) lymphoma. MRI has a poor sensitivity for detecting these lesions. Postcontrast T1 images are most useful in suspected cases and may reveal subtle to extensive plaque like thickening of the uvea. Visualization on T2 as hypointense thickening is evident only if extensive changes are present. Differentiation from mimics such as uveitis or ocular melanoma is difficult based on imaging alone, although strong diffusion restriction may be indicatory.[18]
Optic nerve complex lesions and Retrobulbar pathology
From an etiological perspective, lesions can be classified into infectious, inflammatory, and neoplastic [Table 3]. Neoplastic lesions can be vasculogenic, lymphoproliferative, or neurogenic in origin.
Table 3.
Intraconal optic nerve sheath complex Lesions
| Etiology | Entity |
|---|---|
| Congenital/Hereditary | Optic nerve aplasia and hypoplasia |
| Leber’s hereditary optic neuropathy | |
| Demyelination | Optic neuritis (isolated or related to multiple sclerosis, neuromyelitis optica spectrum, or acute disseminated encephalomyelitis) |
| Inflammatory | Perineuritis |
| Idiopathic pseudotumor | |
| Sarcoidosis | |
| Neoplastic | Glioma |
| Meningioma | |
| Metastases | |
| Lymphoma | |
| Extension from intraocular tumors | |
| Ischemic | Anterior ischemic optic neuropathy (arteritic or nonarteritic) |
| Posterior ischemic optic neuropathy | |
| Miscellaneous | Intracranial hypertension (idiopathic or secondary) |
| Secondary optic neuropathies | |
| Traumatic | |
| Toxic | |
| Secondary compressive optic neuropathy | |
| Tumoral (orbital/suprasellar) pathologies | |
| Thyroid orbitopathy | |
| Vascular congestion related to malformations |
The ON consists of four segments from anterior to posterior: the ON head, intraorbital, intracanalicular, and intracranial segments and normally shows a progressive tapering of width posteriorly. MRI is superior to CT in demonstration of ON anatomy, particularly in the optic canal and intracranial segments where bone-related artifacts hamper CT. Intrinsic ON signal abnormalities are best delineated on coronal T2 fat saturated (T2FS) sequences. The course of the ON is best demonstrated on oblique sagittal T2-weighted sequences. Contrast enhancement requires comparing both pre- and postcontrast T1 FS sequences. The ON complex may be affected by a variety of disease processes.
Optic neuritis manifests as high T2 signal intensity with or without ON swelling on T2FS images. This hyperintensity per se is nonspecific since this may represent a combination of ischemia, inflammation, edema, or demyelination.
In ischemic optic neuritis (ION), MRI allows for differentiation between the arteritic (AION) and non-arteritic (NA-ION) varieties. This is of clinical significance since the former necessitates urgent steroid therapy. AION shows a greater degree of cytotoxic edema that manifests as diffusion restriction and breakdown of the blood–brain barrier at the ON papilla, resulting in focal intravitreal bulging and enhancement of the ON head, best seen on volumetric T2-weighted images such as FIESTA [Fig. 13]. This appearance is termed the central bright spot sign and has a strong negative predictive value, i.e., its absence reliably indicates NA-ION.[19] NA-ION is more likely to show postcontrast enhancement of the ON proper without diffusion restriction.[20] MRA is indicated in suspected ischemic optic neuropathy to look for abnormalities such as occlusions or dissections of the internal carotid artery or a vasculitis.
Figure 13.

Ischemic optic neuropathy: Coronal (a) and axial STIR (b) shows hyperintensity of the right optic nerve. Diffusion restriction with hyperintensity on DWI (arrow in c) and hypointensity on ADC maps (d) indicating cytotoxic edema
Severe demyelinating optic neuritis may also show diffusion restriction along with contrast enhancement of the ON and portends a poor prognosis for visual recovery [Fig. 14].[21] Screening of the neuraxis, specifically FLAIR for the brain and T2 for the spine, will help in demonstrating demyelinating etiologies such as multiple sclerosis (MS), Aquaporin-4 (AQP4) related neuromyelitis optic spectrum disorders (NMOSD) and anti-MOG (myelin oligodendrocyte glycoprotein) disorders (MOGAD). Any associated CNS abnormality may need contrast enhanced study of the neuraxis. Some variations are seen in the patterns of optic neuritis in these disorders: in AQP4 NMOSD, it tends to be bilateral, longer length of involvement commonly affecting the posterior segments including chiasma. In MOGAD, it is similarly bilateral and long segment but involves the anterior ONs. In MS, unilateral and short segment involvement anywhere along the ON can be seen.[22] MRI can also aid in diagnosis of optic neuritis secondary to sarcoidosis, Wegener’s granulomatosis, and other miscellaneous autoimmune connective tissue disorders.
Figure 14.

Demyelinating optic neuritis. Coronal STIR (a) shows hyperintensity of the right optic nerve. No diffusion restriction is seen on DWI (b). As compared to precontrast T1FS (c) and the contralateral optic nerve, note abnormal optic nerve enhancement on postcontrast T1FS (d) consistent with active disease in this case of neuromyelitis optica spectrum disorder
Inherited optic neuropathies such as Leber’s hereditary optic neuropathy and Friederichs’ ataxia are indistinguishable on MRI with the former mimicking MS even on brain imaging.[23] Toxic, infectious and infiltrative neuropathies are also indistinguishable radiologically.[24] Compressive optic neuropathy is usually apparent as ON edema in the presence of recognizable primary disorder including tumors, thyroid ophthalmopathy, mucoceles, aneurysms, trauma, etc.
Optic perineuritis may be idiopathic (as a component of idiopathic orbital inflammatory disease – IOI) or may occur in diseases such as sarcoidosis. While optic perineuritis presents clinically similar to optic neuritis, radiologically it simulates an ONS meningioma. MRI reveals ONS thickening that may extend intracranially along with variable orbital fat stranding. ONS enhancement gives the appearance of a tram-track or a doughnut on axial and coronal views, respectively. The ON per se may also show subtle enhancement, as may the sclera and EOMs.[25]
Optic nerve or pathway gliomas (ONG) may occur in isolation or as a manifestation of neurofibromatosis 1 with bilaterality being almost pathognomonic for NF1. Low-grade ONGs commonly occur in the pediatric age group, while higher grade more aggressive ONGs occur in adults and non-NF1 cases.[15] MR is the modality of choice to assess intraorbital and intracranial extension, but CT is complementary to depict optic canal widening, subtle tumoral calcifications and aids in differentiating from meningioma [Fig. 15]. In the initial stages, it may present as asymmetric prominence of the perioptic CSF spaces on the involved side. ONGs cause fusiform ON enlargement with kinking and may be associated with dural ectasia. They are T1 hypointense and T2 hyperintense with variable contrast enhancement. The presence of contrast enhancement suggests a more aggressive tumor.[26]
Figure 15.

Optic nerve glioma. Axial (a) and oblique sagittal T2FS (b) shows T2 hyperintensity, enlargement, and buckling of the right optic nerve. The mass is not seen separate from the optic nerve and appears T1 isointense (c) with homogeneous postcontrast enhancement (d)
Optic nerve sheath meningioma (ONSM) may be primary or secondary (perineural extension of intracranial meningioma). They may have a variety of growth patterns with tubular, globular, fusiform, or focal growths. CT is optimal for depiction of bony hyperostosis and tram-track calcifications, which may be subtle or nondetectable on MRI. The involved ON is usually smaller compared to the contralateral nerve due to compression. MRI optimally depicts the thickened ONS separately from the underlying ON. ONSM is T1 and T2 hypointense and shows moderate to intense enhancement in a tram-track (axial) or doughnut/target pattern.[27] [Fig. 16] ONSM can be mimicked by many other neoplastic infiltrative disorders and should be closely followed clinicoradiologically.
Figure 16.

Optic nerve sheath meningioma (ONSM). Well-defined relatively T2 hypointense lesion seen on axial T2 (a). The optic nerve is seen separately on both axial T2 and coronal STIR (b). The lesion is T1 isointense (c) with avid homogeneous postcontrast enhancement (f). Note nonenhancing optic nerve within which would give tram-track sign appearance with a smaller lesion. The lesion shows diffusion restriction – DWI hyperintensity (d) with ADC hypointensity (e) consistent with hypercellularity. An ON glioma would show diffusion facilitation instead
Secondary tumors affecting the ON are commonly due to direct extension such as from retinoblastoma or infiltrating orbital tumors. Less common are lymphoproliferative disorders or direct metastases. These are difficult to differentiate radiologically and may mimic optic neuritis features.[2] Optic nerve thickening that may be T2 hypointense with diffuse enhancement and sheath thickening demonstrating tram-track appearance on postcontrast T1 imaging may be seen in ON lymphomas.[28] Intracranial hypertension results in typical abnormalities of the ONS complex. These are best demonstrated on oblique sagittal volumetric T2W sequences. Classic features are bulging of the papilla (papilledema), flattening of the posterior globe, prominence of the perioptic CSF, and superoinferior kinking of the ON. Intracranial features include an enlarged empty sella. A MR venography is necessary to assess for stenoses of the transverse-sigmoid venous sinuses.[29] [Fig. 17]
Figure 17.

Idiopathic intracranial hypertension. Coronal STIR (a) shows prominence of the peri-optic nerve sheath subarachnoid spaces with increased craniocaudal tortuosity on volumetric highly T2-weighted (proprietary sequence name – FIESTA) images (b). Axial FIESTA (c) shows posterior scleral flattening of the globes with bulging of the optic nerve heads (arrowheads) – the MRI equivalent of papilledema. Sagittal cranial T2 (d) shows bulged out partially empty sella (arrow). MR venography (e) shows severe stenosis at the junctions of the transverse-sigmoid sinuses bilaterally (arrows)
The retrobulbar space consists predominantly of the orbital fat through which the cranial nerves and vessels pass from within the annulus of Zinn at the orbital apex [Fig. 18 and Table 4]. The superior and inferior ophthalmic veins span both the extraconal and intraconal spaces. The structure of origin of lesions that arise within this space can be deduced from their relationship to the adjacent structures. We will discuss a few salient lesions arising in retrobulbar space, while the rest will be discussed in the section on the extraconal compartment.
Figure 18.
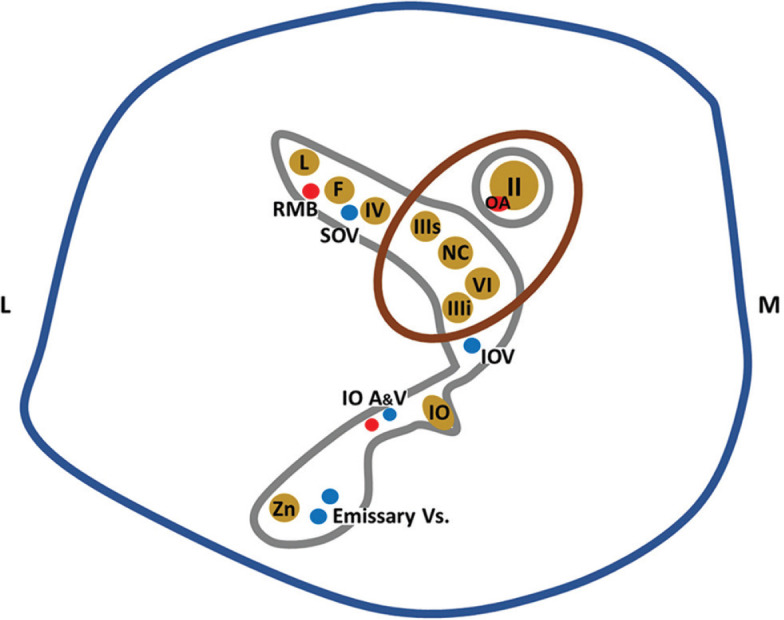
Anatomy of the orbital apex. Structures contained within the retroorbital space pass through the annulus of Zinn. II, III, IV, V, and VI – cranial nerves. IIIs – Superior division, and IIIi – Inferior division. Trigeminal nerve phthalmic division (V1) branches: NC – Nasociliary nerve, L – Lacrimal nerve, F – Frontal nerve; Maxillary division (V2) branches: IO – Inferior orbital nerve, Zn – Zygomatic nerve. Vasculature: OA – Ophthalmic artery, SOV – Superior ophthalmic vein, IOA and V – Inferior ophthalmic artery and vein, RMB – Recurrent meningeal branch of ophthalmic artery. Directions: M – Medial, L – Lateral
Table 4.
Intraconal retrobulbar lesions (excluding optic nerve sheath complex)
| Etiology | Entity |
|---|---|
| Inflammatory | IOI/NSOID |
| IgG4-related disease | |
| Infective | Orbital abscess |
| HZV | |
| Neurogenic | Schwannoma |
| Neurofibroma | |
| Lymphoproliferative | Malignant |
| Lymphoma | |
| Benign | |
| Reactive lymphoid hyperplasia | |
| Non-LCH disorders: | |
| Erdheim–Chester disease | |
| Rosai Dorfman disease | |
| Miscellaneous | Hemangiopericytomas and Solitary fibrous tumors |
| Metastases | |
| Primary orbital melanoma | |
| Granular cell tumor | |
| Vasculogenic lesions | High-flow lesions |
| Orbital AVM | |
| Low flow lesions | |
| Venolymphatic malformations (lymphangiomas) | |
| Venous varix | |
| Vasculoproliferative lesion | |
| Cavernous hemangioma | |
| Venous lesions | |
| Venous dilatation (Carotid cavernous fistula) | |
| SOV Thrombosis±CS Thrombosis |
The most common vasculoproliferative lesion is the cavernous hemangioma (or cavernous malformation). This is a slowly growing lesion presenting in middle-aged patients and consists of dilated cavernous spaces with interspersed septae and fibrous pseudocapsule. It is commonly lateral intraconal in location. It appears as a well-circumscribed lesion that displaces or surrounds adjacent structures and may cause osseous remodeling (better seen on CT). It is T1 isointense and homogenously T2 hyperintense, sometimes with the septae visible as linear hypointense bands within the lesion. Cavernous malformations have a characteristic pattern of enhancement due to their poor arterial vascularity: they show peripheral enhancement on arterial phase images with progressive centripetal fill in on delayed venous phases and may take even longer to show complete filling. This is demonstrated either on dynamic T1 contrast images or in successive postcontrast T1 sequences. These lesions rarely show calcifications, phleboliths, or hemorrhagic areas [Fig. 19].[16]
Figure 19.

Cavernous hemangioma. Coronal T1 (a) and axial T2 (b) and axial STIR show a T1 isointense, T2 hyperintense intraconal mass lesion with no perilesional edema (i.e., fat stranding) on axial T2FS (c). Sequential T1 images during contrast injection (i.e., dynamic contrast sequences – c and d) shows progressive centrifugal enhancement with complete lesional enhancement on delayed images (e). Subtle septae (seen as linear hypointensities) are visible on both the T2FS (b) and postcontrast T1FS images (f)
Orbital solitary fibrous tumors (SFTs) are neoplastic lesions that originate from vascular pericytes. In the recent World Health Organization classification of CNS tumors, hemangiopericytomas are no longer a separate entity and have been combined with SFTs due to identical immunohistochemical profiles.[30] Primary origin within the orbit is rare, where they usually occur within the intraconal space. When arising from the paranasal sinuses, secondary extension into the extraconal spaces may also be present. Low-grade lesions tend to be well defined and lobulated, while aggressive lesions have infiltrative borders with bony erosion. They are isointense on both T1 and T2, differentiating them from most other (usually T2 hyperintense) lesions and show marked arterial phase enhancement with progressive washout on delayed phases in contradistinction to cavernous hemangiomas. Calcification is rare.
Orbital venous varices present with a classical history of intermittent proptosis accentuated by bending forward or Valsalva manoeuvres. They may also be symptomatic, secondary to acute thrombosis. MRI performed in the usual supine position may be negative. Valsalva may be difficult for the patient to maintain throughout the longer scan times of MRI; hence, a prone position scan is best suited for demonstration of the varix. The varix appears as a well-defined lesion of variable shape (usually conical) with a homogenously T2 hyperintense and T1 hypointense signal intensity [Fig. 20]. Thrombosis gives it a more heterogeneous appearance with blooming on SWI.[16]
Figure 20.

Orbital venous varix. Axial STIR (a) and T2 (c) images show a small STIR hyperintense, T2 iso-to-hypointense lesion near the orbital apex. Repeat sequences (b and d) with the patient performing the Valsalva manoeuvre show expansion of the lesion. The lesion appears T1 hypointense (e) and can be seen within both the intra- and extraconal compartments on coronal STIR (f)
Orbital arteriovenous malformations (AVMs) are recognizable by the presence of flow voids representing the AVM nidus. They are usually fed by the ophthalmic artery which is best depicted by MR angiography (MRA). The dilated ophthalmic veins are also well demonstrated by this technique and any thrombosis is well seen as blooming on susceptibility-weighted sequences [Fig. 21]. Carotid cavernous fistulae are characterized by obvious dilatation of the ophthalmic veins that appear as prominent flow voids. Associated enlargement of the cavernous sinus is also seen as similar parasellar flow voids or exaggerated postcontrast enhancement [Fig. 22].[16]
Figure 21.

Orbital AVM with SOV thrombosis. Axial T2 (a) shows left-sided proptosis with heterogeneous appearing lesion predominantly within the intraconal space. Few small flow voids are seen as linear T2 hypointense structures within the lesion. Axial TOF-MRA images (b) confirm flow signal within the flow voids consistent with abnormal vascular nidus. More superior T2 sections (c) show more T2 hypointense lesion with susceptibility effects on SWI (d) consistent with thrombus. Coronal T2 (e) and sagittal postcontrast T1FS (f) shows this thrombus within the enlarged superior ophthalmic vein with the thrombosed area appearing nonenhancing. Arterial phase ipsilateral internal carotid angiograms (lateral views) show the nidus of the AVM (arrows in g and h) with arterial phase opacification of the SOV consistent with shunting
Figure 22.

Carotid-cavernous fistula. Axial T1 (a) shows a prominent superior ophthalmic vein (SOV, arrow in a). Coronal T2 (b) and T2FS (c) show intraconal course of the dilated SOV (arrows in b, c) with enlargement and hyperintense edema of the extraocular muscles on coronal T2FS (c). Post-contrast T1FS image (d) shows a prominent enhancing right cavernous sinus. Early (e) and later phases (f) of digital subtraction angiograms of the ipsilateral carotid artery shows abnormal early opacification of the cavernous sinus (arrow in e) with anterior drainage into the SOV (arrow in f)
Orbital apex and cavernous sinus lesions
The orbital apex disorders present in three syndromic variants: orbital apex syndrome (OAS), superior orbital fissure syndrome (SOFS), and cavernous sinus syndrome (CSS). OAS consists of visual impairment due to ON involvement along with III, IV, VI, and V1 cranial nerve involvement. SOFS presents similar to OAS but without the ON involvement. CSS has additional involvement of the V2 nerve and sympathetic system (Horner’s syndrome). Due to close relationship of these anatomical areas, they share many common pathologies and one syndrome can evolve into other as the disease progresses.[31] We will primarily deal with neoplastic, inflammatory/infectious, and vascular lesions that most commonly affect these regions [Table 5].
Table 5.
Orbital apex and cavernous sinus lesions
| Etiology | Entity |
|---|---|
| Neoplastic | Primary |
| Meningioma | |
| Nerve sheath tumors | |
| Hemangioma | |
| Epidermoid and dermoid cysts | |
| Secondary | |
| Direct spread | |
| Pituitary adenoma | |
| Craniopharyngioma | |
| Juvenile nasopharyngeal angiofibroma | |
| Skull base tumors | |
| Hematogeneous spread | |
| Lung, breast, renal | |
| Perineural spread | |
| Adenoid cystic carcinoma | |
| Nasopharyngeal carcinoma | |
| Lymphoma | |
| Vascular | Carotid-cavernous fistula |
| ICA aneurysm | |
| Thrombosis | |
| Infections | Thrombophlebitis |
| Fungal - mucor, aspergillus | |
| Herpes zoster | |
| Inflammatory | Granulomatosis with polyangiitis (Wegener’s) |
| Sarcoidosis | |
| IOI/NSOID Tolosa Hunt syndrome |
Several inflammatory disorders such as IOI, sarcoidosis, and granulomatosis with angiitis (Wegener’s granulomatosis) can involve the orbital apex. IOI (or nonspecific orbital inflammatory disease – NSOID) is a diagnosis of exclusion that manifests with many variants. Based on location, it may be classified as myositic, perineural, lacrimal, orbital apex, and diffuse forms. Orbital apex involvement may be seen as Tolosa–Hunt syndrome or as a sclerosing form with chronic progressive fibrosis [Fig. 23]. These are characterized by abnormal inflammatory soft tissue that variably involves the orbital apex, extends through the optic canal or superior orbital fissure to involve the cavernous sinus and sometimes even involving the tentorial margins. Contrast-enhanced MRI (CEMRI) is the modality of choice with the soft tissue commonly appearing T2 hypointense (although variable), T1 iso-to-hypointense showing homogeneous postcontrast enhancement. A high index of clinical suspicion is necessary to detect asymmetric appearance of the cavernous sinus or orbital apex in subtle cases.[32]
Figure 23.

Orbital apex inflammatory mass (Tolosa Hunt syndrome). Presentation with painful ocular motor palsy. Axial T2 (a) shows subtle asymmetry of the paracavernous-paraclinoid outline with T2 hypointense lesion seen (arrows). This is better delineated on the volumetric highly T2-weighted sequence (FIESTA, b) and coronal STIR images (c). The lesion is T1 isointense (d) with moderate homogeneous postcontrast enhancement on T1FS (e and f)
IgG4 related disease (IgG4 RD) is another specific inflammatory disorder of unknown etiology that is characterized by lymphoplasmacytic cellular inflammatory infiltration and elevated serum IgG4 levels. It is usually a multisystem disorder but when isolated to the orbit can be impossible to distinguish on imaging, but commonly involves the lateral/superior quadrants of the orbit.[32] Herpes zoster ophthalmicus presents with vesicular eruptions and ocular motor palsies. MRI may reveal features of orbital inflammation [Fig. 24] with short-tau inversion recovery (STIR) hyperintense fat edema, myositis with enlarged EOMs, and avid enhancement (may even precede other findings) as well as optic perineuritis.[33,34] Globe involvement such as anterior uveitis and endophthalmitis may also be recognized on MRI. Other ocular motor nerves may also show abnormal enhancement extending into their intracranial courses. Cranial imaging is useful to assess additional features of aseptic meningitis or vasculopathy.[35] Orbital sarcoidosis is more likely to spread along the ON, while NSOID spreads along the SOF. Sarcoidosis is more commonly associated with scleritis and tends to involve the anteroinferior quadrant.[32] However, imaging features are nonspecific and indistinguishable from other entities. More sinister differentials such as lymphoma, perineural spread of malignancy (nasopharyngeal carcinoma), or chronic fungal infections can mimic this appearance [Fig. 25].[31] The presence of strong diffusion restriction can suggest lymphoma. Ga-67 and PET may be of additional value.[36]
Figure 24.
Herpes Zoster Ophthalmicus. Patient presented with vesicular eruptions in the distribution of the V1 nerve. Axial T2 (a) shows left-sided ethmoid sinusitis (likely inflammatory rather than infective) and proptosis with no obvious mass lesions or collections. Axial (b) and coronal STIR (c) better demonstrate the fat stranding (STIR hyperintense edematous changes) in the preseptal region and periocular regions as well as of the EOMs along the medial aspect of the orbit
Figure 25.

Orbital apex syndrome secondary to paranasal sinusitis. Patient with restricted eye movements on the right side. Axial STIR (a) shows right-sided frontoethmoid sinusitis. STIR hyperintense marrow edema is seen of the right anterior clinoid process on the coronal STIR (b) as well (arrows in both a and b). Subtle STIR hyperintense orbital fat edema is seen at the apex on coronal STIR (arrow in c). Post-contrast T1FS sequences (d-f) show abnormal enhancement of the infected paranasal sinuses, the orbital apex (arrows in d and f) and the anterior clinoid process consistent with osteomyelitis (arrow in e)
The most common neoplastic lesion that primarily originates from the cavernous sinus wall is meningioma.[37] It appears as a well-defined lesion that appears hypo-to-isointense on all sequences (due to their dense fibrous-cellular content) with intense postcontrast enhancement and a characteristic dural tail. Neoplasms that secondarily involve the cavernous sinus are best distinguished by their site of origin. Pituitary adenoma is characterized by a widened sella with suprasellar and parasellar extension. Bony lesions such as chondrosarcomas and chordomas are seen as areas of bony destruction with variable calcification, with chordomas being midline lesions (related to the spheno-occipital synchondrosis) while chondrosarcomas are off center (related to petroclival synchondrosis). Both lesions appear T2 hyperintense (chondrosarcoma characteristically so) with heterogeneous postcontrast enhancement.[37]
Conal pathology: Diseases of extraocular muscles
The EOMs form the muscular cone extending from the superior orbital fissure to the posterior aspect of the globe and enclose the retrobulbar intraconal space. Their signal intensity is the reference standard to assess the signal of other structures or lesions. However, they themselves are compared to the temporalis muscles and should be isointense to it on both T1 and T2. They normally show moderate homogeneous contrast enhancement of their bellies. Pathological involvement of the EOMs may result in focal or diffuse enlargement or atrophy, with or without accompanying signal abnormality.
Graves’ ophthalmopathy or Thyroid Eye Disease (TED) is the most common cause of proptosis in adults. It is most commonly bilateral with asymmetric involvement but may be unilateral in 5–15% of cases. Both CT and MRI show morphological findings of disproportionate fusiform enlargement of the EOMs (mid-belly thickness of >5 mm) with relative sparing of the tendinous globe attachments (Coke-bottle appearance).[31] The inferior, medial, superior, and lateral recti and superior oblique (mnemonic: IM-SLO) in order of frequency are most commonly affected. Isolated lateral rectus involvement should raise concern for an alternate diagnosis. MRI provides an added advantage of allowing differentiation of the acute inflammatory phase from the chronic phases. In the acute phase, the EOMs show STIR hyperintense edema [Fig. 26] which can be quantified as a ratio of signal intensity to the temporalis muscle for serial follow-up and monitoring.[38] This is of clinical significance since active disease is more likely to respond to treatment. EOM volumes also correlate with disease activity.[39]
Figure 26.

Thyroid eye disease-related myositis. Coronal T1 (a) shows enlargement of the EOMs most prominently of the medial recti. Sparing of the tendinous junctions are seen on axial T1 (b). Coronal (c) and axial (d) STIR images show hyperintense edematous changes of the muscles consistent with active disease
Orbital myositis, a subtype of IOI or NSOID, is the second most common cause of proptosis following Grave’s disease. Other associations of EOM myositis are IgG4 RD, vasculitis, sarcoidosis, and myriad connective tissue disorders. Unlike Grave’s, EOM myositis enlarges the muscle without sparing the tendinous insertion and more commonly involves the superior, lateral, and medial recti, with uncommon involvement of the inferior rectus.[40] A solitary EOM that is enlarged, usually shows STIR hyperintense edema with adjacent fat stranding and has increased contrast enhancement, is the most typical appearance [Fig. 27].[41] Prompt response to steroids is confirmatory with radiologic improvement lagging behind clinical improvement.
Figure 27.

IOI/NSOID myositis. The left-sided medial rectus appears enlarged with T2 hypointense signal intensity on coronal STIR (a). Axial T2 (b) shows involvement of the myotendinous junction. Mild adjacent hyperintense fat stranding (edematous changes) are seen on coronal STIR (c). Moderate homogeneous enhancement of the muscle is seen on postcontrast T1FS (e and f) as compared to precontrast T1FS (d). Also, note more subtle involvement of the adjacent left superior oblique with subtle STIR edema and exaggerated enhancement (arrows in c and f)
Infectious diseases, bacterial, fungal, viral, and parasitic can affect the EOMs. A high index of clinical suspicion is necessary. Abscesses usually occur with orbital cellulitis but can occasionally be isolated to the EOMs (by hematogeneous dissemination). They result in irregular focal or diffuse enlargement with T2 hyperintense edema of the EOM. Diffusion restriction delineates purulent contents within the abscess cavity, while irregular ring enhancement delineates the abscess wall on postcontrast images [Fig. 28].[41] Myocysticercosis results in a similar picture to myositis on MRI and commonly affects the superior rectus complex and lateral rectus. However, the characteristic appearance of the cysticercus as a fluid intensity cystic lesion with a hypointense mural nodule (the scolex) is best seen on highly T2-weighted volumetric sequences [Fig. 29]. The wall of the cysticercus usually shows postcontrast rim enhancement in the degenerative stages. Calcification of the scolex can also be detected as blooming on susceptibility weighted sequences.[42]
Figure 28.

EOM abscess. Axial T2 (a) shows focal enlargement of the right lateral rectus near the tendon insertion. A mixed T2 hypointense–hyperintense lesion is seen involving the muscle. ADC map (b) shows lesional hypointensity consistent with restricted diffusion. Postcontrast T1FS (c and e) shows thick rim enhancement around the lesion with central areas of nonenhancement consistent with necrotic foci as compared with the precontrast T1FS (d). Combination of diffusion restriction with nonenhancement in the same area is consistent with suppuration and abscess formation
Figure 29.

Two cases of EOM cysticercosis. In the first case (a), coronal T2 image shows multiple well-defined T2 hyperintense cystic appearing lesions scattered within the EOMS, brain, tongue as well as temporalis muscles with some showing a central hypointensity consistent with a scolex. Appearance is suggestive of the vesical (viable) stage of cysticercosis. In the second case (b-e), Coronal STIR (b) and axial T2 (c) show enlargement of the right lateral rectus with hypointense lesion within the belly. The lesion appears T1 hyperintense (d) with exaggerated enhancement of the muscle with relative internal nonenhancement of the lesion on postcontrast T1FS. Lesional T2 hypointensity with T1 hyperintensity is suggestive of high protein content with adjoining inflammatory enhancement is consistent with degenerated (nonviable) cysticercosis
Enlargement and STIR hyperintensity of the EOMs may also occur due to vascular congestion and engorgement secondary to vascular disorders such as caroticocavernous fistulae, AVMs, or cavernous sinus thrombosis [Fig. 22].[16]
Neoplastic lesions that involve the EOMs may be lymphoma (usually non-Hodgkin’s) and metastasis (EOMs being the second most common orbital site after the choroid). Lymphoma mimics myositis with focal or diffuse fusiform enlargement in an otherwise clinically painless eye. The involved EOM appears T1 and T2 hypointense (due to high cellularity) with diffusion restriction and moderate homogeneous contrast enhancement.[41] Lymphoma can also cause fusiform enlargement of the EOMs closely mimicking TED.[43] Diffusion restriction can help in differentiating the two. Metastasis commonly occur from cutaneous melanoma, breast cancer, and carcinoid tumors. They may result in a well-defined round or fusiform mass involving the EOM with variable signal intensity and contrast enhancement [Fig. 30].[40] While solitary lesions maybe difficult to differentiate from other masses, multiplicity is an indicator of metastasis. Secondary involvement of EOMs may also occur by direct invasion of the orbit by cancers of the nasopharynx, paranasal sinuses, or cranium.[44]
Figure 30.

EOM metastasis. Axial and coronal T2 (a and b) shows a well-defined T2 hyperintense lesion involving the anterior belly of the left medial rectus. DWI (c) shows lesional hyperintensity consistent with diffusion restriction. It is T1 isointense (d) and is relatively hypoenhancing as compared to the adjoining muscle on postcontrast T1FS (e). Postcontrast coronal brain T1FS (f) shows multiple similar enhancing lesions scattered throughout consistent with metastases. Evaluation revealed bronchogenic carcinoma. In this case, diffusion restriction with concomitant enhancement denotes a hypercellular lesion
Atrophy of the EOMs can occur as a result of cranial neuropathies, and mitochondrial disorders such as chronic progressive external ophthalmoplegia (CPEO). CPEO results in only a mild to moderate atrophy, disproportionate to the usual severe clinical symptoms. The atrophied muscles also show a characteristic T1 hyperintensity within them (fatty degeneration).[45] Neurogenic paralysis results in a more profound atrophy corresponding to the nerve distribution. The signal intensity of the muscles remain normal.[45] A survey of the intracranial course of the ocular motor nerves, including the cavernous sinuses, is necessary, particularly on the postcontrast T1 images.[46]
Extraconal Pathology
Extraconal lesions may be subclassified based on pathology [Table 6] and may be localized to either the osteodural complex or the extraconal space proper.
Table 6.
Extraconal Lesions
| Etiology | Entity |
|---|---|
| Vasculogenic lesions | Vasculoproliferative lesion |
| Infantile capillary hemangioma | |
| Low flow lesions | |
| Venolymphatic malformations and lymphangiomas | |
| Congenital | Dermoid |
| Epidermoid | |
| Neurogenic (nerve sheath) | Schwannoma |
| Neurofibroma | |
| Mesenchymal | Rhabdomyosarcoma |
| Infantile fibromatosis | |
| Lymphoproliferative | Lymphoma |
| Osseous | Ewing’s sarcoma |
| Fibrous dysplasia | |
| Infective | Subperiosteal abscess |
Intradural and extradural including subperiosteal, bony, and paraorbital lesions
Orbital dermoids and epidermoids are choristomatous cystic lesions that result from congenital epithelial inclusions. They are commonly located in the anterior extraconal compartment adjoining a bony suture, usually in the superolateral or superonasal quadrants. Dermoid cysts may contain areas of fat signal intensity (T1 and T2 hyperintense with suppression of fat-sat sequences). In contrast, epidermoid cysts show fluid signal intensity (similar to vitreous humor) and characteristically demonstrate hyperintense signal on diffusion-weighted images due to the accretion of keratin debris [Fig. 31].[47] Both lesions show faint postcontrast rim enhancement. Wall calcification is more commonly seen in dermoids. Lesions are well defined (encapsulated) and may cause bony remodeling or extend through a bony canal, giving them a dumbbell shape. Irregular margins with perilesional edema and enhancement suggest rupture with inflammation. CT is usually adequate, but MRI is superior for complex lesions with deep intraorbital extension [Fig. 32]. Posttraumatic hemorrhagic cysts are a differential for T1 hyperintense cystic appearing lesions due to the presence of subacute blood products [Fig. 33].[48]
Figure 31.

Intraosseous epidermoid cyst. Coronal T2 (a) shows a well-defined T2 hyperintense lesion arising from the bony lateral orbital wall and extending into the extraconal compartment. The lesion remains hyperintense on axial STIR (b) and is hypointense on T1 (c) with rim enhancement on postcontrast T1FS (d and e). DWI (f) and ADC maps (g) show diffusion hyperintensity with corresponding hypointensity on ADC consistent with diffusion restriction. Thus, this lesion follows fluid signal intensity on all sequences with the exception of diffusion restriction – characteristic for epidermoid
Figure 32.

Dermoid mimicked by lacrimal gland teratoma. On initial CT (a), well-defined fat density lesion is seen in superolateral quadrant of the left orbit. This was initially thought to be a dermoid; however, MRI was done for suspicion of lacrimal gland involvement. Axial T1 (b) and coronal T2 (c) show the lesion to be T1 and T2 hyperintense and lying within the lacrimal gland. On coronal T2FS (STIR) images (d), loss of T2 hyperintensity (i.e., suppression of signal) is consistent with lipid content – classical for dermoid. Histopathology revealed a teratoma. Teratomas may have identical imaging appearance with additional features such as a calcified Rokitansky protuberance (not present in this case)
Figure 33.

Hematic cyst. Patient with history of trauma and swelling over the left eye. Coronal STIR (a) and axial T2 (b) show a relatively well-defined cystic appearing lesion with central T2 hyperintensity and T2 hypointense rim in the subcutaneous plane along the superolateral aspect of the left orbit. Axial T1 (c) shows central T1 hyperintense contents with no suppression of signal with fat saturation on T1FS (d) consistent with subacute hemorrhagic blood products rather than lipid content (as expected in differentials like dermoid)
Many bony lesions may affect the orbital walls. Small blue round cell tumors such as Ewing’s sarcoma appear hyperdense on CT and characterized by diffusion restriction, heterogeneous T1 and T2 signal intensity with intense postcontrast enhancement, and necrotic or hemorrhagic areas [Fig. 34].[49] Fibrous dysplasia appears as diploic space widening with a variable signal intensity depending on the degree of sclerosis. The involved bone appears heterogeneous, usually T1 isointense, and T2 hypointense (sometimes with foci of T2 hyperintensity) with heterogeneous contrast enhancement.[50] CT is essential in demonstrating the ground-glass appearance of the expanded diploic space with sparing of the inner table (in contradistinction to Paget’s disease). MR is superior in assessing marrow involvement and neurovascular impingement.
Figure 34.

Ewing’s sarcoma. Coronal (a) and axial T2 (b) show a relatively well-defined lesion involving the bony roof and lateral wall of the left orbit with associated proptosis. Extension on both sides of the bone is seen with an intraorbital extraconal components along the anterior and middle cranial fossae (arrowheads in a and b). The lesion is T1 hypointense (c). Axial DWI (d) shows diffusion hyperintensity of intraorbital components (*) consistent with hypercellularity. The intracranial component (*) shows relative hypointensity (i.e., diffusion facilitation) suggesting a less cellular component. Postcontrast T1FS (e) shows moderate heterogeneous enhancement of the cellular areas with areas of nonenhancement of the hypocellular intracranial component consistent with necrosis. Perfusion map (f) shows hyperperfusion (red areas) of the tumor. CT (g) shows a spiculated periosteal reaction consistent with primary bony origin. Surgical biopsy yielded Ewing’s sarcoma
Subperiosteal abscesses are lentiform shaped, usually along the medial orbital wall and secondary to associated paranasal sinusitis. The phlegmonous stage appears more solid with T1 and T2 hyperintense signal and homogeneous contrast enhancement than mature abscesses that demonstrate fluid signal intensity with peripheral rim enhancement [Fig. 35].[51] Pus characteristically shows diffusion restriction. Perilesional fat stranding and EOM edema are usually apparent as a hazy hyperintense signal on STIR sequences. Subperiosteal hemorrhage can mimic the appearance of abscesses, particularly when a history of trauma is not evident. In the acute phase, they are best differentiated by hyperdensity on CT, while chronic hematomas show T1 and T2 hypointense signal with a fibrous rim on MRI.[52] Paranasal sinus mucoceles recognizably result in the expansion of the involved sinus and are completely fluid-filled, showing fluid signal intensity on MRI (T1 hypointense and T2 hyperintense). With increasing desiccation, relative increased protein content of the fluid appears T1 hyperintense with variable T2 hypointensity [Fig. 36].[53] The presence of air within such a lesion rules out mucocele and should raise suspicion of superimposed infection. Bony involvement is best delineated on CT, while MRI better delineates impingement on orbital structures.
Figure 35.

Orbital cellulitis with subperiosteal abscess. Axial CT (a) and STIR MRI (b) show features of ethmoid and sphenoid sinusitis. STIR heterogeneous fat stranding and abnormal enhancement is seen of the left orbital apex on STIR and postcontrast T1FS (arrowhead in b and c) consistent with orbital inflammation. Coronal STIR (d) and postcontrast T1FS (e) show a subperiosteal abscess with a T2 hypointense enhancing wall and central T2 hyperintense nonenhancing cavity (arrowheads in d and e) along the ethmoid roof
Figure 36.

Frontal sinus mucocoele. Coronal STIR (a) shows a well-defined expansile lesion involving the bony roof of the right orbit with hypointense walls and homogeneous T2 hyperintense contents. These contents are T1 hyperintense (b) suggestive of high-protein content. CT (not shown) confirmed expansion of the right compartment of the frontal sinus consistent with mucocoele
Extraconal proper
Orbital lymphoproliferative diseases (OPLDs) comprise a wide spectrum of lesions from malignant to benign. Malignant lymphomas are the most common primary orbital malignancy in adults (55% of cases) and usually primary low-grade B cell non-Hodgkin’s lymphomas.[54] Benign OLPDs present as a spectrum of noninfectious chronic inflammatory diseases (including atypical and benign reactive lymphoid hyperplasia). Differentiating these lesions has obvious therapeutic implications since the former requires radiotherapy and the latter responds to steroid therapy. On conventional MRI, both the benign and malignant OPLDs have similar imaging findings with T1 and T2 isointensity, restricted diffusion, and homogeneous contrast enhancement [Fig. 37]. However, orbital lymphomas tend to be more ill-defined than benign OPLDs, which have more well-defined lobulated margins.[55] Quantitative MR techniques may aid in the differentiation of benign and malignant OPLDs. Malignant OPLDs show higher diffusion restriction (lower apparent diffusion coefficient (ADC) values), reflecting increased cellular density than benign OPLDs, showing increased interstitial fluid content. Malignant OPLDs tend to be hypoenhancing (assessed by contrast enhancement ratio of signal intensity to the temporalis muscle) compared to benign OPLDs, owing to increased vascularity and abundant fibrotic component in benign OPLDs. Hypervascularity of benign OPLDs also leads to the “flow-void sign” on T2.[55] Advanced imaging techniques such as T1 dynamic contrast enhancement can also allow differentiation between the two types of OPLDs.[56]
Figure 37.

Orbital Lymphoma. Axial (a) and coronal T2 (b) and T1 (c) show an irregular T1 and T2 hypointense mass involving the superior aspect of the left orbit with both extraconal and intraconal compartments. The lesion shows diffusion hyperintensity (d) and corresponding ADC hypointensity (e) with moderate homogenous postcontrast enhancement (f) consistent with hypercellularity – all features classical for lymphoma
Rhabdomyosarcoma (RMS), a mesenchymal tumor, is the most common extraocular malignancy in childhood. Orbital RMS represents up to 25% of head and neck RMS and has a better prognosis due to early clinical presentation. It occurs most commonly in the extraconal compartment, either in the superonasal or superior quadrants. When small, it may appear well circumscribed, but larger lesions appear infiltrative and encase (not invade) adjacent soft tissue structures or the globe (which is distorted but intact). Bone destruction is seen in up to 40% of cases and best demonstrated on CT. The paranasal sinuses may also be invaded. It usually appears homogeneous, although areas of necrosis or hemorrhage may lead to heterogeneity. Calcification is rare and is usually secondary to adjacent bone destruction. The lesion appears T1 isointense (hyperintense areas may represent hemorrhage), heterogeneously T2 hyperintense with moderate to intense contrast enhancement [Fig. 38].[51,57] Necrotic areas are nonenhancing with the surrounding enhancing viable tissue giving a ring enhancement pattern. MRI is superior to CT in delineating dural involvement and intracranial extension. Paranasal sinus invasion is best differentiated from trapped secretions by comparing pre- and postcontrast T1 images. These appearances may be mimicked by a ruptured dermoid cyst with inflammatory changes (look for T1 hyperintense fat components), neuroblastoma metastases, or Langerhans cell histiocytosis (bony involvement more prominent).
Figure 38.

Rhabdomyosarcoma. Sagittal T2 (a) and axial STIR (b) show an ill-defined T2 hypointense mass involving the extraconal compartment of the right orbit superiorly. The lesion is T1 isointense (c) and shows ADC hypointensity (d) with moderate homogenous contrast enhancement (e) consistent with a hypercellular lesion. This was a histopathologically proven case of orbital rhabdomyosarcoma in this pediatric patient
Langerhans cell histiocytosis (LCH) is a multisystem disorder that most commonly involves the skeleton, particularly the skull and ribs. Single-lesion LCH is referred to as eosinophilic granuloma and appears as a punched-out lytic lesion with cortical and medullary bone destruction. On MRI, the soft tissue component demonstrates T1 hypointense, T2, and STIR hyperintense signal with diffuse postcontrast enhancement [Fig. 39].[51] Erdheim Chester disease is a non-LCH entity occurring in a similar age group as OPLDs, but with a male predominance. They are indistinguishable from OPLDs on imaging and often present as bilateral or unilateral intraconal masses. The presence of bony involvement (sclerosis), intracranial dural masses, or pachymeningitis are clues to the diagnosis.[58] Rosai Dorfman disease, another non-LCH entity, more commonly presents as an extraconal mass and is associated with massive lymphadenopathy in children and young adults.
Figure 39.

Eosinophilic granuloma. Coronal STIR (a), axial T2 (b), and axial T1 (c) show an expansile T2 hyperintense and T1 hypointense mass lesion arising from the lateral bony orbital wall on the right side with loss of hypointense cortical bone outlines. The lesion itself shows heterogeneous postcontrast enhancement along with ill-defined extension into the orbit as well as temporal fossa (d). Concomitant bone CT (e) shows a punched-out lesion involving the right zygomatic bone, classical for eosinophilic granuloma
Peripheral nerve sheath tumors consist of schwannomas and neurofibromas. Schwannomas mostly arise from the trigeminal nerve branches (commonly the frontal branch) and are commonly extraconal (superior quadrant) in location. The III–VI cranial nerves may also be involved. Discerning the nerve of origin of intraconal lesions is best done on coronal images by following them up to the orbital apex. They are well-encapsulated tumors that grow at the periphery of the affected nerves. Two distinct patterns may coexist within the same tumor at a microscopic level: Antoni A, consisting of densely packed spindle cells, and Antoni B, consisting of loosely packed stellate cells in a mucoid stroma. No consistent MR appearance can be attributed to such histopathologically delineated areas. However, regardless of cell type, central fibro collagenous components appear T2 hypointense while the peripheral myxoid components appear T2 hyperintense, often giving these lesions a target appearance [Fig. 40].[26,59]
Figure 40.

Oculomotor nerve schwannoma in neurofibromatosis type 2. Coronal STIR (a) and axial T2 (b) show a large well-defined lesion involving the intraconal and extraconal compartments of the left orbit with the optic nerve seen separately and displaced superiorly (arrowhead in a). Note extension along the cavernous course of the III nerve (arrow in b). The lesion appears heterogeneous with T2 hyperintense periphery and hypointense centrally (corresponding myxomatous and fibrocollagenous areas, respectively) giving it a target appearance. SWI (c) shows foci of hemorrhage (arrowheads). The lesion is heterogeneously T1 isointense (d) and shows intense enhancement (compare with EOMs) (e). Postcontrast T1FS of posterior fossa (f) shows bilateral enhancing acoustic schwannomas with mass effect. Note incidental optic nerve head bulging of papilledema in (arrowhead in b) secondary to obstructive hydrocephalus (not shown) caused by IV ventricular compression
Neurofibromas may demonstrate localized, diffuse (solitary), or plexiform growth patterns, with the latter being most common and pathognomonic for neurofibromatosis type 1. Similar to schwannomas, they are more commonly extraconal, arising from the trigeminal nerve branches. Differentiating the solitary subtypes from schwannomas may be of little surgical relevance but is useful when contemplating conservative management as neurofibromas have an increased risk of malignant transformation. The lack of a capsule makes solitary subtypes appear relatively less well defined, and they appear heterogeneous on both T1 and T2 with heterogeneous contrast enhancement. The presence of cystic/mucinous components favors schwannoma over neurofibroma. Plexiform neurofibromas have a heterogenous bag of worms appearance with more extensive interspatial spread, similar to lymphangiomas. The presence of fluid–fluid levels favors lymphangiomas. Malignant transformation of neurofibromas may be indicated by the presence of pain, rapid interval growth compared to prior imaging, and the presence of soft tissue or bony destruction.[15,26]
Capillary (infantile) hemangiomas are the most common tumors of infancy. They enter a proliferative phase with enlargement in the first year, followed by an involutional phase that may last 7–10 years. These are most commonly seen in the preseptal region but may occasionally extend into the extraconal compartment. When large, the lesion may cause bony remodeling with orbital expansion. They usually demonstrate T1 hypointense and T2 hyperintense signal with intervening fibrous septa, appearing as interspersed T2 hypointense bands and multiple serpiginous flow voids reflecting increased vascularity [Fig. 41]. It shows intense postcontrast enhancement. In the involutional phase, fatty replacement occurs with an increase in T1 hyperintense, nonenhancing components of the lesion.[16] Screening of the brain is also useful since these lesions may be a part of the PHACES syndrome.
Figure 41.

Capillary hemangioma. Clinical picture (a) showing bright red elevated plaques characteristic for periocular superficial capillary hemangioma. Axial STIR (b) shows orbital extension into the preseptal and extraconal compartments as well as involvement of the temporal fossa (*). The lesion appears heterogeneously T2 hyperintense with the classical intralesional hypointense flow voids well visualized
Venolymphatic malformations may be superficial or deep. When deep and small, they are commonly extraconal in location but can become multispatial when larger. They are characterized by cystic (lymphangiomatous) spaces and variable, more solid appearing (venous) components. The cystic spaces may contain hemorrhages of varying ages which produce fluid–fluid levels [Fig. 42]. They appear T2 hyperintense with acute blood showing T2 hypointense and subacute blood products demonstrating characteristic T1 hyperintense signal. Solid components rarely show the presence of phleboliths. The cystic components may show rim enhancement, while the venous components show more homogeneous enhancement. Perilesional fat stranding may be present in acute presentation.[16]
Figure 42.

Venolymphatic malformation. Axial T1 (a) shows irregular T1 hypointense lesion involving the right orbit intraconal compartment causing proptosis. Axial STIR (b) better delineates the lesion with multiple septae, fluid–fluid levels (secondary to hemorrhage), and a hypointense focus (arrowhead), which likely represents a focal calcification (phlebolith)
Orbital metastases are relatively uncommon, accounting for up to 13% of all orbital mass lesions. The most common primary sites include breast, prostate, lung, and melanoma. While most lesions present with proptosis, scirrhous carcinomas of the breast and gastrointestinal tract cause paradoxical enophthalmos due to fibrosis and fat retraction. Though globe and EOMs are the more common sites of metastatic involvement, they can also involve the orbital fat. The morphology and appearance of orbital metastases depend on the primary tumor and may range from solid homogeneous lesions to mixed solid-cystic lesions or almost completely cystic. Most lesions are likely to appear T1 hypointense and T2 hyperintense with variable enhancement patterns and perilesional edema.[36]
Lacrimal gland lesions
The normal lacrimal gland appears isointense to muscle on T1 and T2 and shows moderate homogeneous contrast enhancement. Lacrimal gland masses account for 10% of all orbital tumors.[60] Most tumors occur in the deeper orbital lobe rather than the anterior palpebral lobe. Half the tumors are of epithelial origin, while the rest include lesions such as lymphoma, inflammatory lesions including dacryoadenitis and pseudotumors, rare lesions encompassing teratomas, and dermoid cysts from embryonic rests, metastases, and epithelial cysts from dilatation of the lacrimal duct.[61]
Of the epithelial tumors, half are benign pleomorphic adenomas. Of the malignant tumors, adenoid cystic carcinomas are the most common, followed by carcinoma ex pleomorphic adenoma, mucoepidermoid ca, adenocarcinoma, squamous cell ca, and undifferentiated carcinomas.
Both benign and malignant neoplastic lesions can be highly cellular and appear homogeneously T1 hypointense and T2 intermediate to hyperintense with moderate homogenous contrast enhancement. When less cellular, they become more heterogeneous due to the presence of mesenchymal stroma, cystic degeneration, necrosis, or serous or mucous collections that appear as focal interspersed hypoenhancing/nonenhancing areas of T2 hyperintensity and T1 hypointensity. Benign tumors are usually well defined, molded by the orbital wall but can be mimicked by malignant lesions [Fig. 43]. However, malignant lesions are differentiated more readily by early bone or perineural invasion [Fig. 44]. Malignant lesions also tend to have a higher degree of diffusion restriction than benign tumors.[62] Lymphomas have a characteristically homogeneous appearance with uniform enlargement of the gland, showing moderate homogeneous contrast enhancement and higher restricted diffusion [Fig. 45].[61]
Figure 43.

Pleomorphic adenoma of lacrimal gland. Axial STIR (a) shows a well-defined heterogeneous appearing lesion within the left lacrimal gland that is predominantly T2 hypointense with few internal hyperintense foci. A more T2 hypointense capsule is also evident. The lesion is T1 isointense (c) with moderate heterogeneous enhancement on postcontrast T1FS (b and d). Nonenhancing T2 hyperintense foci represent areas of cystic change or necrosis. The lesion is modelled by bone rather than causing erosions or destruction suggesting a benign lesion
Figure 44.

Lacrimal gland adenocystic carcinoma. Axial STIR (a) shows a heterogeneously T2 hyperintense lesion replacing the lacrimal gland with bony involvement and extraorbital extension. Axial T1 (b) shows the lesion to be T1 hypointense with bony destruction more apparent by loss of hypointense cortical bone. The lesion shows intense enhancement on postcontrast T1FS (c). Bony CT (d) shows destruction of the lateral orbital wall by the lesion – a feature of an aggressive malignant lesion
Figure 45.

Lacrimal gland lymphoma. Coronal STIR (a) and axial T2 (b) show a T2 hypointense lesion completely replacing the left lacrimal gland without bony destruction. The lesion appears homogeneous with ADC hypointensity (c), mild T1 hyperintensity (d), and intense contrast enhancement (e) consistent with a hypercellular tumor. Biopsy confirmed lymphoma
Dacryoadenitis, when acute, is usually unilateral, which shows avid contrast enhancement with prominent adjacent orbital fat stranding, fluid collections, or abnormal uveoscleral enhancement. Associated lateral rectus myositis may be present. Chronic dacryoadenitis, secondary to inflammatory conditions such as sarcoidosis or thyroid ophthalmopathy, is usually bilateral. Inflammatory pseudotumor (IOI) involving lacrimal glands appears T1 iso-to-hypointense and T2 hypointense with variable contrast enhancement due to dense lymphoid infiltrate and varying degree of fibrosis.[61]
Conclusion
MRI is superior to other imaging modalities for lesion characterization, delineation of the anatomical extent, and presents additional advantages, including comprehensive screening of the rest of the neuraxis and repeatability given the lack of ionizing radiation. This allows the ophthalmologist to make a better-informed decision regarding further management and facilitates effective preoperative planning and appropriate management. We hope that this review allows the ophthalmologist to better utilize this elegant modality better and, in turn, promote better patient care with improved outcomes.
Financial support and sponsorship
Nil.
Conflicts of interest
There are no conflicts of interest.
Acknowledgement
Dr Elif B Turkoglu, Associate Professor, Ocular Oncology, Akdeniz University, Antalya, turkey.
References
- 1.Baert AL, Sartor K. Berlin Heidelberg: Springer-Verlag; 2006. Imaging of Orbital and Visual Pathway Pathology. [Google Scholar]
- 2.Gala F. Magnetic resonance imaging of optic nerve. Indian J Radiol Imaging. 2015;25:421–38. doi: 10.4103/0971-3026.169462. [DOI] [PMC free article] [PubMed] [Google Scholar]
- 3.Ellika S, Robson CD, Heidary G, Paldino MJ. Morning glory disc anomaly:Characteristic MR imaging findings. AJNR Am J Neuroradiol. 2013;34:2010–4. doi: 10.3174/ajnr.A3542. [DOI] [PMC free article] [PubMed] [Google Scholar]
- 4.Li CD, Meltzer DE. Case 206:Persistent hypertrophic primary vitreous. Radiology. 2014;271:921–5. doi: 10.1148/radiol.14110856. [DOI] [PubMed] [Google Scholar]
- 5.Hallinan JT, Pillay P, Koh LH, Goh KY, Yu WY. Eye globe abnormalities on MR and CT in adults:An anatomical approach. Korean J Radiol. 2016;17:664–73. doi: 10.3348/kjr.2016.17.5.664. [DOI] [PMC free article] [PubMed] [Google Scholar]
- 6.De La Hoz Polo M, Torramilans Lluis A, Pozuelo Segura O, Anguera Bosque A, Esmerado Appiani C, Caminal Mitjana JM. Ocular ultrasonography focused on the posterior eye segment:What radiologists should know. Insights Imaging. 2016;7:351–64. doi: 10.1007/s13244-016-0471-z. [DOI] [PMC free article] [PubMed] [Google Scholar]
- 7.Rumboldt Z, Moses C, Wieczerzynski U, Saini R. Diffusion-weighted imaging, apparent diffusion coefficients, and fluid-attenuated inversion recovery MR imaging in endophthalmitis. AJNR Am J Neuroradiol. 2005;26:1869–72. [PMC free article] [PubMed] [Google Scholar]
- 8.Razek AA, Elkhamary S. MRI of retinoblastoma. Br J Radiol. 2011;84:775–84. doi: 10.1259/bjr/32022497. [DOI] [PMC free article] [PubMed] [Google Scholar]
- 9.Silvera VM, Guerin JB, Brinjikji W, Dalvin LA. Retinoblastoma:What the neuroradiologist needs to know. AJNR Am J Neuroradiol. 2021;42:618–26. doi: 10.3174/ajnr.A6949. [DOI] [PMC free article] [PubMed] [Google Scholar]
- 10.de Graaf P, Goricke S, Rodjan F, Galluzzi P, Maeder P, Castelijns JA, et al. Guidelines for imaging retinoblastoma:Imaging principles and MRI standardization. Pediatr Radiol. 2012;42:2–14. doi: 10.1007/s00247-011-2201-5. [DOI] [PMC free article] [PubMed] [Google Scholar]
- 11.Hiasat JG, Saleh A, Al-Hussaini M, Al Nawaiseh I, Mehyar M, Qandeel M, et al. The predictive value of magnetic resonance imaging of retinoblastoma for the likelihood of high-risk pathologic features. Eur J Ophthalmol. 2019;29:262–8. doi: 10.1177/1120672118781200. [DOI] [PubMed] [Google Scholar]
- 12.Jansen RW, de Jong MC, Kooi IE, Sirin S, Göricke S, Brisse HJ, et al. MR imaging features of retinoblastoma:Association with gene expression profiles. Radiology. 2018;288:506–15. doi: 10.1148/radiol.2018172000. [DOI] [PubMed] [Google Scholar]
- 13.Kim JW, Madi I, Lee R, Zolfaghari E, Jubran R, Lee TC, et al. Clinical significance of optic nerve enhancement on magnetic resonance imaging in enucleated retinoblastoma patients. Ophthalmol Retina. 2017;1:369–74. doi: 10.1016/j.oret.2017.03.013. [DOI] [PMC free article] [PubMed] [Google Scholar]
- 14.Jansen RW, de Bloeme CM, Brisse HJ, Galluzzi P, Cardoen L, Göricke S, et al. MR imaging features to differentiate retinoblastoma from Coats'disease and persistent fetal vasculature. Cancers (Basel) 2020;12:3592. doi: 10.3390/cancers12123592. [DOI] [PMC free article] [PubMed] [Google Scholar]
- 15.Lemke AJ, Kazi I, Felix R. Magnetic resonance imaging of orbital tumors. Eur Radiol. 2006;16:2207–19. doi: 10.1007/s00330-006-0227-0. [DOI] [PubMed] [Google Scholar]
- 16.Smoker WR, Gentry LR, Yee NK, Reede DL, Nerad JA. Vascular lesions of the orbit:More than meets the eye. Radiographics. 2008;28:185–204. doi: 10.1148/rg.281075040. [DOI] [PubMed] [Google Scholar]
- 17.Sepahdari AR, Kapur R, Aakalu VK, Villablanca JP, Mafee MF. Diffusion-weighted imaging of malignant ocular masses:Initial results and directions for further study. AJNR Am J Neuroradiol. 2012;33:314–9. doi: 10.3174/ajnr.A2747. [DOI] [PMC free article] [PubMed] [Google Scholar]
- 18.Kuker W, Herrlinger U, Gronewaller E, Rohrbach JM, Weller M. Ocular manifestation of primary nervous system lymphoma:What can be expected from imaging? J Neurol. 2002;249:1713–6. doi: 10.1007/s00415-002-0919-6. [DOI] [PubMed] [Google Scholar]
- 19.Remond P, Attye A, Lecler A, Lamalle L, Boudiaf N, Aptel F, et al. The central bright spot sign:A potential new MR imaging sign for the early diagnosis of anterior ischemic optic neuropathy due to giant cell arteritis. AJNR Am J Neuroradiol. 2017;38:1411–5. doi: 10.3174/ajnr.A5205. [DOI] [PMC free article] [PubMed] [Google Scholar]
- 20.Adesina OO, Scott McNally J, Salzman KL, Katz BJ, Warner JEA, McFadden M, et al. Diffusion-weighted imaging and post-contrast enhancement in differentiating optic neuritis and non-arteritic anterior optic neuropathy. Neuroophthalmology. 2018;42:90–8. doi: 10.1080/01658107.2017.1356856. [DOI] [PMC free article] [PubMed] [Google Scholar]
- 21.Srinivasan S, Moorthy S, Sreekumar K, Kulkarni C. Diffusion-weighted MRI in acute posterior ischemic optic neuropathy. Indian J Radiol Imaging. 2012;22:106–7. doi: 10.4103/0971-3026.101082. [DOI] [PMC free article] [PubMed] [Google Scholar]
- 22.Dutra BG, da Rocha AJ, Nunes RH, Maia ACMJ. Neuromyelitis optica spectrum disorders:Spectrum of MR imaging findings and their differential diagnosis. Radiographics. 2018;38:169–93. doi: 10.1148/rg.2018170141. [DOI] [PubMed] [Google Scholar]
- 23.Matthews L, Enzinger C, Fazekas F, Rovira A, Ciccarelli O, Dotti MT, et al. MRI in Leber's hereditary optic neuropathy:The relationship to multiple sclerosis. J Neurol Neurosurg Psychiatry. 2015;86:537–42. doi: 10.1136/jnnp-2014-308186. [DOI] [PMC free article] [PubMed] [Google Scholar]
- 24.Biousse V, Newman NJ. Diagnosis and clinical features of common optic neuropathies. Lancet Neurol. 2016;15:1355–67. doi: 10.1016/S1474-4422(16)30237-X. [DOI] [PubMed] [Google Scholar]
- 25.Purvin V, Kawasaki A, Jacobson DM. Optic perineuritis:Clinical and radiographic features. Arch Ophthalmol. 2001;119:1299–306. doi: 10.1001/archopht.119.9.1299. [DOI] [PubMed] [Google Scholar]
- 26.Tailor TD, Gupta D, Dalley RW, Keene CD, Anzai Y. Orbital neoplasms in adults:Clinical, radiologic, and pathologic review. Radiographics. 2013;33:1739–58. doi: 10.1148/rg.336135502. [DOI] [PubMed] [Google Scholar]
- 27.Aviv RI, Miszkiel K. Orbital imaging:Part 2. Intraorbital pathology. Clin Radiol. 2005;60:288–307. doi: 10.1016/j.crad.2004.05.018. [DOI] [PubMed] [Google Scholar]
- 28.Kim JL, Mendoza PR, Rashid A, Hayek B, Grossniklaus HE. Optic nerve lymphoma:Report of two cases and review of the literature. Surv Ophthalmol. 2015;60:153–65. doi: 10.1016/j.survophthal.2014.11.004. [DOI] [PMC free article] [PubMed] [Google Scholar]
- 29.Vaghela V, Hingwala DR, Kapilamoorthy TR, Kesavadas C, Thomas B. Spontaneous intracranial hypo and hypertensions:An imaging review. Neurol India. 2011;59:506–12. doi: 10.4103/0028-3886.84328. [DOI] [PubMed] [Google Scholar]
- 30.Louis DN, Perry A, Reifenberger G, von Deimling A, Figarella-Branger D, Cavenee WK, et al. The 2016 World Health Organization classification of tumors of the central nervous system:A summary. Acta Neuropathol. 2016;131:803–20. doi: 10.1007/s00401-016-1545-1. [DOI] [PubMed] [Google Scholar]
- 31.Goyal P, Lee S, Gupta N, Kumar Y, Mangla M, Hooda K, et al. Orbital apex disorders:Imaging findings and management. Neuroradiol J. 2018;31:104–25. doi: 10.1177/1971400917740361. [DOI] [PMC free article] [PubMed] [Google Scholar]
- 32.Ferreira TA, Saraiva P, Genders SW, Buchem MV, Luyten GPM, Beenakker JW. CT and MR imaging of orbital inflammation. Neuroradiology. 2018;60:1253–66. doi: 10.1007/s00234-018-2103-4. [DOI] [PMC free article] [PubMed] [Google Scholar]
- 33.Kurimoto T, Tonari M, Ishizaki N, Monta M, Hirata S, Oku H, et al. Orbital apex syndrome associated with herpes zoster ophthalmicus. Clin Ophthalmol. 2011;5:1603–8. doi: 10.2147/OPTH.S25900. [DOI] [PMC free article] [PubMed] [Google Scholar]
- 34.Pereira A, Zhang A, Maralani PJ, Sundaram AN. Acute orbital myositis preceding vesicular rash eruption in herpes zoster ophthalmicus. Can J Ophthalmol. 2020;55:e107–9. doi: 10.1016/j.jcjo.2019.09.005. [DOI] [PubMed] [Google Scholar]
- 35.Song JW, Ojeda S, Romero JM. High resolution vessel wall MRI and vasculopathy related to herpes zoster ophthalmicus. Clin Imaging. 2018;50:336–9. doi: 10.1016/j.clinimag.2018.05.002. [DOI] [PubMed] [Google Scholar]
- 36.Som PM, Curtin HD. 5th ed. Mosby: 2011. Head and Neck Imaging. [Google Scholar]
- 37.Nadarajah J, Madhusudhan KS, Yadav AK, Chandrashekhara SH, Kumar A, Gupta AK. MR imaging of cavernous sinus lesions:Pictorial review. J Neuroradiol. 2015;42:305–19. doi: 10.1016/j.neurad.2015.04.010. [DOI] [PubMed] [Google Scholar]
- 38.Mayer EJ, Fox DL, Herdman G, Hsuan J, Kabala J, Goddard P, et al. Signal intensity, clinical activity and cross-sectional areas on MRI scans in thyroid eye disease. Eur J Radiol. 2005;56:20–4. doi: 10.1016/j.ejrad.2005.03.027. [DOI] [PubMed] [Google Scholar]
- 39.Firbank MJ, Harrison RM, Williams ED, Coulthard A. Measuring extraocular muscle volume using dynamic contours. Magn Reson Imaging. 2001;19:257–65. doi: 10.1016/s0730-725x(01)00234-x. [DOI] [PubMed] [Google Scholar]
- 40.Lacey B, Chang W, Rootman J. Nonthyroid causes of extraocular muscle disease. Surv Ophthalmol. 1999;44:187–213. doi: 10.1016/s0039-6257(99)00101-0. [DOI] [PubMed] [Google Scholar]
- 41.van der Pol CB, Chakraborty S, Gao J, Nguyen T, Torres C, Glikstein R. Imaging anatomy and pathology of extraocular muscles in adults. Can Assoc Radiol J. 2014;65:366–71. doi: 10.1016/j.carj.2014.05.001. [DOI] [PubMed] [Google Scholar]
- 42.Chaudhary V, Bano S, Parmar PR, Bidasaria N, Bajaj S. Extraocular muscle cysticercosis mimicking as pseudotumor orbit:A clinical dilemma. Neurol India. 2013;61:665–7. doi: 10.4103/0028-3886.125287. [DOI] [PubMed] [Google Scholar]
- 43.Li EY, Yuen HK, Cheuk W. Lymphoproliferative Disease of the orbit. Asia Pac J Ophthalmol (Phila) 2015;4:106–11. doi: 10.1097/APO.0000000000000102. [DOI] [PubMed] [Google Scholar]
- 44.Thatcher J, Chang YM, Chapman MN, Hovis K, Fujita A, Sobel R, et al. Clinical-radiologic correlation of extraocular eye movement disorders:Seeing beneath the surface. Radiographics. 2016;36:2123–39. doi: 10.1148/rg.2016150227. [DOI] [PubMed] [Google Scholar]
- 45.Ortube MC, Bhola R, Demer JL. Orbital magnetic resonance imaging of extraocular muscles in chronic progressive external ophthalmoplegia:Specific diagnostic findings. J AAPOS. 2006;10:414–8. doi: 10.1016/j.jaapos.2006.04.012. [DOI] [PMC free article] [PubMed] [Google Scholar]
- 46.Hashemi N, Pfeiffer ML, Foroozan R, Lee AG. Radiographic evidence for denervation atrophy of extraocular muscles due to chronic intracavernous compressive third nerve palsy. Can J Ophthalmol. 2013;48:e4–6. doi: 10.1016/j.jcjo.2012.08.015. [DOI] [PubMed] [Google Scholar]
- 47.Chung EM, Murphey MD, Specht CS, Cube R, Smirniotopoulos J. From the archives of the AFIP pediatric orbit tumors and tumorlike lesions:Osseous lesions of the orbit. Radiographics. 2008;28:1193–214. doi: 10.1148/rg.284085013. [DOI] [PubMed] [Google Scholar]
- 48.Alkatan HM, Al Otaibi M, Maktabi AMY, Aljaedi H, Elkhamary SM, Al-Faky Y, et al. Clinical, radiological and histopathological characteristics of surgically removed orbital hematic cysts:A case series. Saudi J Ophthalmol. 2018;32:45–51. doi: 10.1016/j.sjopt.2018.04.002. [DOI] [PMC free article] [PubMed] [Google Scholar]
- 49.Li W-Y, Brock P, Saunders DE. Imaging characteristics of primary cranial Ewing sarcoma. Pediatr Radiol. 2005;35:612–8. doi: 10.1007/s00247-005-1438-2. [DOI] [PubMed] [Google Scholar]
- 50.Fitzpatrick KA, Taljanovic MS, Speer DP, Graham AR, Jacobson JA, Barnes GR, et al. Imaging findings of fibrous dysplasia with histopathologic and intraoperative correlation. AJR Am J Roentgenol. 2004;182:1389–98. doi: 10.2214/ajr.182.6.1821389. [DOI] [PubMed] [Google Scholar]
- 51.Som PM, Curtin HD. Elsevier Health Sciences; 2011. Head and Neck Imaging E-Book. [Google Scholar]
- 52.Crawford SD, Patel MR. Bilateral supraorbital masses after prolonged headlock injury:An unusual manifestation of orbital subperiosteal hematomas. AJR Am J Roentgenol. 2005;184(3 Suppl):S2–3. doi: 10.2214/ajr.184.3_supplement.018400s2. [DOI] [PubMed] [Google Scholar]
- 53.Van Tassel P, Lee YY, Jing BS, De Pena CA. Mucoceles of the paranasal sinuses:MR imaging with CT correlation. AJR Am J Roentgenol. 1989;153:407–12. doi: 10.2214/ajr.153.2.407. [DOI] [PubMed] [Google Scholar]
- 54.Valvassori GE, Sabnis SS, Mafee RF, Brown MS, Putterman A. Imaging of orbital lymphoproliferative disorders. Radiol Clin North Am. 1999;37:135–50, x-xi. doi: 10.1016/s0033-8389(05)70083-x. [DOI] [PubMed] [Google Scholar]
- 55.Haradome K, Haradome H, Usui Y, Ueda S, Kwee TC, Saito K, et al. Orbital lymphoproliferative disorders (OLPDs):Value of MR imaging for differentiating orbital lymphoma from benign OPLDs. AJNR Am J Neuroradiol. 2014;35:1976–82. doi: 10.3174/ajnr.A3986. [DOI] [PMC free article] [PubMed] [Google Scholar]
- 56.Qian W, Xu XQ, Hu H, Su GY, Wu JF, Shi HB, et al. Dynamic contrast-enhanced MRI in orbital lymphoproliferative disorders:Effects of region of interest selection methods on time efficiency, measurement reproducibility, and diagnostic ability. J Magn Reson Imaging. 2018;47:1298–305. doi: 10.1002/jmri.25859. [DOI] [PubMed] [Google Scholar]
- 57.McCarville MB, Spunt SL, Pappo AS. Rhabdomyosarcoma in pediatric patients:The good, the bad, and the unusual. AJR Am J Roentgenol. 2001;176:1563–9. doi: 10.2214/ajr.176.6.1761563. [DOI] [PubMed] [Google Scholar]
- 58.Drier A, Haroche J, Savatovsky J, Godenèche G, Dormont D, Chiras J, et al. Cerebral, facial, and orbital involvement in Erdheim-Chester disease:CT and MR imaging findings. Radiology. 2010;255:586–94. doi: 10.1148/radiol.10090320. [DOI] [PubMed] [Google Scholar]
- 59.Wu JS, Hochman MG. Soft-tissue tumors and tumorlike lesions:A systematic imaging approach. Radiology. 2009;253:297–316. doi: 10.1148/radiol.2532081199. [DOI] [PubMed] [Google Scholar]
- 60.Bonavolonta G, Strianese D, Grassi P, Comune C, Tranfa F, Uccello G, et al. An analysis of 2,480 space-occupying lesions of the orbit from 1976 to 2011. Ophthalmic Plast Reconstr Surg. 2013;29:79–86. doi: 10.1097/IOP.0b013e31827a7622. [DOI] [PubMed] [Google Scholar]
- 61.Jung WS, Ahn KJ, Park MR, Kim JY, Choi JJ, Kim BS, et al. The radiological spectrum of orbital pathologies that involve the lacrimal gland and the lacrimal fossa. Korean J Radiol. 2007;8:336–42. doi: 10.3348/kjr.2007.8.4.336. [DOI] [PMC free article] [PubMed] [Google Scholar]
- 62.Elkhamary SM. Lacrimal gland lesions:Can addition of diffusion-weighted MR imaging improve diagnostic accuracy in characterization? Egypt J Radiol Nucl Med. 2012;43:165–72. [Google Scholar]