Abstract
Molecular tests have become an indispensable tool for the diagnosis and prognosis of hematological malignancies and are subject to accreditation according to the International Standard ISO 15189. National standardization of these techniques is essential to ensure that patients throughout France benefit from the same care. We report here on the experience of the GBMHM (Groupe des Biologistes Moléculaires des Hémopathies Malignes). By organizing External Evaluation of Quality (EEQ) programs and training meetings, the GBMHM has contributed to improvement and standardization of molecular tests in 64 French laboratories. A retrospective analysis of the quality-control results of 11 national campaigns spanning 10 years was performed for the 3 most frequently prescribed tests: BCR-ABL1, JAK2 V617F, and lymphoid clonality. For each test, particular attention was placed on comparing methodologies and their evolution throughout the period. The establishment of the BCR-ABL1, JAK2 V617F, and lymphoid clonality EEQ programs and the associated training meetings have initiated a process of collective standardization concerning the methods of implementation (JAK2 V617F) and the interpretation and formulation of results (lymphoid clonality). In addition, it resulted in objective improvement in technical performance (BCR-ABL1). Our evaluation of the impact of these EEQ programs demonstrates that it is possible to obtain reproducible values across different laboratories in France by applying national recommendations. To our knowledge, this is the first publication that evaluates the impact of a national quality assurance program on improving molecular results in hematology.
Introduction
Molecular tests are becoming increasingly important in diagnosing hematological malignancies and planning their therapeutic management. One example is the identification of BCR-ABL1 transcripts in diagnosis and follow-up of chronic myeloid leukemia (CML).1 Accreditation according to International Standard ISO 15189 is mandatory for every biological test to ensure continual quality assessment. Standardization is necessary to ensure intercenter reproducibility. The standardization of quantitative analyses used for minimal residual disease follow-up is especially challenging. To address this challenge, 3 key solutions/strategies have been proposed: (1) the use of FDA-approved or CE-IVD-marked diagnostic kits; (2) concentration of analyses in a few centralized laboratories; and (3) the organization of a laboratory network with a structured quality-assessment program to improve analytical performance. In France (population 66 million), the third option has been selected. Here, we discuss the ways in which the External Evaluation of Quality (EEQ) program developed by the GBMHM (Groupe des Biologistes Moléculaires des Hémopathies Malignes) has improved the quality of detection and quantification of BCR-ABL1 and JAK2 V617F and the molecular analysis of Ig/TCR clonality. GBMHM is a French, not-for-profit, association located in Paris, created in 2001, which represents the majority of French molecular diagnostic laboratories in oncohematology. The goals of this association are: (1) the development of a quality platform allowing regular distribution of samples to all registered French laboratories; (2) the organization of regular clinical and biological meetings; (3) the elaboration of technical recommendations for the standardization of molecular testing2,3; and (4) the development of support tools for validation of analytical methods.4
We here focus on the 3 main routine tests which have been performed by laboratories over the past 10 years (BCR-ABL1, JAK2 V617F, and molecular analysis of Ig/TCR clonality). We report how the EEQ program developed by the GBMHM has improved (1) analytical procedures for the detection and quantification of BCR-ABL1, (2) technical procedures for JAK2 V617F, and (3) standardization of the molecular analysis of Ig/TCR clonality.
Materials and methods
Purpose of the GBMHM
The GBMHM is a nonprofit organization whose main mission is to promote molecular biology in hematology by training biologists, residents, and technicians, setting up working groups and collaborative projects with national and international objectives and encouraging communication between its members, who elect a new board every 4 years. Its strategic position as an intermediary between institutions and laboratories means that it is a major contributor to the dissemination of information to its members. The GBMHM is also committed to improving the quality of analyses by organizing and promoting EEQ campaigns and by arranging feedback/continuing medical education meetings to facilitate evaluation of the results and encourage discussions between biologists. A technological platform, staffed by an engineer and a technician, was created with initial financial support from the French National Cancer Institute (INCa). This activity is currently entirely self-financed through membership fees and subscriptions to EEQ campaigns. The GBMHM has undergone national accreditation as a recognized provider of EEQ by the national competent authority (Haute Authorité de Santé).
EEQ organization
The GBMHM EEQ programs reported here took place annually between September and June. EEQ samples were distributed by the GBMHM quality platform located in Paris. Once or twice a year, depending on the particular EEQ program, registered laboratories received a series of samples produced from cell lines by the GBMHM platform. Depending on the EEQ program, cells in lysis buffer for RNA (BCR-ABL1) or DNA (JAK2 and clonality) were distributed. Laboratories performed the tests and reported their results using a specially designed form. After statistical analysis, a “performance certificate” was provided to the laboratories for each EEQ program.
Statistical analysis
EEQ analysis by the GBMHM platform
Evaluation of laboratory performance was carried out by statistical analysis of all the results of the participating laboratories. A target value was determined for each EEQ sample. The target value varied depending on the type of program. For “qualitative” programs (ie, lymphoid clonality), the acceptable value corresponded to the response given by >50% of laboratories. Marks were assigned according to the degree of agreement with the target value (100% for a compliant result, 75% for a close-to-target result, and 0% for a discordant result). For “quantitative” programs (ie, BCR-ABL1 and JAK2), the target value corresponded to the consensus average. The calculation of the consensus average was based on the results from all laboratories, excluding outliers. Outliers were defined as results which differed from the consensus average by >2 SDs. A mark was then assigned to each laboratory using the Z-score method. A further score is then assigned to each value of Z-score (Supplemental Digital file 1, http://links.lww.com/HS/A205).
Comparison of SDs
SDs were compared using Fisher’s test.
Results
Laboratories are distributed relatively evenly throughout France, and actively participate in EEQ programs and meetings
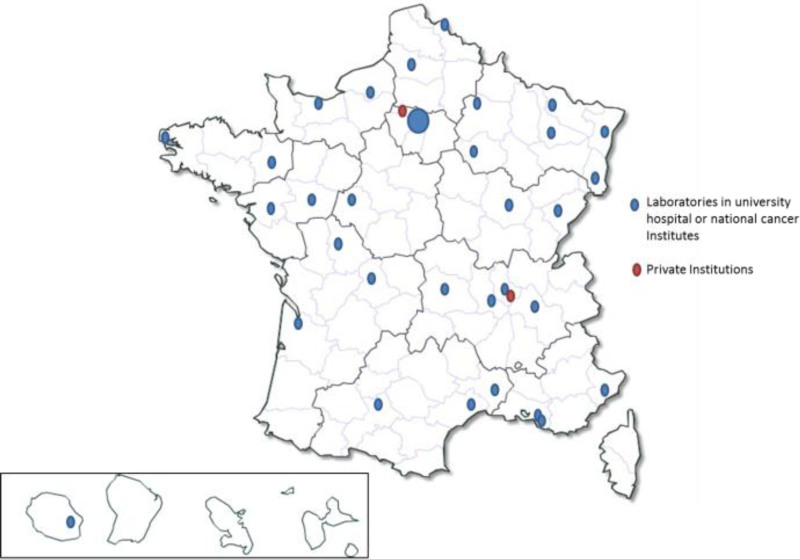
In 2019, 68 laboratories participated in GBMHM EEQ programs. These laboratories were variously affiliated with hospitals, National Centers for Cancer Diagnosis (Unicancer), and private institutions. Most of them were INCa (Institut National du Cancer) labeled molecular diagnostic cancer platforms (Figure 1).
Figure 1.
National and geographic repartition of molecular laboratories in hematology in metropolitan France and in overseas departments and territories in 2019 (n = 68).
In 2010, 126 registrations to BCR-ABL1, JAK2 V617F and Ig/TCR clonality EEQs were recorded. This number rose to 144 (an increase of 14%) in 2019 (Table 1). Between 2010 and 2019, 95 BCR/ABL1, 60 JAK2 and 68 clonality samples were distributed and analyzed by laboratories. During the same period, an average of 3 interpretation and continuing diagnostic information meetings were organized each year, with an average of 63 biologists participating (minimum: 42; maximum: 95) at each meeting.
Table 1.
Evolution of Registrations for GBMHM EEQ Programs From 2010 to 2019 for BCR-ABL1, JAK2 V617F, and Clonality Programs
| 2010 | 2019 | Variation | |
|---|---|---|---|
| BCR ABL1 | 53 | 62 | +17% |
| EAC protocol (7) | 48 | 38 | −21% |
| GeneXpert method | 5 | 24 | +380% |
| JAK2 V617F | 46 | 52 | +13% |
| Ig/TCR clonality | 27 | 30 | +11% |
EAC = Europe Against Cancer; g/TCR = Immunoglobulin/T-cell receptor.
EEQ improves analytical performances, increases technical choices, and contributes to better standardization
BCR-ABL1 quantification
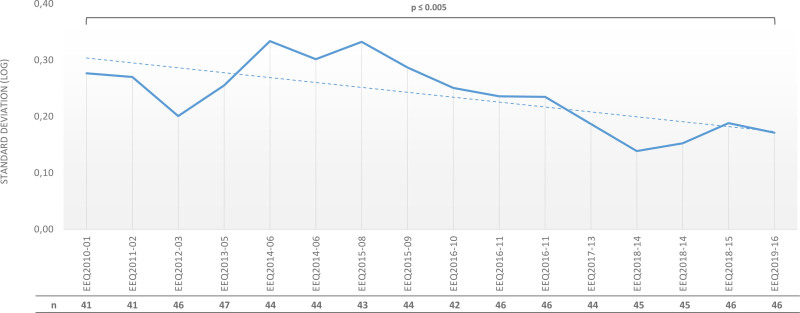
For patients with chronic myeloid leukemia (CML), guidelines recommend monitoring the response to treatment with tyrosine kinase inhibitors (TKIs) by testing the BCR-ABL1 fusion-gene transcript level using reverse transcriptase quantitative polymerase chain reaction (RT-qPCR). As described in the current European LeukemiaNet (ELN) CML recommendations,3 regular ongoing BCR-ABL1 testing provides the essential information required to make timely treatment decisions such as early molecular response (EMR) or major molecular response (MMR). More recently, general guidelines have been updated to include recommendations on stopping TKI treatment in patients who have achieved a sustained deep molecular response during TKI treatment.3,5 In the early 2000s, there were no commercial test sets. Moreover, control plasmids and cell-line utilization varied between laboratories, which mainly used in-house methods. Subsequently, method standardization increased due to the publication of recommendations: for example, the requirement to introduce plasmids as internal calibrators.2,6,7 EEQ results analysis revealed an improvement in interlaboratory reproducibility for RT-qPCR. We observed a decrease in SD (log-expressed) overtime, with a BCR-ABL1/ABL1 log ratio of 0.01%–1%, aligned to the International Scale: 0.28 (ie, fold change of 3.6) in 2010 and 0.14 (ie, fold change of 1.9) in 2019 (P < 0.001) (Figure 2).
Figure 2.
Evolution of the standard deviation (SD, expressed in logs) during the different EEQ campaigns from 2010 to 2019 (EEQ2010-01 to EEQ2019-17) for BCR-ABL1 by RT-qPCR (SD defined for BCR-ABL1/ABL1 log ratio between 0.01 and 1%) and the number of laboratories participating each year. EEQ = external evaluation of quality; n = number of laboratories.
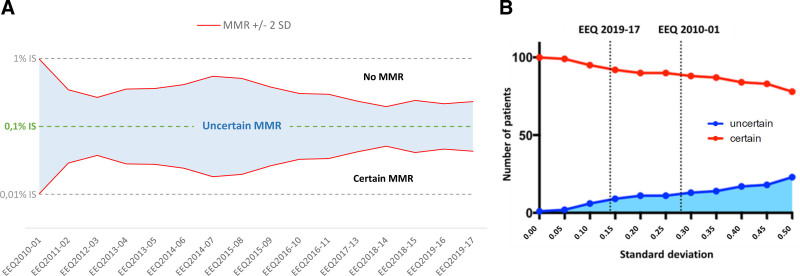
This notable improvement made it possible to reduce the uncertainty of the results around decision-making threshold values such as the MMR (defined by a BCR-ABL1/ABL1 log ratio of 0.1%) (Figure 3A). To evaluate its potential impact, we extrapolated national SD results for a cohort of 101 chronic-phase CML patients treated with imatinib (Lyon University Hospital). By applying the measured SD between laboratories to the threshold of MMR, we quantified the number of patients with uncertain MMR, that is, those patients whose BCR-ABL1/ABL1 log ratio lay within the confidence interval of MMR. The reduction of the standard deviation between laboratories from 2010 to 2019 decreased the number of patients with uncertain MMR by a factor of 4.7 (28/101 compared to 6/101) (Figure 3B).
Figure 3.
Impact of BCR-ABL1 EEQ results on the ability of laboratories to determine MMR with certainty. (A) Improvement in laboratory performance led to a reduction in uncertainty around MMR, defined as a BCR-ABL1/ABL1 log ratio of 0.1%. The figure represents national SD evolution (BCR-ABL1/ABL1 log ratio aligned on IS, calculated using EEQ results from all laboratories) over time (EEQ campaigns from 2010 to 2019). The limit of measurement uncertainty is 2 SDs: every point above MMR+2SD is not an MMR point, whereas every point below MMR-2SD is an MMR point; any point between MMR ±2 SD is an uncertain MMR point. (B) At the clinical level, this translated into a better evaluation of MMR: when SD decreases, the number of patients with certain MMR status increases. By extrapolating national SD results in 2010 and 2019 for a cohort of 101 patients in first-line treatment for chronic-phase CML (52 of whom were in MMR at 1 year), we estimated a reduction by a factor of 4.7 in the number of patients whose MMR would have been uncertain. The red curve represents patients whose MMR status is certain, while the blue one represents patients whose MMR is uncertain. EEQ = external evaluation of quality; IS = international scale; MMR = molecular major response; SD = standard deviation.
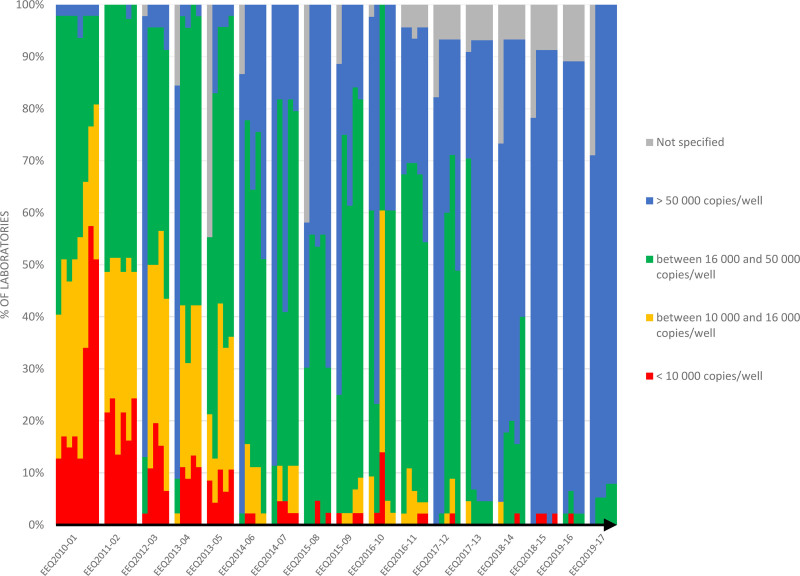
In addition to the decrease in uncertainty, the increase in ABL1 copies per sample well had a significant impact on result quality and patient treatment. In this study, all laboratories within France used the ABL1 gene as a control gene. The ABL1 control gene, along with the GUS and BCR genes, has been defined by the ELN as a gene of choice for ensuring RNA integrity, as it degrades at the same rate as BCR-ABL1. International recommendations have defined the minimum number of copies per well, both for the ABL1 gene (10,000 copies) and in total (32,000 or 100,000), which are necessary to establish the deep molecular responses (MR 4.5 or MR 5, respectively) required in order to consider cessation of treatment.5 The French therapeutic trial Stop Imatinib (STIM) challenged French molecular laboratories to obtain at least MR 4.5.8 Ten years ago, between 10% and 50% of laboratories failed to obtain MR 4, which is defined by the presence of at least 10,000 ABL1 copies per well. Over time, using knowledge acquired from the results of the EEQs and from technical discussions, most laboratories adapted their practices by changing, for example, the RetroTranscriptase (RT) enzyme or the extraction method. This resulted in 100% of laboratories achieving MR 4.5% and 95% of laboratories achieving MR 5 (Figure 4).
Figure 4.
The number of copies of the ABL1 control gene per well was increased by laboratories during the different EEQ campaigns: in 2010, 10%–50% of laboratories failed to obtain 10,000 ABL1 copies per well, whereas all laboratories reported at least 16,000 copies in 2019. EEQ = external evaluation of quality.
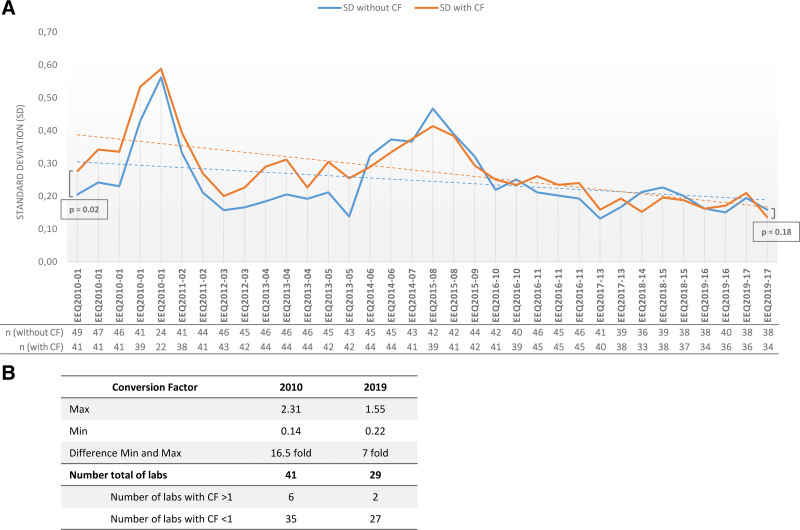
Finally, alignment to International Scale (IS) was required for BCR-ABL1 molecular assessment and all laboratories were required to determine their EUTOS (European Treatment and Outcome Study) Conversion Factor (CF).3 Before the introduction of the EEQ programs, CF was not used by all laboratories. For the laboratories which had been using it, the application of the EUTOS CF increased the dispersion of results: in 2010, SDs (log-expressed) were 0.28 with CF, compared with 0.21 without CF (P = 0.02). However, by 2019, this negative impact had disappeared (0.14 with CF versus 0.16 without CF; P = 0.18) (Figure 5A).
Figure 5.
Determination of EUTOS correction factor and impact on EEQ results. (A) Impact of the application of the EUTOS CF on the standard deviations observed over time. The blue line shows the SDs for CFs before alignment with the International Scale; the orange line shows the SDs after alignment, for EEQs with a BCR-ABL1/ABL1 log ratio between 0.01% and 1%. (B) Dispersion of CF measured by a central EUTOS laboratory in Paris in 2010 and 2019. The decrease in the number of laboratories observed in 2019 can be explained by individual technical choices, including the use of GeneXpert or commercial kits which do not require external CF determination. CF = conversion factor; EEQ = External Evaluation of Quality; EUTOS = European Treatment and Outcome Study; n = number of laboratories.
Moreover, CF dispersion for the laboratories decreased over time. To evaluate CF, each laboratory sent 30 TRIzol samples (with BCR-ABL1/ABL1 log ratio covering the measurement range from 0.001% to 100%) to a EUTOS laboratory in Paris. The EUTOS lab performed extraction and quantification of all 30 samples and then compared the centralized BCR-ABL1/ABL1 log ratio with the laboratory values. In 2010, the values ranged from 0.14 to 2.31, with a difference of 16.5 fold between the lowest and the highest value, while in 2019, the values ranged from 0.22 to 1.5 and a maximum difference of 7 fold (Figure 5B).
JAK2 test
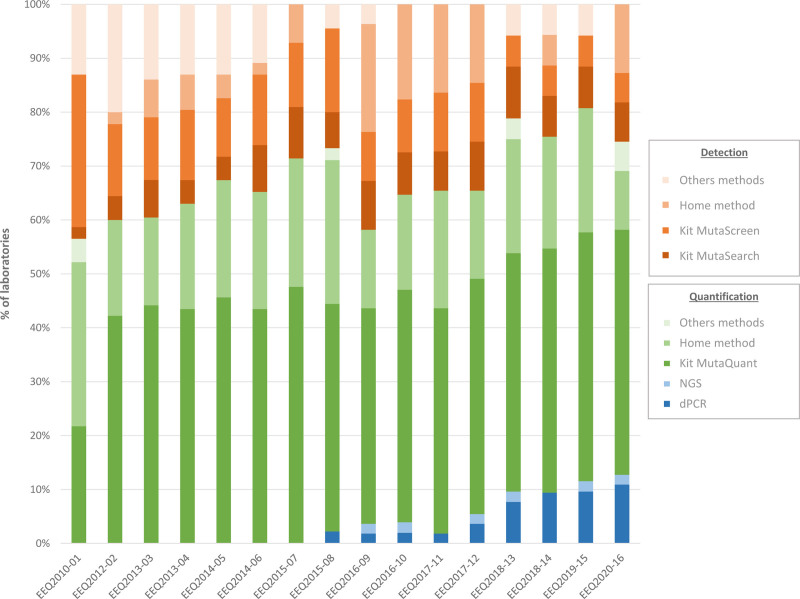
The JAK2 V617F mutation represents the hallmark of Philadelphia chromosome negative myeloproliferative neoplasms (MPNs).9 The assessment of the JAK2 V617F allele burden is standard practice at diagnosis, as most patients with polycythemia vera (PV) or primary myelofibrosis (PMF) display a JAK2 V617F allele frequency higher than 50%. In essential thrombocythemia (ET) patients, the JAK2 V617F allele frequency is reported to be lower. JAK2 V617F assessment is also commonly used during treatment as a means to assess minimal residual disease, especially in interferon-treated patients. According to recommendations, assays must be sensitive enough to identify a JAK2 V617F mutant with an allele burden as low as 1%.10,11 In 2010, 2 main categories of technique existed: the first included qualitative or semiquantitative techniques (with sensitivities ranging from 1 to 2%), and the second included more sensitive quantitative techniques. All of these techniques could be conducted using CE-IVD kits or in-house tests. Across the 10 years of EEQ programs, we observed a trend from semiquantitative, less sensitive techniques (42% decreasing to 27%) in favor of quantitative techniques (55% increasing to 73%), due to the emergence of new technologies, such as next-generation sequencing (NGS) and droplet digital PCR (Figure 6).
Figure 6.
Evolution of techniques for JAK2 V617F detection or quantification. dPCR = digital PCR; EEQ = external evaluation of quality; NGS = next-generation sequencing.
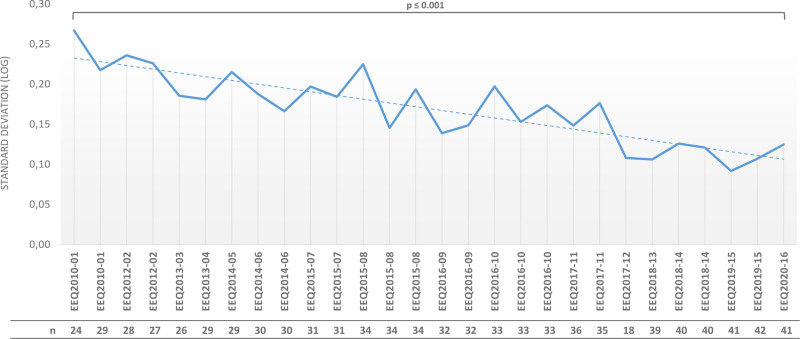
As observed with BCR-ABL1, SDs (log-expressed) decreased gradually over time, from a log ratio of 0.27 in 2010 to 0.12 in 2020 (P < 0.001) (Figure 7). However, there were slight differences in the JAK2 V617 analysis process. By the time we performed this test, we had gained significant insights from BCR-ABL1 quantification. Additionally, CE-IVD kits were readily available (Ipsogen MutaSearch, MutaScreen and MutaQuant kits from Qiagen), permitting faster homogenization of results. Regardless, we observed an improvement of the results over time in terms of dispersion, reflecting the increased use of CE-IVD kits (23/47 laboratories used CE-IVD kits in 2010 and 32/55 in 2020) on the one hand, and the contribution of EEQs results and feedback meetings in improving the performance for laboratories using in house tests on the other hand.
Figure 7.
Evolution of SDs (log-expressed) during the different JAK2 EEQ campaigns for a target between 1% and 10%. EEQ = external evaluation of quality; n = number of laboratories.
Ig/TCR clonality analysis
The diagnosis of lymphoid malignancies is supported and facilitated by clonality testing. Immunoglobulin (Ig) and T-cell receptor (TCR) antigen receptor gene rearrangements, which can begin from the earliest stages of B-cell and T-cell development onward, are the most widely selected targets.12 The development of a standardized EuroClonality/BIOMED-2 multiplex PCR protocol has enabled routine implementation of the technique in molecular-biology laboratories.13 The frequency of these tests, in addition to the complexity of profile analysis, prompted the GBMHM to develop a clonality EEQ.
Two types of EEQ were developed by the GBMHM platform. In the first type of EEQ, laboratories receive DNA (extracted from cell lines diluted in polyclonal samples) and analyze the samples according to their own protocols. This EEQ evaluated the technical capacity of laboratories to amplify lymphoid rearrangements. In the second type of EEQ, migration profiles obtained by laboratories from tumor samples are sent with a clinical context (disease details). The profile analysis is then carried out in a clinicobiological context, using methods similar to those used in the diagnostic activity of the laboratories. This method facilitates the assessment of the three levels of the postanalytical phase of diagnostic PCR-based clonality testing described by the EuroClonality group: technical description per PCR; overall molecular interpretation of clonality testing data; and integration of the clonality testing results with morphological, immunophenotypic, and clinical data.13
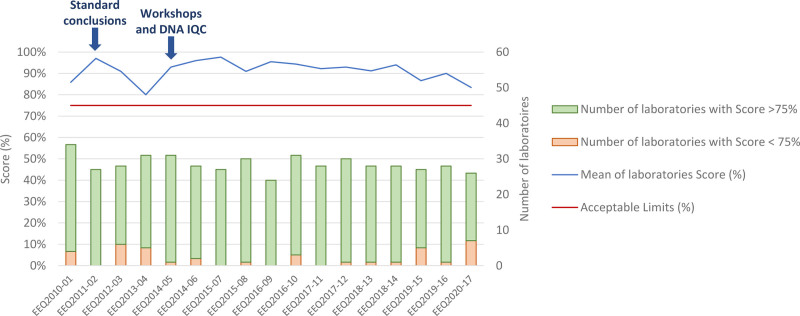
As of 2011, French GBMHM laboratories progressively adopted the standardized resolutions that were proposed by the EuroClonality working group to homogenize clinical responses.13 Since 2014, workshops have been organized to standardize the interpretation of “real-life” profiles. Scores were introduced to determine whether laboratories conform to analytic-performance standards. As shown in Figure 8, the rate of acceptable responses to the EEQs throughout the period is satisfactory, demonstrating the importance of this standardization in the context of an analysis for which biological interpretation based on the recognition of molecular patterns is critical.
Figure 8.
Evolution of laboratories’ scores from 2010 to 2020. A score >75% is considered to conform to analytic-performance standards, whereas <75% is noncompliant. As shown by the arrows, standard conclusions have been applied since 2011 (left arrow) and workshops were introduced in 2014 in addition to technical analysis of samples (right arrow). IQC = internal quality control.
Discussion
To our knowledge, this is the first study evaluating improvement of molecular results in hematology with a national quality assurance program. Over the last 30 years, molecular diagnostics have been implemented with increasing scope and speed in routine clinical laboratories, and have become unavoidable in hematology. In laboratory medicine, the most crucial areas for standardization are regulated by the ISO 15189 standard, which requires external quality controls that serve as a measure of a laboratory’s performance and are therefore important tools for monitoring quality and effecting improvements. One challenge faced by the GBMHM was the acceptance of its quality-assurance program by its members. It is clear from the growing number of laboratories that have signed up to the program that acceptance is becoming more widespread. This has been driven by several factors: (1) the major role played by the INCa national cancer institute, including initially funding the platform’s staff and launching the initiative; (2) the legal obligation of ISO 15189 accreditation required by the French government, which will become compulsory on October 31, 2021; and (3) the existence of a dynamic group which has worked to turn a constraint into a positive force combining evaluation and continuing education, and has committed to offering each patient the assurance of equal care in any location under French jurisdiction, including overseas territories tens of thousands of kilometers away.
Concerning BCR-ABL1 quantification, our results show that the implementation of BCR-ABL1 quantification EEQ is fundamental to improve performance. The multicentric SDs observed, with a fold-change ratio <2 for BCR-ABL1/ABL1 log ratios around 0.1%, are similar to those observed in a monocentric study.14 In this study, a BCR-ABL1 increase over time was only considered significant if a variation of >5 times was observed,14 whereas our results showed that a variation of >3 times is already significant. The majority of laboratories still use RT-qPCR in-house methods derived from the Europe Against Cancer (EAC) protocol. However, an increasing number of laboratories have turned to automated methods in the CE-IVD category, such as GeneXpert. It is interesting to note that SDs obtained through automated methods are comparable and of the same order of magnitude (data not shown). This is of particular interest at a time when European regulations on the preferential use of CE-IVD kits are coming into force and laboratories must prove that the performance of their in-house testing surpasses that of CE-IVD tests (Regulation (EU) 2017/746 of the European Parliament and of the Council). In addition, the EEQ meetings have led to evolution in biologists’ practices: the use of ABL1 as a control gene, the use of plasmids for improved standardization of ABL1 copy numbers, changes in extraction methods (manual TRIzol versus automatized extraction), choice of RT enzymes, and so on. These changes have made it possible for all laboratories in France to obtain at least 32000 ABL1 copies, and therefore achieve MR 4.5. As such, throughout France, all GBMHM laboratories are capable of identifying patients whose TKI treatment can be ended. Furthermore, the EEQ results provided valuable information regarding the enforcement of the EUTOS CF. In the early years, the enforcement of the EUTOS CF increased the dispersion of the results. On the assumption that laboratories were using an unsuitable EUTOS CF, we attempted to optimize its management. Although the GBMHM quality platform initially tested each laboratory once a year to ensure alignment with the IS, a decision was made that the laboratories should be tested more frequently (every 6 mo) in cases of significant variation of the CF between 2 of its measurements. Ultimately, this choice appeared to be justified, because the negative impact of EUTOS CF on dispersion results disappeared over time. Regarding the use of EUTOS correction of BCR-ABL1 quantification, our data show little evidence that correction of multicenter results leads to less variability, and can even increase dispersion if the correction factors applied are not regularly and carefully calculated. Indeed, our data would suggest that the GBMHM approach to harmonized, standardized practice and interpretation will contribute more to reproducibility than correction in the absence of concerted optimization and standardization.
The main observation from the JAK2 EEQ analysis was that technical choices had evolved over time. International recommendations had also evolved, emphasizing the necessity of detecting low-burden JAK2 V617F mutations (up to 1%). Some laboratories had therefore reviewed their practices, replacing previous procedures with more sensitive techniques.11 Two notable quantitative methods, NGS and droplet digital PCR, have appeared in the last 5 years and are a focus for development in this context. More recently, the discovery of a link between increased cardiovascular risk and the presence of JAK2 V617F clonal hematopoiesis is likely to influence a shift toward even more sensitive tests (to identify allele burdens between 0.1% and 1%). Vascular medicine departments are increasingly testing for JAK2 V617F mutations as a possible cause of unexplained cardiovascular events.15,16 EEQ meetings facilitated the homogenization of responses and the prescription of additional tests. During a meeting in 2018, it was agreed that low rates of JAK2 allele burden (<5%) should automatically instigate a search for other mutations in MPNs (such as CALR, MPL, and JAK2 exon 12).17
Finally, the harmonization of responses and the standardization of conclusions are fundamental elements in validating lymphoid clonality.13 Since 2011, the GBMHM’s team of molecular biologists has been working to optimize this postanalytical stage by organizing workshops dedicated to this subject. Topics covered include profile analysis, profile description and biological conclusion. The analysis of the EEQ results shows that the majority of laboratories have a satisfactory response rate, while the profiles sent for analysis display an increasing level of complexity and detail.
Conclusion
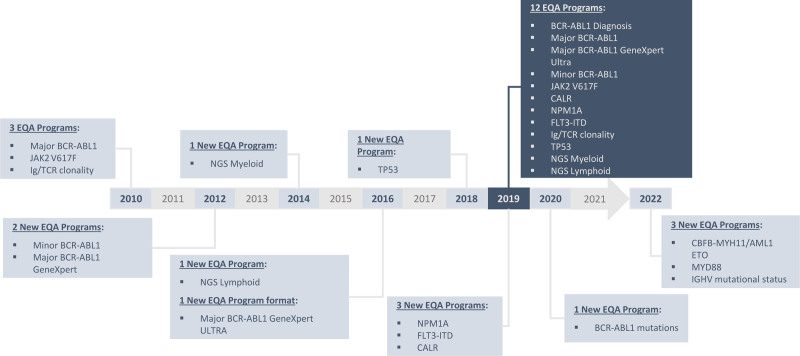
Overall, the GBMHM has succeeded in creating a robust laboratory network through the organization of a national quality-assessment program for molecular tests in hematology. This action has produced clear improvements in quality, including superior analytical performance, technical standardization, and homogenization of interpretation. This is of critical importance because the results of biological tests have a clinical impact: optimal training and confidence in results are fundamental for accurate diagnosis of disease and provision of effective therapy. Since molecular testing is taking on an increasing role in determining patient care, the GBMHM regularly expands its EEQ panel choices with new targets: from 3 targets in 2010 to 13 in 2020 (including innovative tests such as NGS) and 16 expected in 2022 (Figure 9). Moreover, it is an evolving market where new technologies continue to challenge conventional practices. NGS and droplet digital PCR are techniques with extremely high sensitivity, allowing process optimization and improved cost-efficiency. In addition, by May 2022, all EU Member States must implement new and far-reaching EU legislation: the In Vitro Diagnostic Medical Devices Regulation (IVDR). The IVDR will strengthen the requirements for clinical evidence that demonstrates the clinical benefit and safety of a device. If laboratories intend to continue using tests that have been developed in-house, they will be required to prove that there are no commercial kits which offer equivalent performance. GBMHM can play a strategic role in this new area by promoting the quality and safety of in-house tests (for tests without CE-IVD kits), and by using the experience of 10 years of organizing national quality controls and the network of molecular biologists to enable the evaluation of future diagnostic kits developed by the manufacturing sector.
Figure 9.
GBMHM EEQ program timeline from 2010 to 2019, with 3 new targets expected by 2022. EEQ = external evaluation of quality.
Disclosures
The authors have no conflicts of interest to disclose.
Acknowledgments
We gratefully acknowledge the contributions of all GBMHM members.
Supplementary Material
Footnotes
Supplemental digital content is available for this article.
References
- 1.Shanmuganathan N, Hughes TP. Molecular monitoring in CML: how deep? How often? How should it influence therapy? Hematology Am Soc Hematol Educ Program. 2018;2018:168–176. [DOI] [PMC free article] [PubMed] [Google Scholar]
- 2.Flandrin-Gresta P, Cornillet P, Hayette S, et al. Recommendations for accreditation of laboratories in molecular biology of hematologic malignancies. Ann Biol Clin (Paris). 2015;73:595–630. [DOI] [PubMed] [Google Scholar]
- 3.Hochhaus A, Baccarani M, Silver RT, et al. European LeukemiaNet 2020 recommendations for treating chronic myeloid leukemia. Leukemia. 2020;34:966–984. [DOI] [PMC free article] [PubMed] [Google Scholar]
- 4.Sujobert P, Dulucq S, Alary AS, et al. Accreditation strategy for rare somatic molecular abnormalities detected or quantified by polymerase chain reaction: GBMHM recommendations. Ann Biol Clin (Paris). 2019;77:681–684. [DOI] [PubMed] [Google Scholar]
- 5.Cross NC, White HE, Colomer D, et al. Laboratory recommendations for scoring deep molecular responses following treatment for chronic myeloid leukemia. Leukemia. 2015;29:999–1003. [DOI] [PMC free article] [PubMed] [Google Scholar]
- 6.Foroni L, Wilson G, Gerrard G, et al. Guidelines for the measurement of BCR-ABL1 transcripts in chronic myeloid leukaemia. Br J Haematol. 2011;153:179–190. [DOI] [PubMed] [Google Scholar]
- 7.Gabert J, Beillard E, van der Velden VH, et al. Standardization and quality control studies of ‘real-time’ quantitative reverse transcriptase polymerase chain reaction of fusion gene transcripts for residual disease detection in leukemia - a Europe Against Cancer program. Leukemia. 2003;17:2318–2357. [DOI] [PubMed] [Google Scholar]
- 8.Mahon FX, Réa D, Guilhot J, et al. Discontinuation of imatinib in patients with chronic myeloid leukaemia who have maintained complete molecular remission for at least 2 years: the prospective, multicentre Stop Imatinib (STIM) trial. Lancet Oncol. 2010;11:1029–1035. [DOI] [PubMed] [Google Scholar]
- 9.James C, Ugo V, Le Couédic JP, et al. A unique clonal JAK2 mutation leading to constitutive signalling causes polycythaemia vera. Nature. 2005;434:1144–1148. [DOI] [PubMed] [Google Scholar]
- 10.Bench AJ, White HE, Foroni L, et al. Molecular diagnosis of the myeloproliferative neoplasms: UK guidelines for the detection of JAK2 V617F and other relevant mutations. Br J Haematol. 2013;160:25–34. [DOI] [PubMed] [Google Scholar]
- 11.Jovanovic JV, Ivey A, Vannucchi AM, et al. Establishing optimal quantitative-polymerase chain reaction assays for routine diagnosis and tracking of minimal residual disease in JAK2-V617F-associated myeloproliferative neoplasms: a joint European LeukemiaNet/MPN&MPNr-EuroNet (COST action BM0902) study. Leukemia. 2013;27:2032–2039. [DOI] [PMC free article] [PubMed] [Google Scholar]
- 12.van Krieken JH, Langerak AW, Macintyre EA, et al. Improved reliability of lymphoma diagnostics via PCR-based clonality testing: report of the BIOMED-2 Concerted Action BHM4-CT98-3936. Leukemia. 2007;21:201–206. [DOI] [PubMed] [Google Scholar]
- 13.Langerak AW, Groenen PJ, Brüggemann M, et al. EuroClonality/BIOMED-2 guidelines for interpretation and reporting of Ig/TCR clonality testing in suspected lymphoproliferations. Leukemia. 2012;26:2159–2171. [DOI] [PMC free article] [PubMed] [Google Scholar]
- 14.Branford S, Fletcher L, Cross NC, et al. Desirable performance characteristics for BCR-ABL measurement on an international reporting scale to allow consistent interpretation of individual patient response and comparison of response rates between clinical trials. Blood. 2008;112:3330–3338. [DOI] [PubMed] [Google Scholar]
- 15.Jaiswal S. Clonal hematopoiesis and nonhematologic disorders. Blood. 2020;136:1606–1614. [DOI] [PMC free article] [PubMed] [Google Scholar]
- 16.Sidlow R, Lin AE, Gupta D, et al. The clinical challenge of clonal hematopoiesis, a newly recognized cardiovascular risk factor. JAMA Cardiol. 2020;5:958–961. [DOI] [PubMed] [Google Scholar]
- 17.Mansier O, Luque Paz D, Ianotto JC, et al. Clinical and biological characterization of MPN patients harboring two driver mutations, a French intergroup of myeloproliferative neoplasms (FIM) study. Am J Hematol. 2018;93:E84–E86. [DOI] [PubMed] [Google Scholar]
Associated Data
This section collects any data citations, data availability statements, or supplementary materials included in this article.


