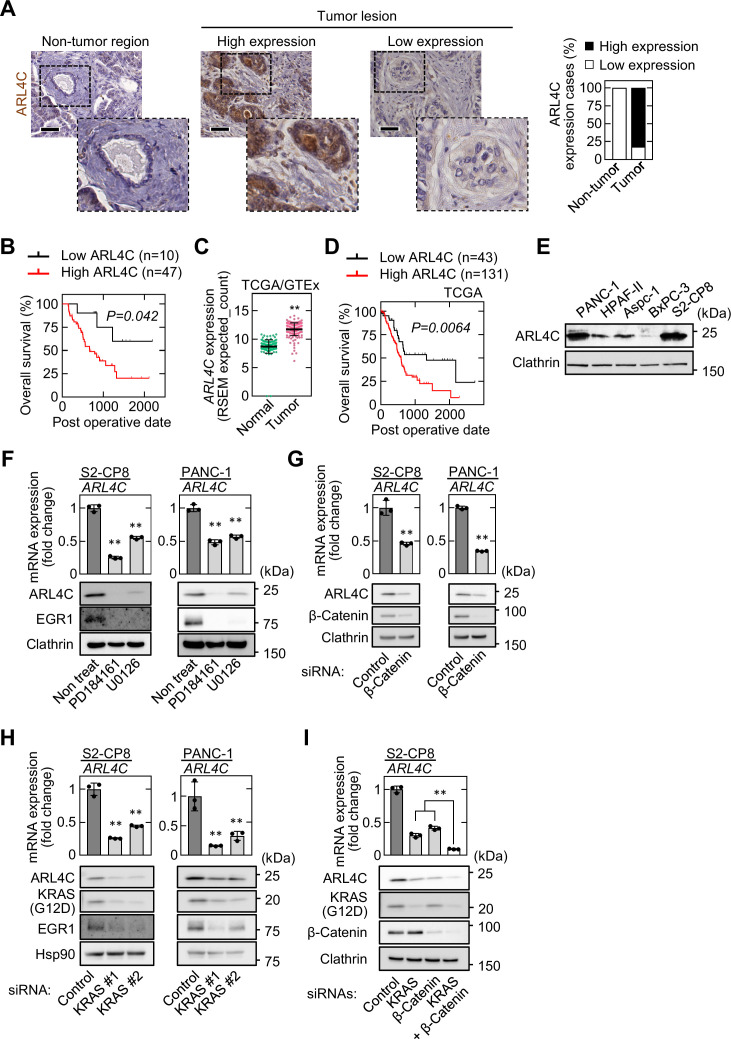
Figure 1. ARL4C is expressed in human pancreatic cancer.
(A) PDAC tissues (n = 57) were stained with anti-ARL4C antibody and hematoxylin. The percentages of ARL4C expression cases in the non-tumor regions and tumor lesions are shown. (B) The relationship between overall survival and ARL4C expression in patients with PDAC. (C) ARL4C mRNA levels in pancreatic adenocarcinoma and normal pancreatic tissues were analyzed using TCGA and GTEx datasets. The results shown are scatter plots with the mean ± s.e.m. p Values were calculated using a two-tailed Student’s t-test. (D) TCGA RNA sequencing and clinical outcome data for pancreatic cancer were analyzed. (E) Lysates of the indicated pancreatic cancer cells were probed with the indicated antibodies. (F) S2-CP8 and PANC-1 cells were treated with 10 μM PD184161 or 10 μM U0126, and ARL4C mRNA levels were measured by quantitative real-time PCR. Relative ARL4C mRNA levels were normalized to those of GAPDH and expressed as fold changes compared with the levels in control cells. Lysates were probed with the indicated antibodies. (G–I) S2-CP8 cells and PANC-1 cells were transfected with the indicated siRNAs, and ARL4C mRNA levels were measured by quantitative real-time PCR. Relative ARL4C mRNA levels were normalized to those of Β2Μ and expressed as fold changes compared with the levels in control cells. Lysates were probed with the indicated antibodies. EGR1 was used as an established transcription target gene of RAS signaling. (B,D) Data were analyzed using Kaplan–Meier survival curves, and a log-rank test was used for statistical analysis. (F–I) Data are shown as the mean ± s.d. of three biological replicates. p Values were calculated using a two-tailed Student’s t-test (G) or one-way ANOVA followed by Bonferroni post hoc test (F,H,I). Scale bars in (A) 50 μm. **, p < 0.01. See Figure 1—source data 1.


